Corrigendum: Temporal Characteristics of Debris Flow Surges
Corrigendum: Temporal Characteristics of Debris Flow Surges
 Jun Zhang
 Yong Li1*
 Taiqiang Yang
- 1Key Laboratory of Mountain Hazards and Earth Surface Processes, Institute of Mountain Hazards and Environment, Chinese Academy of Sciences, Chengdu, China
- 2University of Chinese Academy of Sciences, Beijing, China
- 3Center for Excellence in Tibetan Plateau Earth Sciences, Chinese Academy of Sciences, Beijing, China
- 4Sichuan Highway Planning, Survey, Design and Research Institute Ltd., Chengdu, China
- 5State Key Laboratory of Geohazards Prevention and Geoenvironment Protection, Chengdu University of Technology, Chengdu, China
Debris flow is one of the most destructive geomorphological events in mountainous watersheds, which usually appears in the form of successive surge waves as observed all over the world. In particular, debris flows in the Jiangjia Gully in southwest China have displayed a great variety of surge phenomena; each debris flow event contains tens or hundreds of separate surges originating from different sources. Therefore, the surge sequence of an event must encode the information of debris flow developing. The unmanned aerial vehicle photos provide an overview of debris flow sources, showing the different potentials of the debris flow and surge sequences present various patterns responding to the rainfall events. Then the variety of rainfalls and material sources determine the diversity of surge sequence. Using time series analysis to the surge discharge sequences, we calculate the Hurst exponent, the autocorrelation function, and the power spectrum exponent and find that all the sequences commonly share the property of long-term memory and these parameters are correlated in an exponential form, with values depending on rainfall patterns. Moreover, all events show a gross trend of discharge decay, despite the local rainfall process, which implies the intrinsic nature of the surge sequence as a systematic behavior of watershed. It is expected that these findings are heuristic for establishing mechanisms of debris flow initiation and evolution in a watershed.
Introduction
Debris flow occurs frequently in mountainous watersheds (Huerlimann et al., 2006; Deangeli et al., 2011). Three factors are key to the occurrence of a debris flow: steep topography, high-intensity rainfall, and abundant loose debris (Lin et al., 2002). Initially developed from randomly distributed tributaries (Li et al., 2004), debris flow is a full-valley process that finally converges into the downstream channel (Liu et al., 2008; Liu et al., 2009). It moves rapidly and strongly entrains material and water from the flow path (Iverson and Vallance, 1997; Hürlimann et al., 2003; Berti and Simoni, 2005; Godt et al., 2007; Cui, 2015; Hungr et al., 2014). Sometimes, debris flow may temporarily dam rill channels, creating new rills or plunge pools, and quickly change into hyper concentrated flow when mixed with additional water from overland flow (Godt et al., 2007). Heavy rainfall facilitates the running process of debris flows by increasing pore water pressure, seepage force, and reducing effective stress of soils (George et al., 2007). Loose debris includes loose mud, sand, soil, and rock (Jakob and Hungr, 2007). The local rainfall and the material sources together influence the occurrence and fluctuation of debris flows.
A conspicuous phenomenon is that debris flow emerges in the form of separate surge waves (Liu et al., 2008; Liu et al., 2009). A surge is wave-like locomotion of high-density liquid restricted to a certain volume and spatial shape (Liu et al., 2009). A typical surge has a steep front or “head” with the densest slurry, the highest concentration of boulders, and the greatest depth, and it is followed by a progressively more dilute and shallower “tail” (Hungr, 2000). Surges are found to originate from the varieties of tributaries and discontinuities in mass supplies (Wu and Kang, 1993; Li et al., 2004; Ni and Lu, 2005; Liu et al., 2008; Liu et al., 2009), and a debris flow event always contains tens or hundreds of surges. Therefore, a surge sequence must embody with information of debris flow forming and developing from tributaries to the mainstream. Surges come from different tributaries and undergoing different processes (Liu et al., 2009), and time intervals between different surges during one debris flow event varies from 1 to 103 s. Besides, the appearances of surges reflect their sources and originations.
Former research concerning debris flows includes systematic investigation of debris flow hazards and related phenomena (Lin et al., 2002; Huerlimann et al., 2006; Jakob and Hungr, 2007), debris flow susceptibility (Dong et al., 2010; Kappes et al., 2011), geological factors inducing debris flows (Chen and Su, 2001), the relationship between rainfall and debris flows (Guzzetti et al., 2008), etc. In this study, we research debris flows that occurred in the JJG as debris flows in this area are well known for their high frequency and variety of surge appearances, and a long-term continuous monitoring and field observation in this watershed have provided a huge dataset of surge parameters. Based on the data, this study attempts to find the temporal characteristics of surge sequence as a time series and their association with the forming conditions of rainfall and material sources. At first, we provide an overall view of JJG and its debris flow appearances; then we display the surge sequences in various patterns under different rainfall conditions; finally, we analyze the time series of the surge sequences to reveal their temporal features, which are believed to help understand the developing of debris flow in the valley scale.
Data and Methods
Description of the Study Area
The research area JJG, one of the main gully located in the Jiangjia Ravine watershed (between N26°13′ ∼ N26°17′, and E103°06′ ∼ E103°13′, 48.6 km2), is a tributary of the Jinsha River with the trunk channel length of 13.9 km and is situated 200 km northeast of Kunming, the capital of the Yunnan Province (Figure 1). The JJG is developed in the zone of the Xiaojiang fault, of which two-branched joins in the downstream reaches (Peng et al., 2005). With favorable climate (long-duration low-intensity precipitation in rainy seasons), topography (widespread steep-slope tributaries), and geographical factors (unconsolidated regolith), debris flows frequently occur here. The frequencies of debris flow in JJG can reach as many as 28 episodes in a single year (Peng et al., 2005). Debris flows here have characters of conspicuous fluctuation, viscous flow, and variety of appearances (Chen et al., 2005; Yong et al., 2012). In this research, we use data for 40 debris flow discharge series collected from the Dongchuan Observation and Research Station. The discharge of a surge is estimated by the product of the flow velocity between the fixed sections and the average section area (Kang et al., 2006). The temporal interval between successive surges ranges from tens to hundreds of seconds (Liu et al., 2009). The ID of each series denotes the date of the event, for instance, “070724” indicates the debris flow that occurred on July 24, 2007.
FIGURE 1
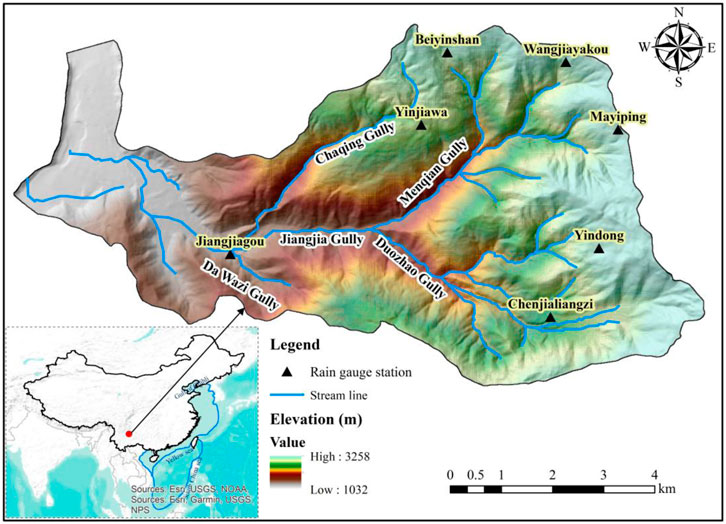
FIGURE 1. Digital elevation model and the distribution of rain gauges in Jiangjia Ravine.
Precipitation Data Collection
Local rainfall occurs mainly between May and October and average rainfall gauges between 400–1,000 mm (Xiao-junGuo, et al., 2013). There are nine rain gauges locate in JJG (Figure 1) with precision of 0.1 mm and temporal resolution of 1 min. As data being collected from different rainfall gauges show little variance, we use data from Mayiping for its continuous and complete character.
Debris Flow Data Collection
In this research, we use data for 40 debris flow discharge series collected from the Dongchuan Observation and Research Station, Chinese Academy of Sciences. Measuring quantities include the debris flow discharge (m³/s), the flow depth (m), the velocity (m/s), the flow density (m³/s), the time interval (s), etc. The discharge of a surge is estimated by the product of the flow velocity between the fixed sections and the average section area (Kang et al., 2006). The flow depth is directly read from the level mark inscribed on concrete pile at the section. The velocity is measured as an average value of the surge passing through two fixed cross sections (Li et al., 2015). The flow density is determined directly by weighing the fluid. The temporal interval between successive surges ranges from tens to hundreds of seconds (Liu et al., 2009). The ID of each series denotes the date of the event, for instance, “070724” indicates the debris flow that occurred on July 24, 2007.
Results and Discussion
Environmental Conditions and Debris Flows
As being mentioned in the introduction part, material sources, geography, and precipitation are all factors that influence the initiation and moving of debris flows.
Material Sources, Geography, and Debris Flows
Field surveys have indicated that debris flows in JJG originate almost from one of the major tributaries, the Menqian Gully; while the other tributary, Duozhao, has few occurrences. Through filed investigation, we found out that Menqian has 65 major tributaries (>0.1 km2) and Duozhao has 76 dendritic tributaries. As shown in Figure 2, the tributary structure and material sources are remarkably different in these two gullies. This controls the initiation and development of debris flow surges. Moreover, material sources differ much in the two gullies. Based on field surveys, it is estimated that material quantity from potential landslides and streambed sediment is about 5.2 × 10⁸ m3 in Menqian and 2.3 × 10⁸ m3 in Duozhao.
FIGURE 2
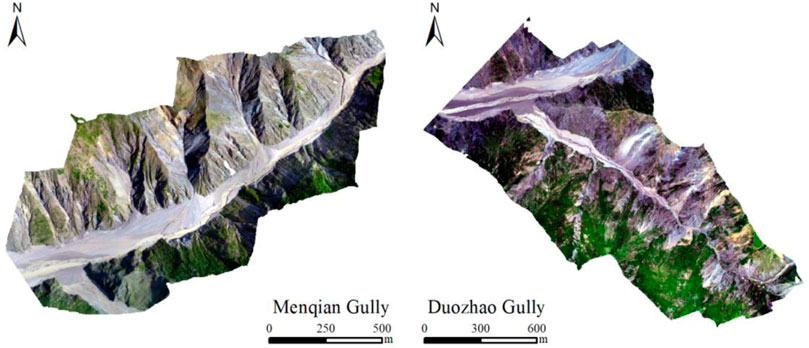
FIGURE 2. Aerial photos of the Menqian (left) and Duozhao (right) Gully.
The trigger mechanism of debris flow in JJG usually takes place in two stages: the primary slope failure in the source area, and the hydraulic movement which transfers the solid materials flowing into the brook track (Lee et al., 2008). A typical debris flow event includes three processes: initiation in the source area, transportation along tributaries and main gullies, and debris accumulation in the end. Figure 3 exhibits the three processes: the initiation (A), the transportation (B), and the accumulation (C) stage. The source area of each debris flow event has a scar appearance (Figure 3A) with peeling land surface and erosive gully. Then rainfall soaks down into the debris, adds weight, and triggers a flow (Takahashi, 2014). Debris flows move in the form of surges (Figure 3B) due to the varieties of tributaries and the discontinuities in mass supplies. For instance, a debris flow event occurred on July 7, 2017 (170707), which started at 3:50:52 in the morning and ended at about 8:00:00 in the evening, carrying 5.78 × 10⁴ m³ of the sediment. Throughout this event, there appears individual 38 surges with average time intervals being 65 s. Each debris flow event consists of tens or hundreds of surges separated in time. During the debris motion in the valley, the transportation (Figure 3B) and accumulation process (Figure 3C) of the debris flow are controlled by the high potential for grain crushing of deposits upstream and lower potential for the deposits downstream.
FIGURE 3
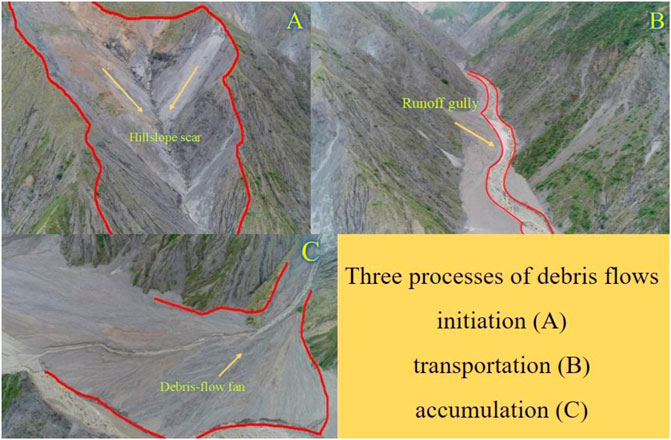
FIGURE 3. Three processes of debris flows.
Debris flows move down hillslopes (Figure 3C) across unobstructed fan surfaces in almost any direction and transport materials downslope, thereby forming a debris fan. Many flows are associated with deep beds of widely graded alluvial material, fed by tributary streams flowing in steep, rapidly eroding ravines. All these processes are controlled by the structure of the gully, and for this reason, the difference occurs between the tributary Menqian and Duozhao. Debris flow that occurred in the JJG almost came from Menqian instead of Duozhao and reasons can be summarized as follows: for material supplement, the Menqian Gully possesses about 60% of debris flow deposits; for topography, Menqian has a well-developed tree-shape water system constituting tributaries from lower to higher orders which contribute more to the occurrence of debris flows, while Duozhao has a braided drainage system with several channels of long steam length; for precipitation, data collected from rain gauges indicated that both frequency and amount of rainfall in Menqian is higher; from Figure 2 and also field investigation, vegetation coverage in Menqian is less.
Precipitation and Debris Flow
Debris flow depends on the precipitation over the watershed; specifically, a surge depends on local rainfall and the corresponding material sources. At present, we consider only the gross coincidence between the rainfall and debris flow event, due to the lack of detailed data of local rainfall and material sources. In general, hydrological conditions leading to debris flow initiation may vary substantially, depending primarily on the rainfall pattern. High-magnitude rainfall may lead to soil saturation, reduce effective stress, and consequential slope instability, and finally generate debris flows (Milne et al., 2009). Given the material conditions of JJG, the debris flow is mainly controlled by the pattern and intensity of rainfall (including rainfall intensity–duration relationship, cumulative event rainfall, and antecedent rainfall, see Xiao-junGuo, 2013), and rainfall intensity is the major factor being considered in this research. A debris flow event here appears in a sequence of surges within the duration of the rainfall event, with time intervals between surges about hundreds of seconds (Liu et al., 2009). Table 1 lists eight events and the responsible rainfalls, in which the triggering intensity is identified as the intensity of rainfall from the rainfall start to the time of debris flow occurring and Table 2 lists the elemental parameters of these events.
TABLE 1
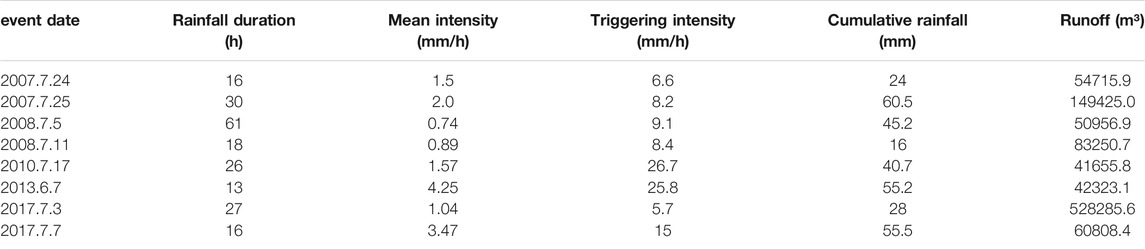
TABLE 1. Triggering rainfall events for the eight typical debris flows.
TABLE 2
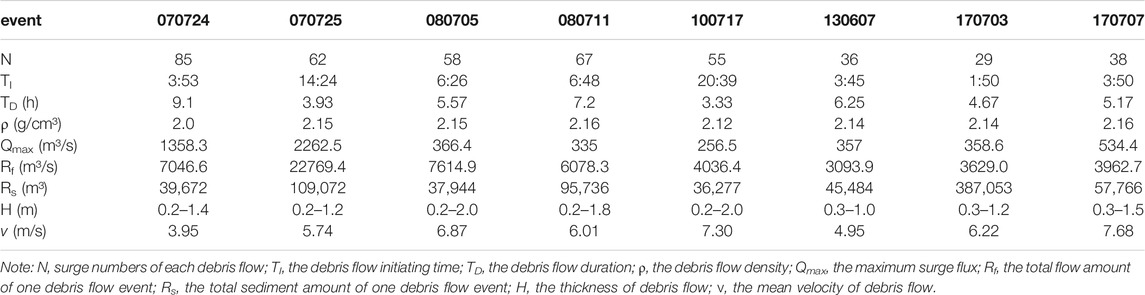
TABLE 2. Parameters for the eight debris flow events.
Statistical properties (e.g., the sum, mean, standard deviation, and maximum values) of the eight events are listed in Table 3, in which we also give the percentage of surge with discharge surplus 1/3 of the mean value. It is found that most events consist of “small” surges that have discharge below the 1/3 mean value; only two events, the 080705 and 170703 events, have more than half of surges that reach the 1/3 mean level. One finds no correlation between the overall rainfalls and the surge percentage of a certain discharge level, but the patterns of surge fluctuation exhibit some correlation to the rainfall patterns (Figure 4).
TABLE 3
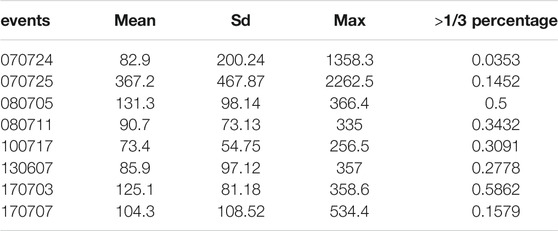
TABLE 3. Statistical values and >1/3 percentage of surge discharge series.
FIGURE 4
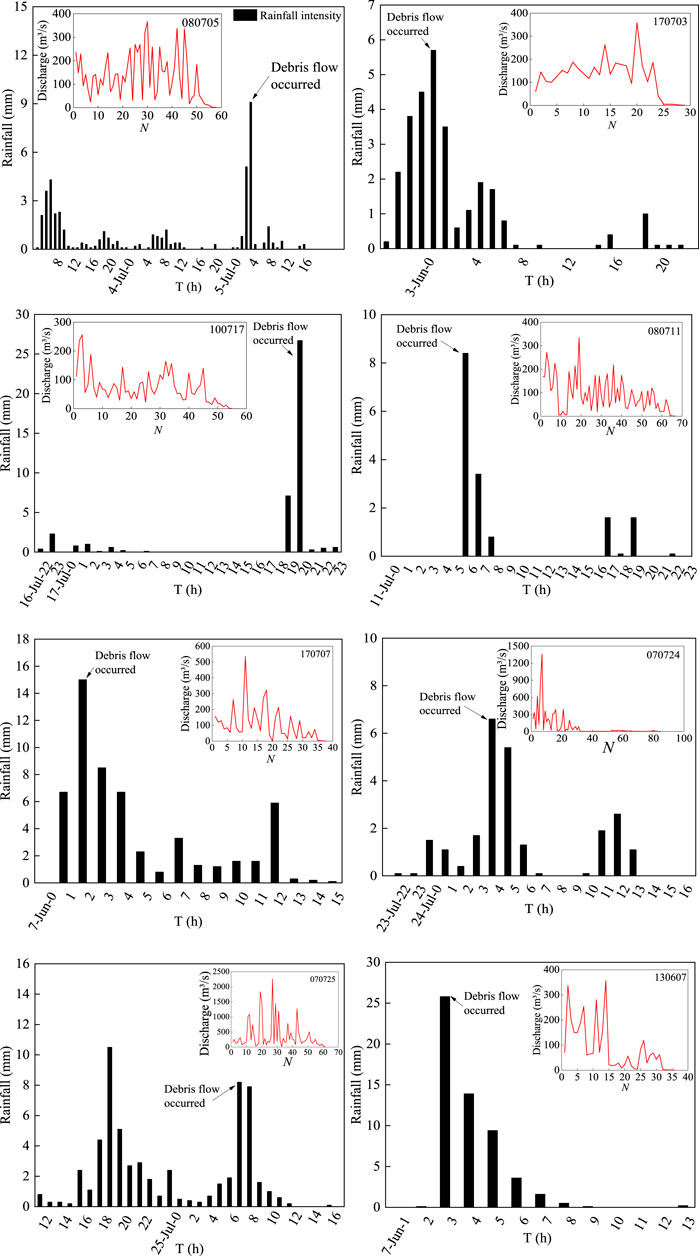
FIGURE 4. Debris flows and corresponding rainfalls.
Figure 4 displays the rainfall and the associated debris flow event (the surge discharge fluctuation). This provides a gross coincidence between rainfall and debris flow. For example, a total of 33.3 mm was recorded on July 24, 2007, and the debris flow occurred at the maximum rainfall. The following day also witnessed debris flow at 13 o’clock with the triggering rainfall intensity of 8.2 mm/h.
All eight events occurred at the maximum rainfall intensity. The 130607 event has the highest (26.7 mm/h), occurring in the initial stage (the 3rd hour), followed by gradual decreasing rainfall intensity persisting about 7 h. Correspondingly, the surge discharges are relatively high in the early part. Most events (070724, 070725, 080705, 080711, and 170703) have relatively low triggering intensity (<10 mm/h) and mean intensity (<2 mm/h), that is the low-intensity long-duration rainfall pattern. The debris flow discharge pattern is directly influenced by the rainfall pattern. The most obvious example is the 070725 event, which has a similar outline with corresponding rainfall intensity.
The other events (170707, 070724, and 070725) have disperse peaks and especially a super peak surge. The 130607 event has rather high discharges in the former part, whereas the latter half shows rather low debris flow volumes.
Patterns of Surge Sequences
Each debris flow event in JJG lasts for several or dozens of hours and contains tens or even hundreds of surges separated in time (Cui, 2005). An event is a sequence of surges in a variety of appearances, thus we treat debris flow discharge series as time series. Based on the data, various patterns are found in the surge series, as shown in Figure 5, including single peak (070724), several single peaks (040721, three single peak), multi-peak (910711), single multi-peak (990716), and peak groups (910813). These five series are selected for their typical pattern performance.
FIGURE 5
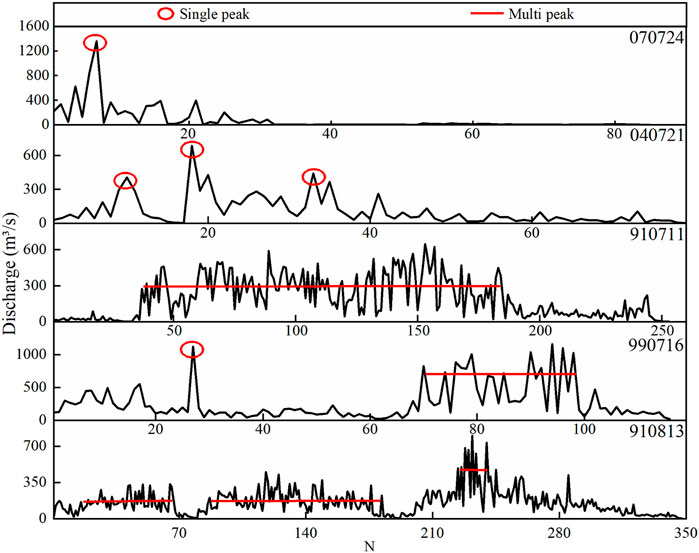
FIGURE 5. Patterns of debris flow discharge fluctuation.
Single (several single) peak series (070724 and 040721) always has little surges (N < 100) and represents precipitation because this event is characterized by short duration and low density. Multi-peak series (910711), especially several multi-peak series (910813), tend to have more surges (N > 200) that are induced by long duration and high-intensity rainfalls. The combination of single and multi-peak (990716) reflects more diverse rainfall information of this event, that is, during the former part (1–63 surges), overall rainfall intensity is rather low with just one moment bearing high intensity, while in the latter part (63–116), rainfall intensity stays at a rather high level.
Each debris flow event that occurs in the natural environment corresponds to one of these five types, and different types reflect different rainfall patterns. More examples of debris flow surge patterns can be seen in Figure 6.
FIGURE 6
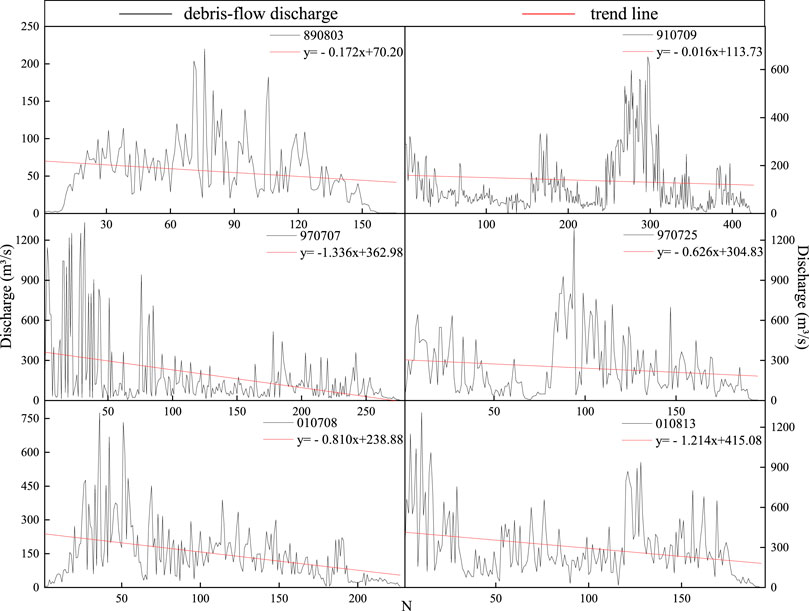
FIGURE 6. More examples of debris flow surge patterns.
Systematic Analysis of Debris Flow Events
To explore the temporal character of the surge series, especially the long-term memory and persistence nature of debris flows, we employ three time series analyzing methods: the Hurst exponent, the autocorrelation function (ACF), and the power spectrum analysis. The Hurst (1951) exponent, which is extensively used in hydrological and geophysical time series analysis, is employed to explore the long-range dependence of debris flow series. This parameter was calculated by the R/S analysis and has been used to investigate hydrological records of streamflow, precipitation (Miranda and Andrade, 1999), sea level (Beretta et al., 2005), paleo records of temperature (Rangarajan and Sant, 1997), etc. The ACF is a widely used theoretically and empirically robust statistical tool in geostatistics and ecology (Tobin, 2004). The power spectrum analysis is often seen in different kinds of time series, such as series of soil moisture (Zhang et al., 2021), earth’s gravity (Telesca et al., 2015), sonic velocity (Li, 2003), landslide, earthquake, and slope stability (Pelletier, 1997).
The Hurst Exponent
In this part, the Hurst exponent (H), first proposed by the British hydrologist Hurst (1956), was applied to analyze the long-term memory of debris flow discharge series. Detailed descriptions of the R/S analysis are as follows (Li et al., 2009):
Given a time series {
where
The value of Hurst exponent H ranges from 0 to 1 (Rangarajan and Sant, 1997). When H > 0.5, the series has persistence or long-term memory, meaning the same trend in the series, with a greater value for more persistence; when H = 0.5, the series is random without persistence; and when H < 0.5, the series has anti-persistence or short term memory, and small H means high anti-persistence sustainability (Yin et al., 2009). The R(t)/S(t) curves for the above-selected events are displayed in Figure 7 (the eight events being selected and displayed in the figure is that the Hurst exponent values of them rank the former eighth), showing a straight line in log–log plot with a slope higher than 45°. This means that the existence of Hurst exponent and H > 0.5. Similarly, we calculate H values for other sequences and all prove to be higher than 0.5, meaning the persistence of the sequences (see Table 4).
FIGURE 7

FIGURE 7. Hurst effect for the discharge series of the eight selected events.
TABLE 4
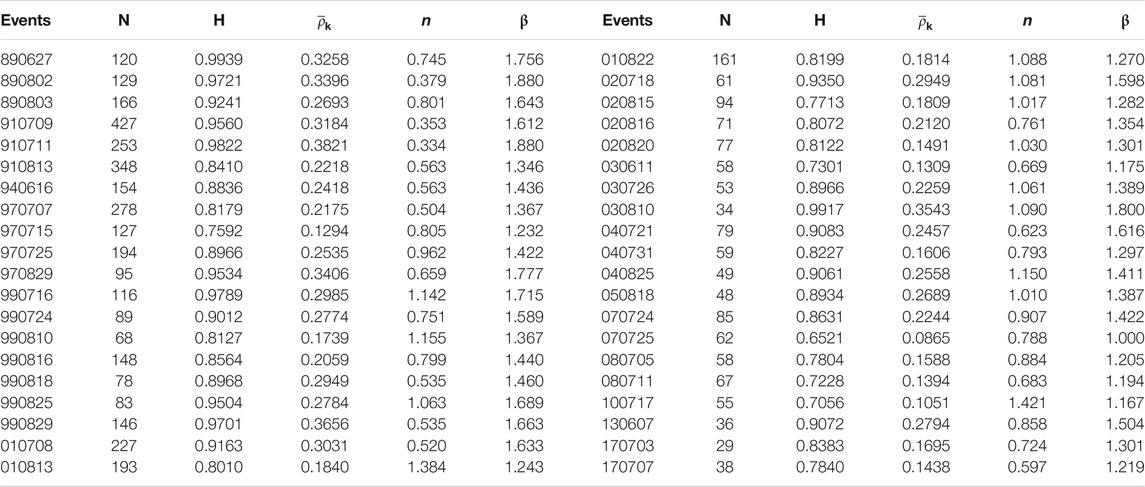
TABLE 4. Hurst exponent values of different debris flow discharge series.
The Autocorrelation Function
The ACF also measures the persistence and anti-persistence nature of time series which is defined as (Akritas et al., 2014):
where
Three examples of ACF are displayed in Figure 8. It is found that all the ACF decays with surge progress in a power-law form, ρk ∼ k-n (with exponent n listed in Table 4). This means that the correlated range between surges in each event decreases rapidly, meaning that the memory is relatively short, ranging only within the first several or tens of surges.
FIGURE 8
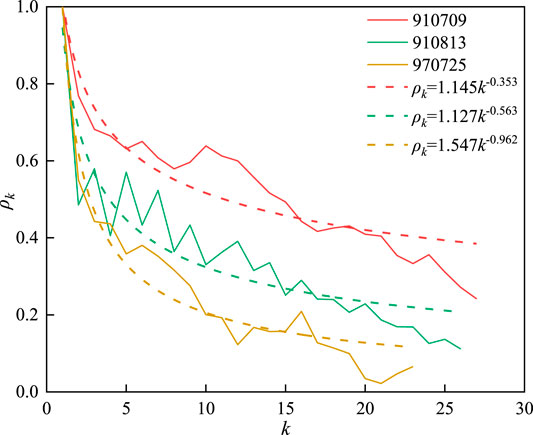
FIGURE 8. ACF for the three debris flow discharge series.
The Power Spectrum
The power spectrum is another measure for the persistence and memory of time series. The power spectral density function (Jun, et al., 2021) is as follows:
Here, the power spectrum S is the square of the Fourier coefficients at each wavenumber of a Fourier series (Malamud and Turcotte, 1999), and as for debris flow series, it represents the contribution of discharge along with different surges range (or fluctuation frequency). When
FIGURE 9
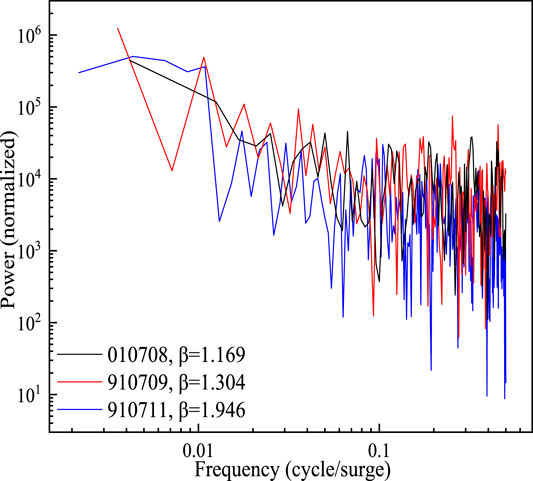
FIGURE 9. The power spectrum of the three selected debris flow discharge series.
As β > 1.0, it means these events bear long-term memory and strong persistence character, in agreement with results that we got from the Hurst and ACF analysis.
The Correlation Between the Sequence Parameters
As the three parameters being mentioned above reflect the same nature of debris flows, in this part, we explore relationship of this three. We calculated the Hurst (H) values, the mean values of
From the first sight of Table 4, both the mean ACF and β parameters have a close positive correlation with the Hurst exponent. All Hurst exponents and β values higher than 0.5 and 1.0, respectively, reflect the same long-term memory characteristic of debris flows. The n values (range between 0.334 and 1.421), however, have no obvious relationship with the Hurst exponent. Following, we quantify the relationship between
FIGURE 10
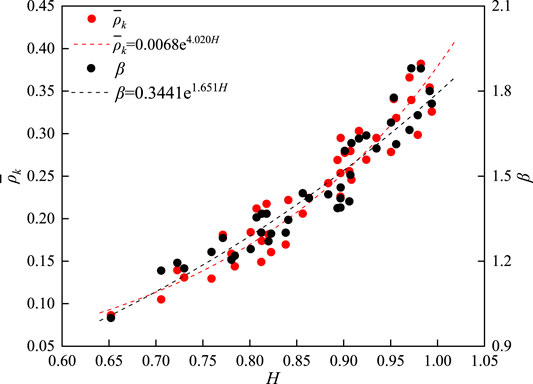
FIGURE 10. The correlation curves for
As can be seen from the figure above, both
Trend Analysis of the Surge Series
We cite the Mann–Kendall trend test for tendency analysis of flow series. When Z > 0, the series displays an upward tendency, while Z < 0 indicates a downward tendency. For this test, if p > 0.01, we accept the null hypothesis, that is the series has no obvious tendency; if p < 0.01, we reject the null hypothesis, the trend is obvious. Meanwhile, the ADF (Augmented Dickey–Fuller Test, P) method is used to evaluate the stationary character of the debris flow series. The result of this method is P, and if P< 0.05, this series is treated to be a stationary one; if P > 0.05, reflects a nonstationary character of the series. Results of these two methods for the 40 debris flow series are summarized in Table 5. There exists eight events in 40 debris flow series that have stationary character; in other words, most surge events are nonstationary. All debris flow series bear a downward tendency, among which 27 have an obvious trend.
TABLE 5
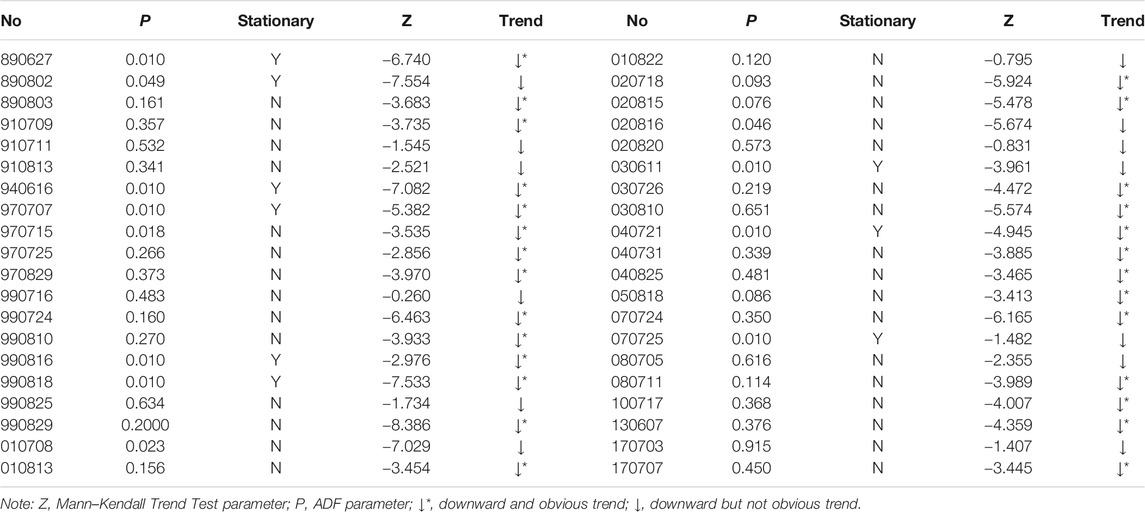
TABLE 5. M-K trend parameters for the surge discharge sequences.
The decaying or downward trend of debris flow discharge is more clearly illustrated by the moving average
It is found that
FIGURE 11
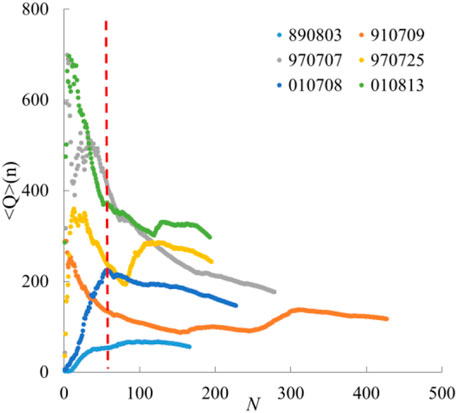
FIGURE 11. Average discharge decaying with surge progress.
Despite various surge peak types these events have, all series have a downward tendency, which is in accordance with results from Liu et al. (2009). That is to say, with time passing by, the inner energy that debris flows possess drops gradually. In particular, comparing with the corresponding rainfalls, one finds that the decaying tendency does not rely upon the pattern or quantity of rainfall. This means that the decaying is an intrinsic property of the surge sequence, which depends on the mass supplies in the watershed but not on the triggering rainfalls.
Conclusion
Surge waves are found to be ubiquitous of debris flow all over the world; their occurrences depend on the local conditions of material sources and rainfalls. In particular, field surveys and observations in JJG indicate that the surges within a debris flow event actually originate from different sources governed by local conditions of rainfall and morphology. As each debris flow event consists of tens or hundreds of surges, it must cover a wide range of mechanisms and patterns of flow initiation and development, and the underlying mechanism is encoded in the properties of the surge sequence of the event. We have investigated the temporal characteristics of the surge sequences in JJG and come to the following conclusions:
1. Debris flows are of high variability in a watershed, depending on conditions of rainfall and material source distribution, which result in successive surges of various flow regimes and properties, presenting different fluctuation patterns of surge sequence.
2. Surge sequences of different debris flow events present similar properties of time series. The Hurst exponent, the ACF, and the power spectrum analysis prove that all the events bear long-term memory, implying the successive surges are not independent but correlated to some extent. Moreover, these three parameters are found to be interrelated in the form of the exponential function, with values depending on the respective rainfalls.
3. The sequences of surge discharge series appear as a gross trend of decay with the progress, despite patterns of surge sequences and rainfall processes. This implies the whole process of a debris flow is not completely dependent on the triggering rainfall but mainly on the intrinsic nature of material supplies controlled by the watershed.
These findings are important for understanding the forming and developing of debris flow in the watershed. In previous studies, a watershed is usually assumed to have certain debris flow occurrence in response to the triggering rainfall without considering the phenomena of separate surges and the fluctuation of surge sequence. This research suggests that a complete theory of debris flow should establish mechanisms and provide an explanatory framework for the intermittency and variability of surges, which will be heuristic in prompting the studies in evaluation and engineering prevention of debris flow.
Data Availability Statement
The raw data supporting the conclusions of this article will be made available by the authors, without undue reservation.
Author Contributions
JZ produced the figures and wrote the manuscript. YL was responsible for the main idea of the manuscript and contributed to the manuscript revision. XG, BY, TY, and DL provided input to figure and text editing. All the authors contributed to the article and approved the submitted version.
Funding
This study is supported by the Strategic Priority Research Program of the CAS (XDA23090202) and the National Natural Science Foundation of China (41790432, 41977257, and 41877261).
Conflict of Interest
DL was employed by the Sichuan Highway Planning, Survey, Design and Research Institute Ltd.
The remaining authors declare that the research was conducted in the absence of any commercial or financial relationships that could be construed as a potential conflict of interest.
References
Akritas, M. G., Lahiri, S. N., and Politis, D. N. (2014). Topics in Nonparametric Statistics. New York: Springer.
Beretta, A., Roman, H. E., Raicich, F., and Crisciani, F. (2005). Long-time Correlations of Sea-Level and Local Atmospheric Pressure Fluctuations at Trieste. Physica A: Stat. Mech. its Appl. 347, 695–703. doi:10.1016/j.physa.2004.08.027
Berti, M., and Simoni, A. (2005). Experimental Evidences and Numerical Modelling of Debris Flow Initiated by Channel Runoff. Landslides 2 (3), 171–182. doi:10.1007/s10346-005-0062-4
Chen, H., and Su, D-Y. (2001). Geological Factors for Hazardous Debris Flows in Hoser, Central Taiwan. Environ. Geology 40 (9), 1114–1124. doi:10.1007/s002540100312
Chen, J., He, Y. P., and Wei, F. Q. (2005). Debris Flow Erosion and Deposition in Jiangjia Gully, Yunnan, china. Environ. Geol. 48 (6), 771–777. doi:10.1007/s00254-005-0017-z
Cui, P. (2005). Debris-Flow Hazards and Related Phenomena || Jiangjia Ravine Debris Flows in South-Western China. springer praxis books, 1007/b138657, 565–594. doi:10.1007/3-540-27129-5_22
Deangeli, C., Gregoretti, C., Paltrinieri, E., Rabuffetti, D., and Tiranti, D. (2011). An Integrated Approach to Simulate Channelized Debris Flows From Triggering to Deposition. Italian J. Eng. Geology Environ., 661–668. 10.4408/IJEGE.2011-03.B-072
Dong, J.-J., Lee, C.-T., Tung, Y.-H., Liu, C.-N., and Lee, J.-F. (2010). The Role of the Sediment Budget in Understanding Debris Flow Susceptibility. Earth Surf. Process. Landforms 34 (12), 1612–1624. doi:10.1002/esp.1850
George, L., Long, C., and David, W. (2007). Vulnerability Assessment of Rainfall-Induced Debris Flows in Taiwan. Nat. Hazards 43 (2), 223–244. doi:10.1007/s11069-006-9105-y
Godt, J. W., and Coe, J. A. (2007). Alpine Debris Flows Triggered by a 28 July 1999 Thunderstorm in the Central Front Range, Colorado. Geomorphology 84 (1–2), 80–97. doi:10.1016/j.geomorph.2006.07.009
Guzzetti, F., Peruccacci, S., Rossi, M., and Stark, C. P. (2008). The Rainfall Intensity–Duration Control of Shallow Landslides and Debris Flows: an Update. Landslides 5 (1), 3–17. doi:10.1016/j.geomorph.2006.07.009
Huerlimann, M., Copons, R., and Altimir, J. (2006). Detailed Debris Flow Hazard Assessment in Andorra: a Multidisciplinary Approach. Geomorphology 78 (3–4), 359–372. doi:10.1016/j.geomorph.2006.02.003
Hungr, O., Leroueil, S., and Picarelli, L. (2014). The Varnes Classification of Landslide Types, an Update. Landslides 11 (2), 167–194. doi:10.1007/s10346-013-0436-y
Hungr, O. (2000). Analysis of Debris Flow Surges Using the Theory of Uniformly Progressive Flow. Earth Surf. Process. Landforms 25 (5), 483–495. doi:10.1002/(sici)1096-9837(200005)25:5<483::aid-esp76>3.0.co;2-z
Hürlimann, M., Rickenmann, D., and Graf, C. (2003). Field and Monitoring Data of Debris-Flow Events in the Swiss Alps. Can. Geotech. J. 40 (1), 161–175. doi:10.1139/t02-087
Hurst, H. E. (1951). Long-term Storage Capacity of Reservoirs. T. Am. Soc. Civ. Eng. 116, 770–799. doi:10.1061/taceat.0006518
Hurst, H. E. (1956). Methods of Using Long-Term Storage in Reservoirs. Proc. Inst. Civil Eng. 5, 519–543. doi:10.1680/iicep.1956.11503
Iverson, R. M., and Vallance, J. W. (2001). New Views of Granular Mass Flows. Geol. 29 (2), 115–118. doi:10.1130/0091-7613(2001)029<0115:nvogmf>2.0.co;2
Jakob, M., and Hungr, O. (2007). Debris-flow Hazards and Related Phenomena. Berlin, Germany: Springer Praxis Books, 42.
Kang, Z. C., Cui, P., Wei, F. Q., and He, S. F. (2006). Observation Data of Debris Flows inJiangjia Gully. Yunnan, Beijing: Science Press. (in Chinese).
Kappes, M. S., Malet, J.-P., Rematre, A., Horton, P., Jaboyedoff, M., and Bell, R. (2011). Assessment of Debris-Flow Susceptibility at Medium-Scale in the Barcelonnette Basin, France. Nat. hazards earth Syst. Sci. 11 (2). doi:10.5194/nhess-11-627-2011
Lee, C-C., Ku, C-C., Hsu, S-M., Chang, Y-L., and Chi, S-Y. (2008). A Case Study on the Occurrence of Regional Debris Flow Hazard in Central Taiwan. Wit Trans. Eng. Sci. 60 (-), 135–144 .doi:10.2495/DEB080141
Li, C-F. (2003). Rescaled-Range and Power Spectrum Analyses on Well-Logging Data. Geophys. J. Int. 153 (1), 201–212. doi:10.1046/j.1365-246x.2003.01893.x
Li, Y., Hu, K. H., Yue, Q. Z. Q., and Tham, L. G. (2004). Surge Termination and Deposition of Debris-Flow. J. Am. Chem. Soc. 97 (24), 1602–1606. doi:10.1201/b16816-207
Li, Y., Liu, J., and Su, F. (2009). Integrity of Debris-Flow Surge Sequence. Earth Sci. Front. 16 (4), 381–388.(in Chinese)
Li, Y., Liu, J., Su, F., Xie, J., and Wang, B. (2015). Relationship between Grain Composition and Debris Flow Characteristics: a Case Study of the Jiangjia Gully in China. Landslides 12 (1), 19–28. doi:10.1007/s10346-014-0475-z
Lin, P-S., Lin, J-Y., Hung, H-C., and Yang., M-D. (2002). Assessing Debris-Flow Hazard in a Watershed in Taiwan. Eng. Geology 66 (3–4), 295–313. doi:10.1016/S0013-7952(02)00105-9
Liu, J. J., Li, Y., Su, P. C., and Cheng, Z. L. (2008). Magnitude–frequency Relations in Debris Flow. Environ. Geology 55 (6), 1345–1354. doi:10.1016/s0013-7952(02)00105-9
Liu, J., Li, Y., Su, P., Cheng, Z., and Cui, P. (2009). Temporal Variation of Intermittent Surges of Debris Flow. J. Hydrol. 365 (3–4), 322–328. doi:10.1016/j.jhydrol.2008.12.005
Malamud, B. D., and Turcotte, D. L. (1999). Self-Affine Time Series: I. Generation and Analyses. Adv. Geophys. 40, 1–90. doi:10.1016/s0065-2687(08)60293-9
Milne, F. D., Werritty, A., Davies, M. C. R., and Brown, M. J. (2009). A Recent Debris Flow Event and Implications for Hazard Management. Q. J. Eng. Geology. Hydrogeology 42 (1), 51–60. doi:10.1144/1470-9236/07-073
Miranda, J. G. V., and Andrade, R. F. S. (1999). Rescaled Range Analysis of Pluviometric Records in Northeast Brazil. Theor. Appl. Climatology 63 (1–2), 79–88. doi:10.1007/s007040050094
Ni, H. Y., and Lu, X. J. (2005). Debris-Flow Surges and Their Movement. Res. Water Soil Conservancy 12 (6), 242–244.(in Chinese)
Parada, L. M., and Xu, L. (2003). A Stochastic Modeling Approach for Characterizing the Spatial Structure of L Band Radiobrightness Temperature Imagery. J. Geophys. Res. Atmosp. 108 (D22), 8862. doi:10.1029/2003jd003567
Pelletier, J. D., Malamud, B. D., Blodgett, T., and Turcotte, D. L. (1997). Scale-Invariance of Soil Moisture Variability and its Implications for the Frequency-Size Distribution of Landslides. Eng. Geology 48 (3–4), 255–268. doi:10.1016/s0013-7952(97)00041-0
Peng, C., Chen, X., Waqng, Y., Hu, K., and Yong, L. (2005). Jiangjia Ravine Debris Flows in South-Western China. Berlin, Germany: Springer Praxis Books.
Rangarajan, G., and Sant, D. A. (1997). A Climate Predictability Index and its Applications. The Theory of Group Representations. Baroda, Vadodara, India: Department of Mathematics, University of Chicago.
Telesca, L., Lovallo, M., Mammadov, S., Kadirov, F., and Babayev, G. (2015). Power Spectrum Analysis and Multifractal Detrended Fluctuation Analysis of Earth’s Gravity Time Series. Physica A: Stat. Mech. Its Appl. 428, 426–434. doi:10.1016/j.physa.2015.02.034
Tobin, P. C. (2004). Estimation of the Spatial Autocorrelation Function: Consequences of Sampling Dynamic Populations in Space and Time. Ecography 27 (6), 767–775. doi:10.1111/j.0906-7590.2004.03977.x
Wu, J. S., and Kang, Z. C. (1993). Observation Researches on Debris Flows in Jiangjia Gully Yunnan. Beijing: Science Press, 235.(in Chinese)
Guo, X.-J., Peng, C., and Yong, L. (2013). Debris Flow Warning Threshold Based on Antecedent Rainfall: a Case Study in Jiangjia Ravine, Yunnan, China. J. Mountain Sci..10, 305–314. 10.1007/s11629-013-2521-z
Yin, X-A., Yang, X-H., and Yang, Z-F. (2009). Using the R/s Method to Determine the Periodicity of Time Series. Chaos Solitons Fractals 39 (2), 731–745. doi:10.1016/j.chaos.2007.01.085
Yong, L., Jingjing, L., Kaiheng, H., and Pengcheng, S. (2012). Probability Distribution of Measured Debris-Flow Velocity in Jiangjia Gully, Yunnan Province, China. Nat. Hazards 60 (2), 689–701. doi:10.1007/s11069-011-0033-0
Keywords: stationary, persistence, long-term memory, Hurst exponent, debris flow
Citation: Zhang J, Li Y, Guo X, Yang T, Liu D and Yu B (2021) Temporal Characteristics of Debris Flow Surges. Front. Earth Sci. 9:660655. doi: 10.3389/feart.2021.660655
Received: 08 February 2021; Accepted: 25 March 2021;
Published: 17 May 2021.
Edited by:
Jia-wen Zhou, Sichuan University, ChinaReviewed by:
Liang Gao, University of Macau, ChinaChao Kang, University of Northern British Columbia Canada, Canada
Shengwu Qin, Jilin University, China
Copyright © 2021 Zhang, Li, Guo, Yang, Liu and Yu. This is an open-access article distributed under the terms of the Creative Commons Attribution License (CC BY). The use, distribution or reproduction in other forums is permitted, provided the original author(s) and the copyright owner(s) are credited and that the original publication in this journal is cited, in accordance with accepted academic practice. No use, distribution or reproduction is permitted which does not comply with these terms.
*Correspondence: Yong Li, ylie@imde.ac.cn; Bin Yu, yubin08@cdut.cn