 Suping Zheng
- Fujian Jiangxia University, Fuzhou, China
In order to investigate the mechanism of water-rich and fully weathered granite on the water bursting and mud bursting, the single-factor variable method is adopted in this study. The particle size gradation, initial porosity, water pressure, confining pressure, and anti-outburst thickness are chosen to determine each factor on the evolution of sand gushing, porosity, permeability, fine particle concentration, and water gushing velocity. Results indicate that a particle loss is the most critical reason for the water bursting and mud bursting of water-rich and fully weathered granite. The transition of water bursting from the linear to the nonlinear stage is the most significant feature. Soil particles with a larger Talbol power index are more likely to lead to water bursting. In addition, there is a critical water pressure to control the occurrence of water bursting and mud bursting. It is found that when the confining pressure reached the soil yield strength, the evolution of water bursting and mud bursting is independent of the increase in confining pressure. The increase in anti-outburst thickness can also effectively limit the risk of water bursting and mud bursting.
Introduction
Generally, the water-rich and fully weathered granite has poor engineering characteristics such as low strength, poor water stability, and strong disintegration. The rock particles are easily disintegrated into a flow plastic shape and migrated especially at construction disturbance, and the water bursting and mud bursting are becoming more and more serious since they easily take place under a tunnel construction (Zhao et al., 2013; Wu et al., 2017; Liu et al., 2018; Song et al., 2018). It is of great importance to evaluate the evolution mechanism of water bursting and mud bursting disasters.
So far, the research studies about the mechanism of water bursting and mud bursting have been focused on the water bursting owing to the high-pressure fracture in rock masses (Li et al., 2017; Meng et al., 2020), karst water bursting (Li et al., 2017; Huang et al., 2019; Zhu and Li, 2020), and activated water bursting in fault zones (Guo et al., 2020; Peng et al., 2020; Yang et al., 2020). However, very few research studies in the past years paid their attention on the mechanism of water bursting and mud bursting (Liu et al., 2020), especially the variable mass characteristics about the evolution of water bursting and mud bursting in fully weathered granite were not involved. On the contrary, the linear Darcy seepage or modified Darcy seepage equations (Wang and Park, 2003; Yang et al., 2007; Wang et al., 2020; Wu et al., 2021) are frequently adopted when research studies are faced with those problems; nevertheless, it is not effective enough to describe the nonlinear seepage and sudden changing characteristics of water bursting and mud bursting.
Actually, factors that affect the water bursting and mud bursting include water pressure (Liu et al., 2010; Geng and Saleh, 2015; Zhang et al., 2021), particle size gradation, stratum compaction (or initial porosity), stress condition (that is the confining pressure condition) (Ma et al., 2013; Wang et al., 2014; Wu et al., 2018), and anti-outburst thickness (Liu et al., 2018; Liu et al., 2018; Liu et al., 2019; Liu et al., 2020). In this study, a self-designed large triaxial test device for dynamic water grouting is used to uncover the evolution mechanism of water bursting and mud bursting. Specifically, the developed device implements the functions of particle migration and variable mass migration, and the complex stress environments such as confining pressure, water pressure, and axial pressure can be freely set. In addition, different engineering boundary conditions are also realized in this device. Therefore, modeling tests are conducted in this study, and the particle size gradation, stratum initial porosity, water pressure, confining pressure, and anti-outburst thickness are evaluated to reveal the evolution of water bursting and mud bursting, and the critical condition that the disaster occurs.
Indoor Modeling Test System
In order to simulate the water bursting and mud bursting of soil at a certain water pressure and Earth pressure, as shown in Figure 1, a large triaxial test system for dynamic water grouting was designed. The confining pressure, axial pressure, and water pressure are adjusted by the pressure pump, and the designed formation pressure and water bursting pressure are steadily obtained.
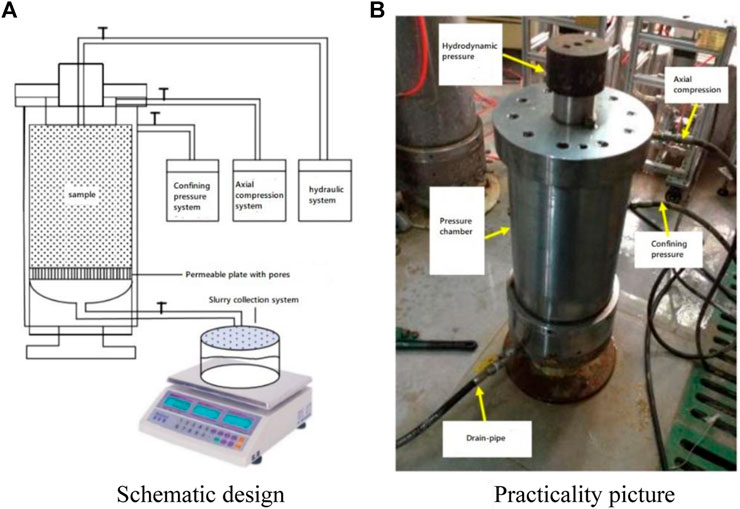
FIGURE 1. Large triaxial testing system: (A) schematic design and (B) practicality picture.
In this article, the factors (i.e., particle size ratio, initial porosity, water pressure, confining pressure, and sample height) are analyzed to determine the influence of factors on the mass loss, permeability, fine particle concentration, water gushing velocity, and porosity. Finally, the impacts of factors on the evolution of water bursting and mud bursting are comprehensively revealed.
Calculation of Test Parameters
Calculation of Sand Gushing
It is important to collect the lost particles at regular time intervals and weigh the dry mass
Calculation of Porosity
The initial porosity of the sample is
where
Calculation of Permeability
Since sample penetration leads to the particle migration, the porosity and permeability increase accordingly. When the permeability increases to a certain extent, the liquid flow state is inevitably changed; then the flow regime is determined by the Reynolds number:
where
According to the Nicholas curve (Erhard et al., 2010), when Re ≤ 10, the flow pattern is determined as a laminar flow or a transitional flow dominated by a laminar flow, in which the penetration process yields the Darcy’s law. When ignoring the effect of gravity, the seepage in the sample can be approximately seen as one-dimensional seepage. Therefore, assuming the pressure gradient uniformly distributed,
where
However, when Re > 10, the flow pattern represents a turbulent phase. Correspondingly, the permeation process should be calculated according to the non-Darcy process. Actually, the Forchheimer-type non-Darcy equation can be adopted, namely,
where
where
Calculation of Fine Particle Concentration
Generally, the concentration of fine particles means the particle content in the liquid, which is determined as
where
Experimental Design
Sample Preparation
The fully weathered granites from an engineering site are used in this study. Considering the changes of particle gradation in actual stratum generally caused by excavation disturbance, groundwater flow, and water bursting and mud bursting, the Talbol grading formula is used to design the gradation range of the sample, which is expressed as follows:
where
Figure 2A shows the particle size distribution (determined by the sieve method and specific gravity method) of soil from an engineering site; the contents of different particle ranges are adjusted based on Figure 2A so that the impact of particle size gradation is evaluated in this study. First, soil particles are screened to different particle size ranges, and then samples are prepared according to the designated Talbol power index. Five groups’ particle size, 0.00–0.25 mm, 0.25–2.00 mm, 2.00–3.00 mm, 3.00–5.00 mm, and 5.00–10.00 mm are proportioned according to the Talbol formula. The gradation curves of different Talbol power exponents are given in Figure 2B.
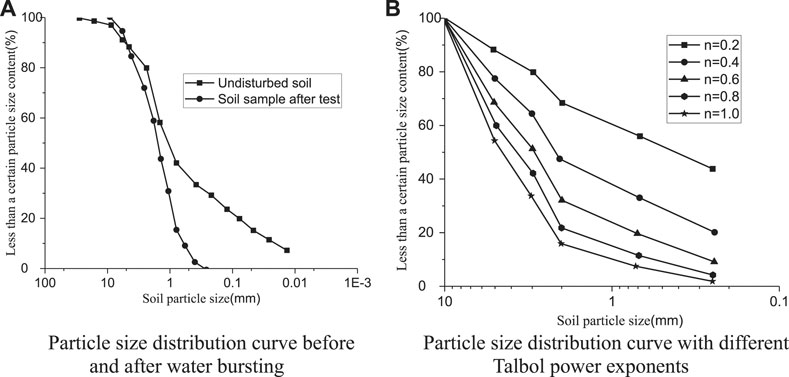
FIGURE 2. Particle size distribution curve: (A) particle size distribution curve before and after water bursting and (B) particle size distribution curve with different Talbol power exponents.
Test Plan
In order to obtain the time-varying laws of mass loss, water gushing velocity, and porosity of the fully weathered granite at a long-term high water pressure, and analyze the evolution characteristics of mass loss owing to the changes in particle size ratio, initial porosity, initial stress state, water pressure, and anti-outburst thickness (sample height), the test plan is shown in Table 1. In addition to the variable that needs to change, test conditions are set with axial pressure of 2 MPa, initial porosity maintains 0.3, water pressure maintains 0.6 MPa, Talbol power index n = 0.4, and the height of the sample maintains 25 cm.
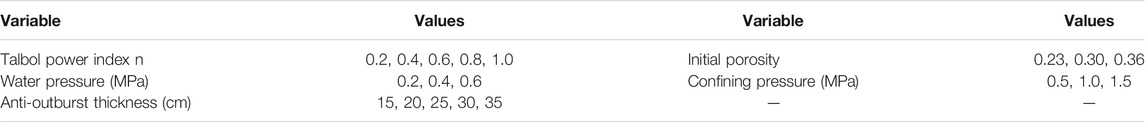
TABLE 1. Variable value.
Test Procedure
Figure 3 shows the test procedure that a sample is loaded in layers and saturated at first. The confining pressure, axial pressure, and water pressure are added according to the Test Plan; when the test is conducted, the muddy water gushing volume at the exit is collected every 30 s until the water quality got clear and the water volume became stable, and then the experiment can be stopped if no sediment particles were flowing out.
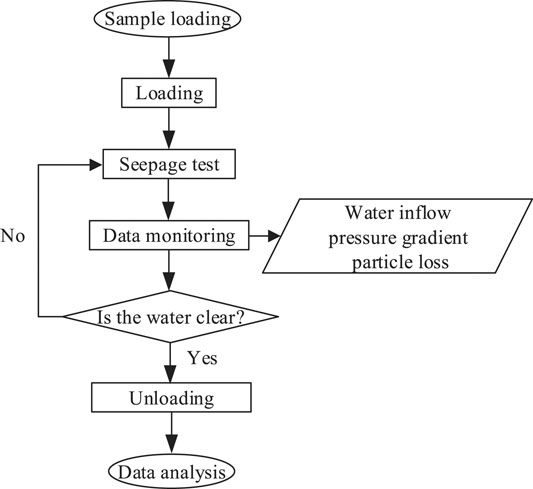
FIGURE 3. Test procedure.
Test Result Analysis
Influence of Particle Size Gradation on the Evolution of Water Bursting and Sand Gushing
Influence of Particle Size Gradation on Sand Gushing
Figure 4 shows the sand gushing curve at five particle size gradations. Almost all the time-varying laws are identical, which gradually develops with time. Simultaneously, when the Talbol power exponent is large (n > 0.8), the evolution of sample gushing develops rapidly; when the power exponent is small, the development of sample gushing is very slow.
FIGURE 4. Time-varying curve of sand gushing with different particle size gradations.
Influence of Particle Size Gradation on Porosity Evolution
Figure 5 shows the influence of particle size gradation on porosity. The development tendency of porosity is consistent with that of sand gushing. That is, the velocity of porosity developedis positively correlated with the power index. However, the relation between the final porosity and power exponent of the particle size do not show a positive correlation; specially, the final porosity is large when the power exponent is less than 0.4 or larger than 0.6, and the final porosity is least when the power exponent is in the range of 0.4–0.6.
FIGURE 5. Time-varying curve of porosity with different particle size gradations.
Generally, the development of porosity is directly related to the amount of particle loss. According to the previous analysis, because the sample has a higher content of fine particles, the decreasing power index leads to a substantial increase in porosity after a long-term particle migration. However, when the power exponent is very high and the content of fine particles is small, because of the high initial permeability, there is a significant increase in migration of particles and permeability.
Influence of Particle Size Gradation on the Evolution of Permeability
Figure 6A shows the time-varying curves of permeability vs. different particle size gradations. It is seen that the permeability develops logarithmically with time. The larger the power exponent, the faster the permeability increases and the higher the final permeability.
FIGURE 6. Influence of particle size gradation on porosity: (A) time-varying curve of permeability with different particle size gradations and (B) final permeability under different particle size gradations.
Figure 6B shows the change in final permeability vs. power index. Obviously, the final permeability increases with the power index. When the particle size power indexes are 0.2, 0.4, 0.6, 0.8, and 1.0, the final permeability eventually reached 1.8 × 10⁻¹³ m2, 1.2 × 10⁻¹³ m2, 2.2 × 10⁻¹³ m2, 2.8 × 10⁻¹³ m2, and 6.2 × 10⁻¹³ m2, respectively; correspondingly, the incremental values are 18, 12, 22, 28, and 62 times compared with the initial permeability, respectively.
Since the evolution of permeability is related to the initial permeability and the degree of particle loss, the larger the particle size power index, the greater the initial permeability and seepage velocity in the sample, and hence the higher the particle loss velocity and permeability development velocity. On the contrary, the smaller the power exponent, the better the fine particles and the smaller the initial permeability, as well as the lower the seepage rate and particle loss velocity, and the development of permeability is also lower. Particularly, the evolution of permeability is closely related to the evolution of water bursting disasters; that is, the faster the development of permeability, the smoother the expansion of water bursting channels, and the faster the development of seepage speed. In addition, one can imagine the higher development of water gushing velocity is more likely to cause a water bursting disaster.
Influence of Particle Size Gradation on the Evolution of Fine Particle Concentration
Figure 7A shows the time-varying curve of fine particle concentration vs. different particle size gradations. The development tendency of a fine particle concentration includes two parts, the initial rapid growth phase and late decline phase. The concentration of fine particles is mainly composed of the amounts of liquid erosion and particles transported by the liquid. When the liquid starts flowing, the movable particles are eroded and dissolve in the liquid; thereby, the concentration of fine particles is increased. However, the flowing liquid would result in a particle loss; as a result, the concentration of fine particles is reduced. In addition, both processes jointly determine the concentration of fine particles in the liquid. When the particle amount in the erosion process is larger than that in transportation process, the concentration of fine particles keeps increasing at all times until both processes reach the same peak value. While as the seepage channel gets smooth, the amount of the transportation process is becoming greater than that of the erosion process, which eventually leads to the increase of concentration of fine particles.
FIGURE 7. Influence of particle size gradation on the evolution of the fine particle concentration: (A) time-varying curve of permeability with different particle size gradations and (B) final permeability under different particle size gradations.
Figure 7B shows the changes in peak fine particle concentrations with Talbol power exponents. The peak fine particle concentration presents a quadratic distribution law with the power exponent. When the power exponent is 0.2 or 1.0, the maximum fine particle concentration peak reaches 0.15, while the peak fine particle concentration is relatively small (about 0.1) for other power exponents. As shown in Figure 7A, the smaller the power exponent, the longer it will take to reach the peak for the particle concentration. Specifically, a low power exponent means the content of fine particles is relatively high and a low permeability. As a result, the evolution of seepage is quite slow, and it takes longer time to reach the peak value. While the concentration of fine particles quadratically changes with the power index, since the concentration of fine particles frequently migrate in the sample, a lower power index leads to better fine particles, which eventually results in a larger peak value of fine particle concentration. However, when the power exponent is very high, very fewer fine particles exist in the sample, and the seepage velocity is so large that a larger range of particle sizes easily migrate through the sample. As a result, the peak fine particle concentration becomes relatively large.
Influence of Particle Size Gradation on the Water Gushing Velocity
Figure 8A shows the time-varying curves of water gushing velocity at different power exponents. When n = 1.0, the evolution of water gushing velocity can be divided into three stages: the initial linear seepage stage, rapid growth of water gushing velocity, and stable stage with high water gushing velocity.
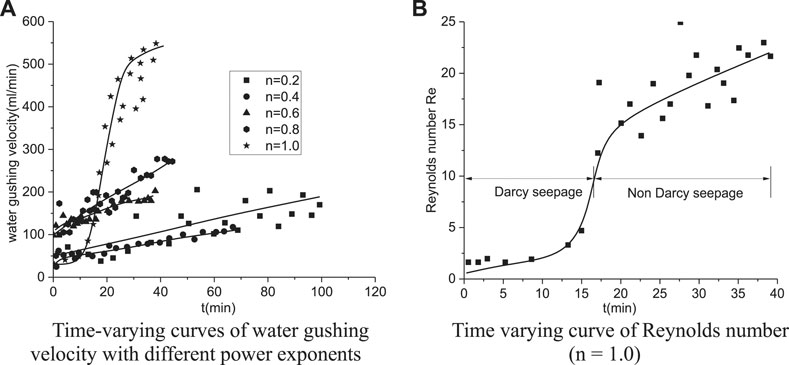
FIGURE 8. Influence of particle size gradation on the evolution of the fine particle concentration: (A) time-varying curves of water gushing velocity with different power exponents and (B) time-varying curve of Reynolds number (n = 1.0).
In addition, as shown in Figure 8B, since the formation porosity and permeability are quite small when t < 15 s, the seepage velocity and particle migration are relatively slow, and the seepage eventually stays in a linear Darcy seepage state (Re < 10). However, when the amount of particle migration reaches a certain level, the formation porosity and permeability significantly increase and that means the Reynolds number significantly increases, and there is a transition from the linear Darcy seepage to the non-Darcy seepage for the seepage flow state. As a result, the water bursting evolution becomes a mutation condition, in which the seepage velocity significantly increases and the porosity no longer increases when a large number of particles are flowing out. Simultaneously, the pores of soil are connected and the water behaves as a pipe flow, which eventually leads to the water bursting disaster.
Figure 9 shows the entire evolution of water gushing and sand gushing. First of all, the gushing water includes the yellow muddy water, and the gushing velocity is very low. However, after a while, the content of yellow mud water gradually increases with the highly outflow of sand gushing. Finally, the water gushing velocity increases significantly and the water quality gradually becoming clear; hence, the final water gushing velocity stays in the stable stage.
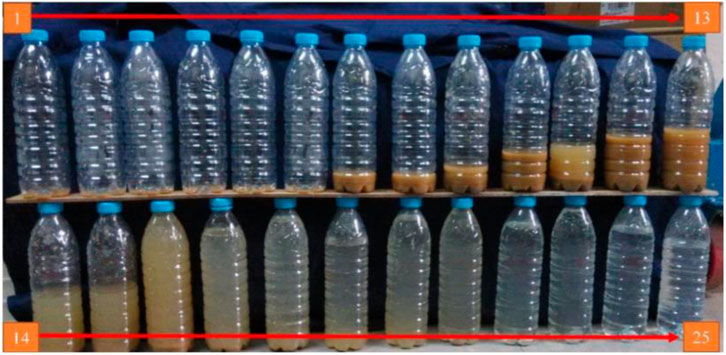
FIGURE 9. Evolution picture of water and sand gushing (n = 1.0).
In addition, when the power exponent is relatively small (<0.8), the water gushing velocity and the evolution velocity are also very small. As a result, the entire evolution process linearly develops and the water gushing is hard to occur. However, when the power index is large (>0.8), the water gushing velocity shows a nonlinear and sudden increase, and the water gushing is easy to occur. According to Figure 8A, when the particle size power exponents are 0.2, 0.4, 0.6, 0.8, and 1.0, the corresponding final water gushing velocities are 176.4 ml/min, 113.2 ml/min, 209.9 ml/min, 272.3 ml/min, and 551.1 ml/min, respectively. Nevertheless, when the power index is small (<0.6), the water gushing velocity finally reaches 200 ml/min. Hence, if the power index is large, the water gushing velocity increases significantly, which markedly increases and may exceed 550 ml/min. As a result, the water gushing velocity is 2.5 times that of a lower power index.
It is also found that the changes in sand gushing, porosity, and permeability are extremely complicated at different Talbol power exponents, since the loss of particles leads to the increase in porosity, which effectively promotes the increase in medium permeability, and hence the concentration of the fine particles is changed, which eventually leads to the rapid growth of water gushing velocity. Generally, the permeability and water gushing rate increase with the power exponent; especially, when the power exponent increases from 0.8 to 1.0, the growth of water gushing velocity changes from the linear to the nonlinear state, which shows a significant flow regime transition. Besides, more than 2.5 times increasing in water gushing velocity is reached; in other words, larger power exponent (>0.8) will result in a higher risk of water gushing hazard in the formation, which demonstrates that the strong disturbance area (large power index) has a higher risk of water gushing hazard.
Influence of Initial Porosity on the Evolution of Water Bursting and Sand Gushing
Influence of Initial Porosity on the Amount of Sand Gushing
Figure 10A illustrates the time-varying curve of sand gushing vs. different initial porosities; when the initial porosity decreases, the amount of sand gushing shows a decreasing trend. If the initial porosity decreases from 0.36 to 0.30, seldom change occurs in total sand loss, while the early loss in velocity is obviously limited. However, when the initial porosity decreases from 0.3 to 0.23, the decrease in sand gushing changes from 337.3 to 239.8 g.
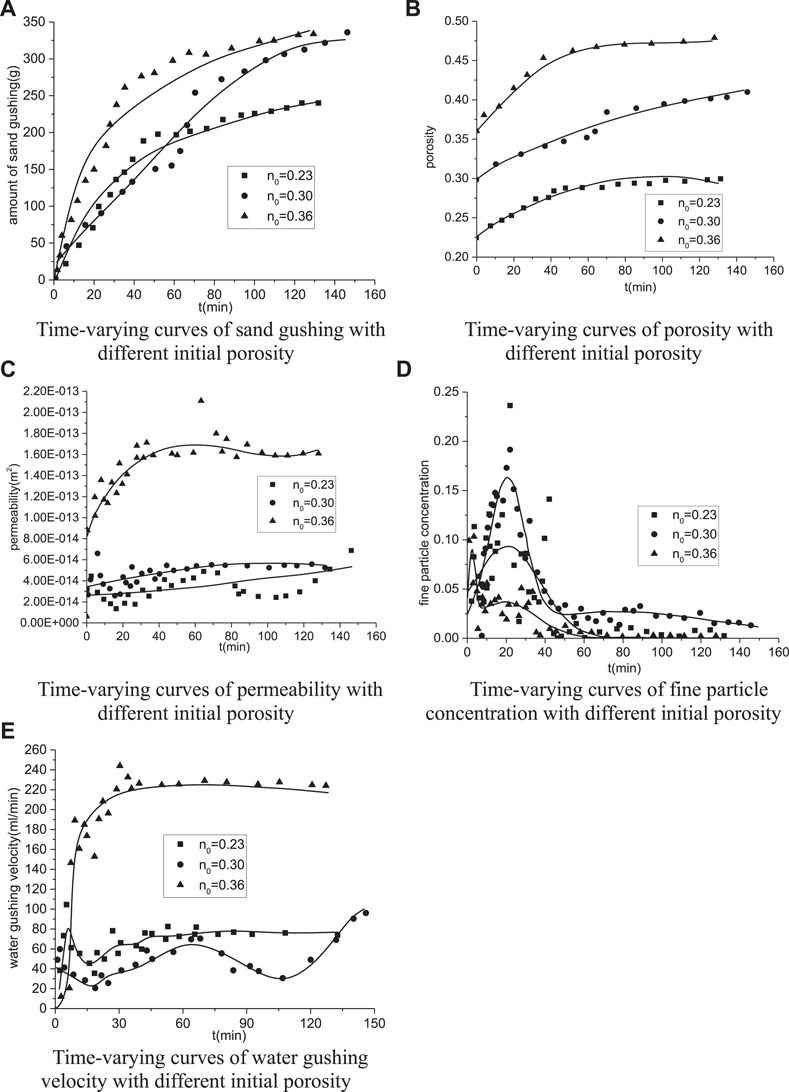
FIGURE 10. Influence of initial porosity on the evolution of water bursting and sand bursting: (A) time-varying curves of sand gushing with different initial porosities, (B) time-varying curves of porosity with different initial porosities, (C) time-varying curves of permeability with different initial porosities, (D) time-varying curves of fine particle concentration with different initial porosities, and (E) time-varying curves of water gushing velocity with different initial porosity.
Seeing from the test results, the decrease in initial porosity (within 15%) has no effect on the long-term particle loss, but it significantly improves the particle loss in the formation when disturbance occurs and prolongs the developing time for particle loss. However, when the porosity reduces to 0.23, the sand gushing can be effectively controlled. Hence, the formation backfill grouting significantly reduces the sand gushing and enhances the stratum compactness in actual engineering, and eventually improves the anti-outburst effect of stratum.
Influence of Initial Porosity on Porosity Evolution
Figure 10B shows the influence of initial porosity on porosity evolution. First of all, porosity with different initial values gradually increases and then becomes stable with time, which is more evident in view of the evolution velocity of porosity. Meanwhile, the initial porosities 0.23, 0.30, and 0.36 eventually increase to 0.30, 0.40, and 0.47, respectively, whose increment accounts for more than 30%. In other words, changes in the initial porosity can effectively alter the developing velocity of porosity but seldom influence the increment of porosity.
Influence of Initial Porosity on Permeability Evolution
Figure 10C illustrates the time-varying relation of permeability at different initial porosities. When the initial porosity is 0.36, the permeability significantly increases with time and eventually reaches 1.6 × 10⁻¹³ m2; the permeability increased more than 16 times the initial permeability. When the initial porosity decreased to 0.3 or smaller, the permeability hardly changes; as a result, the permeability finally reaches 5.5 × 10⁻¹⁴ m2, with the reduction of permeability by more than 66%.
It is notable that the decrease in the initial porosity enhances the compactness of the sample and reduces the initial permeability, which obviously reduces the water flow rate and particles loss, and the development of permeability is reduced. Therefore, the way of backfilling is often adopted to reduce the formation porosity in actual engineering, which effectively curbed the development of formation permeability and improved the anti-outburst characteristics.
Influence of Initial Porosity on the Evolution of Fine Particle Concentration
Figure 10D shows the effect of initial porosity on the concentration of fine particles. The time to reach peak fine particle concentration decreases with the initial porosity. In other words, the greater the initial porosity, the faster the fine particles reach the peak value, and the smaller the peak concentration of fine particles. It indicates that the particles are quickly taken away by the flowing water, and hence the inability of particle deposit eventually causes the decrease in the fine particle concentration. Therefore, the increase in porosity accelerates the migration and loss of particles, and eventually results in easier expansion and penetration of seepage channels.
Influence of Initial Porosity on Water Gushing Velocity
Figure 10E shows the time-varying relation of water gushing velocity with different initial porosities. When the initial porosity is below 0.36, the water gushing velocity is almost linear and stable. However, when the initial porosity reaches 0.36, the water gushing velocity exhibits a significant nonlinear growth. It demonstrates that the initial porosity at 0.36 is more likely to induce the water bursting disasters; when it drops to 0.30, the water bursting disaster can be effectively limited. Specifically, the amounts of water gushing velocities at initial porosities 0.23, 0.30, and 0.36 reach 77.5 ml/min, 98.1 ml/min, and 226.3 ml/min, respectively. Compared with the porosity at 0.36, the decrease in water gushing velocity with the porosity at 0.23 and 0.30 is by 66 and 57%, respectively. To sum up, a certain decrease in porosity has a significant effect on the control of water gushing velocity and water bursting disasters.
Influence of Water Pressure on the Evolution of Water Bursting and Sand Gushing
Influence of Water Pressure on the Amount of Sand Gushing
Figure 11A shows sand gushing under different water pressures. When the water pressures are 0.2, 0.4, and 0.6 MPa, corresponding sand gushing values are 54.8, 187.5, and 354.8 g, respectively, which account 1.7, 4.2 and 9.8% for the total mass of samples. It is notable that the amount of sand gushing under water pressures 0.4 and 0.6 MPa increased by 2.4 times and 5.5 times, respectively. According to Figure 11B, the amount of sand gushing increases exponentially with water pressure. However, a lower water pressure (less than 0.4 MPa) may encounter less amount of sand gushing (less than 5% for the total). When the water pressure reaches 0.6 MPa, the amount of sand gushing significantly increases and eventually reaches 10% for the total mass of the sample.
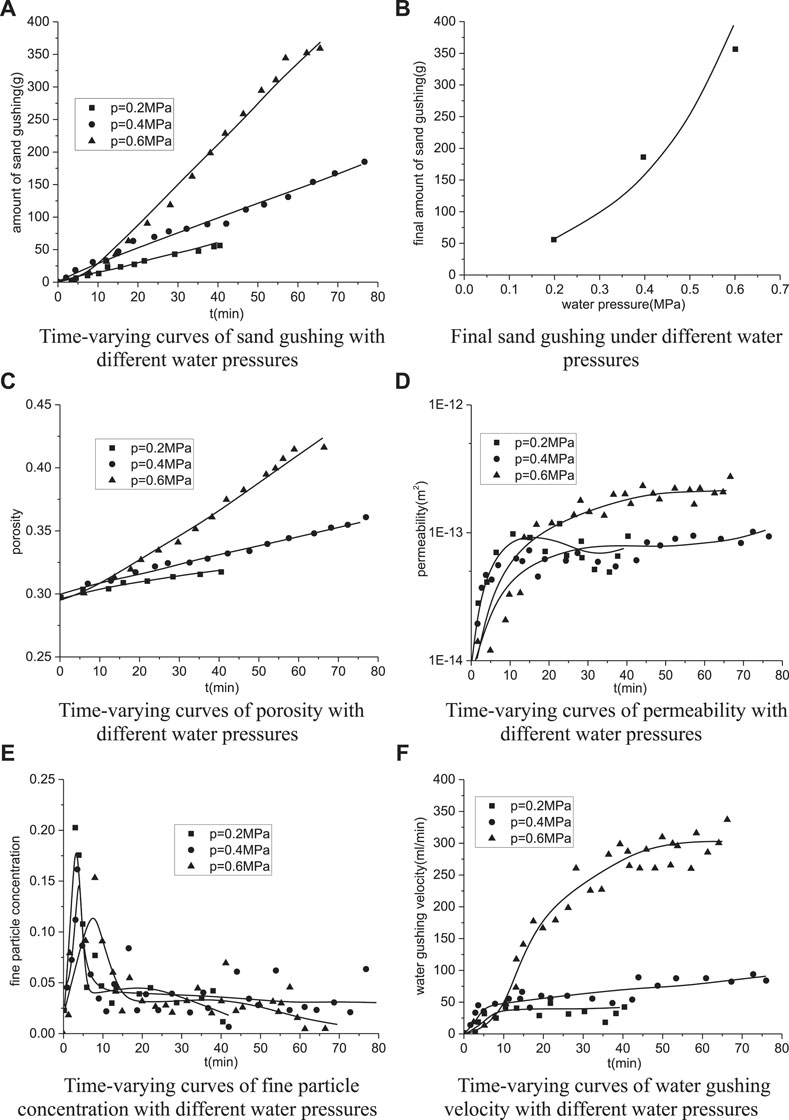
FIGURE 11. Influence of water pressure on the evolution of water bursting and sand gushing: (A) time-varying curves of sand gushing with different water pressures, (B) final sand gushing under different water pressures, (C) time-varying curves of porosity with different water pressures, (D) time-varying curves of permeability with different water pressures, (E) time-varying curves of fine particle concentration with different water pressures, and (F) time-varying curves of water gushing velocity with different water pressures.
Generally, water pressure is the driving force for the loss of particles. When the pressure is very low, according to the theory of seepage mechanics, the formation seepage velocity is quite low, and it is difficult for the liquid to carry particles. Only when the water pressure reaches a certain level, the high-velocity of flowing liquid will be able to carry particles. Different size particles need different flowing velocities, which contrarily results in different particle losses at different water pressure conditions. Therefore, when the water pressure is small, a very small part of particles can be driven, and it is unable to form an obvious water gushing channel; that is, a water bursting disaster will not occur. When the water pressure reaches a certain level, it promotes a larger amount of particle loss and even forms a water gushing channel; as a result, water bursting and mud bursting occur. Hence, there is a critical water bursting pressure that causes the occurrence of water bursting and mud bursting disasters.
Influence of Water Pressure on Porosity Evolution
Figure 11C shows the influence of water pressure on porosity evolution. It is obvious that when the water pressure is 0.2 MPa, the final porosity reaches 0.31, which is almost unchanged compared with the initial porosity. When the water pressure increases to 0.4 MPa, correspondingly, porosity also increases and eventually reaches 0.36, whose increment reaches more than 20%. When the water pressure further increases to 0.6 MPa, the porosity increases to 0.42, and about 40% increment in porosity has been achieved. Therefore, the increase in water pressure significantly accelerates the evolution of porosity, especially when the water pressure is no less than 0.6 MPa.
In addition, when the water pressure increases, there is significant increase in flow velocity for water inside the sample, which effectively accelerates the loss of particles and increase in porosity. However, when the water pressure is very low, the energy required for driving particles is far from enough and particles cannot be effectively driven; as a result, the porosity hardly changes. Therefore, only high enough water pressure can effectively drive the particles and promote the porosity increases rapidly.
Influence of Water Pressure on the Evolution of Permeability
As shown in Figure 11D, the permeability slowly develops when the water pressure is no more than 0.4 MPa; the final permeabilities reach 9.9 × 10⁻¹¹ m2 and 9.2 × 10⁻¹⁴ m2 when the water pressures are 0.2 and 0.4 MPa, respectively. However, if the water pressure reaches 0.6 MPa, the permeability develops very fast, and the final permeability eventually reaches more than 2.8 × 10⁻¹³ m2, which is more than 3 times higher than that for the water pressure at 0.4 MPa. Therefore, it is concluded that there exists a critical water pressure, making the permeability increase rapidly. If the water pressure reaches the critical value, the permeability increases exponentially.
Influence of Water Pressure on the Evolution of Fine Particle Concentration
Figure 11E shows the variation of fine particle concentration at different water pressures. Obviously, the change rules of the fine particle concentration at different water pressures are almost identical. When the water pressures are 0.2, 0.4, and 0.6 MPa, the corresponding peak fine particle concentrations are 0.20, 0.16, and 0.15, respectively, and time that is required to reach the peak value is 22, 18, and 5 min, respectively. In other words, increase in the water pressure leads to the decrease in the peak concentration of fine particles and time required to reach the peak. The higher the water pressure, the faster the sample seepage develops, and the faster the formation of seepage channel inside the sample. As a result, particles produced by erosion quickly migrate with the flowing water; hence, it is difficult to reach a higher peak fine particle concentration.
Influence of Water Pressure on Water Gushing Velocity
Figure 11F shows the influence of water pressure on the water gushing velocity. Obviously, when the water pressure was no more than 0.4 MPa, the water gushing velocity develops linearly and stably, and finally reaches about 50 ml/min. However, if the water pressure increases to 0.6 MPa, the development of water gushing velocity increases nonlinearly and rapidly, and eventually reaches 400 ml/min at most, which is eight times higher than that of water pressure at 0.4 MPa. Therefore, there exists a critical water pressure promoting the increase in water gushing velocity, while the existence of critical water pressure accelerates the occurrence of water bursting.
According to the analysis of change in sand gushing, porosity, and permeability, it is clear that all the indexes at water pressure at 0.6 MPa are higher than those at water pressure at 0.4 MPa. When the water gushing velocity gradually increases to 0.6 MPa, a transition from the linear to the nonlinear state occurs. Hence, the pressure at 0.6 MPa is the critical water pressure for fully weathered granite on the evolution of water bursting and mud bursting.
Influence of Confining Pressure on the Evolution of Water Bursting and Sand Gushing
Influence of Confining Pressure on the Amount of Sand Gushing
Figure 12A shows the time-varying relation of sand gushing at different confining pressures. Relations between sand gushing and time are similar with each other even though the confining pressures are different. Especially, a higher confining pressure will lead to a higher increment for the velocity of sand gushing. For example, the amount of sand gushing at a confining pressure 0.5 MPa is 164.7 g. While confining pressure at 1.0 MPa significantly causes 289.8 g sand gushing, which is approximately twice for the sand gushing at confining pressure 0.5 MPa. However, when the confining pressure increases to 1.5 MPa, there is very small improvement in the sand gushing velocity, and the total amount of sand gushing is also unchanged.
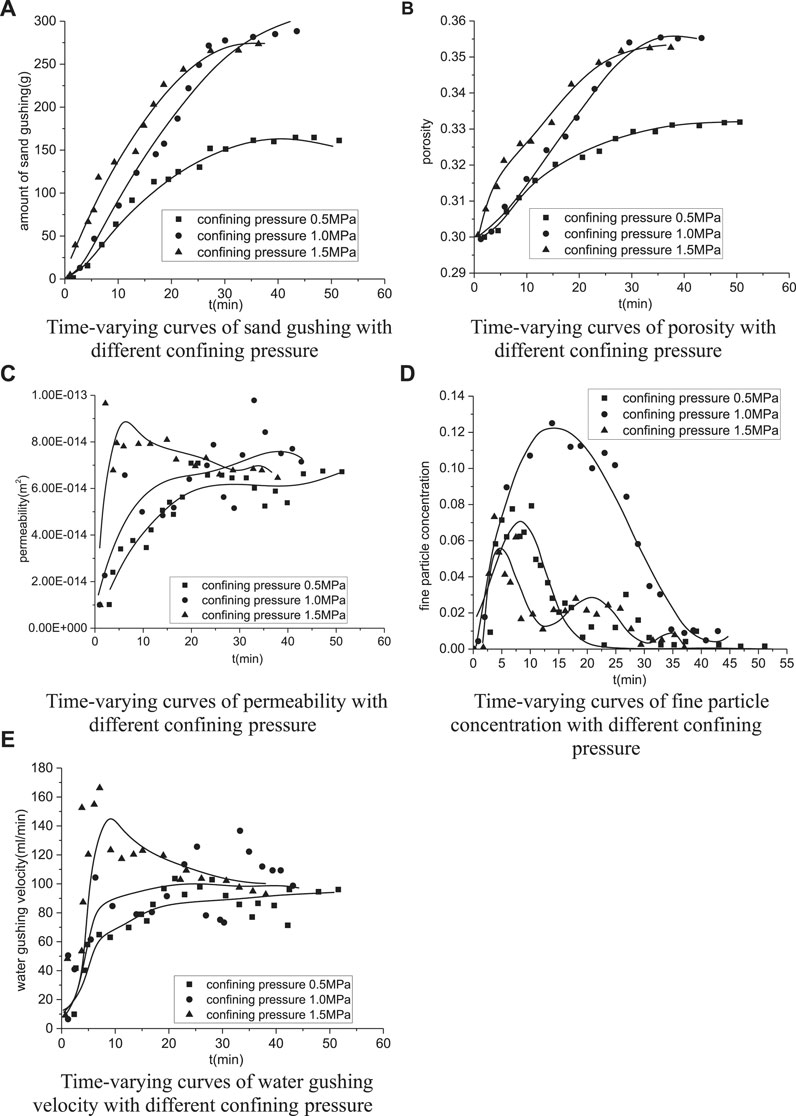
FIGURE 12. Influence of confining pressure on the evolution of water bursting and sand gushing: (A) time-varying curves of sand gushing with different confining pressures, (B) time-varying curves of porosity with different confining pressures, (C) time-varying curves of permeability with different confining pressures, (D) time-varying curves of fine particle concentration with different confining pressures, and (E) time-varying curves of water gushing velocity with different confining pressure.
Fully weathered granite under water-rich conditions is easily disintegrated and flowing plasticized; hence, the rock and soil are more likely to yield and flow away as the confining pressure increases. Therefore, the sand loss at a confining pressure 1.0 MPa is larger than that at 0.5 MPa. Besides, since the rock and soil have a strength limit, the sand loss no longer increases with the increase in confining pressure at yield strength, that is why the amount of sand gushing almost is constant even though the confining pressure is increasing to 1.5 MPa.
Influence of Confining Pressure on Porosity Evolution
Figure 12B shows the porosity changes with time at different confining pressures. When the confining pressure is 0.5 MPa, there is a slightly increase in porosity. As the confining pressure increases to 1.0 MPa, porosity significantly changes from 0.33 (confining pressure at 0.5 MPa) to 0.36 (confining pressure at 1.0 MPa). However, when the confining pressure further increased to 1.5 MPa, even though initially ascending in porosity occurs, the change in porosity is constant and similar to the final porosity at confining pressure 1.0 MPa. Hence, it is concluded that the increase in confining pressure significantly accelerates the development of porosity, while this acceleration process is limited.
Influence of Confining Pressure on the Evolution of Permeability
Figure 12C shows the time-varying curves of permeability at different confining pressures. The developing velocity of permeability is improved to a certain extent when the confining pressure increases, while the increase of confining pressure hardly affects the final permeability, that is, changes in confining pressure primarily affect the evolution velocity of permeability but has little influence on the final value. Since the changing in confining pressure mainly alters the stress condition of the sample, the sample soil is easier to yield and move at higher confining pressure. In other words, the initial permeability changes more obviously at a higher confining pressure condition. However, the final change in permeability is only relevant to the particle size distribution of the formation, water pressure, etc., but little influenced by the confining pressure. Therefore, the final permeability values at different confining pressures are almost identical.
Influence of Confining Pressure on the Evolution of Fine Particle Concentration
As shown in Figure 12D, when the confining pressure increases from 0.5 to 1.0 MPa, the peak fine particle concentration significantly increases from 0.08 to 0.12. Correspondingly, the time the fine particle concentration changes from the initial value to the peak value is also prolonged. However, when the confining pressure increases to 1.5 MPa, the peak concentration of fine particles and the time the concentration changes from initial value to peak value are obviously decreased. In other words, the increase in confining pressure considerably accelerates the yield of soils, since the particles are easily dissolved in the liquid and hard to be transported away immediately; as a result, the concentration of fine particles is noticeably increased. Nevertheless, when further increasing the confining pressure, the yield strength of soil is significantly exceeded, which remarkably accelerates the dissolution of particles. On the other hand, due to the sharply reduce of shear strength, What's more soil sample withstand water pressure is easier to be penetrated and form the seepage channel. Finally, particles quickly flow away and result in the decrease of the fine particle concentration.
Influence of Confining Pressure on Water Gushing Velocity
As shown in Figure 12E, the development of relation water gushing velocity vs. time at different confining pressures can be divided into three stages; even though all the increasing velocities are different, the final water gushing velocities are almost identical; that is, the influence of confining pressure on the water gushing velocity is mainly reflected in the initial increasing velocity for the water gushing velocity, which has little influence on the development of final water gushing velocity.
According to the test, an increase in the confining pressure steadily accelerates the yield of soil, which significantly promotes the increase of sand gushing and porosity. Hence, a change in the confining pressure generally affects the initial evolution velocity of permeability and water gushing velocity, which has limited influence on the final testing results.
Influence of Anti-Outburst Thickness on the Evolution of Water Bursting and Sand Gushing
Influence of Anti-Outburst Thickness on Sand Gushing
As shown in Figure 13A, sand gushing rapidly increases with time and then remains stable. Results show that 15 cm thick anti-outburst thicknesses result in the most increase in the amount of sand gushing, whose total amount reaches 503.16 g, accounting for 10% of the total mass of the sample. When the thickness is increased to 20 cm, total sand gushing is 143.46 g, only accounting for 2.2% of the total mass of the sample. However, when the thickness increases to 25 cm, very few sand particles were flowing out of the sample, and the total sand gushing mass is 66.46 g, accounting for less than 1% of the total mass of sample. It reveals that thickness at 15 cm is easily cause mud bursting, even though the thickness is increased to 20 cm, very little amount of sand bursting occurs, while the water bursting and mud bursting hardly occurred at 25 cm thick.
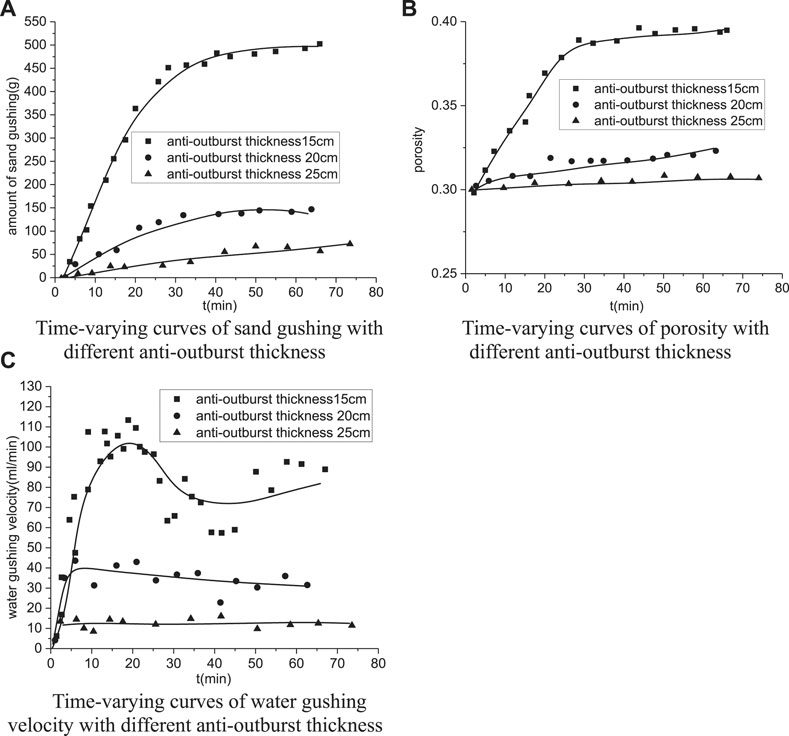
FIGURE 13. Influence of confining pressure on the evolution of water bursting and sand gushing: (A) time-varying curves of sand gushing with different anti-outburst thicknesses, (B) time-varying curves of porosity with different anti-outburst thicknesses, and (C) time-varying curves of water gushing velocity with different anti-outburst thicknesses.
Influence of Anti-Outburst Thickness on Porosity
Seeing from Figure 13B, the final porosities at different anti-outburst thicknesses are different. The porosity at 15 cm thick increased more than 30% and eventually remained in a stable stage, while the final porosity reached 0.39, which is higher than that at 20 cm thick. Therefore, a thicker anti-outburst thickness keeps the porosity constant as initial.
Influence of Anti-Outburst Thickness on Water Gushing Velocity and Permeability
Figure 13C shows the variation of water gushing velocity at different anti-outburst thicknesses. Obviously, the changes in growth velocity of water bursting velocity reach the peak at 15 cm thick and present a nonlinear fluctuation, which indicates that the seepage channel underwent repeat blockage and expanding transfixion in seepage evolution. In addition, the maximum water gushing velocity reaches about 120 ml/min, which is extremely prone to water bursting. However, when the thickness is increased to 20 cm, there is a slight increase in the water gushing velocity and a significant reduction in the nonlinear growing stage. Meanwhile, the final steady water gushing velocity dropped to less than 40 ml/min. The water gushing velocity at 25 cm thick is 12.5 ml/min, which only accounts for 10% of the velocity at 15 cm thick. Besides, according to Table 2, the final permeability at 15 cm thick is 6.4 × 10⁻¹⁴ m2, which is 6.4 times higher than that of initial permeability. Nevertheless, the final permeabilities at 20 and 25 cm thick are merely 2.5 × 10⁻¹⁴ m2 and 1.0 × 10⁻¹⁴ m2, respectively.

TABLE 2. Permeability under different anti-outburst thicknesses.
Analysis of the Modeling Test Results of Water-Rich and Fully Weathered Granite on Water Bursting and Mud Bursting
According to the test results, the water bursting and mud bursting mechanisms of water-rich and fully weathered granite are given in Figure 14.
1) Since the soil particles come from the development of the pore structure, the cohesion and strength between particles are very weak. In addition, because much fine particles and clay minerals exist in the fully weathered granite, the occurrence of water bursting and mud bursting attributes to the disintegration and loss of granite, and the principle external cause is the water pressure, which accelerates water bursting and mud bursting.
2) Due to the pressure gradient, water can easily seep within the pore for the rock soil. As a result, the fine particles in the rock mass are easily dissolved in the water and migrated with flowing water, which considerably increases the porosity of rock mass. However, the clay minerals in the rock mass are easily disintegrated when exposed to the water, and the porosity of rock mass is significantly increased due to the migration of clay particles. Therefore, both factors are the reason for the increase in porosity and acceleration of permeability in the rock mass. While the increase in permeability in turn affects the particle migrating velocity, such coupling effects eventually accelerate the evolutions of porosity and permeability.
3) When migration occurs in certain particles, the pore structure easily leads to the loss of stability and forms a water bursting channel. As a result, the liquid transforms from the initial Darcy flow to conduit flow; this unstable transition eventually leads to the water bursting and mud bursting disasters.
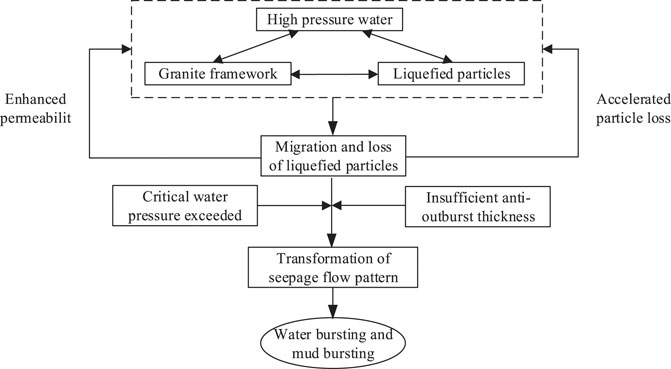
FIGURE 14. Catastrophic mechanism of water and mud bursting.
Conclusion
In this study, a self-developed dynamic water grouting triaxial test apparatus was used to evaluate the water bursting and mud bursting characteristics of water-rich and fully weathered granite. The factors (particle size gradation, initial porosity, initial water pressure, confining pressure, and anti-outburst thickness) were considered to comprehensively analyze the mass loss, water gushing velocity, permeability, fine particle concentration, and porosity in the water bursting and mud bursting processes. The main conclusions are as follows:
1) The fully weathered granite particles obviously migrate under water pressure; as a result, the increase of permeability and porosity significantly accelerates the increase of water gushing velocity, which is the most critical reason for the occurrence of water bursting and mud bursting. In addition, the transition of water flow from the linear (Reynolds number Re < 10) to the nonlinear state is also the significant feature of water bursting.
2) The evolution of water bursting velocity can be divided into three stages: the initial linear seepage stage, seepage mutation stage, and steady seepage stage. Permeability at the first stage is very low, the water flowing velocity is quite small, and a very small amount of particles effectively migrate with the flowing water. As a result, the porosity and permeability finally increase slowly. At the second stage, because of the increase in permeability, the accelerated water flowing velocity eventually results in a rapid and massive loss of particles; hence, the permeability, porosity, and water gushing velocity are drastically increased. However, the amount of sand gushing and water gushing velocity almost remained constant at the third stage.
3) The water gushing disaster is easy to occur when the Talbol power exponent is large (>0.8). However, there are some effective methods, such as backfill and compaction, to restrain the disasters. In addition, a critical water pressure (greater than the critical water pressure for particle starting) exists, which obviously accelerates the occurrence of water bursting and mud bursting disasters. Likewise, the increase in the thickness of anti-outburst can effectively limit the water bursting and mud bursting disasters.
Data Availability Statement
The raw data supporting the conclusion of this article will be made available by the authors, without undue reservation.
Author Contributions
The author confirms being the sole contributor of this work and has approved it for publication.
Funding
This research was supported by the Research Project for Young and Middle-aged Teachers of Fujian Province (JAT190461).
Conflict of Interest
The author declares that the research was conducted in the absence of any commercial or financial relationships that could be construed as a potential conflict of interest.
Publisher’s Note
All claims expressed in this article are solely those of the authors and do not necessarily represent those of their affiliated organizations, or those of the publisher, the editors and the reviewers. Any product that may be evaluated in this article, or claim that may be made by its manufacturer, is not guaranteed or endorsed by the publisher.
References
Erhard, P., Etling, D., Muller, U., Riedel, U., Sreenivasan, K. R., and Warnatz, J. (2010). Prandtl-essentials of Fluid Mechanics (Vol. 158). Berlin: Springer Science and Business Media.
Evans, R. D., and Civan, F. (1994). “Characterization of Non-darcy Multiphase Flow in Petroleum Bearing Formation. Final Report,”. Final report (No. DOE/BC/14659-7) (Oklahoma Univ., Norman, OK (United States):School of Petroleum and Geological Engineering). doi:10.2172/10142377
Geng, F., and Saleh, J. H. (2015). Challenging the Emerging Narrative: Critical Examination of Coalmining Safety in China, and Recommendations for Tackling Mining Hazards. Saf. Sci. 75, 36–48. doi:10.1016/j.ssci.2015.01.007
Guo, Y., Ma, M., Rao, B., Lu, J., and He, J. (2020). Research on Water Inrush and Mud Inrush from Water-Rich Fault Fracture Zone of Deep Tunnel in Mountainous Area. IOP Conf. Ser. Mater. Sci. Eng. 782 (4), 042057. doi:10.1088/1757-899X/782/4/042057
Huang, X., Li, S.-c., Xu, Z.-h., Guo, M., Shi, X.-s., Gao, B., et al. (2019). An Attribute Recognition Model for Safe Thickness Assessment between Concealed Karst Cave and Tunnel. J. Cent. South. Univ. 26 (4), 955–969. doi:10.1007/s11771-019-4063-1
Li, S. C., Wu, J., Xu, Z. H., and Li, L. P. (2017). Unascertained Measure Model of Water and Mud Inrush Risk Evaluation in Karst Tunnels and its Engineering Application. KSCE J. Civ Eng. 21 (4), 1170–1182. doi:10.1007/s12205-016-1569-z
Li, X., Zhang, P., He, Z., Huang, Z., Cheng, M., and Guo, L. (2017). Identification of Geological Structure Which Induced Heavy Water and Mud Inrush in Tunnel Excavation: a Case Study on Lingjiao Tunnel. Tunnelling Underground Space Technol. 69, 203–208. doi:10.1016/j.tust.2017.06.014
Liu, H. L., Yang, T. H., Yu, Q. L., Chen, S. K., and Wei, C. H. (2010). Numerical Analysis on the Process of Water Inrush from the Floor of Seam 12 in Fangezhuang Coal Mine. Coal Geology Exploration 38 (3), 27–31. doi:10.1016/S1876-3804(11)60004-9从
Liu, J.-Q., Chen, W.-Z., Yuen, K.-V., and Zhou, X.-S. (2020). Groundwater-mud Control and Safety Thickness of Curtain Grouting for the Junchang Tunnel: A Case Study. Tunnelling Underground Space Technol. 103, 103429. doi:10.1016/j.tust.2020.103429
Liu, J., Chen, W., Deng, Z., Liu, T., and Dong, J. (2020). Impacts of Confining Pressure and Safety Thickness on Water and Mud Inrush in Weathered Granite. Mar. Georesources Geotechnology 38 (2), 144–153. doi:10.1080/1064119X.2018.1563253
Liu, J., Chen, W., Nie, W., Yuan, J., and Dong, J. (2019). Experimental Research on the Mass Transfer and Flow Properties of Water Inrush in Completely Weathered Granite under Different Particle Size Distributions. Rock Mech. Rock Eng. 52 (7), 2141–2153. doi:10.1007/s00603-018-1719-3
Liu, J., Chen, W., Yang, D., Yuan, J., Li, X., and Zhang, Q. (2018). Nonlinear Seepage-Erosion Coupled Water Inrush Model for Completely Weathered Granite. Mar. Georesources Geotechnology 36 (4), 484–493. doi:10.1080/1064119X.2017.1340373
Liu, J., Chen, W., Yuan, J., Li, C., Zhang, Q., and Li, X. (2018). Groundwater Control and Curtain Grouting for Tunnel Construction in Completely Weathered Granite. Bull. Eng. Geol. Environ. 77 (2), 515–531. doi:10.1007/s10064-017-1003-x
Ma, D., Miao, X. X., Chen, Z. Q., and Mao, X. B. (2013). Experimental Investigation of Seepage Properties of Fractured Rocks under Different Confining Pressures. Rock Mech. Rock Eng. 46 (5), 1135–1144. doi:10.1007/s00603-012-0329-8
Meng, Y., Jing, H., Yin, Q., and Wu, X. (2020). Experimental Study on Seepage Characteristics and Water Inrush of Filled Karst Structure in Tunnel. Arab J. Geosci. 13 (12), 1–13. doi:10.1007/s12517-020-05474-9
Peng, Y., Wu, L., Zuo, Q., Chen, C., and Hao, Y. (2020). Risk Assessment of Water Inrush in Tunnel through Water-Rich Fault Based on AHP-Cloud Model. Geomatics, Nat. Hazards Risk 11 (1), 301–317. doi:10.1080/19475705.2020.1722760
Song, C., He, W. G., and Liu, P. (2018). Construction Method Analysis of Long Subway Subsea Tunnel in Hard Rock Stratum. Construction Technol. 47 (8), 69–74. doi:10.7672/sgjs2018080069
Wang, J.-A., and Park, H. D. (2003). Coal Mining above a Confined Aquifer. Int. J. Rock Mech. Mining Sci. 40 (4), 537–551. doi:10.1016/S1365-1609(03)00029-7
Wang, J., Zhang, Y., Qin, Z., Song, S., and Lin, P. (2020). Analysis Method of Water Inrush for Tunnels with Damaged Water-Resisting Rock Mass Based on Finite Element Method-Smooth Particle Hydrodynamics Coupling. Comput. Geotechnics 126, 103725. doi:10.1016/j.compgeo.2020.103725
Wang, L., Chen, Z., Kong, H., and Shen, H. (2014). Effects of Pore Pressure on Permeability of sandstone during Bending Deformation. Int. J. rock Mech. mining Sci. 70 (9), 26–32. doi:10.1016/j.ijrmms.2014.03.012
Wu, G.-j., Chen, W.-z., Yuan, J.-q., Yang, D.-s., and Bian, H.-b. (2017). Formation Mechanisms of Water Inrush and Mud Burst in a Migmatite Tunnel: a Case Study in China. J. Mt. Sci. 14 (1), 188–195. doi:10.1007/s11629-016-4070-8
Wu, Y., Hyodo, M., and Aramaki, N. (2018). Undrained Cyclic Shear Characteristics and Crushing Behaviour of Silica Sand. Geomechanics Eng. 14 (1), 1–8. doi:10.12989/gae.2018.14.1.001
Wu, Y., Li, N., Wang, X., Cui, J., Chen, Y., Wu, Y., et al. (2021). Experimental Investigation on Mechanical Behavior and Particle Crushing of Calcareous Sand Retrieved from South China Sea. Eng. Geology 280, 105932. doi:10.1016/j.enggeo.2020.105932
Yang, T. H., Liu, J., Zhu, W. C., Elsworth, D., Tham, L. G., and Tang, C. A. (2007). A Coupled Flow-Stress-Damage Model for Groundwater Outbursts from an Underlying Aquifer into Mining Excavations. Int. J. Rock Mech. Mining Sci. 44 (1), 87–97. doi:10.1016/j.ijrmms.2006.04.012
Yang, T., Zhang, Q., Zhang, X., Zhang, D., and Wang, D. (2020). Experimental Research on Destruction Characteristics of Mud Gushing on Tunnel in Argillaceous Fault Fracture Zone[C]//IOP Conference Series: Earth and Environmental Science. IOP Publishing 555 (1), 012110. doi:10.1088/1755-1315/555/1/012110
Zhang, W., Zou, J.-q., Bian, K., and Wu, Y. (2021). Thermodynamic-based Cross-Scale Model for Structural Soil with Emphasis on Bond Dissolution. Can. Geotech. J. 57 (5), 677–691. doi:10.1139/cgj-2020-0677
Zhao, Y., Li, P., and Tian, S. (2013). Prevention and Treatment Technologies of Railway Tunnel Water Inrush and Mud Gushing in China. J. Rock Mech. Geotechnical Eng. 5 (6), 468–477. doi:10.1016/j.jrmge.2013.07.009
Keywords: fully weathered granite, water bursting, mud bursting, model test, mechanism study
Citation: Zheng S (2021) Experimental Investigation of Water-Rich Fully Weathered Granite on Water Bursting and Mud Bursting. Front. Earth Sci. 9:658855. doi: 10.3389/feart.2021.658855
Received: 05 February 2021; Accepted: 23 June 2021;
Published: 27 August 2021.
Edited by:
Nils Moosdorf, Leibniz Center for Tropical Marine Research (LG), GermanyReviewed by:
David Freire-Lista, University of Trás-os-Montes and Alto Douro, PortugalYan-Hua Huang, China University of Mining and Technology, China
Rubin Wang, Hohai University, China
Copyright © 2021 Zheng. This is an open-access article distributed under the terms of the Creative Commons Attribution License (CC BY). The use, distribution or reproduction in other forums is permitted, provided the original author(s) and the copyright owner(s) are credited and that the original publication in this journal is cited, in accordance with accepted academic practice. No use, distribution or reproduction is permitted which does not comply with these terms.
*Correspondence: Suping Zheng, MjkzMjkxNTFAcXEuY29t