
95% of researchers rate our articles as excellent or good
Learn more about the work of our research integrity team to safeguard the quality of each article we publish.
Find out more
BRIEF RESEARCH REPORT article
Front. Earth Sci. , 14 May 2021
Sec. Geohazards and Georisks
Volume 9 - 2021 | https://doi.org/10.3389/feart.2021.658825
This article is part of the Research Topic Geospace Observation of Natural Hazards View all 13 articles
 Toshiyasu Nagao1*
 Masashi Kamogawa2
 Jun Izutsu3Tomoyuki Suzuki2Airi Saito4Shigeki Sugiura5Hitoshi Kondo5
Preseismic VLF electromagnetic pulses occasionally increase a few days before large earthquakes, especially inland earthquakes. More than two decades ago, the Tokai University group developed a digital recording system for collecting the preseismic electromagnetic pulse data and showed remarkable results. However, due to the limitations of personal computers’ data storage and CPU power during that time, they discontinued the observation. We relaunched this research using current technology. This paper shows the development of the new observation system and presents preliminary results. In addition, we introduce an electromagnetic-wave arrival discrimination algorithm that combines the autoregressive model and the Akaike information criterion, which are commonly used for automatic waveform reading in seismology, to obtain accurate data on the time of arrival (TOA) of electromagnetic waves. Then, source positioning was performed using TOA of electromagnetic waves. Seven electromagnetic pulses near the epicenter were observed 2 days before the largest inland earthquake (M = 5.6) that occurred near the observation network during the observation period (2016–2020). These VLF pulses may be a seismic precursory phenomenon because they were not electromagnetic pulses originating from lightning. These results encourage future observations.
Many Japanese seismologists, having experienced the Tohoku Earthquake in 2011 and the Kobe Earthquake in 1995, are extremely pessimistic about realizing the earthquake prediction. The authors highlight the problem that research on short-term prediction, such as that involving one day or one week, which is the most useful, is rarely conducted at the national level.
Various electromagnetic-precursory phenomena of earthquakes have been reported (e.g., Gokhberg et al., 1982; Warwick et al., 1982; Fraser-Smith et al., 1990; Nagao et al., 2019); in Japan, an increase in electromagnetic noise is claimed to occur just before an earthquake. When the Mikawa Earthquake occurred in 1945 (M = 6.8), the radio was always broadcast to allow people to listen to air-raid warnings during World War II. A rumor has circulated that one can recognize an impending earthquake by listening to radio noise that occurs before an aftershock. A pioneering study was conducted by Professor Kazuo Oike of Kyoto University (Oike and Ogawa, 1986; Oike and Yamada, 1994).
Oike and his group reported the results of inland earthquakes with a magnitude of six or greater. An LF band noise was observed for a few days (in particular, two days) before the earthquakes. Although most LF band noises have been interpreted to originate from lightning, Oike mentioned that the peak of noises before an earthquake may include earthquake-precursory electromagnetic signals. Intense LF-VLF pulses were observed just before the 1995 Kobe Earthquake (Yamada and Oike, 1996; Nagao et al., 2002; Izutsu and Oike, 2003; Izutsu, 2007).
More than two decades ago, the Tokai University group developed a digital waveform recording system and showed remarkable results (Asada et al., 2001). However, given the limitations of personal computers’ data storage and CPU power during the time, they discontinued the observation. We relaunched the research using current technology. This paper is a follow-up of the research led by Asada et al. (2001), which had been suspended for 2 decades. The observation was conducted as a part of the national earthquake prediction research project by using the most advanced digital technology in the 21st century.
We faithfully reproduced the coil sensor used by Asada et al. (2001) because promising results were obtained. The research should be relaunched using coil sensors with the same frequency characteristics, given that the electromagnetic waves preceding an earthquake is unknown. The sensor wounds a 0.6 ΦPEW wire (polyester enameled wire) around the ferrite core 600 times. The inductance of the coil is 25 mH. An antenna having almost the same frequency characteristics as the antenna produced by Asada et al. (2001) was reproduced. A detailed technical description is presented by Nagao et al. (2016). The A/D converter used by Asada et al. (2001) was 12 bits and two channels at 1 MHz sampling. In this observation, we used a 12-bit, six-channel, 100 MHz sampling A/D converter. This A/D converter was originally developed for the measurement of gamma rays, X-rays, muons, etc.
Asada and his group analyzed only the linearly polarized magnetic components of electromagnetic waves to conduct direction findings via the Goniometer method. However, in our system, the source can be determined based on the time of arrival (TOA) of electromagnetic waves. The theoretical spatial resolution (1 least significant bit [LSB] = 10−8 Hz) at a 100 MHz sampling is 3 m. Therefore, a time synchronization system using GPS was adopted to maintain the accuracy of the clock, and a time accuracy of 10 ns at the maximum and 2–3 ns in most cases could be obtained (Nagao et al., 2016).
In this project, two prototypes were developed in 2014. The routine observation started in November 2015 at three stations. The five-station operation (Figure 1) has been conducted since May 2017. The stations are located at Tokyo Gakugei University in Koganei city (kgn: 35.7052°N, 139.4906°E), Tokai University in Shimizu city (smz: 34.9900°N, 138.5140°E), Kanazawa University in Kanazawa city (knz: 36.5440°N, 136.7042°E), Shinshu University in Ueda city (ued: 36.3913°N, 138.2635°E), and Gunma University in Kiryu city (kry: 36.4241°N, 139.3490°E).
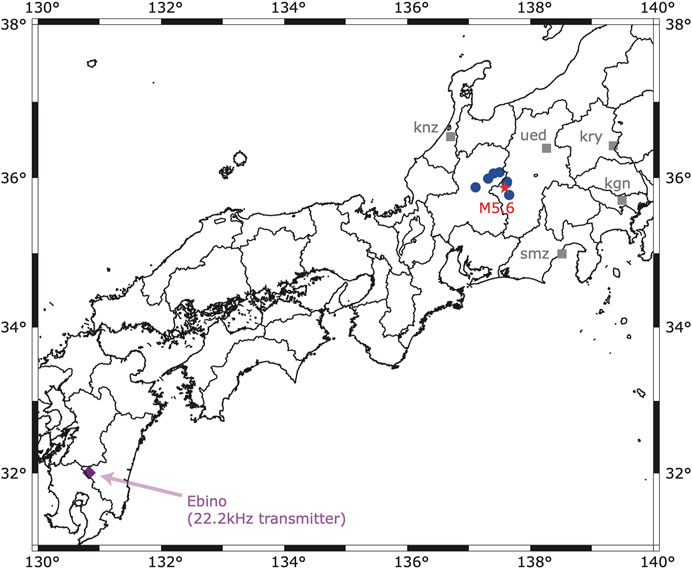
FIGURE 1. Locations of the five observation stations (gray square) and the epicenter of the earthquake (red star) on June 25, 2017 (M5.6, focal depth = 7 km). The blue solid circles are the source locations of possible precursory electromagnetic waves. The purple rhombus denotes the VLF transmitter at Ebino.
In this observation, the acquisition of triggering data was designed at 1 and 9 ms before and after the trigger time, respectively. Given the test observation results (Figure 2), we confirmed that the radio wave of 22.2 kHz transmitted from the Ebino (Figure 1) for the Self-Defense Forces communication for submarines was also accurately observed.
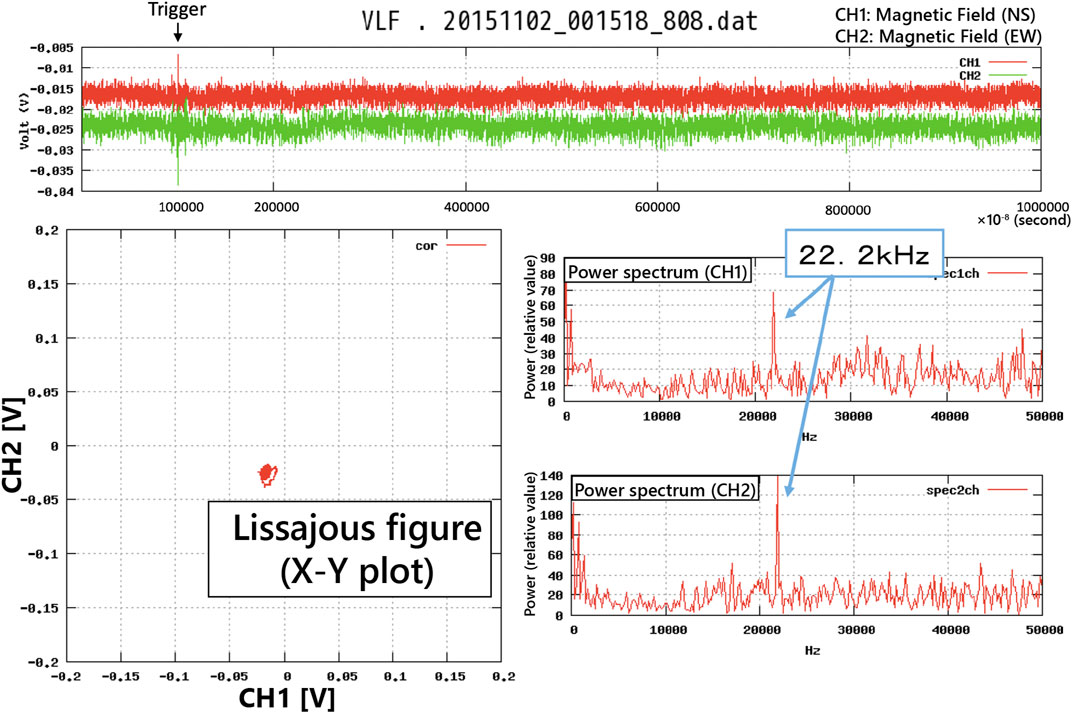
FIGURE 2. Output image of the observed electromagnetic waveforms and power spectrums (Top) Observed waveforms. CH1 (red line) shows the north-south (NS) component of the observed magnetic field, and CH2 (green line) shows the east-west (EW) component. Waveforms were recorded 1 ms before and 9 ms after triggering during this test period (Lower left) A Lissajous figure (X–Y plot) of the observed electromagnetic wave (Lower right) Power spectrums of CH1 and CH2. A peak at 22.2 kHz was caused by the electromagnetic waves transmitted from Ebino, as shown in Figure 1.
As mentioned above, the sampling rate of 100 MHz indicates that the spatial resolution of the theoretical 1 LSB is 3 m. The TOA method allows the determination of the position of an electromagnetic wave source by using the trigger time as the TOA. However, the expected TOA was earlier than the recorded trigger time when the signal intensity was close to the background noise. Note that the trigger time was recorded when the signal intensity exceeded a certain threshold.
Asada et al. (2001) only selected the linearly polarized horizontal magnetic component of electromagnetic waves for analysis when the correlation coefficient between two horizontal magnetic components was more than 0.9 (H. Baba, personal communication) and then estimated the source position by using a goniometer method. However, given that this observation was a test observation, we decided to conduct the observation on the rooftop of the university where our research collaborators were located. We found that the electromagnetic wave of elliptical polarization was observed much more than the electromagnetic wave of linear polarization. The electromagnetic field was possibly distorted because other antennas and outdoor units of air conditioners were installed on the roof. We do not know the exact reason so far.
For electromagnetic waves with a large intensity, such as lightning activity, the source location can be accurately determined via the simple TOA method, even when the trigger time is used as the TOA of the electromagnetic wave. However, when the intensity of the electromagnetic wave was small, we observed cases where the source could not be determined well when the trigger time was used as the TOA of the electromagnetic wave.
To solve this problem, we developed a system that uses the autoregressive model and Akaike’s information criterion (AIC), which are commonly used in seismology (Akaike, 1974), to automatically determine the TOAs of electromagnetic waves (Takanami and Kitagawa, 1988; Takanami and Kitagawa, 1991). AIC is described as follows:
Where MLL (M) is the maximum log-likelihood for the data M, and k is a term of the number of parameters, which corresponds to a penalty when the model is complicated. It is considered the most probable model for data when the value of AIC takes a minimum value. In this study, we calculated the AIC by generating 1 MHz data for the combined output of two horizontal components of the magnetic field (Figure 3).
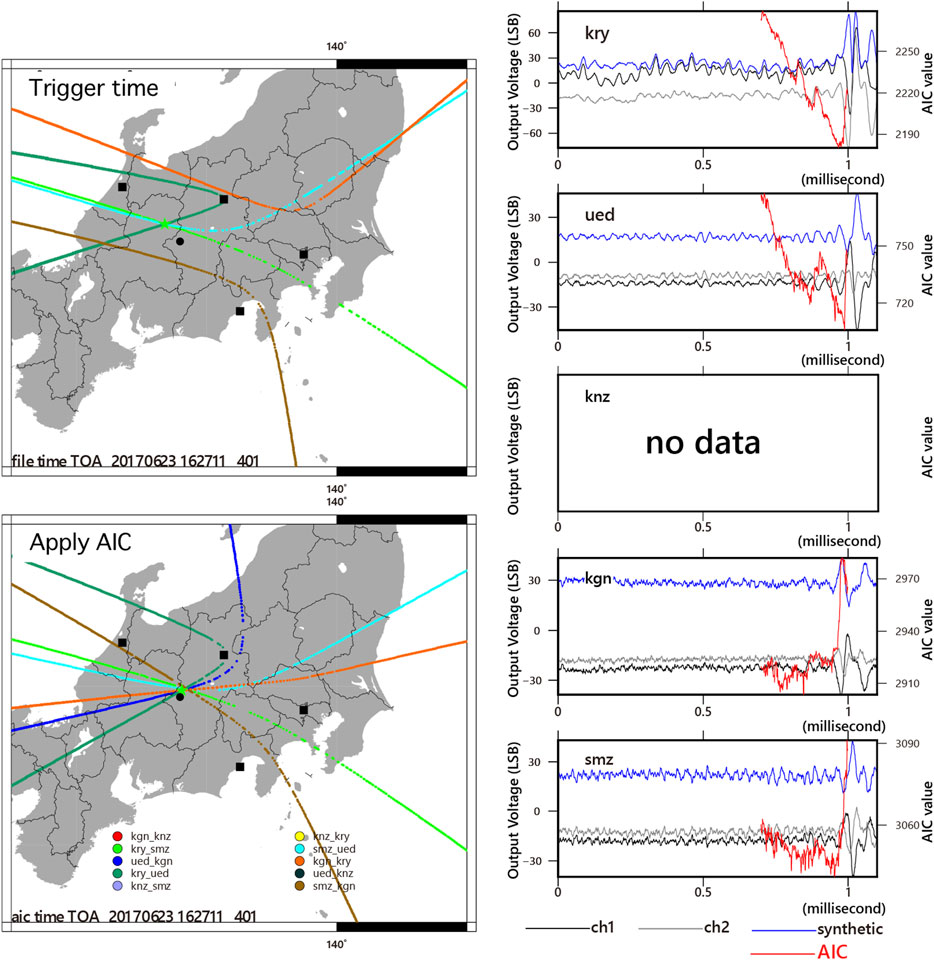
FIGURE 3. Example of source location identification via the time of arrival (TOA) method. The trigger time is assumed to be equal to the TOA of an electromagnetic wave (upper left panel). In this case, three hyperbolas intersect at one point, but other hyperbolas do not contribute to the intersection. The electromagnetic wave TOA is the time at which the AIC is minimized. All six hyperbolas intersect at one point (lower left panel). It is an equivalent method to estimate the hypocenter based on the initial motion of the seismic wave in seismology. The right panels show the waveform data of kry, ued, knz (no data), kgn, and smz from the top. These waveforms were triggered at the point of 1 ms. The calculated AIC is displayed as a red line. The time when AIC becomes minimum is defined as the TOA of an electromagnetic wave.
An M5.6 earthquake occurred at 07:02 JST on June 25, 2017, with a focal depth of 7 km. This is the largest earthquake that occurred in the vicinity of the observation network during the observation period. We applied AIC analyses for the data from 0 to 5 days before the earthquake, which empirically demonstrated the most probable period by Asada et al. (2001), Oike and Ogawa (1986), and Oike and Yamada (1994). We identified seven pulses within 30 km of the epicenter only two days before the earthquake on June 23 (Figure 1). These results agreed with those of Oike and Ogawa (1986), Oike and Yamada (1994), and Asada et al. (2001). No pulse was identified within 30 km of the epicenter on any other day.
Clearly, the largest source of electromagnetic waves observed in the VLF-band was lightning. The purple dots in Figure 4 indicate the cloud-to-ground (CG) lightning from 3:00 JST to 21:00 JST on June 23, 2017, measured at the World Wide Lightning Location Network (Dowden et al., 2002; Holzworth et al., 2019). The composite radar echo corresponding to the rainfall at 2 km altitude was provided by the Japan Meteorological Agency to confirm the thunderstorm, as shown in Figure 4. Therefore, we concluded that no lightning activity occurred near the epicenter.
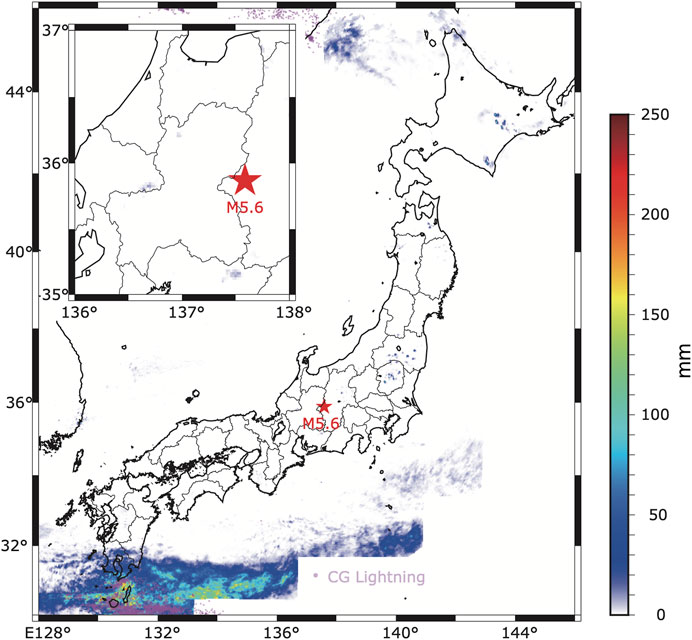
FIGURE 4. Composite radar echo and lightning map from 03:00 to 21:00 June 23, 2017 (JST). This time period includes the occurrence time of seven pulses. The composite radar echo provided by JMA corresponds to the total rainfall at the 2 km altitude during the period. Note that the radar echo away from the inland of Japan was not provided. The CG lightning was provided by the WWLLN. A star denotes the epicenter of the earthquake on June 25, 2017. The magnified figure near the epicenter is shown in the upper left panel. No lightning was detected around the epicenter.
We also confirmed that the observed record as linear polarization was little. A vertical electric field observation for the derivation of the Poynting vector for determining the electromagnetic wave arrival direction was also carried out at some observation stations. The analysis of elliptically polarized electromagnetic waves will also be carried out in the future. The trigger level could not be lowered further in the environment of the current university rooftop, and the measurement system will be transferred to an observation station with less noise in the future. Furthermore, the very small pulse numbers were due to the tightened intersections of hyperbolas.
In this paper, the performance of our observation system was investigated using data on lightning location, radar, and artificial radio waves. On June 23, 2017, two days before the occurrence of an M5.6 earthquake, electromagnetic pulses originating from the vicinity of the epicenter were observed, although the pulse number was at most seven. Given that the pulses did not originate from lightning, we concluded that the seven pulses were highly possibly earthquake precursors.
The VLF electromagnetic data was stored by Tokai University (TS). The lightning data was provided by the the World Wide Lightning Location Network (WWLLN; http://wwlln.net), a collaboration among over 50 universities and institutions, for providing the lightning location data used in this paper. The composite radar echo was provided by Japan Meteorological Agency.
The VLF electromagnetic observation network for the earthquake precursor study was operated by TN, MK, and JI. The analysis was conducted by TN, MK, JI, TS, and AS. The interpretation and discussion were conducted by TN, MK, JI, TS, AS, SS, and HK. All authors contributed in writing the text.
The equipment was developed with full support from the Ministry of Education, Culture, Sports, Science and Technology (MEXT) of Japan under its “The Second Earthquake and Volcano Hazards Observation and Research Program” (Earthquake and Volcano Hazard Reduction Research), which started in 2015, and Genesis Research Institute, Inc. The lightning analysis was supported partly by JSPS KAKENHI (Grant Number 20H02419).
SS and HK were employed by the company Genesis Research Institute, Inc.
The remaining authors declare that the research was conducted in the absence of any commercial or financial relationships that could be construed as a potential conflict of interest.
The AIC software was provided by T. Takanami. The authors thank E. Arakawa (Tokyo Gakugei University), K. Motojima (Gunma University), M. Ozaki (Kanazawa University), T. Yamabe and Y. Enomoto (Shinshu University) for maintaining the observation. The authors' thanks are extended to H. Baba for his useful advice through the research.
The Supplementary Material for this article can be found online at: https://www.frontiersin.org/articles/10.3389/feart.2021.658825/full#supplementary-material
Akaike, H. (1974). A New Look at the Statistical Model Identification. IEEE Trans. Automat. Contr. 19, 716–723. doi:10.1109/tac.1974.1100705
Asada, T., Baba, H., Kawazoe, M., and Sugiura, M. (2001). An Attempt to Delineate Very Low Frequency Electromagnetic Signals Associated with Earthquakes. Earth Planet. Sp. 53, 55–62. doi:10.1186/bf03352362
Dowden, R. L., Brundell, J. B., and Rodger, C. J. (2002). VLF Lightning Location by Time of Group Arrival (TOGA) at Multiple Sites. J. Atmos. Solar-Terrestrial Phys. 64 (7), 817–830. doi:10.1016/s1364-6826(02)00085-8
Fraser-Smith, A. C., Bernardi, A., McGill, P. R., Ladd, M. E., Helliwell, R. A., and Villard, O. G. (1990). Low-frequency Magnetic Field Measurements Near the Epicenter of the Ms7.1 Loma Prieta Earthquake. Geophys. Res. Lett. 17, 1465–1468. doi:10.1029/gl017i009p01465
Gokhberg, M. B., Morgounov, V. A., Yoshino, T., and Tomizawa, I. (1982). Experimental Measurement of Electromagnetic Emissions Possibly Related to Earthquakes in Japan. J. Geophys. Res. 87 (B9), 7824–7828. doi:10.1029/jb087ib09p07824
Holzworth, R. H., McCarthy, M. P., Brundell, J. B., Jacobson, A. R., and Rodger, C. J. (2019). Global Distribution of Superbolts. J. Geophys. Res. Atmos. 124, 9996–10005. doi:10.1029/2019jd030975
Izutsu, J. (2007). Influence of Lightning on the Observation of Seismic Electromagnetic Wave Anomalies. Terr. Atmos. Ocean. Sci. 18 (5), 923–950. doi:10.3319/tao.2007.18.5.923(t)
Izutsu, J., and Oike, K. (2003). The Waveforms of VLF Electromagnetic Waves Recorded at the Time of the 1995 Hyogo-Ken Nanbu Earthquake. Proc. Jpn. Acad. Ser. B. 79B, 125–130. doi:10.2183/pjab.79b.125
Nagao, T., Enomoto, Y., Fujinawa, Y., Hata, M., Hayakawa, M., Huang, Q., et al. (2002). Electromagnetic Anomalies Associated with 1995 KOBE Earthquake. J. Geodynamics. 33, 401–411. doi:10.1016/s0264-3707(02)00004-2
Nagao, T., Kamogawa, M., Izutsu, J., Baba, H., Narushima, T., Takamura, N., et al. (2016). First Report of the Electromagnetic Wave Detection System in VLF Range, Tokai University-Proven for the Existence of Preseismic Phenomena-. Bull. Inst. Oceanic Res. Develop. 37, 29–36.
Nagao, T., Kamogawa, M., and Uyeda, S. (2019). “Earthquake Precursors and Prediction,” in Encyclopedia of Solid Earth Geophysics. Encyclopedia of Earth Sciences Series. Editor H. Gupta (Berlin, Germany: Springer).
Oike, K., and Ogawa, T. (1986). Electromagnetic Radiations from Shallow Earthquakes Observed in the LF Range. J. Geomagn. Geoelec. 38, 1031–1040. doi:10.5636/jgg.38.1031
Oike, K., and Yamada, T. (1994). “Relationship between Shallow Earthquakes and Electromagnetic Noises in the LF and VLF Ranges,” in Electromagnetic Phenomena Related to Earthquake Prediction. Editors M. Hayakawa, and Y. Fujinawa (Tokyo, Japan: Terrapub), 115–130.
Takanami, T., and Kitagawa, G. (1991). Estimation of the Arrival Times of Seismic Waves by Multivariate Time Series Model. Ann. Inst. Statist. Math. 43 (3), 407–433. doi:10.1007/bf00053364
Takanami, T., and Kitagawa, G. (1988). A New Efficient Procedure for the Estimation of Onset Times of Seismic Waves. J. Phys. Earth. 36, 267–290. doi:10.4294/jpe1952.36.267
Warwick, J. W., Stoker, C., and Meyer, T. R. (1982). Radio Emission Associated with Rock Fracture: Possible Application to the Great Chilean Earthquake of May 22, 1960. J. Geophys. Res. 87, 2851–2859. doi:10.1029/JB087iB04p02851
Keywords: earthquake prediction, precursor, VLF, AIC, lightning
Citation: Nagao T, Kamogawa M, Izutsu J, Suzuki T, Saito A, Sugiura S and Kondo H (2021) Development and Preliminary Analysis of a VLF-Band Electromagnetic-Wave Observation System for Short-Term Earthquake Precursory Monitoring. Front. Earth Sci. 9:658825. doi: 10.3389/feart.2021.658825
Received: 27 January 2021; Accepted: 29 April 2021;
Published: 14 May 2021.
Edited by:
Dimitar Ouzounov, Chapman University, United StatesReviewed by:
Pier Francesco Biagi, University of Bari Aldo Moro, ItalyCopyright © 2021 Nagao, Kamogawa, Izutsu, Suzuki, Saito, Sugiura and Kondo. This is an open-access article distributed under the terms of the Creative Commons Attribution License (CC BY). The use, distribution or reproduction in other forums is permitted, provided the original author(s) and the copyright owner(s) are credited and that the original publication in this journal is cited, in accordance with accepted academic practice. No use, distribution or reproduction is permitted which does not comply with these terms.
*Correspondence: Toshiyasu Nagao, bmFnYW9Ac2NjLnUtdG9rYWkuYWMuanA=
Disclaimer: All claims expressed in this article are solely those of the authors and do not necessarily represent those of their affiliated organizations, or those of the publisher, the editors and the reviewers. Any product that may be evaluated in this article or claim that may be made by its manufacturer is not guaranteed or endorsed by the publisher.
Research integrity at Frontiers
Learn more about the work of our research integrity team to safeguard the quality of each article we publish.