 Anne Obermann
 Elmer Ruigrok
 Irene Bianchi
 György Hetényi
- 1Swiss Seismological Service, ETH Zurich, Zurich, Switzerland
- 2Royal Netherlands Meteorological Institute, De Bilt, Netherlands
- 3Istituto Nazionale di Geofisica e Vulcanologia, Rome, Italy
- 4Institute of Meteorology and Geophysics, University of Vienna, Vienna, Austria
- 5Institute of Earth Sciences, University of Lausanne, Lausanne, Switzerland
We use a novel technique named global-phase seismic interferometry (GloPSI) to image the lithospheric structure, and in particular the Moho, below two parallel north-south transects belonging to the GANSSER network (2013–2014). The profiles cross the Himalayan orogenic wedge in Bhutan, a tectonically important area within the largest continent-continent collision zone on Earth that is still undergoing crustal thickening and represents a challenging imaging target for the GloPSI approach. GloPSI makes use of direct waves from distant earthquakes and receiver-side reverberations with near vertical incidence. Reflections are isolated from earthquake recordings by solving a correlation integral and are turned into a reflectivity image of the lithosphere below the arrays. Our results compare favorably with first-order features observed from a previous receiver function (RF) study. We show that a combined interpretation of GloPSI and RF results allows for a more in-depth understanding of the lithospheric structure across the orogenic wedge in Bhutan.
Introduction
The temporary passive seismic experiment GANSSER (Geodynamics ANd Seismic Structure of the Eastern Himalaya Region) continuously recorded seismic data from a total of 37 broadband stations in Bhutan from January 2013 to November 2014. It was the first seismological project to address the lithospheric structure across the eastern third of the Himalayas. This is of interest because the segment beneath Bhutan is the only segment along the Himalayan collision belt where a basement uplift in the foreland, the Shillong Plateau, reaches high elevation, as a result of exhumation since the Pliocene (Biswas et al., 2007; Najman et al., 2016), and the region features mostly strike-slip mechanism earthquakes (Drukpa et al., 2006), unlike the Central Himalaya. Bhutan’s structural segment boundaries within the Himalayas are highlighted both by gravity anomaly residuals and by orogen-crossing mid- to lower crustal seismicity of the underthrusting plate (Hammer et al., 2013; Hetenyi et al., 2016a; Diehl et al., 2017). Both the Bhutan Himalayas and the Shillong Plateau can accommodate great earthquakes, as witnessed by the 1714 and 1897 events, respectively (Bilham and England, 2001; Berthet et al., 2014; Hetenyi et al., 2016b, 2018; Le Roux-Mallouf et al., 2016). However, as demonstrated by Coulomb stress modeling, the two regions are seismotectonically less linked than previously proposed (Grujic et al., 2018).
The structure of the orogenic wedge in Bhutan features the Main Himalayan Thrust (MHT), along which the underthrusting plate slides beneath the Himalaya. This is similar to the rest of the mountain belt, however, both the Moho and the MHT geometry present lateral variations between West and East Bhutan, over a distance of ca. 180 km (Singer et al., 2017a), as well as when compared to other cross-sections across the orogen (Subedi et al., 2018). On receiver function (RF) images by Singer et al. (2017a), in the West (along 89.5–90°E) the Moho is at ca. 50 km depth at the front of the orogen in the south, and turns into a ramp ca. 70 km further north. The MHT is less clear, but is at roughly 15 km depth and turns into a ramp, in such a way that the underthrusting crust keeps a constant thickness. The trend at depth of the MHT, and the consequent separation between the over and underthrusted crusts is largely consistent with the thermokinematic modeling results of Coutand et al. (2014). In the East (around 91.5°E), the Moho is at 50 km depth at the front of the orogeny as well, but appears sub-horizontal beneath Bhutan, and steepens gently farther north to connect to deeper Moho segments beneath southern Tibet (Shi et al., 2015). The MHT is somewhat shallower than in the West, being located at ca. 12 km depth. The intra-crustal microseismicity also varies laterally: while it is well focused along the MHT in the East, it is more diffuse and is partly “shifted” below the MHT in the West (Diehl et al., 2017), which corresponds well with the pattern of interseismic coupling obtained from GPS observations (Marechal et al., 2016). Both, the Western and the Eastern line RF images include intra-crustal converters beneath the MHT, which are not constrained by surface geology. These features can result from the deformational Himalayan orogeny (Singer et al., 2017a) or may be inherited elements of the underthrusting plate or terrain. In the upper part of the orogenic wedge, ambient noise tomography from the same seismic network data shows shear-wave anomalies that are well correlated with the tectonic structures known from structural geology at the surface (Singer et al., 2017b).
Here, we exploit data from the GANSSER network for an application of the global-phase seismic interferometry (GloPSI) method (Ruigrok and Wapenaar, 2012; Frank et al., 2014; Bianchi et al., 2021). The main aim is to image the Moho below the two parallel north-south transects crossing the Himalayan orogenic wedge in Bhutan, based on P-wave reflectivity, and to compare it with the RF observations (P- to S-wave conversions). GloPSI makes use of phase arrivals and their receiver-side reverberations from earthquakes at epicental distances of 120–180° (Figure 2). These phases impinge on the lithosphere from below with small angles of incidence. The method hereby assumes horizontal and slightly dipping reflectors that extend at least as far as the diameter of the Fresnel volume. The maximum dip that can be imaged with GloPSI, is heavily dependent on the illumination. If there is “full” illumination with global phases, that is good coverage from ray-parameter p = 0 until p = 0.04 s/km, then the maximum dip that can be imaged is around 14° for reflectors in the lower crust [phi = arcsin(pv), where v is the velocity in the lower crust]. The reflections are isolated from the earthquake recordings with auto-correlation and stacking. For more details on the SI theory illustrated with modeling, please refer to, e.g., Frank et al. (2014), Draganov et al. (2006); Ruigrok et al. (2008), and Ruigrok et al. (2010). With a migration step, the resulting reflection responses are turned into a reflectivity image of the lithosphere below the arrays. In this way, we use a different, independent waveform set to study the Moho. The challenge is twofold: how does GloPSI perform in an environment of relatively thick crust, with traces and imprints of orogenic deformation, and how feasible is it to retrieve useful signals from a relatively small-aperture profile with a small number of, but densely spaced stations, compared to typical GloPSI processing.
Data and Methods
Data
We use 16 months of seismic data records collected from the temporary GANSSER network in Bhutan (data1) between January 2013 and November 2014. The stations operated in continuous recording mode, at 100 samples per second, and data recovery rate exceeded 90%. To work along densely spaced profiles, we selected data from the 28 three-component broadband seismometers that were set up along two almost straight, north-south arrays across the Himalayan orogenic wedge in Western (16 stations along a 116 km deployment) and Eastern (12 stations along a 98 km deployment) Bhutan, respectively (Figure 1A). Station spacing was as equidistant and linear as access and local conditions allowed. All stations operated for 16 months, and about a third of the stations for the full 22 months.
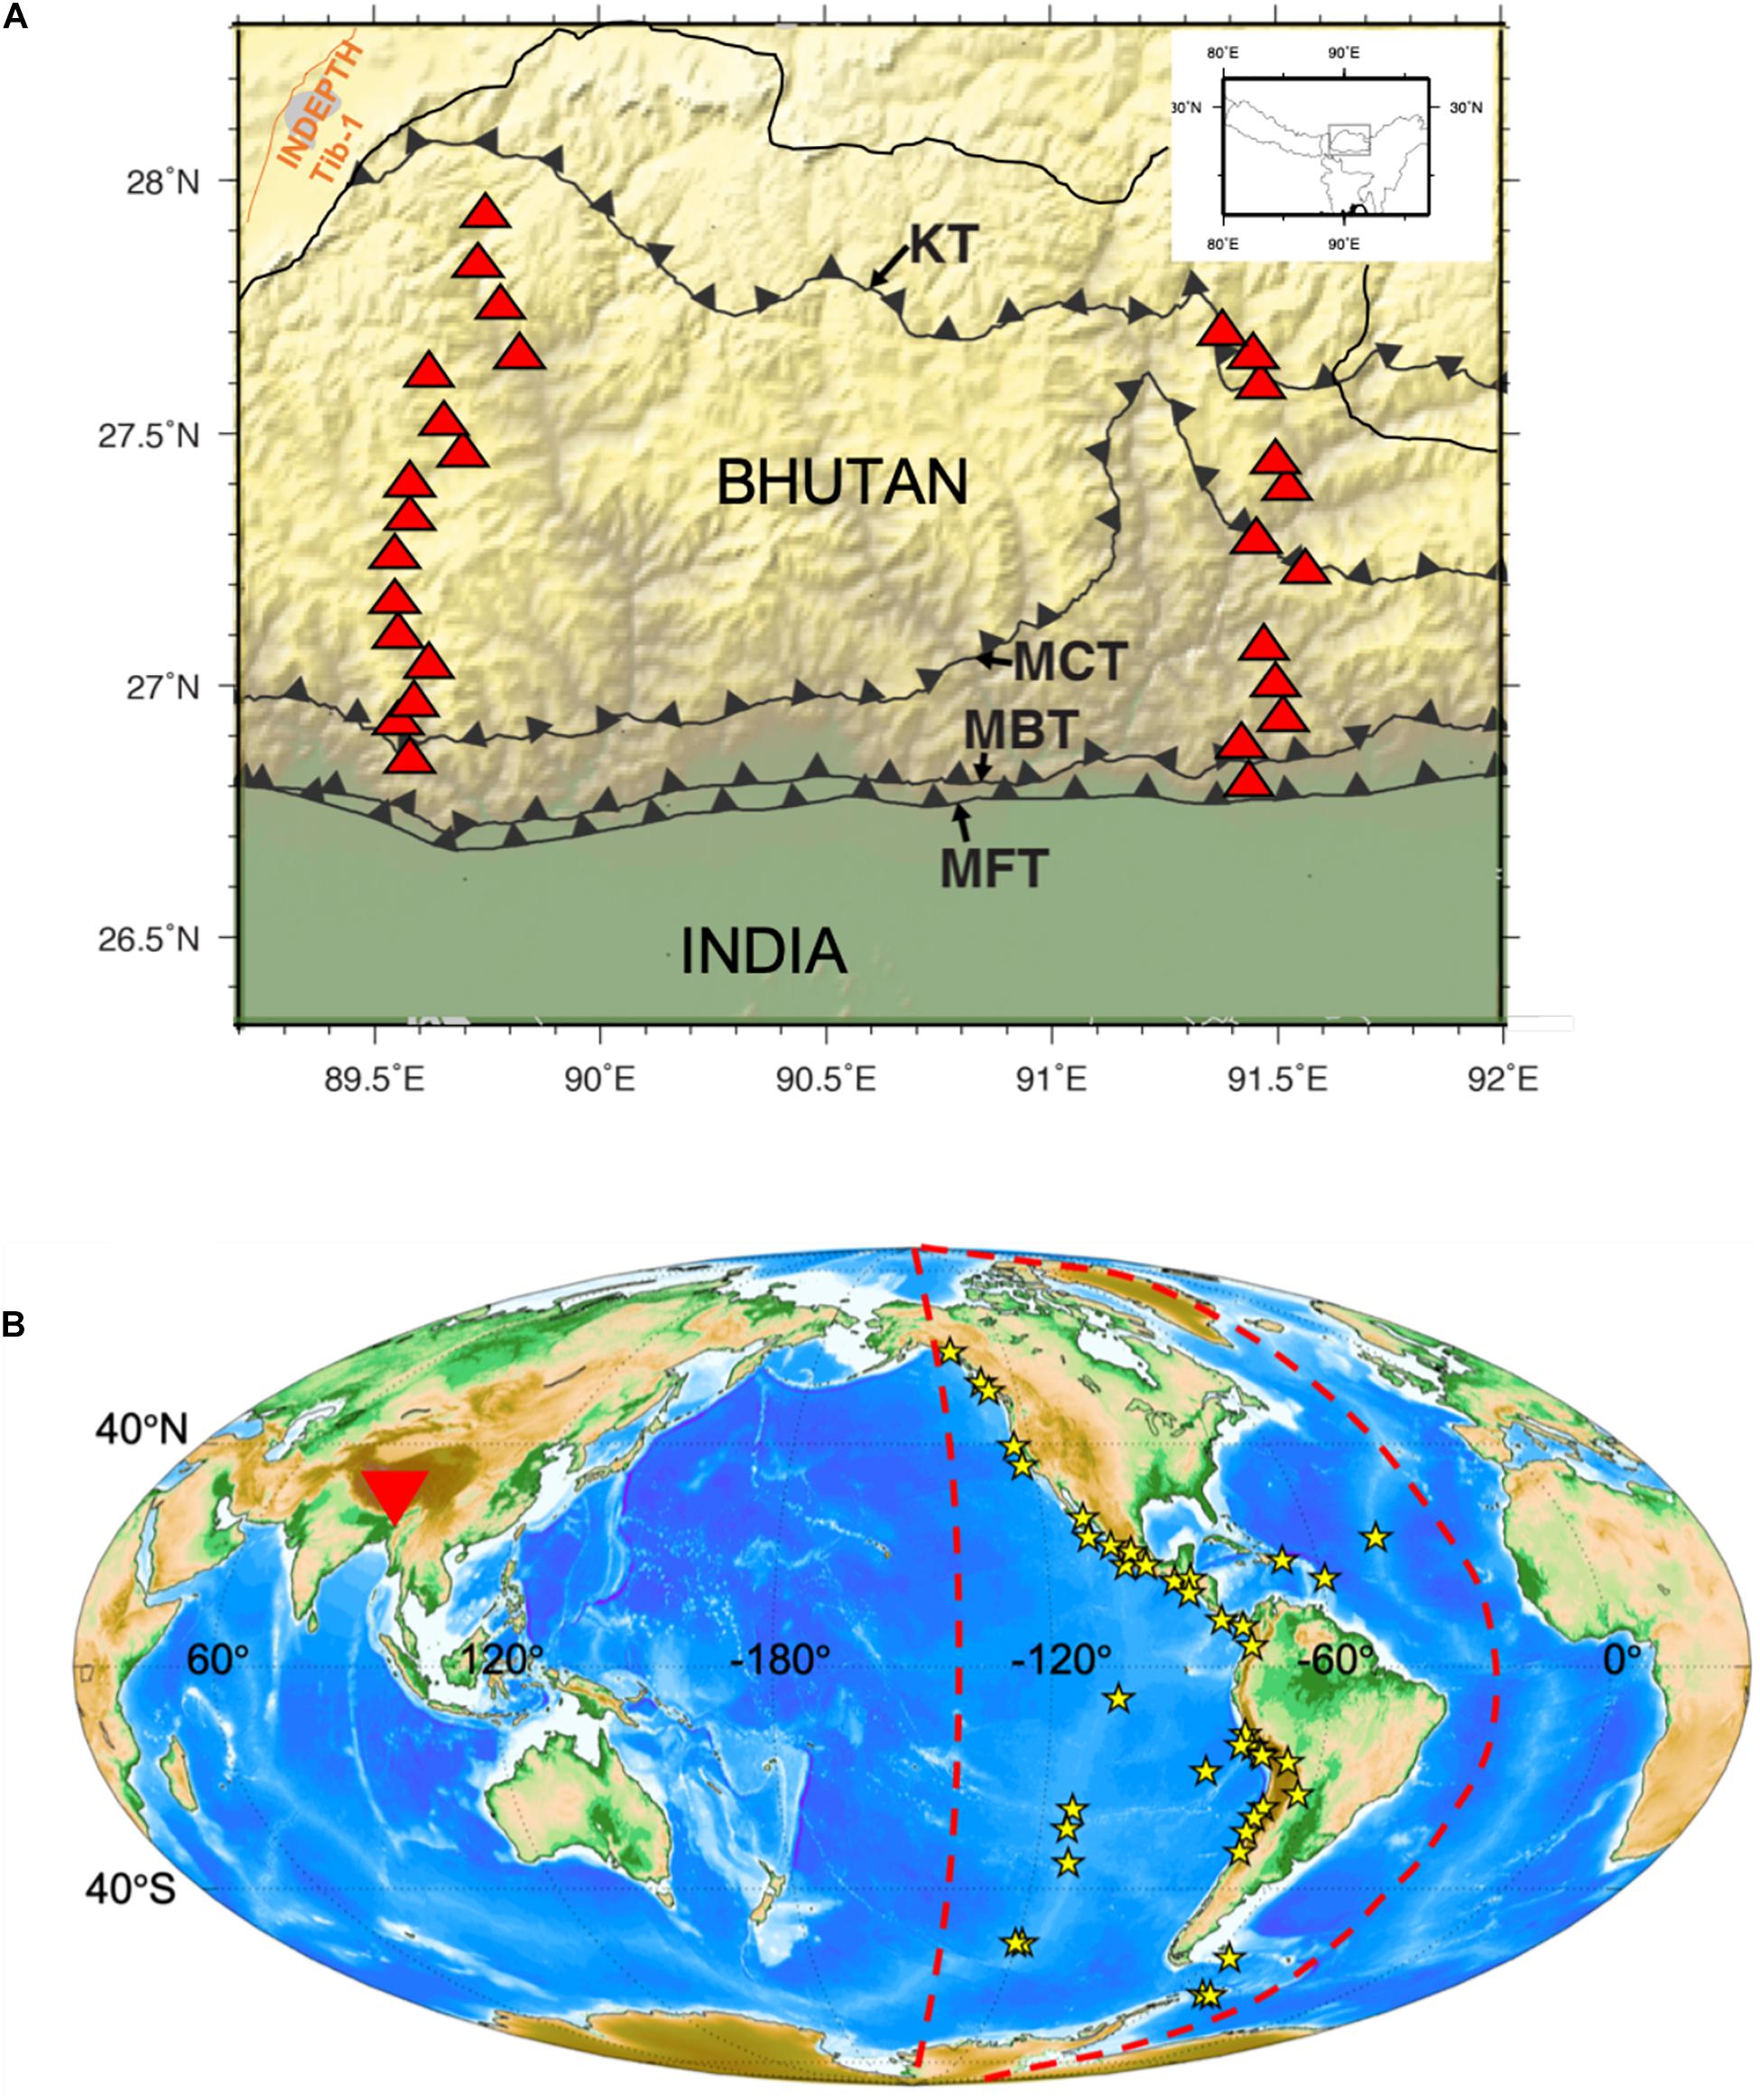
Figure 1. (A) Temporary seismic network stations (red triangles) from the GANSSER project in Bhutan selected for GloPSI application in this study. Main thrust faults are shown on the map: Main Frontal Thrust (MFT), the Main Boundary Thrust (MBT), Main Central Thrust (MCT), and Kakhtang Thrust (KT). The brown line, northwest of Bhutan, indicates the location of the wide-angel reflection profile Tib-1 of the INDEPTH project (e.g., Hauck et al., 1998). (B) Selected earthquakes (yellow stars) at epicentral distances of 120–180° (red dashed lines) from Bhutan (red triangle) with a sufficiently high signal-to-noise ratio. We found 59 earthquakes with M > 6.0 that satisfy these criteria.
In the raw seismic records, we looked for direct waves that reach the GANSSER array while traveling through the Earth’s core. We are therefore interested in large magnitude M > 6 seismic events occurring between 120 and 180° epicentral distance, at any depth range (Figures 1B, 2). For this purpose, we created a list of events occurring within the region of interest from January 2013 to November 2014 from the EMSC website2. We then visually selected waveforms with clear P-wave arrivals. For this purpose, we plotted each event for all stations and discarded unclear traces or entire events. We selected 59 earthquakes with M > 6 (Supplementary Table 1), in the desired epicentral distance range (Figure 1B). For each earthquake we selected a time window of 50 s in length, starting at the first arrival (PKiKP, PKP, or PKIKP, Stein and Wysession, 2009) and containing subsequent reverberations in the lithosphere. To limit the occurrence of cross-terms in the autocorrelations that might appear if PKIKP and PKP phase responses are simultaneously present, we use only time windows with one single dominant phase response.
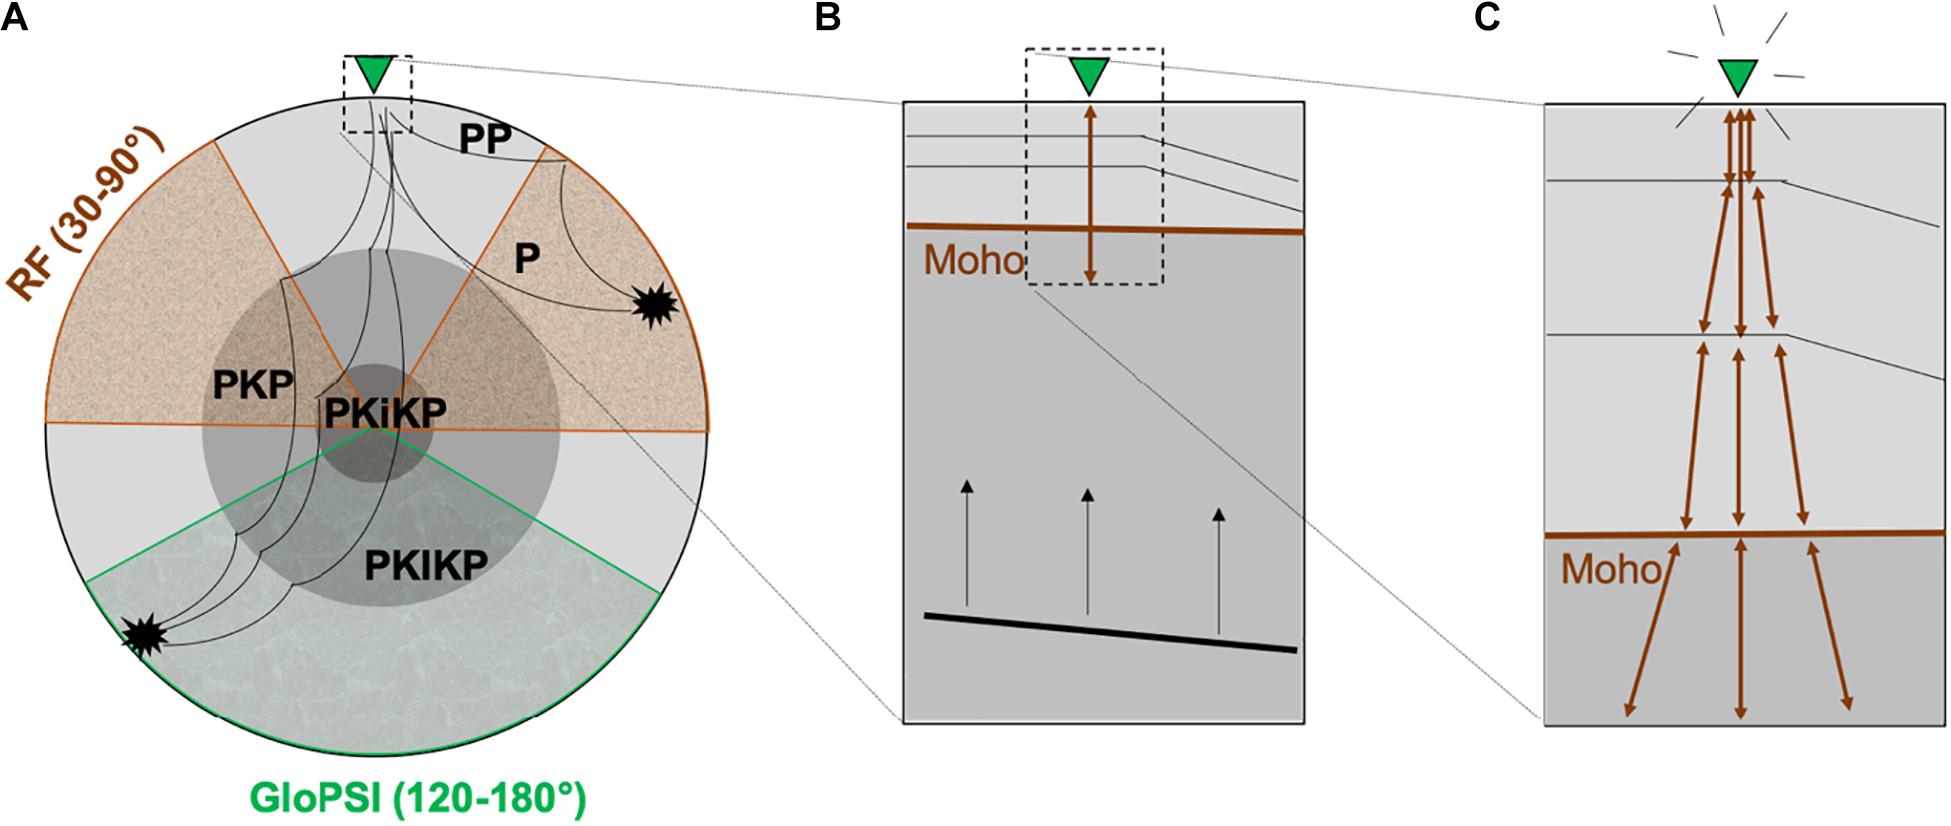
Figure 2. (A) Illustration of raypaths (black lines) between a source (black star) and a receiver (green triangle) for the most prominent P phases. The typical epicentral distances for GloPSI and RF are marked with shading. (B) Close-up of the medium below the receiver, with a global phase wavefront just before it impinges on the lithosphere. (C) Illustration of exemplary zero-offset reflection responses used in GloPSI (modified from Ruigrok and Wapenaar, 2012).
Method
The selected phase responses have a good signal-to-noise ratio and at most, only four traces are missing per event. We can detect PKP over a large distance range, which should enable a stack of sufficient illumination angles to correctly estimate the timing of the main zero-offset reflections. The different data processing steps are subsequently described and illustrated below in Figure 3 for Western (left) and Eastern Bhutan (right).
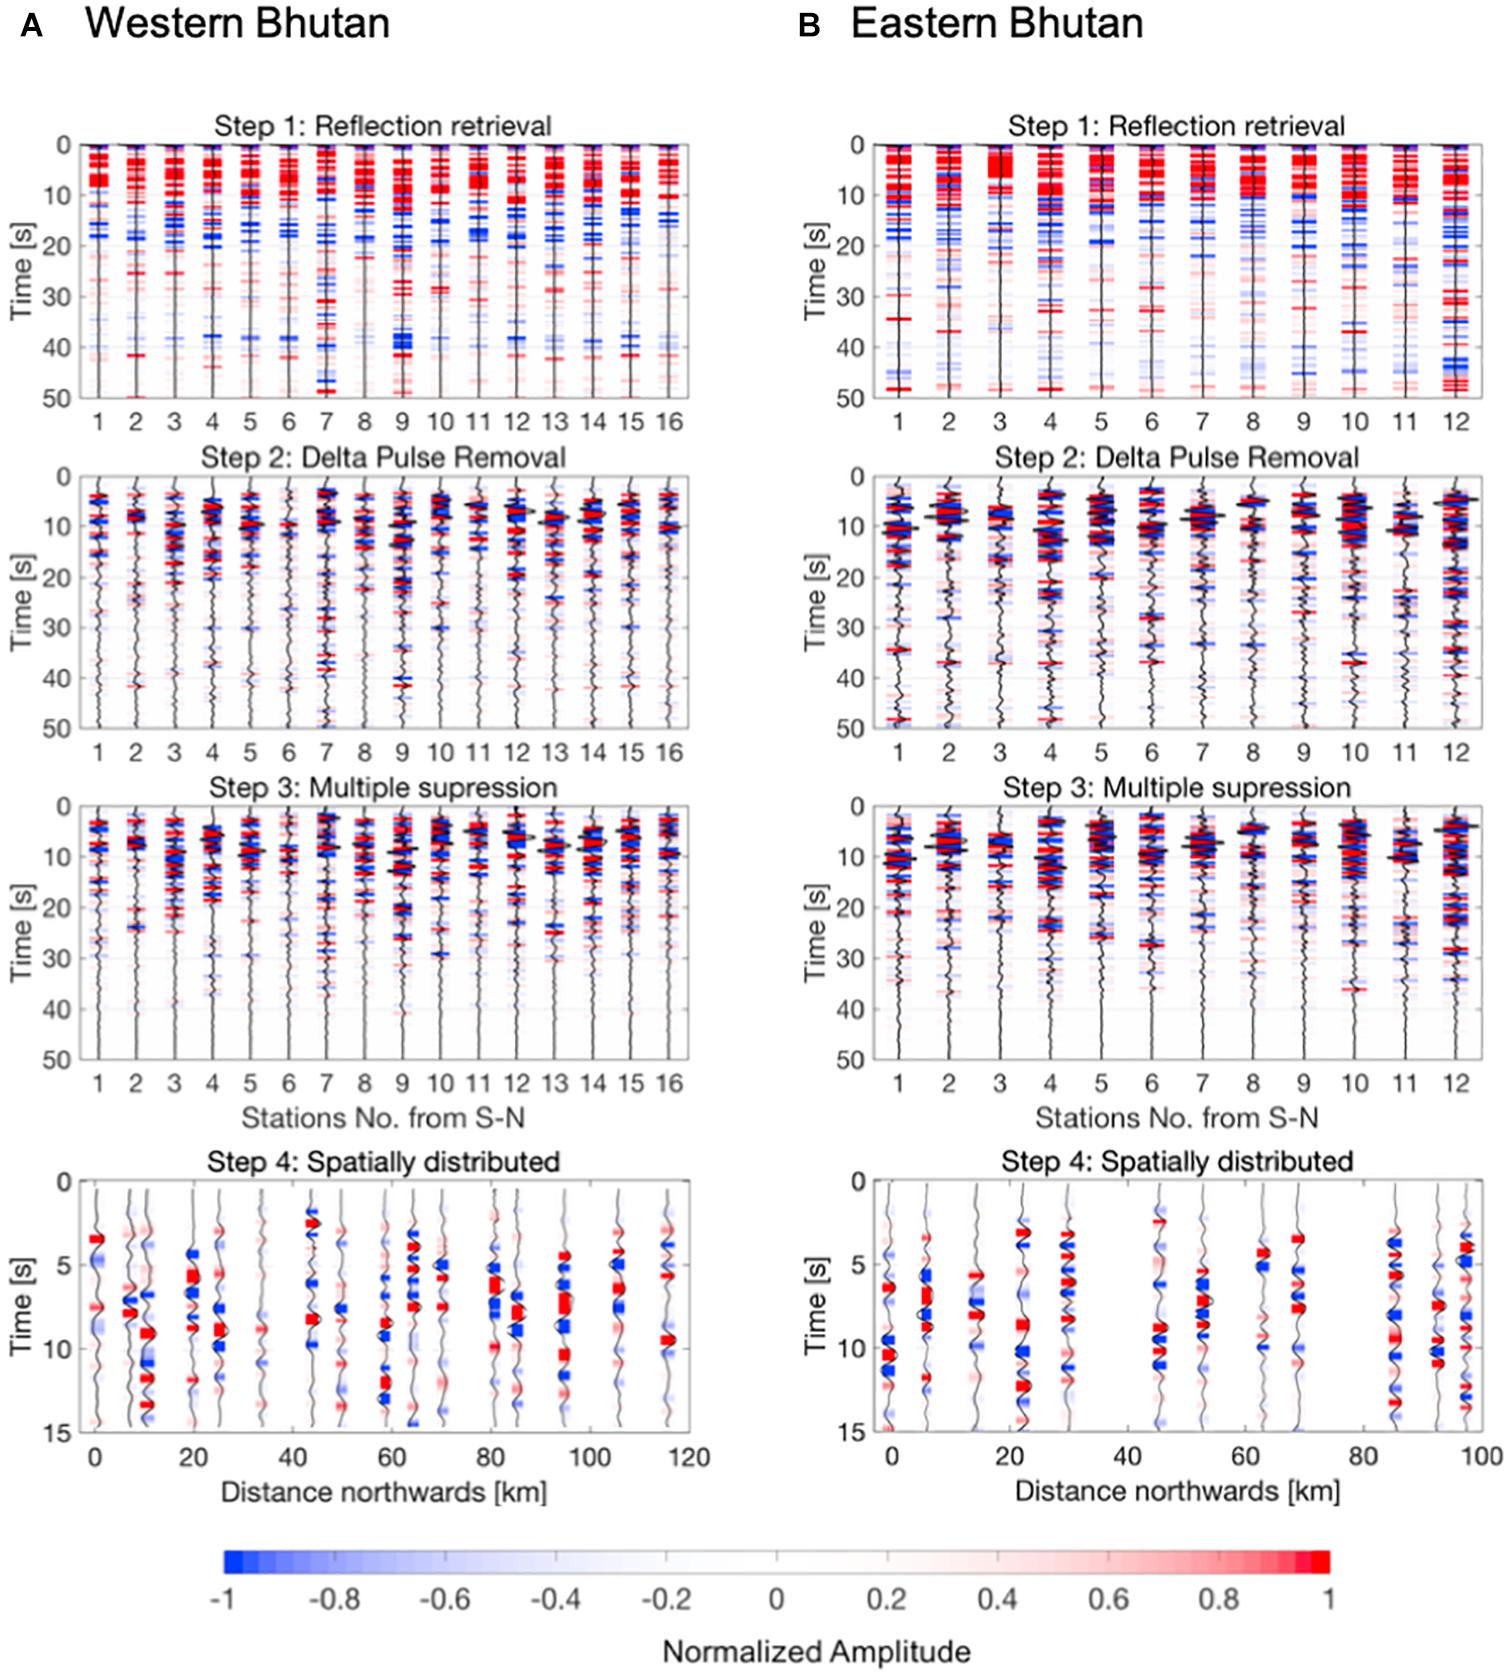
Figure 3. Data processing steps for the profiles in Western (A) and Eastern (B) Bhutan. After autocorrelation and stacking (step 1), the delta pulse is removed (step 2), and the multiples are suppressed (step 3). In step 4, the traces are shown with accurate spatial distribution for the first 15 s, which correspond to a depth of around 100 km. The amplitudes are normalized to the maximum value after each processing step, which causes the shift in colors after the delta pulse removal.
The first step is the application of seismic interferometry, which for GloPSI, amounts to the autocorrelation and stacking of selected time windows, and the flipping of the amplitudes (Figures 3 A1, B1). The Z-component records are used as a proxy for the P-wave transmission responses. For each phase, we apply a series of processing steps before stacking the autocorrelations. After loading an instrumentally deconvolved phase response, a mild spectral whitening is applied. This whitening function is implemented with a sliding frequency window. The large earthquakes that we typically use have a very low corner frequency. At larger frequencies, there is a significant drop in amplitudes. The whitening is thus necessary to boost the higher frequencies and to construct a reflection image with sufficient resolution. The upper limit can be selected at a frequency where there remains a sufficiently high signal-to-noise-ratio for all events. In our case, we applied a spectral whitening in the range of 0.01–1.4 Hz, with a sliding frequency window length of 0.12 Hz. The whitening from very low frequencies onward, boosts the direct P-wave pulse, which can be easily removed with a taper (Figures 3 A2, B2). Since this part of the signal is of a much higher amplitude than the following wiggles, the signal of interest with relatively lower amplitudes can be better seen after removal. Subsequently, a bandpass filter is applied between 0.2 and 1 Hz in order to remove the low frequency sidelobes and consequently discard the red-to-blue difference from crust to mantle that could be observed in Figures 3 A1, B1. Similar to the HiCLIMB dataset across Tibet (Ruigrok and Wapenaar, 2012), there were not enough phase responses to stack out the source-side reverberations completely. They were suppressed by substracting the scaled average trace over the array from each individual trace. This processing step introduces collateral damage which suppresses actual horizontal reflectors, if such reflector exists over a large part of the array. Hence, this step is not to be applied to the data for the interior of the continents. Average removal was not needed in Bianchi et al. (2021) who applied GloPSI to an array that was deployed for a similar duration.
We then apply a static correction and eliminate free-surface multiples at the receiver side (step3, Figures 3 A3, B3) following the method from Verschuur and Berkhout (1997). There could also be triplications of the PKP phase from the source side, or possibly over the D″ discontinuity. As long as the different triplications have a similar ray-parameter, their detrimental effect is also suppressed with this step. However, if there were multiple strong arrivals in one phase response with different angles of incidence, such a panel would need to be excluded from further analysis. Since no strong reflectors are observed beyond a 15 s delay time, in Figures 3 A4, B4, we show the traces with accurate spatial distribution for the first 15 s delay time only, which corresponds to a depth of ca. 100 km. This is also the depth range to which we migrate the reflectors (Figure 4). The limitation to the top 100 km is not inherent to the GloPSI-technique, but a consequence of our spatially sparse data set. We would like to point out that during the processing, no further normalization is applied, except for the whitening. Over the array, and over various depths, the relative amplitudes should be meaningful. However, imaging is done without loss correction and hence the amplitude distribution is somewhat biased in the direction of the middle and upper crust. In the frequency band we selected, there is a strong focus on the Moho and upper mantle. As a last step, the station-wise stacks are time-to-depth converted using the P-wave velocities of the same simplified 1D velocity model that was used by Singer et al. (2017a) for the RF depth migration. The model assumes a constant crustal Vp velocity gradient of 0.0118 s–1 starting from 5.9 km/s at the surface. The average Moho depth is set at around 50 km depth, with a Vp jump from 6.5 to 8 km/s. The mantle Vp gradient is then 0.0016 s–1. These gradients are based on a local minimum 1D Vp velocity model obtained from regional earthquakes (Diehl et al., 2017). The resultant first order lithospheric structure across the orogenic wedge in Western and Eastern Bhutan is shown in Figure 4. A depth of 100 km is reached after 14.3 s with the 1D Vp model.
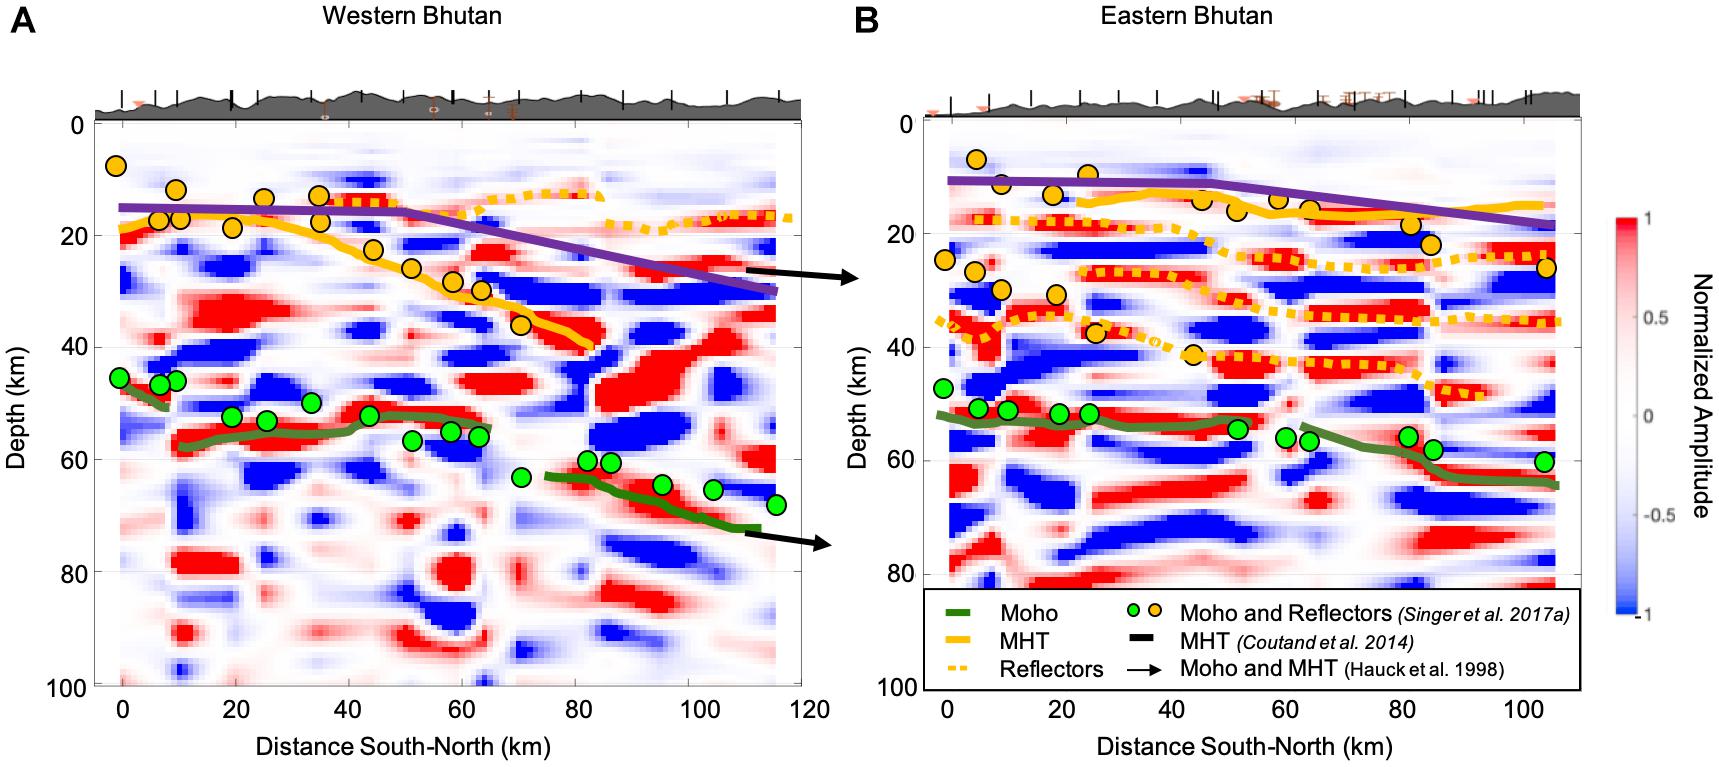
Figure 4. First-order lithospheric structure across the orogenic wedge in Western (A) and Eastern (B) Bhutan from the depth converted GloPSI reflections. The thick green line indicates the interpreted Moho reflector, the solid orange line the Main Himalayan Thrust (MHT) and dotted orange lines indicate intra-crustal reflectors. The orange and green circles are the interpreted RF converters from Singer et al. (2017a) for crustal interfaces and Moho, respectively. The thick violet line indicates the approximate location of the MHT from multi-thermochronologic data interpreted by Coutand et al. (2014). The black arrows in Western Bhutan show the extrapolated dip of the MHT and Moho, as interpreted from the seismic reflection profile INDEPTH Tib-1 by Hauck et al. (1998). On top of both profiles, the topography is shown and the vertical ticks mark the stations location.
Results and Interpretation
From the obtained final GloPSI images alone (Figure 4), it would be difficult to confidently interpret the depth and geometry of the reflectors. We recall that the methods’ strength lies in laterally tracing a physical parameter produced by material differences in the crust that produces a similar signal at depth. We cannot resolve fine structures, such as thin layering, but we can resolve larger structures that show continuity in space which can give us important information about the seismic facies. Moreover, because of the large station spacing and the inability to image steep dips, the lateral continuity is not accurately reproduced in the images. This could be potentially improved with more data. From the reflection retrieval, shown in Figure 3, step 1, we see a clear change in reflectivity at around 10 s which is an indicator of the boundary between the crust (mostly positive amplitudes) and the mantle (mostly negative amplitudes), for both Eastern and Western Bhutan. For the interpretation of structures, we show our migrated results together with the location of converter points identified in the RF study by Singer et al. (2017a) (shown as filled circles) in Figure 4. Thanks to these earlier observations, we can point to the two most prominent reflectors and interpret them, due to known interfaces, as being the Moho and the MHT, and also point to some reflectivity patterns within the crust. In Western Bhutan, the Moho can clearly be identified at around 50 km depth and is slightly dipping toward the North, in agreement with the flexural deepening of the downgoing plate. The shallowest clear horizon is seen at approximately 20 km depth, and is identified as the MHT, with a flat geometry in the East, and northward deepening in the West. In the East, the Moho reflector dips at a lower angle toward the North. The shallowest clear horizon interpreted as MHT is seen at approximately 15 km depth. Within the crust, there is a near parallel layering in the East, while such a pattern is not detected in the West. As a result of the comparison between the two techniques, with RF being especially sensitive to S-wave structure, and GloPSI being especially sensitive to P-wave structure, we can say:
1. The Moho is well visible in Eastern and Western Bhutan with both methods, with matching results. The two techniques corroborate each other for both the flat geometry of the Moho (southern parts of both profiles) and the slightly dipping parts (northern parts). The Moho kink is not so obvious from GloPSI; the Moho signal is indeed not visible between approximately 60 and 80 km profile distance (on the Western profile), while it is visible elsewhere. In a similar way, the Moho signal is fading between approximately 60 and 80 km distance along the Eastern profile.
With our image we support previous results (i.e., Hauck et al., 1998; Schulte-Pelkum et al., 2005; Singer et al., 2017a) in the identification of an inclined continuous Moho, instead of a stepped Moho due to imbricated crust (Hirn and Sapin, 1984; Molnar, 1988; Galvé et al., 2002).
2. The shallower reflectors (less than 20 km deep) are well visible in the GloPSI images, better than from the RF. These reflectors are likely linked to the MHT, the predominant intracrustal collision structure in the Himalaya orogen (Coutand et al., 2014). To the images (Figure 4, violet line), we added the MHT depth proposed by Coutand et al. (2014). The authors then collected multi-thermochronologic data at various points along similar profiles. In particular, in Eastern Bhutan, the depth and geometry of the MHT correlate well with our results. In Western Bhutan, we added the extrapolated reflectors obtained from the wide-angle seismic reflection profile INDEPTH Tib-1 (Figure 4A, black arrows) that was acquired in the Higher Himalayas (Hauck et al., 1998), northwest of Bhutan (Figure 1).
In Western Bhutan, the dip of the MHT and the presence of anisotropy associated to it, are structural reasons for preventing a good resolution of that feature by GloPSI, and might cause the discrepancy between the location of the MHT from different studies (yellow and purple lines in Figure 4A display some consistent offset). Schulte-Pelkum et al. (2005) interpreted the RF signals from the MHT in eastern Nepal as an anisotropic shear zone representing the upper crustal detachment zone. Singer et al. (2017a) instead imaged the MHT as a negative RF arrival and a ramp structure.
3. Intra-crustal reflectivity in Eastern Bhutan is stronger than in Western Bhutan, hinting at a difference in physical properties or deformational history of the crust penetrating beneath the orogenic wedge (Singer et al., 2017a). Although the flexural shape of the downgoing plate’s lithosphere seems to be similar between West and East Bhutan (Hammer et al., 2013; Hetenyi et al., 2016a), physical characteristics of the crust reflect spatially smaller scale properties, for which there is no clear information available, concerning their origins. We speculate that the reflectivity is inherited, but note that further research in the footsteps of e.g., Talwani et al. (2016) and Mallick et al. (2020) is required.
Discussion
With the use of temporary seismic network data and as few as 59 teleseismic events, the GloPSI approach allowed us to outline the main lithospheric structures of the Bhutan Himalaya along two transects. The interpretation was guided by earlier RF observations, however the GloPSI results provided confirmation and useful results. The main conclusion is that the incidence of the Moho and MHT geometry in the two sets of images suggests that P and S waves both yield coherent information about the structure.
A benefit of using GloPSI, is that it only exploits the vertical component of seismic records. Therefore, there is potential to use GloPSI on seismic networks that rely on one-component sensors, as long as these can record data in the required frequency band (1 s to at least 5 s). Larger aperture networks and a comparatively simple structural environment, complemented with permanent network data, likely increase the chances for GloPSI results to be interpreted alone, without RF or other prior data.
Among the drawbacks of GloPSI, one can note the (partial) loss of relative amplitude information during successive renormalization of waveforms. Moreover, the structure that can be imaged with GloPSI is more limited in space than with RF. With GloPSI, the main contribution comes from structure directly below the stations, whereas with RF, conversion points may be selected that are various distances away from the stations. Hence, for GloPSI, denser array deployments are needed in order to obtain laterally continuous images.
Orogenic regions tend to have strong lateral variability in elastic properties, and even if the incidence angles for GloPSI are closer to vertical than RF studies, the 3D effects should still be visible on the resulting images. The existence of accurate 3D velocity models and denser field arrays would overcome this limitation and allow for more advanced migration techniques. In most areas on Earth, the distribution of sources is more favorable for GloPSI than for RF methods to be applied.
Conclusion
From a methodological point of view, the analyses of RFs and global phase interferometry are complementary. Independent datasets in the form of earthquakes from different epicentral distances (RF 30–90°, GloPSI 120–180°) are used, providing complementary illumination and enhancing the coverage for greater interpretation capabilities.
Both methods use transmission responses with different incidence angles below the stations, and different sensitivities to S and P-wave velocity structures, which results in imaging overlap, but also partly exclusive, subsurface information. Combining GloPSI and RF with their individual weaknesses and strengths allows, in general, one to interpret lithospheric structure with a variety of network configurations. With two, rather short but densely spaced profiles across the Himalayan orogenic wedge in Bhutan, we observe a matching pattern of Moho and MHT geometry, as well as east-west differences in shapes and reflectivity patterns.
Data Availability Statement
The raw data supporting the conclusions of this article will be made available by the authors, without undue reservation.
Author Contributions
AO processed the data with codes from ER and wrote the initial version of the manuscript. IB and GH contributed to the interpretation and manuscript writing. All authors contributed to the article and approved the submitted version.
Funding
The deployment of the temporary seismic GANSSER network in Bhutan was funded by the Swiss National Science Foundation (SNF), Grant 200021-143467 (GH). The GANSSER acronym was chosen to commemorate the famous geologist Augusto Gansser (1910-2012). The instrumental pool of the SED and SEG groups at ETH Zurich provided the station hardware.
Conflict of Interest
The authors declare that the research was conducted in the absence of any commercial or financial relationships that could be construed as a potential conflict of interest.
Acknowledgments
We are grateful to the entire field team and the local population for their help in the field experiment, and for the ELAB colleagues from SED for their technical support. IB acknowledges the support of the Austrian Science Fund (FWF) Project J 4314-N29. We like to thank the two reviewers whose help improved the manuscript.
Supplementary Material
The Supplementary Material for this article can be found online at: https://www.frontiersin.org/articles/10.3389/feart.2021.658146/full#supplementary-material
Footnotes
References
Berthet, T., Ritz, J.-F., Ferry, M., Pelgay, P., Cattin, R., Drukpa, D., et al. (2014). Active tectonics of the eastern himalaya: new constraints from the first tectonic geomorphology study in southern bhutan. Geology 42, 427–430. doi: 10.1130/g35162.1
Bianchi, I., Ruigrok, E., Obermann, A., Kissling, E., and The AlpArray-EASI Working Group (2021). Moho topography beneath EASI profile in the Eastern European Alps by global phase seismic interferometry. Solid Earth. doi: 10.5194/se-2020-179
Bilham, R., and England, P. (2001). Plateau pop-up in the great 1897 Assam earthquake. Nature 410, 806–809. doi: 10.1038/35071057
Biswas, S., Coutand, I., Grujic, D., Hager, C., Stöckli, D., and Grasemann, B. (2007). Exhumation and uplift of the shillong plateau and its influence on the eastern himalayas: New constraints from apatite and zircon (U-Th-[Sm])/He and apatite fission track analyses. Tectonics 26:TC6013.
Coutand, I., Whipp, D. M. Jr., Grujic, D., Bernet, M., Fellin, M. G., Bookhagen, B., et al. (2014). Geometry and kinematics of the main himalayan thrust and neogene crustal exhumation in the bhutanese himalaya derived from inversion of multithermochronologic data. J. Geophys. Res. Solid Earth 119, 1446–1481. doi: 10.1002/2013jb010891
Diehl, T., Singer, J., Heteìnyi, G., Grujic, D., Clinton, J., Giardini, D., et al. (2017). Seismotectonics of bhutan: evidence for segmentation of the Eastern Himalayas and link to foreland deformation. Earth Planet. Sci. Lett. 471, 54–64. doi: 10.1016/j.epsl.2017.04.038
Draganov, D., Wapenaar, K., and Thorbecke, J. (2006). Seismic interferometry: reconstructing the earth’s reflection response. Geophysics 71, SI61–SI70.
Drukpa, D., Velasco, A. A., and Doser, D. I. (2006). Seismicity in the Kingdom of Bhutan (1937–2003): evidence for crustal transcurrent deformation. J. Geophys. Res. Solid Earth 111:B06301.
Frank, J. G., Ruigrok, E. N., and Wapenaar, K. (2014). Shear wave seismic interferometry for lithospheric imaging: applications to southern Mexico. J. Geophys. Res. Solid Earth 119, 5713–5726.
Galvé, A., Sapin, M., Hirn, A., Diaz, J., Lépine, J. C., Laigle, M., et al. (2002). Complex images of Moho and variation of Vp/Vs across the Himalaya and South Tibet, from a joint receiver-function and wide-angle-reflection approach. Geophys. Res. Lett. 29:2182.
Grujic, D., Heteìnyi, G., Cattin, R., Baruah, S., Benoit, A., Drukpa, D., et al. (2018). Stress transfer and connectivity between the bhutan himalaya and the shillong plateau. Tectonophysics 744, 322–332. doi: 10.1016/j.tecto.2018.07.018
Hammer, P., Berthet, T., Heteìnyi, G., Cattin, R., Drukpa, D., Chophel, J., et al. (2013). Flexure of the India plate underneath the Bhutan Himalaya. Geophys. Res. Lett. 40, 4225–4230. doi: 10.1002/grl.50793
Hauck, M. L., Nelson, K. D., Brown, L. D., Zhao, W., and Ross, A. R. (1998). Crustal structure of the Himalayan orogen at ∼90° east longitude from Project INDEPTH deep reflection profiles. Tectonics 17, 481–500. doi: 10.1029/98TC01314
Hetenyi, G., Cattin, R., and Drukpa, D. (2018). Bhutan earthquake opens doors to geophysical studies. Eos 100, 26–31. doi: 10.1029/2018EO103055
Hetenyi, G., Cattin, R., Berthet, T., Le Moigne, N., Chophel, J., Lechmann, S., et al. (2016a). Segmentation of the himalayas as revealed by arc-parallel gravity anomalies. Sci. Rep. 6:33866.
Hetenyi, G., Le Roux-Mallouf, R., Berthet, T., Cattin, R., Cauzzi, C., Phuntsho, K., et al. (2016b). Joint approach combining damage and paleoseismology observations constrains the 1714 AD Bhutan earthquake at magnitude 8±0.5. Geophys. Res. Lett. 43, 10695–10702.
Hirn, A., and Sapin, M. (1984). The Himalayan zone of crustal interaction; suggestions from explosion seismology. Ann. Geophys. 2, 123–130.
Le Roux-Mallouf, R., Ferry, M., Ritz, J.-F., Berthet, T., Cattin, R., and Drukpa, D. (2016). First paleoseismic evidence for great surface-rupturing earthquakes in the Bhutan Himalayas. J. Geophys. Res. Solid Earth 121, 7271–7283. doi: 10.1002/2015jb012733
Mallick, R., Hubbard, J. A., Lindsey, E. O., Bradley, K. E., Moore, J. D., Ahsan, A., et al. (2020). Subduction initiation and the rise of the Shillong Plateau. Earth Planet. Sci. Lett. 543:116351. doi: 10.1016/j.epsl.2020.116351
Marechal, A., Mazzotti, S., Cattin, R., Cazes, G., Vernant, P., Drukpa, D., et al. (2016). Evidence of interseismic coupling variations along the Bhutan Himalayan arc from new gps data. Geophys. Res. Lett. 43, 399–312.
Molnar, P. (1988). A review of geophysical constraints on the deep structure of theTibetan Plateau, the Himalaya and the Karakoram, and their geophysicalimplications. Phil. Trans. R. Soc. Lond. A 326, 33–88. doi: 10.1098/rsta.1988.0080
Najman, Y., Bracciali, L., Parrish, R. R., Chisty, E., and Copley, A. (2016). Evolving strain partitioning in the Eastern Himalaya: the growth of the shillong plateau. Earth Planet. Sci. Lett. 433, 1–9. doi: 10.1016/j.epsl.2015.10.017
Ruigrok, E., and Wapenaar, K. (2012). Global-phase seismic interferometry unveils P-wave reflectivity below the Himalayas and Tibet. Geophys. Res. Lett. 39:11303.
Ruigrok, E., Campman, X., Draganov, D., and Wapenaar, K. (2010). High-resolution lithospheric imaging with seismic interferometry. Geophys. J. Int. 183, 339–357. doi: 10.1111/j.1365-246x.2010.04724.x
Ruigrok, E., Draganov, D., and Wapenaar, K. (2008). Global-scale seismic interferometry: theory and numerical examples. Geophys. Prospect. 56, 395–417. doi: 10.1111/j.1365-2478.2008.00697.x
Schulte-Pelkum, V., Monsalve, G., Sheehan, A., Pandey, M. R., Sapkota, S., Bilham, R., et al. (2005). Imaging the Indian subcontinent beneath the Himalaya. Nature, 435, 1222–1225. doi: 10.1038/nature03678
Shi, D., Wu, Z., Klemperer, S. L., Zhao, W., Xue, G., and Su, H. (2015). Receiver function imaging of crustal suture, steep subduction, and mantle wedge in the eastern india–tibet continental collision zone. Earth Planet. Sci. Lett. 414, 6–15. doi: 10.1016/j.epsl.2014.12.055
Singer, J., Kissling, E., Diehl, T., and Heteìnyi, G. (2017a). The underthrusting indian crust and its role in collision dynamics of the Eastern Himalaya in Bhutan: insights from receiver function imaging. J. Geophys. Res. Solid Earth 122, 1152–1178. doi: 10.1002/2016jb013337
Singer, J., Obermann, A., Kissling, E., Fang, H., Heteìnyi, G., and Grujic, D. (2017b). Along-strike variations in the himalayan orogenic wedge structure in Bhutan from ambient seismic noise tomography. Geochem. Geophys. Geosyst. 18, 1483–1498. doi: 10.1002/2016gc006742
Stein, S., and Wysession, M. (2009). An Introduction to Seismology, Earthquakes, and Earth Structure. Hoboken, NJ: John Wiley & Sons.
Subedi, S., Heteìnyi, G., Vergne, J., Bollinger, L., Lyon-Caen, H., Farra, V., et al. (2018). Imaging the moho and the main himalayan thrust in western nepal with receiver functions. Geophys. Res. Lett. 45, 13222–13230.
Talwani, M., Desa, M. A., Ismaiel, M., and Krishna, K. S. (2016). The tectonic origin of the Bay of Bengal and Bangladesh. J. Geophys. Res. Solid Earth 121, 4836–4851. doi: 10.1002/2015jb012734
Keywords: Bhutan, Himalaya, global-phase seismic interferometry, Moho, Main Himalayan Thrust
Citation: Obermann A, Ruigrok E, Bianchi I and Hetényi G (2021) Constraining the Moho Depth Below Bhutan With Global-Phase Seismic Interferometry. Front. Earth Sci. 9:658146. doi: 10.3389/feart.2021.658146
Received: 25 January 2021; Accepted: 31 March 2021;
Published: 26 April 2021.
Edited by:
Pascal Audet, University of Ottawa, CanadaReviewed by:
Eric Sandvol, University of Missouri, United StatesFlorian Millet, University of Cambridge, United Kingdom
Copyright © 2021 Obermann, Ruigrok, Bianchi and Hetényi. This is an open-access article distributed under the terms of the Creative Commons Attribution License (CC BY). The use, distribution or reproduction in other forums is permitted, provided the original author(s) and the copyright owner(s) are credited and that the original publication in this journal is cited, in accordance with accepted academic practice. No use, distribution or reproduction is permitted which does not comply with these terms.
*Correspondence: Anne Obermann, YW5uZS5vYmVybWFubkBzZWQuZXRoei5jaA==