 Jieming Chou
 Weixing Zhao
 Jiangnan Li
 Yuan Xu
 Fan Yang
 Mingyang Sun
 Yuanmeng Li
94% of researchers rate our articles as excellent or good
Learn more about the work of our research integrity team to safeguard the quality of each article we publish.
Find out more
ORIGINAL RESEARCH article
Front. Earth Sci. , 22 April 2021
Sec. Interdisciplinary Climate Studies
Volume 9 - 2021 | https://doi.org/10.3389/feart.2021.655128
This article is part of the Research Topic Advances in Global Warming Observations and their Uncertainties View all 17 articles
Scientific prediction of critical time points of the global temperature increases and assessment of the associated changes in extreme climate events can provide essential guidance for agricultural production, regional governance, and disaster mitigation. Using daily temperature and precipitation model outputs from the Coupled Model Intercomparison Project Phase 6 (CMIP6), the time points of the temperature that will increase by 1.5 and 2.0°C were assessed under three different scenarios (SSP126, SSP245, and SSP585). To characterize the change of extreme climate events in the rice-growing regions in China, six indices were designed, and a time slice method was used. An analysis from an ensemble of CMIP6 models showed that under SSP245, the global mean temperature will rise by 1.5°C/2.0°C by approximately 2030/2049. A global warming of 2.0°C does not occur under SSP126. The time for a 1.5°C/2.0°C warming all becomes earlier under SSP585. Under 1.5°C of global warming, the number of warm days (TX90p), rice heat damage index (Ha), consecutive dry days (CDD), 5-day maximum precipitation (Rx5day), and number of annual total extreme precipitation events (R99pTOT) will clearly increase, while the number of cold damage (Cd) events will decrease. All the indices show a strong variability regionally. For example, the CDD increased significantly in the Central China and South China rice-growing regions. The monthly maximum consecutive 5-day precipitation increased by as much as 6.8 mm in the Southwest China rice-growing region.
Affected by human activities, the global climate is undergoing changes characterized by warming. A 1.5°C special report of the Intergovernmental Panel on Climate Change (IPCC) Sixth Assessment Report estimated that human-induced warming has caused a temperature rise of approximately 1.0[0.8–1.2]°C above the preindustrial level. If the current rate of temperature rise continues, then the global temperature will increase by 1.5°C between 2030 and 2052 (IPCC, 2018). A range of studies has shown that warming temperatures will lead to an increase in the frequency and intensity of extreme climate events (Tian-Yun et al., 2018; Almazroui et al., 2020; Wu et al., 2020). In order to cope with the adverse effects of climate change on society, nearly 200 parties under the United Nations Framework Convention on Climate Change (UNFCCC) reached an agreement to adopt the Paris Agreement in December 2015. The agreement clearly states that the global warming should be controlled within 2°C above the industrialized level, and efforts should be made to control the warming within 1.5°C. Many studies have shown that it is necessary to limit the global warming to a level below a 1.5°C increase (Li et al., 2018; Nangombe et al., 2018; Zhang et al., 2018). IPCC reports (IPCC, 2018) have pointed out that under the background of global warming, the frequency and intensity of extreme weather events have increased significantly in the past few decades. With increasing temperature, the frequency of extreme weather will continue to increase. Focusing on the change in and risk of extreme events controlled by 2 and 1.5°C of global warming, some research (Knutti et al., 2016) has found that changes in precipitation increased linearly with the increase in temperature, and the frequency of heavy precipitation also increased significantly. As the temperature continues to rise, the number of days of high-temperature heat waves over a certain threshold will increase nonlinearly with increasing temperature.
Many studies in China and in the world have used global and regional climate models to assess the change in extreme climate events and possible societal impacts as global warming continues (Xuejie et al., 2002; Haylock et al., 2006; Xu et al., 2006; Hu et al., 2007; Li et al., 2010; Ren et al., 2010; Dosio, 2016). Advances in climate models provide strong support for future climate change risk assessment. At present, a large amount of output from the Coupled Model Intercomparison Project Phase 6 (CMIP6) is available for analysis. Extensive dedicated studies have evaluated the performance of the CMIP6 models. The CMIP6 models have been shown to be significantly improved in comparison to the CMIP5 models. The simulation of extreme climate events has also improved (Dan et al., 2002; Feng et al., 2014; Yang et al., 2014; Chen et al., 2020; Ukkola et al., 2020; Zhou et al., 2020; Zhu et al., 2020).
Climate change due to global warming has a significant impact on the economy (Chou et al., 2016). Agriculture is vulnerable to climate change. Although warming temperatures could be conducive to crop growth in some particular regions, continuously warming temperatures, changing precipitation patterns, and increasing extreme climate events in terms of number and intensity have a dramatic negative impact on food security (Gaupp et al., 2019). Recent studies have assessed the direct impact of climate change on food production (Ju et al., 2013; Wheeler and von Braun, 2013; Xiong et al., 2016; Chou et al., 2019a). China is the most populous country in the world. Rice is the most important food source in China. The rice-growing region in China is approximately 3×10⁷hm2, which accounts for 27% of the farmland in the country. The total rice output accounts for 42% of the total grain production (Chen et al., 2017). Thus, assessing the change in extreme climate events on rice production in China is uniquely important.
Research is greatly needed on how global warming changes Chinese rice production. The existing research has been based on economic-climate models, production function models, and crop models (Wang et al., 2016; Chou et al., 2019b). No dedicated studies on the impact of changes in extreme climate events arising from global warming on rice production exist. There are studies on the impact of extreme climate events (Sun and Huang, 2011), but they are based on historical data. These studies also cover only a certain area. Quantitative and scientific assessments of changes in extreme climate events and their impact on rice production are necessary to provide a scientific basis for rice planting layout, transformation, adjustment, and adaptation to climate change.
This study uses outputs from an ensemble of CMIP6 models to assess when 1.5 and 2.0°C global warming will occur under different scenarios. Based on the time of the moderate emission scenario (SSP245), the change in extreme climate events in the rice-growing regions in China under different scenarios is characterized. This study will help to further understand the climate change trend and risk in Chinese rice-growing regions. This study will also help provide information for early warning and forecasting of extreme disaster events and preventing and mitigating disasters, as well as for rationally laying out rice production and responding to risks to rice production, which have important scientific significance and practical value.
The historical reanalysis data were from ERA5. ERA5 is the latest generation of reanalysis data created by the European Centre for Medium-Range Weather Forecasts (ECMWF). The data cover the historical period from 1950 to the present. In comparison with reanalysis data, ERA5 data incorporate more historical observational data, especially satellite data, into its data assimilation system to improve the accuracy of atmospheric condition estimations. In addition, in comparison with previous versions, ERA5 has a higher spatial and temporal resolution, with a temporal resolution of 1 h and a spatial resolution of 0.25° × 0.25°.
The future climate scenario data were obtained from the climate model data from CMIP61. The data used in this study were daily near-surface air temperature, daily maximum near-surface air temperature, daily minimum near-surface air temperature, daily precipitation, monthly near-surface air temperature, and monthly precipitation. The selected scenarios were SSP126, SSP245, and SSP585. The data selection time period was 1950–2100. The fundamental information on the selected models is listed in Table 1.
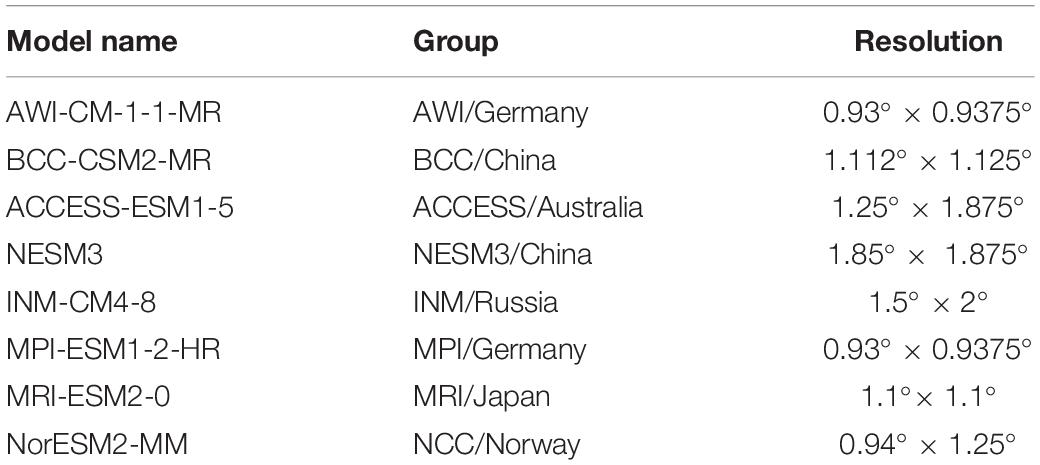
Table 1. Basic information and atmospheric resolution of eight CMIP6 global climate models.
Combining the rice-cropping system and growing environment, the entire study area was divided into five rice-growing regions (Luo et al., 2020). The five rice-growing regions were as follows (Figure 1): (I) Northeast China rice-growing region (NEC), (II) North China rice-growing region (NC), (III) Central China rice-growing region (CC), (IV) Southwest China rice-growing region (SWC), and (V) South China rice-growing region (SC).
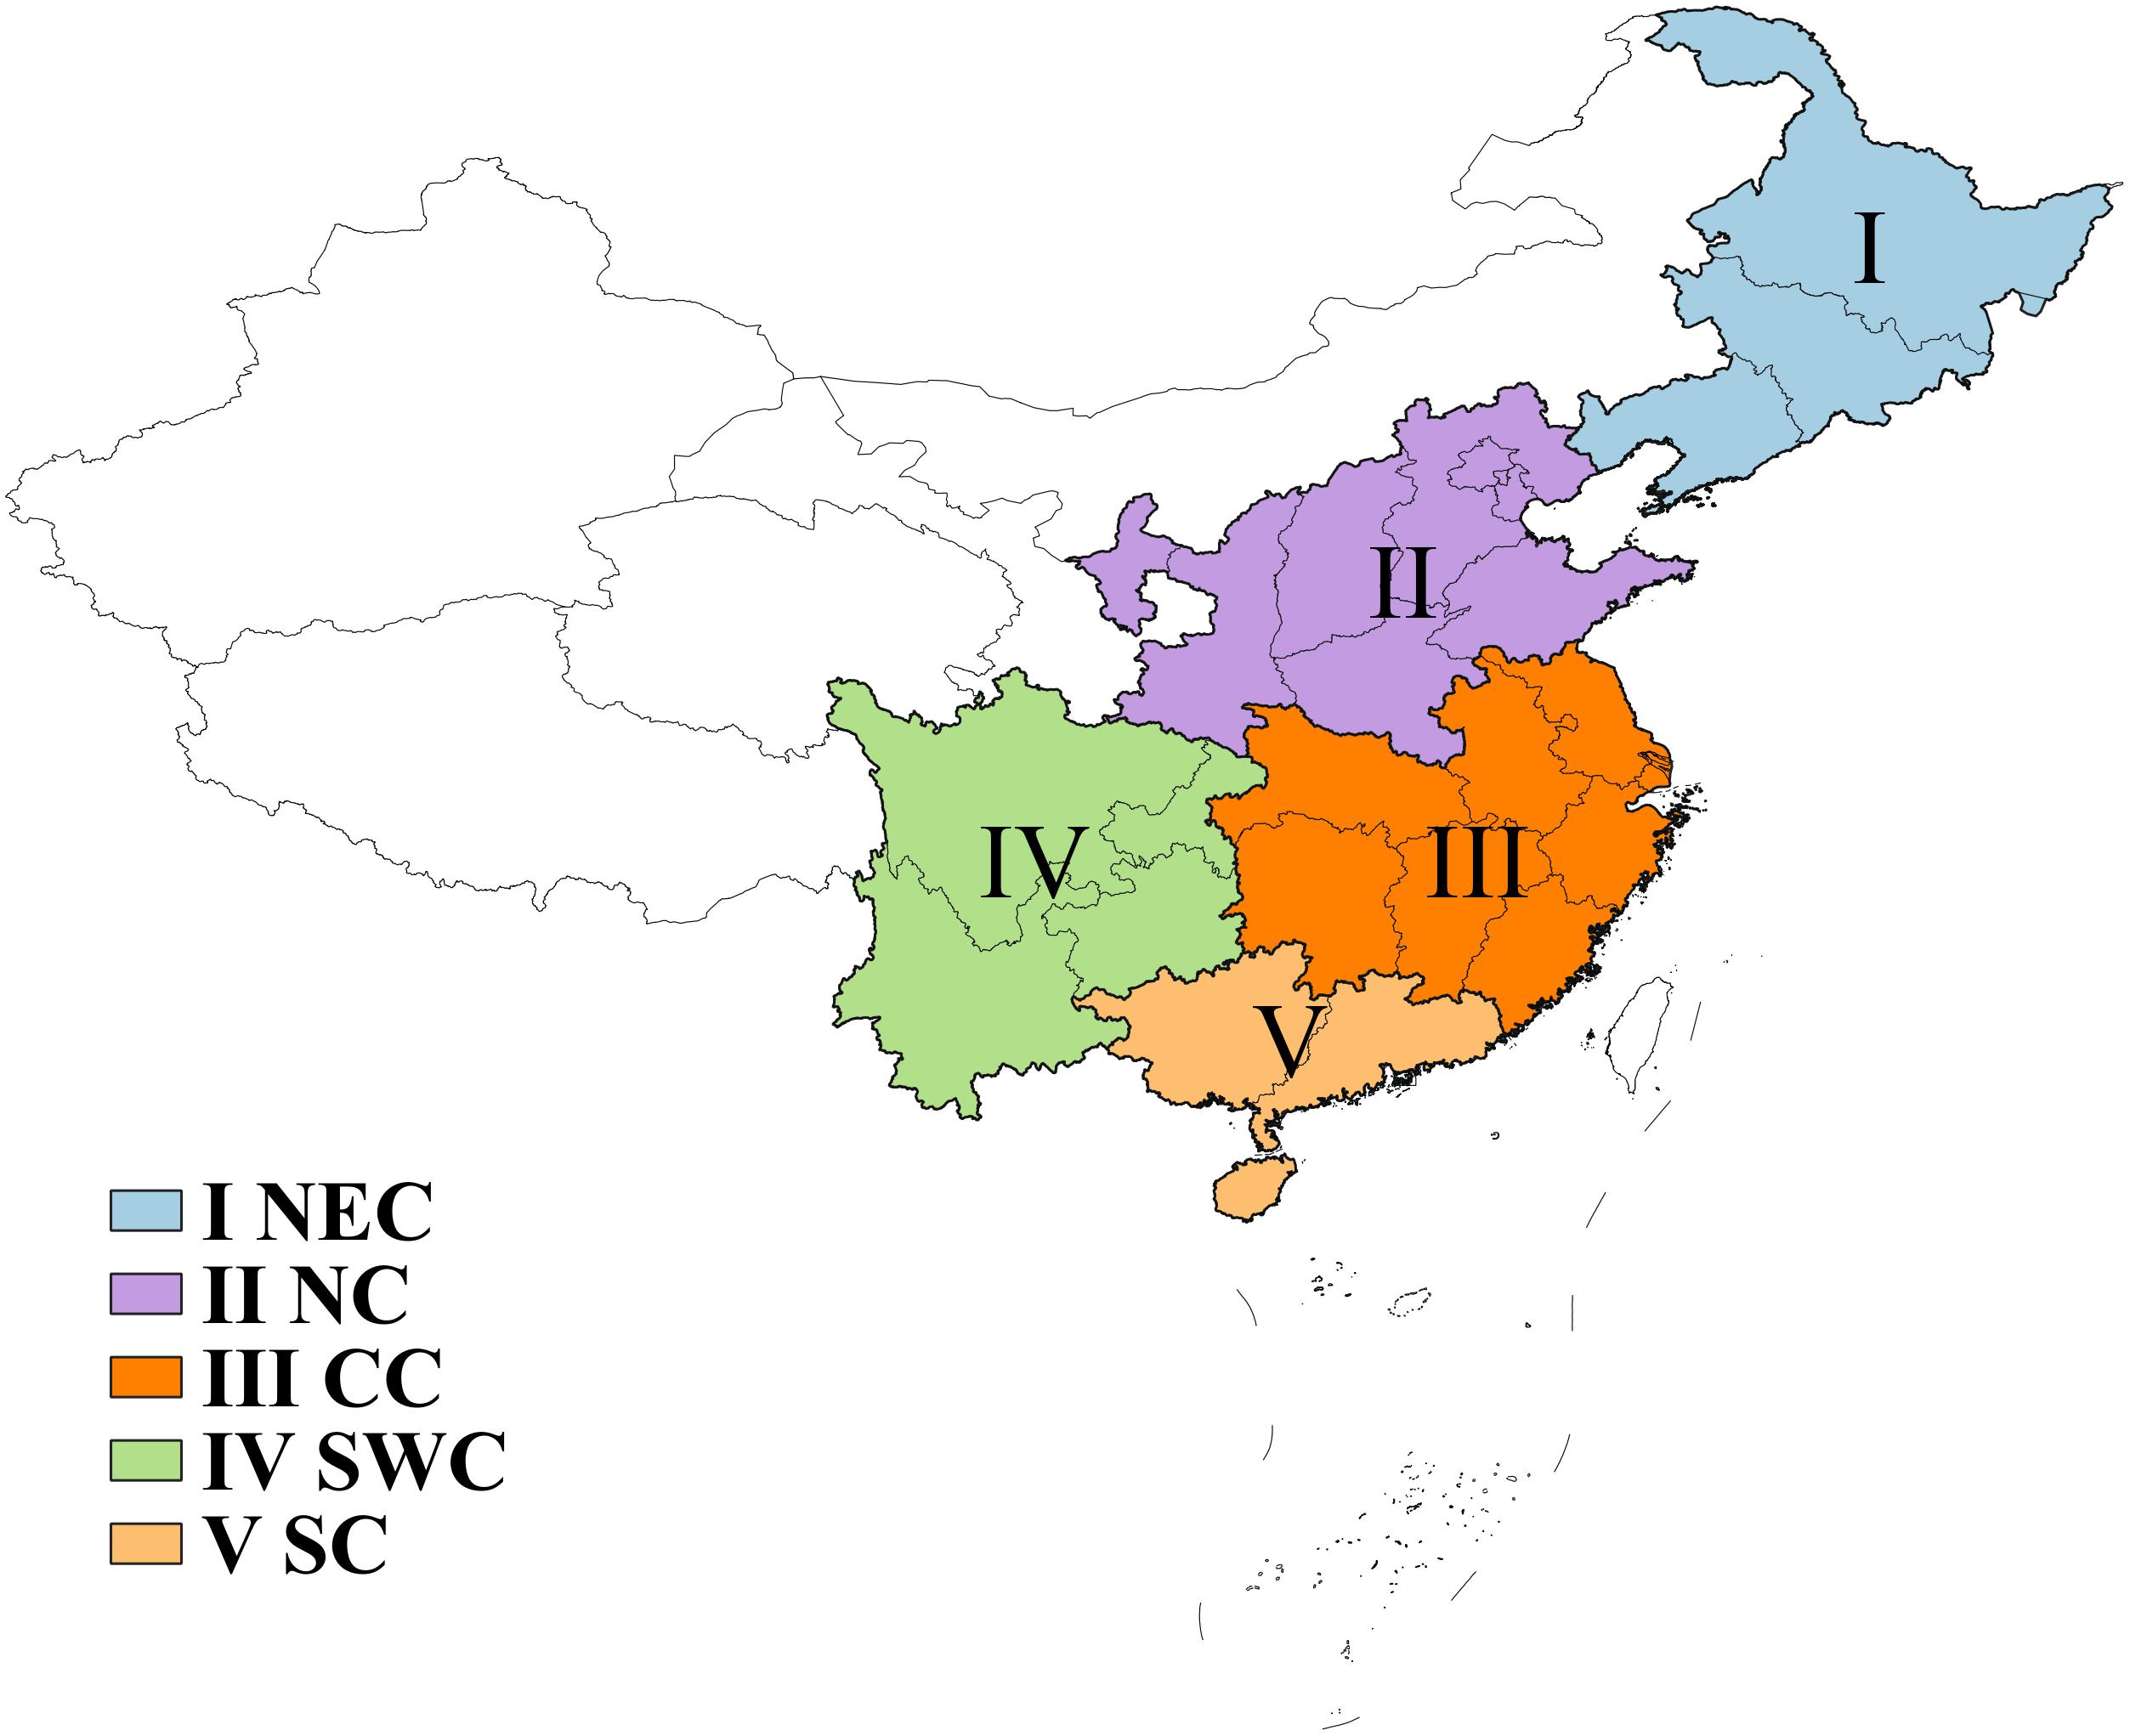
Figure 1. China rice-growing regions. I, Northeast China rice-growing region (NEC); II, North China rice-growing region (NC); III, Central China rice-growing region (CC); IV, Southwest China rice-growing region (SWC); and V, South China rice-growing region (SC).
The selection of extreme climate event indicators was mainly based on 27 typical climate indexes defined by the Expert Team on Climate Change Detection and Indices (ETCCDI) jointly established by organizations such as the World Meteorological Organization (WMO). The ETCCDI include 16 temperature indices and 11 precipitation indices. In this study, we selected warm days (TX90p), consecutive dry days (CDD), 5-day maximum precipitation (Rx5day), and annual total extreme precipitation (R99pTOT). These four indices provided substantial information on the extreme climate events that will affect rice. The rice heat damage index (Ha) and rice cold damage index (Cd) are stipulated in “meteorological grade of hot damage to rice” and “grade of chilling damage for rice and maize,” respectively. Information on the selected indexes is described in Table 2. And Figure 2 is the flow chart of changes in extreme climate events in rice-growing regions under different warming scenarios in China.
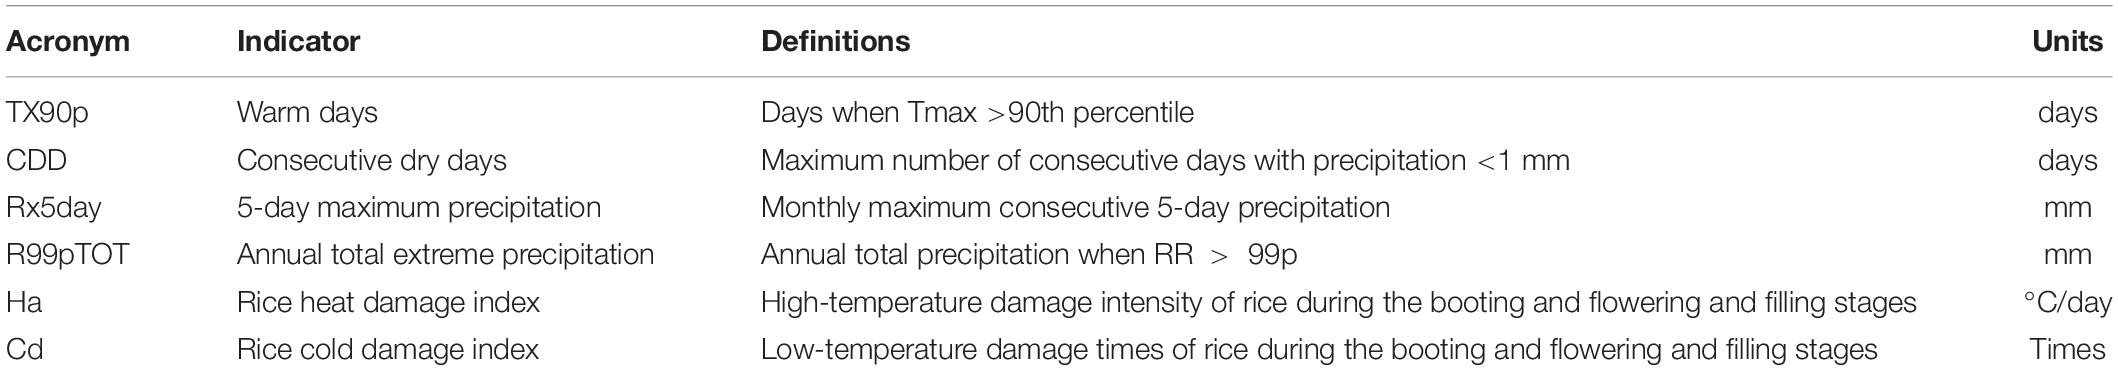
Table 2. Definitions of six extreme climate indices.
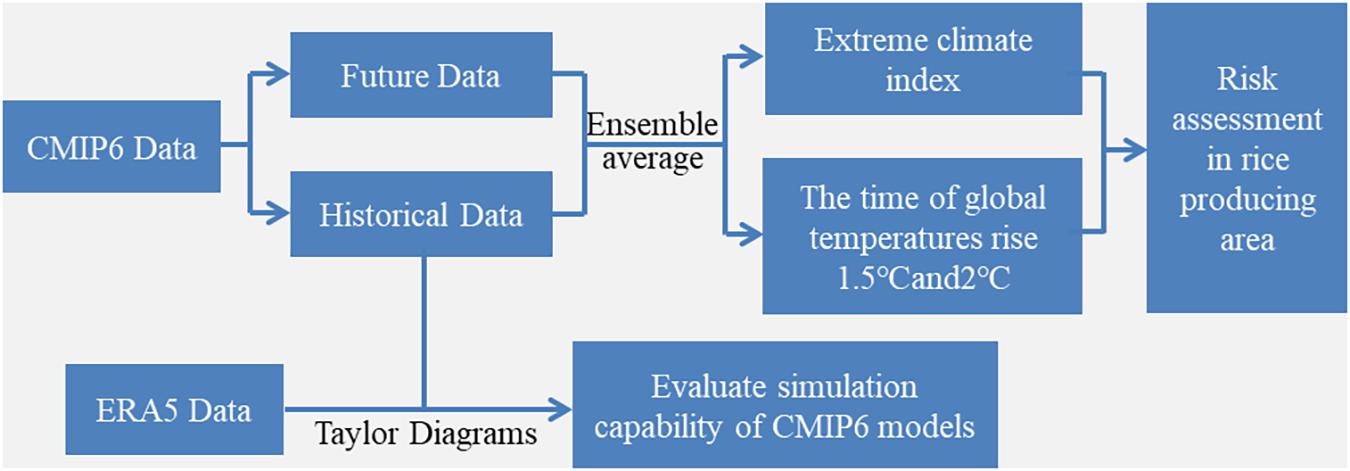
Figure 2. Flow chart of changes in extreme climate events in rice-growing regions under different warming scenarios in China.
First, we used Taylor diagrams (Taylor et al., 2001) to briefly evaluate the reliability of the CMIP6 model data. The spatial correlation coefficient, standard deviation, and root mean square error between the historical period (1986–2005) data simulated by the CMIP6 model and the ERA5 reanalysis data were analyzed. The root mean square error is defined in formula (1).
According to formula (1), RMSE is the root mean square error of the grid, Xsim,i is the simulated value of the grid in year i, and Xobs,i is the corresponding reanalysis data.
According to the IPCC AR5, the global temperature from 1986 to 2005 was 0.61°C warmer than that before industrialization (IPCC, 2013). Therefore, we defined 0.89°C higher than the temperature in 1986–2005 as 1.5°C warmer than the temperature before industrialization and 1.39°C higher than the temperature in 1986–2005 as 2°C warmer than that before industrialization. The bilinear interpolation method was used to uniformly interpolate the data to a 0.5° × 0.5° Gaussian grid, and the multimode ensemble method was used to obtain a data set. The time points of when 1.5 and 2°C increases in temperature would occur under the three social scenarios (SSP) were calculated. Finally, the time slice method (Guo et al., 2017) was used to explore the changes in extreme climate events in the rice-producing areas under global temperature increases of 1.5 and 2°C. Taking the time points when 1.5 and 2°C temperature increases would occur under the SSP245 scenario as the benchmark, ten years before and after this time point (totally 20 years) were regarded as the research period. According to the calculation results, the time periods when the temperature would increase 1.5 and 2°C in this paper were 2019–2038 and 2039–2058, respectively. In addition, we selected 1986–2005 as the historical reference period. The method of calculating the rice heat damage index is shown in formulas (2) and (3).
where Ha is the rice heat damage index. m is the total number of rice heat damage processes. j is the sequence number of the multiple heat damage processes of rice. i is the different grids. is the accumulated heat per day.
Figure 3 is a Taylor diagram that shows the difference between the CMIP6 global model data and the ERA5 reanalysis data. The spatial correlation coefficient of surface temperature was 0.8–0.9, while the spatial correlation coefficient of precipitation was 0.6–0.7. The CMIP6 data reproduced the historical temperature and precipitation to a certain extent, but the simulation ability of the data for precipitation was obviously lower than that for temperature. At the same time, the results also showed that in comparison with the reanalysis data, multimode ensemble data can better reproduce history. Therefore, the multimode ensemble data were used to analyze the changes in extreme climate events in China.
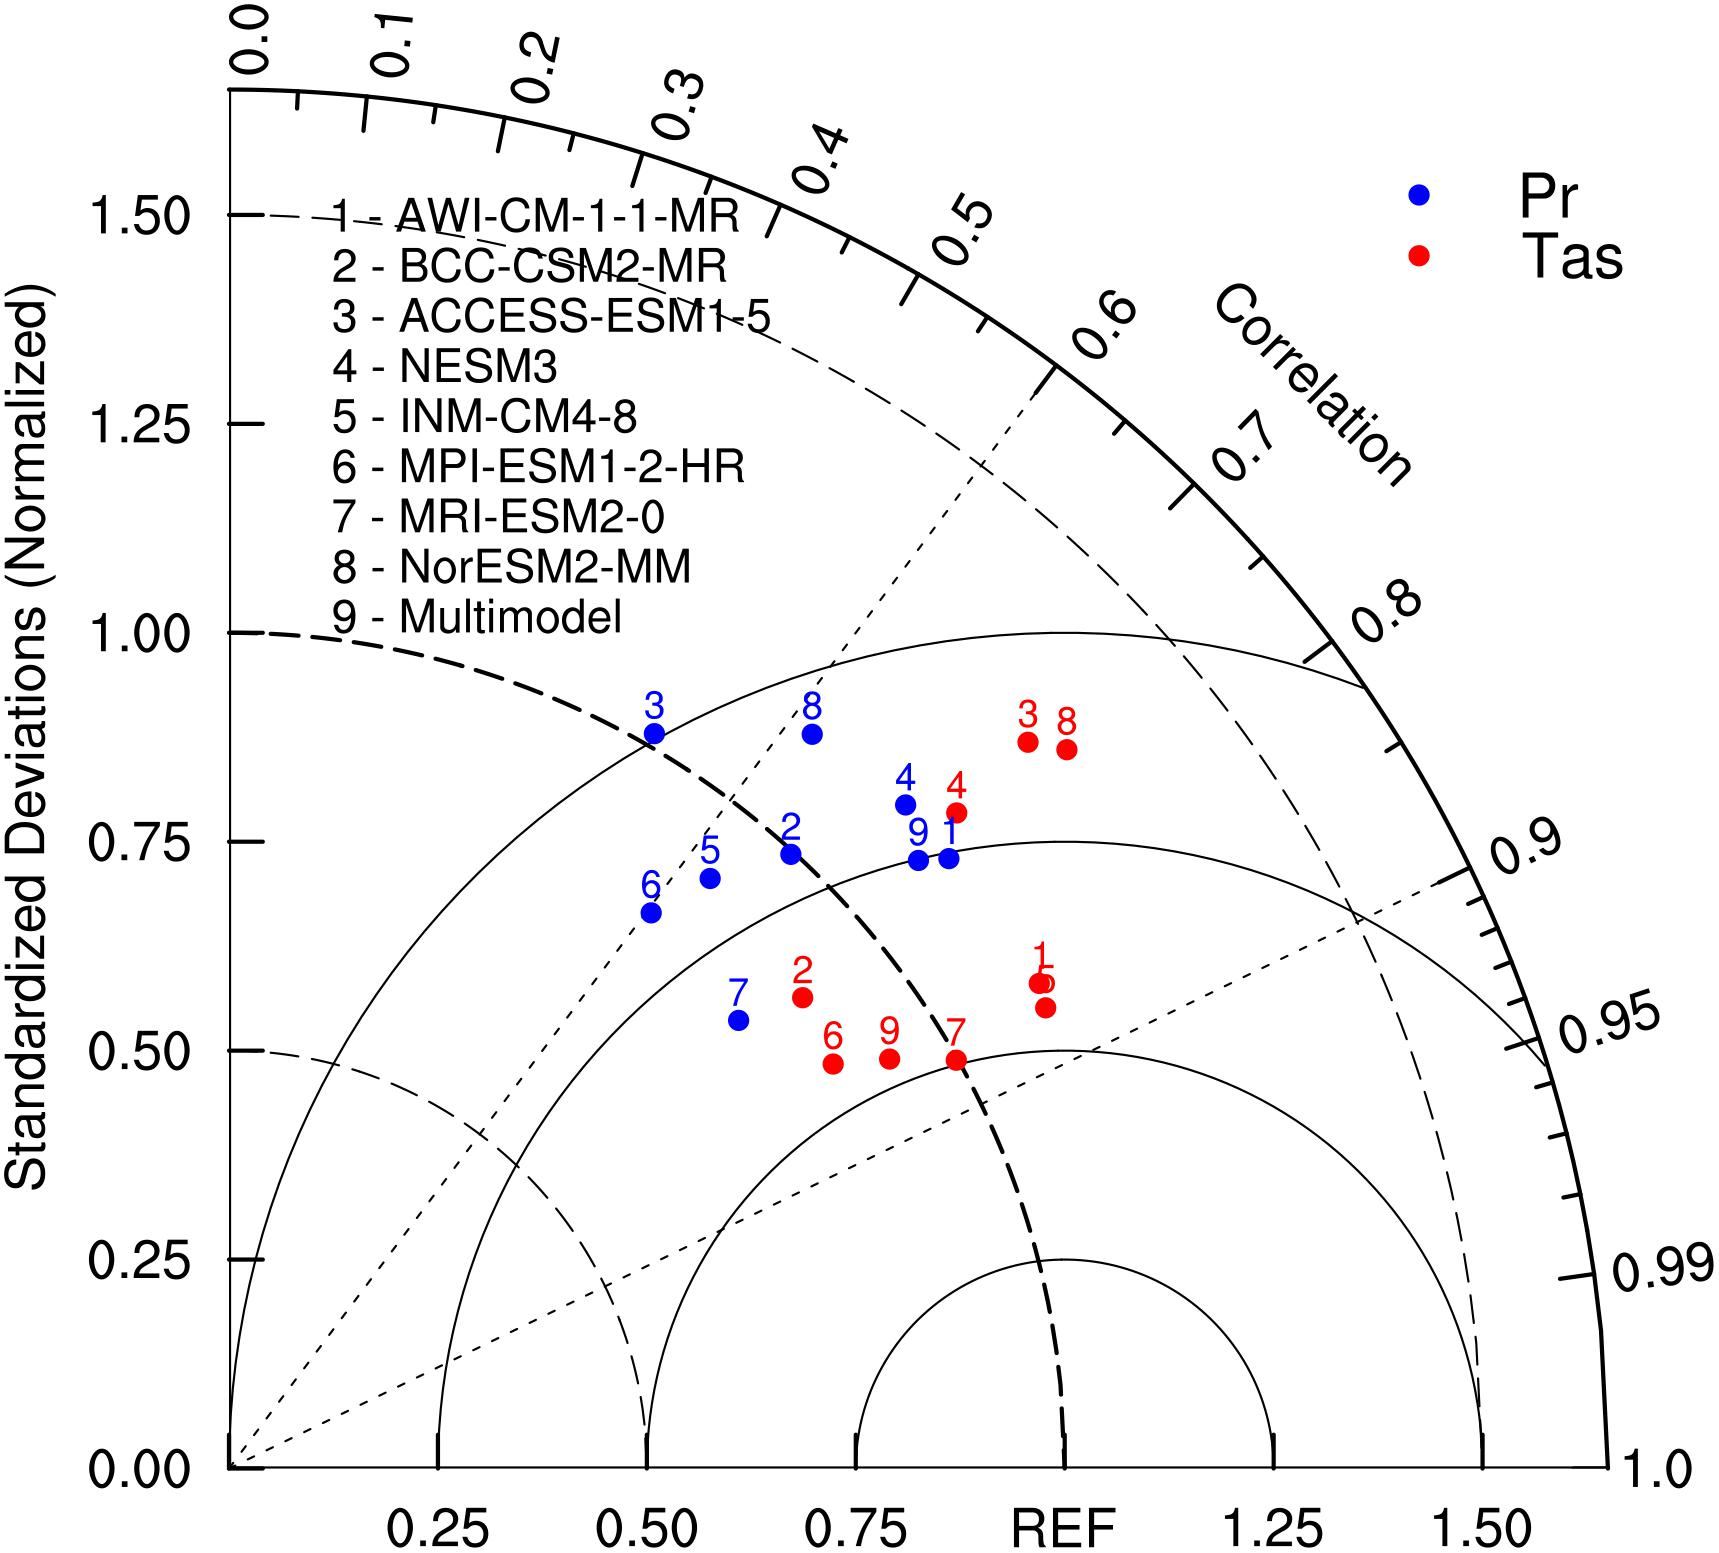
Figure 3. Taylor diagram of annual mean Tas and Pr between the CMIP6 data and reanalysis data in China.
As shown in Figure 4, under different social scenarios, there were large differences in the increases in global temperature. Under the SSP126 scenario, most models showed a temperature peak in approximately 2,065, and global temperature showed a downward trend after reaching the peak. Under the SSP245 scenario, the global temperature showed a more dramatic increase than that under the SSP126 scenario, but the rate of increase gradually decreased, reaching its peak by 2,100. Under the SSP585 scenario, global warming was intense and the rate of temperature rise gradually increased. Although the simulation results of each model showed a similar trend in general, the time it took for the temperature to increase by 1.5 and 2°C in the different models was quite different. This difference was related to the internal variability of the model and climate sensitivity.
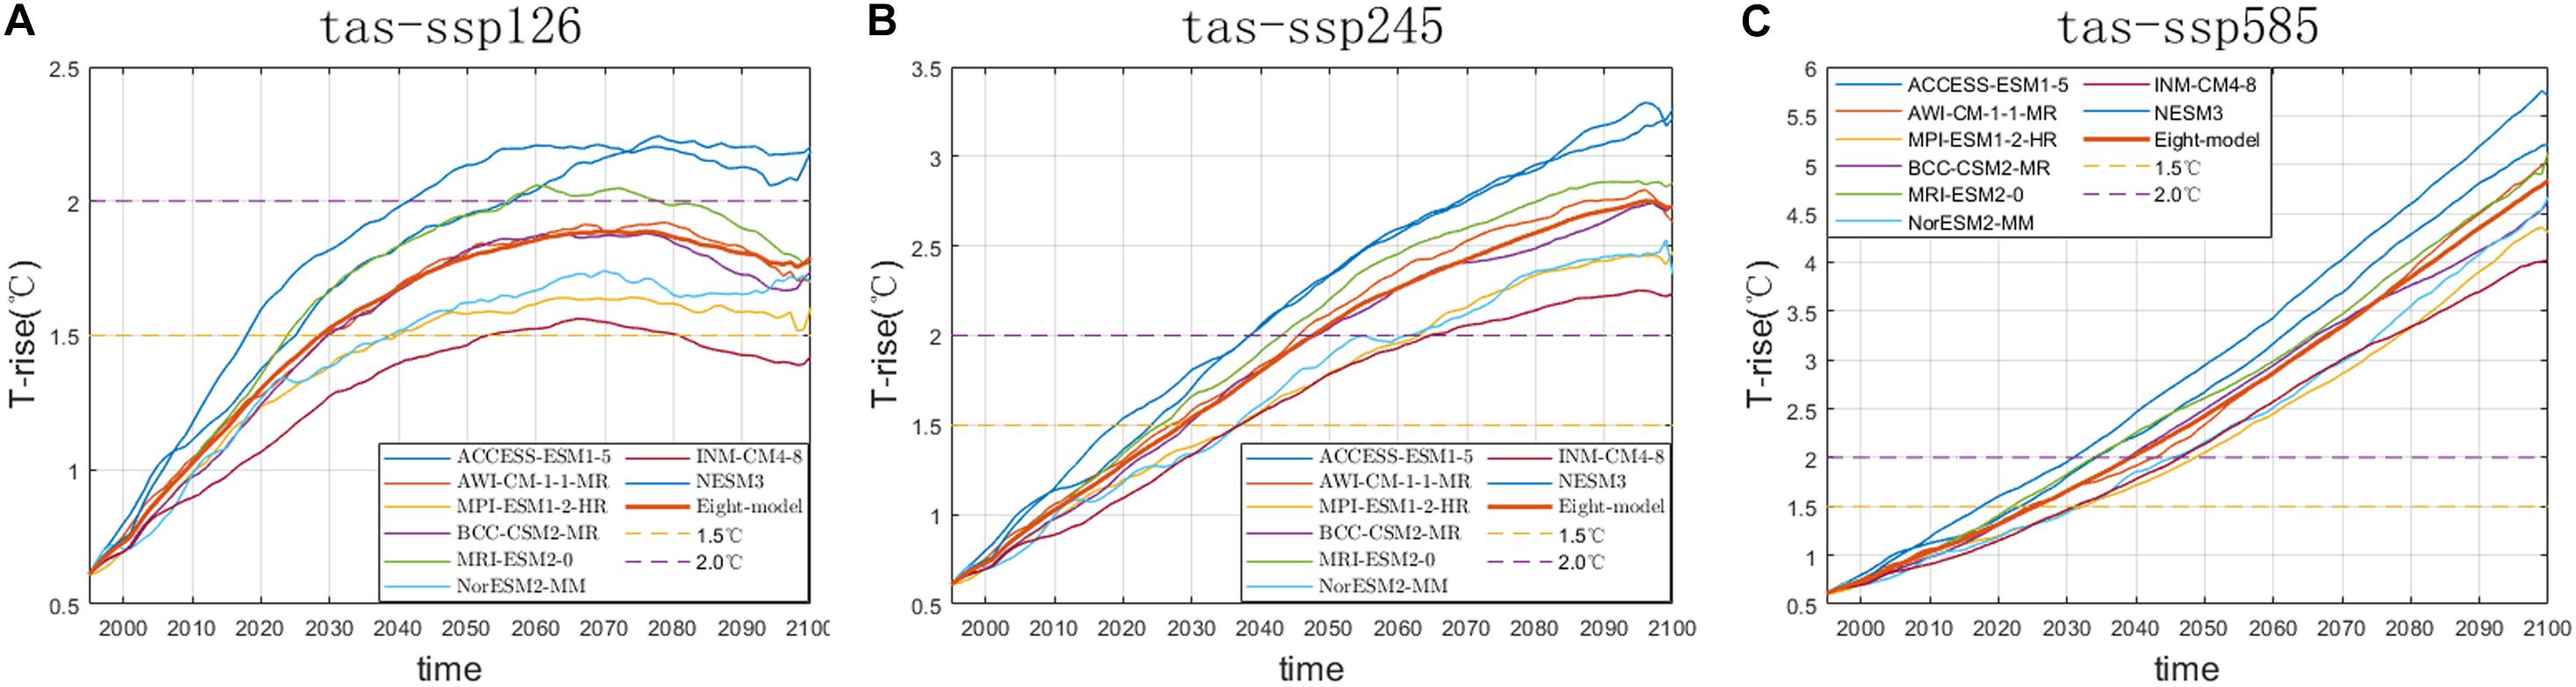
Figure 4. Global warming under different scenarios [SSP126 (A), SSP245 (B), and SSP585 (C)].
Due to the large differences between the various modes, a multimode method was adopted to determine the time at which the temperature will increase. From the results of multimode ensemble averaging, the times when 1.5°C warming occurred under the SSP126, SSP245, and SSP585 scenarios were 2030, 2029, and 2026, respectively. The times when 2°C warming occurred under the SSP245 and SSP585 scenarios were 2,049 and 2,039, respectively. The SSP126 scenario did not result in 2°C warming.
Compared with the results of existing research (Li et al., 2018; Nangombe et al., 2018; Zhang et al., 2018), the results of this study showed that the times when the global temperature will reach 1.5 and 2.0°C warming were similar. The results showed that the time it would take to reach 1.5°C warming were 1–2 years earlier and that the time it would take to reach 2°C warming was 2–3 years later than the results in other studies. These differences are acceptable due to the different calculation methods of global temperature and the different results from different climate models.
Under 1.5°C of global warming, the CDD in the rice-growing regions were generally consistent under the different scenarios (Figure 5). Taking the SSP245 scenario as an example, the number of CDD in the NC, CC, and SC was significantly higher than those in the other rice-growing regions, reaching 13.6, 14.1, and 14.4 days, respectively (Figure 6). Compared with the historical reference period, the number of CDD in the NEC decreased by approximately 1.0 days. In comparison with those in the historical period, the number of CDD in the NC, CC, and SC increased significantly with the number of CDD increasing by 0.6, 1.3, and 1.9 days, respectively.
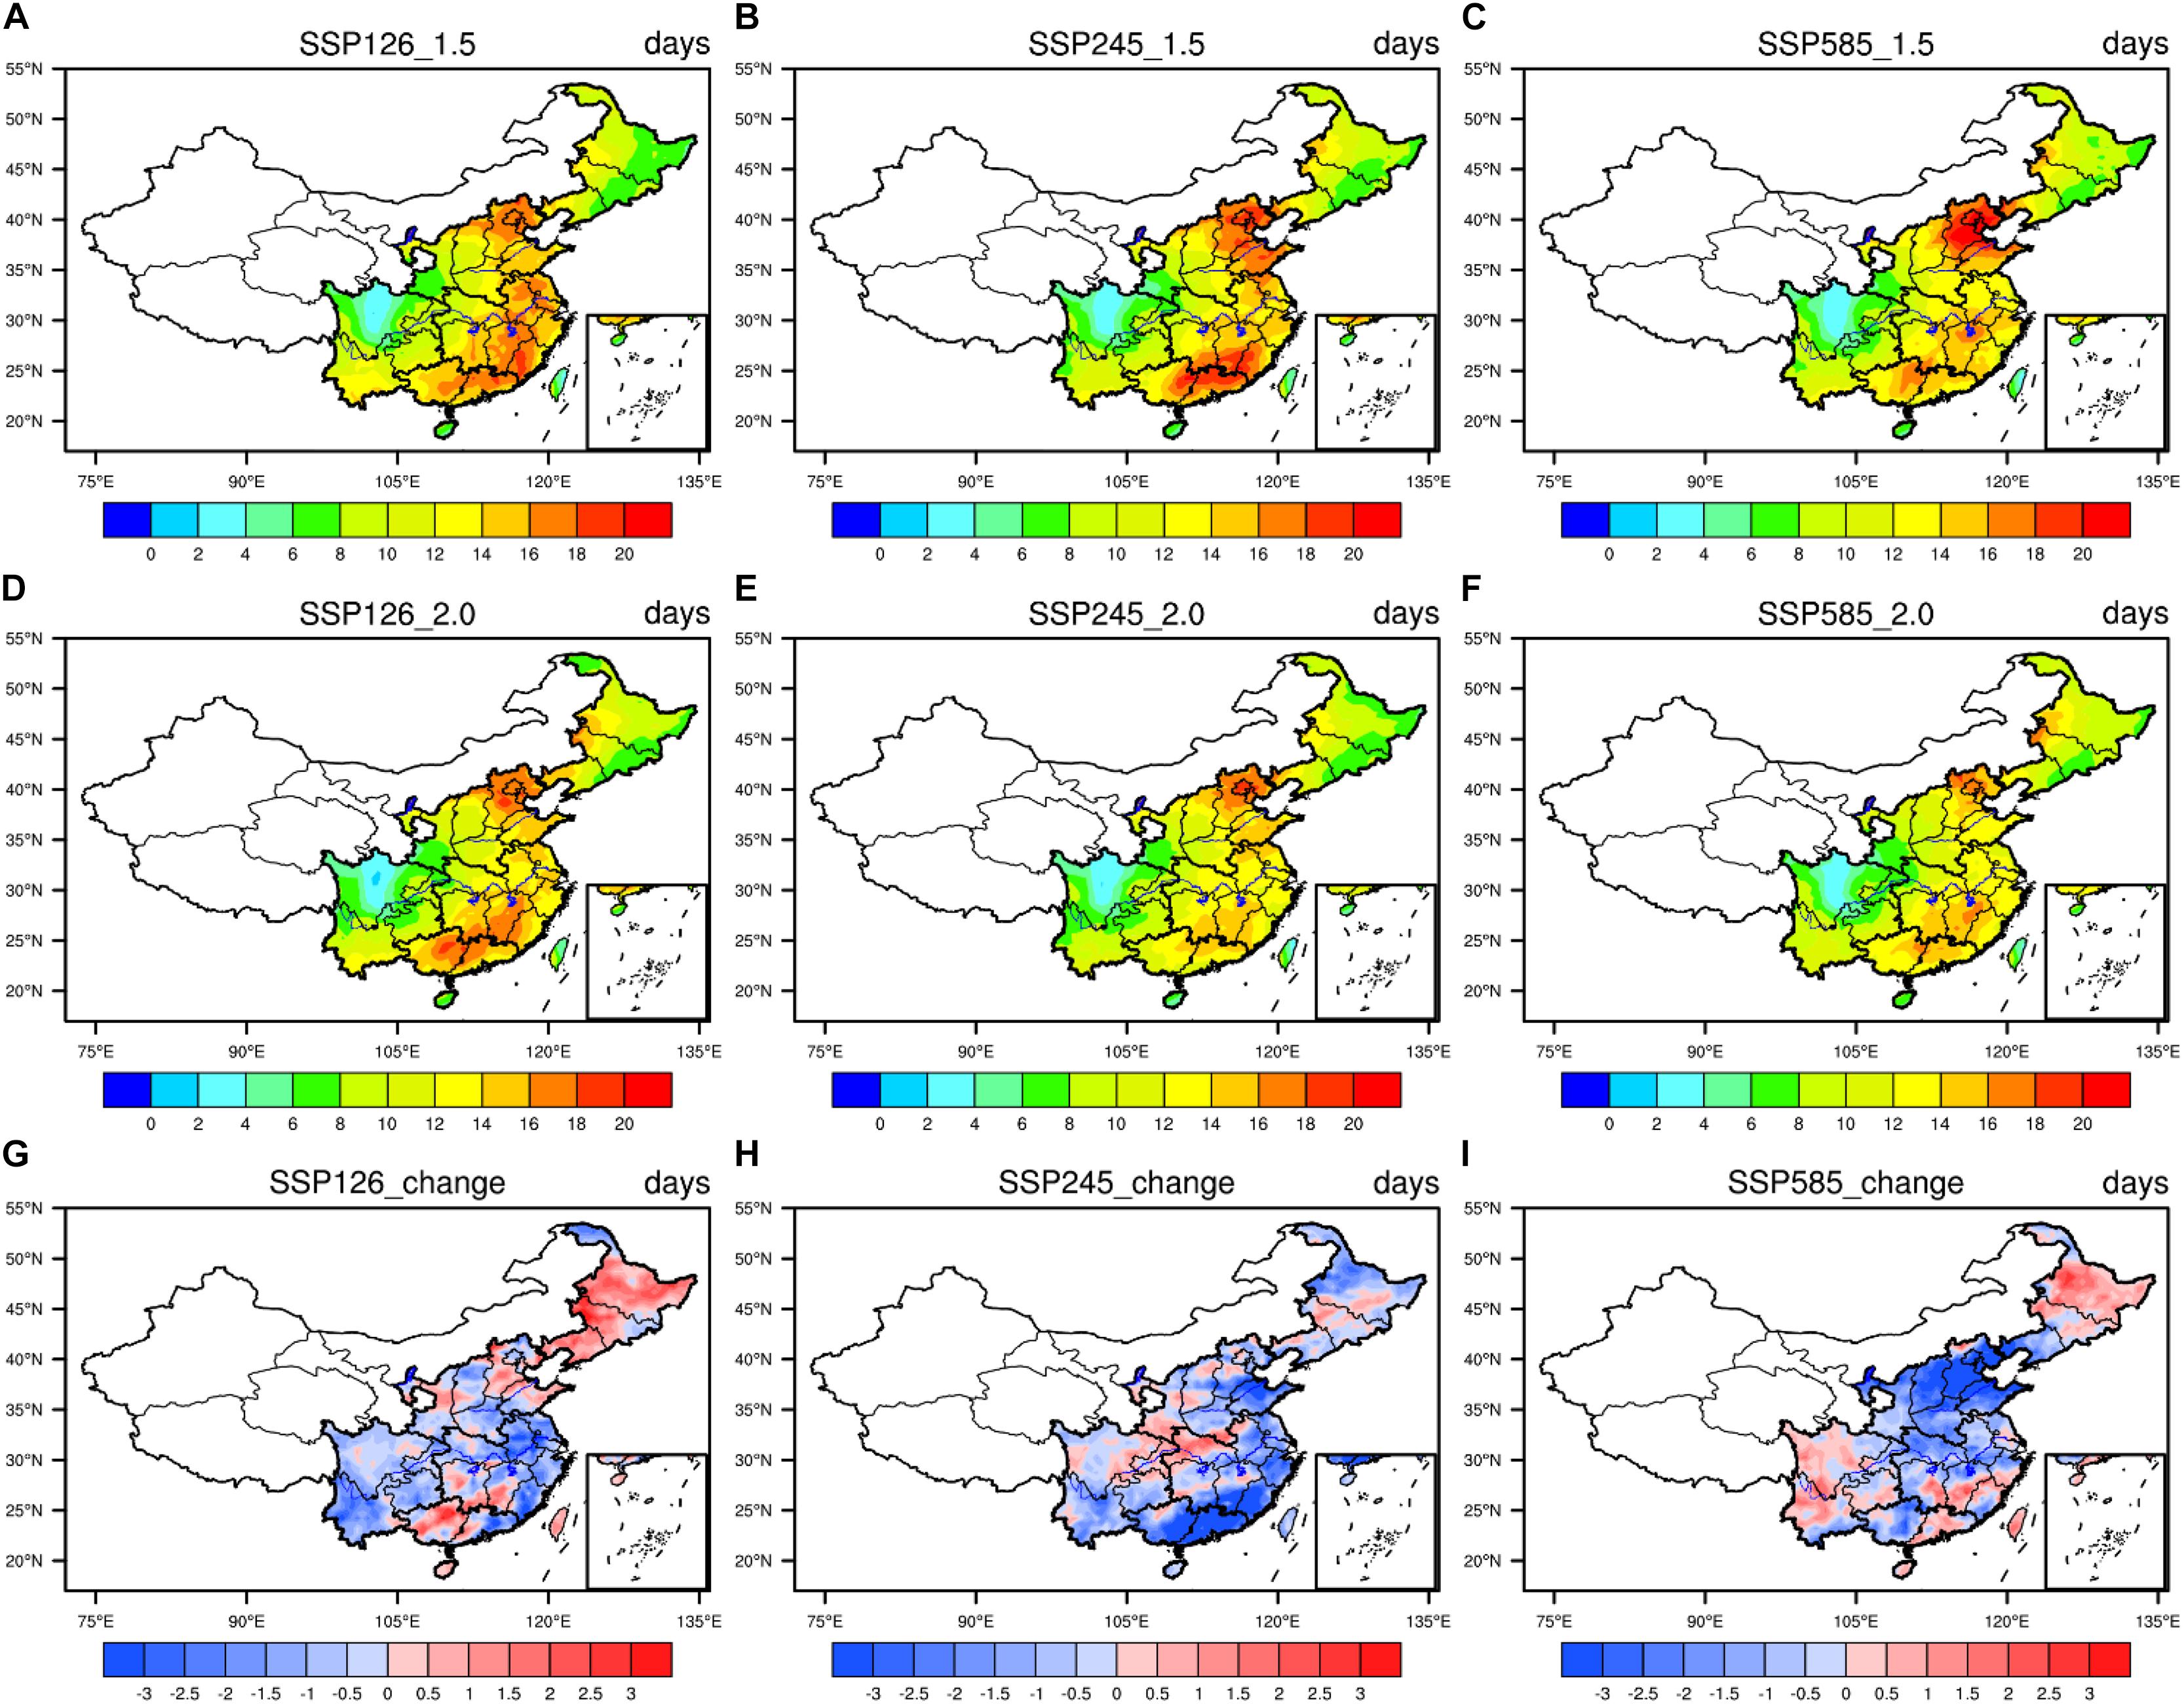
Figure 5. Distribution of consecutive dry days (CDD) at 1.5 and 2°C. (A–C) Global warming at 1.5°C under SSP126, SSP245, and SSP585, respectively. (D–F) Global warming at 2°C under SSP126, SSP245, and SSP585, respectively. (G–I) The differences between global warming at 1.5 and 2°C.
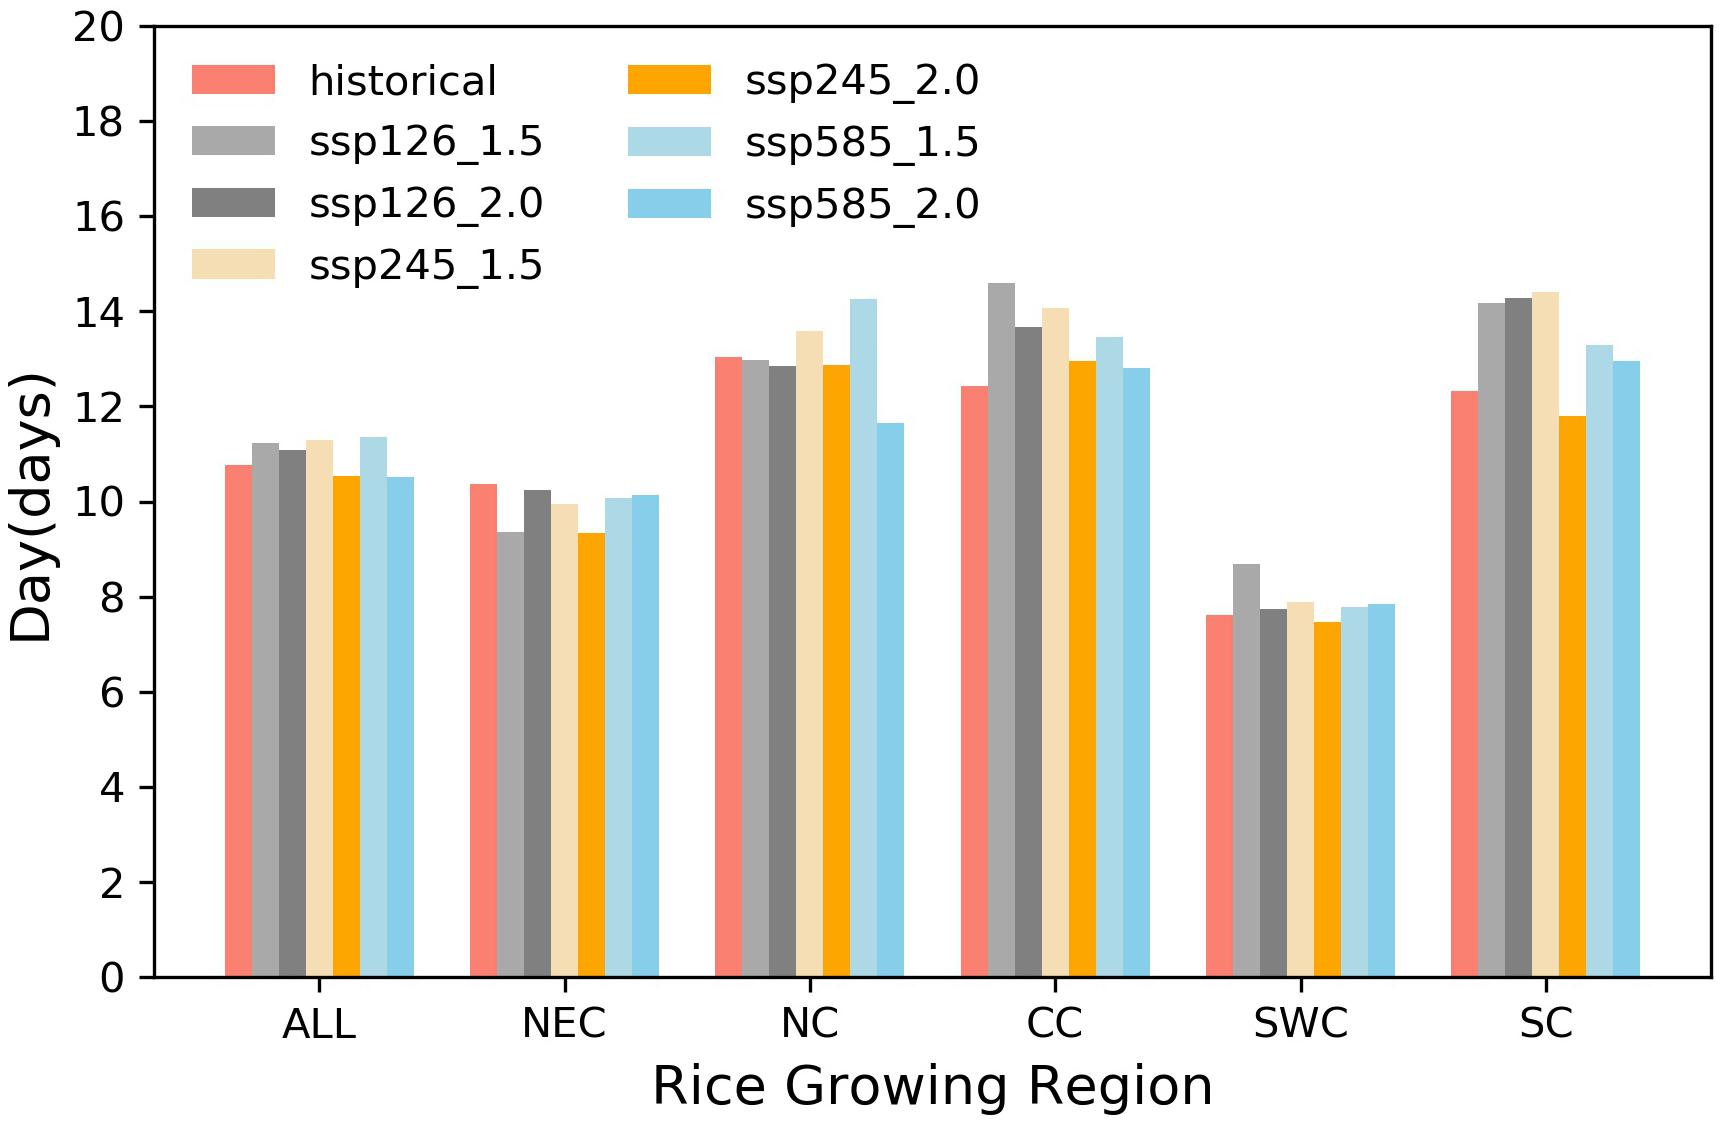
Figure 6. Regional average of consecutive dry days (CDD) at the historical temperature and 1.5 and 2°C temperature increases. The rice-growing regions are the Chinese rice-growing region (ALL), Northeast China rice-growing region (NEC), North China rice-growing region (NC), Central China rice-growing region (CC), Southwest China rice-growing region (SWC), and South China rice-growing region (SC).
Under 2°C of global warming, the distribution of CDD in the rice-growing regions was similar to that under 1.5°C of global warming. The high-value areas of CDD were still located in the NC, CC, and SC.
Under the scenario of an additional 0.5°C increase in global temperature from to 2°C, the number of CDD in the rice-growing regions showed a decreasing trend. However, in the NC, the SSP126 and SSP585 scenarios showed that the number of CDD will increase by 0.9 and 0.2 days, respectively, and those under the SSP585 scenario will decrease by 0.6 days.
Under a 1.5°C increase in global warming, the Rx5day values in the rice-growing regions under different scenarios were generally consistent, showing a distribution pattern of more precipitation in the south and less precipitation in the north (Figure 7). Taking the SSP245 scenario as an example, the Rx5day in the NEC, NC, CC, SWC, and SC reached 53.0, 53.5, 75.8, 75.0, and 89.4 mm, respectively. Compared with the historical reference period, the increase was up to 4.9, 2.8, 2.5, 4.2, and 4.4 mm, respectively (Figure 8). However, at the junction of the CC and SC, this variable slightly decreased.
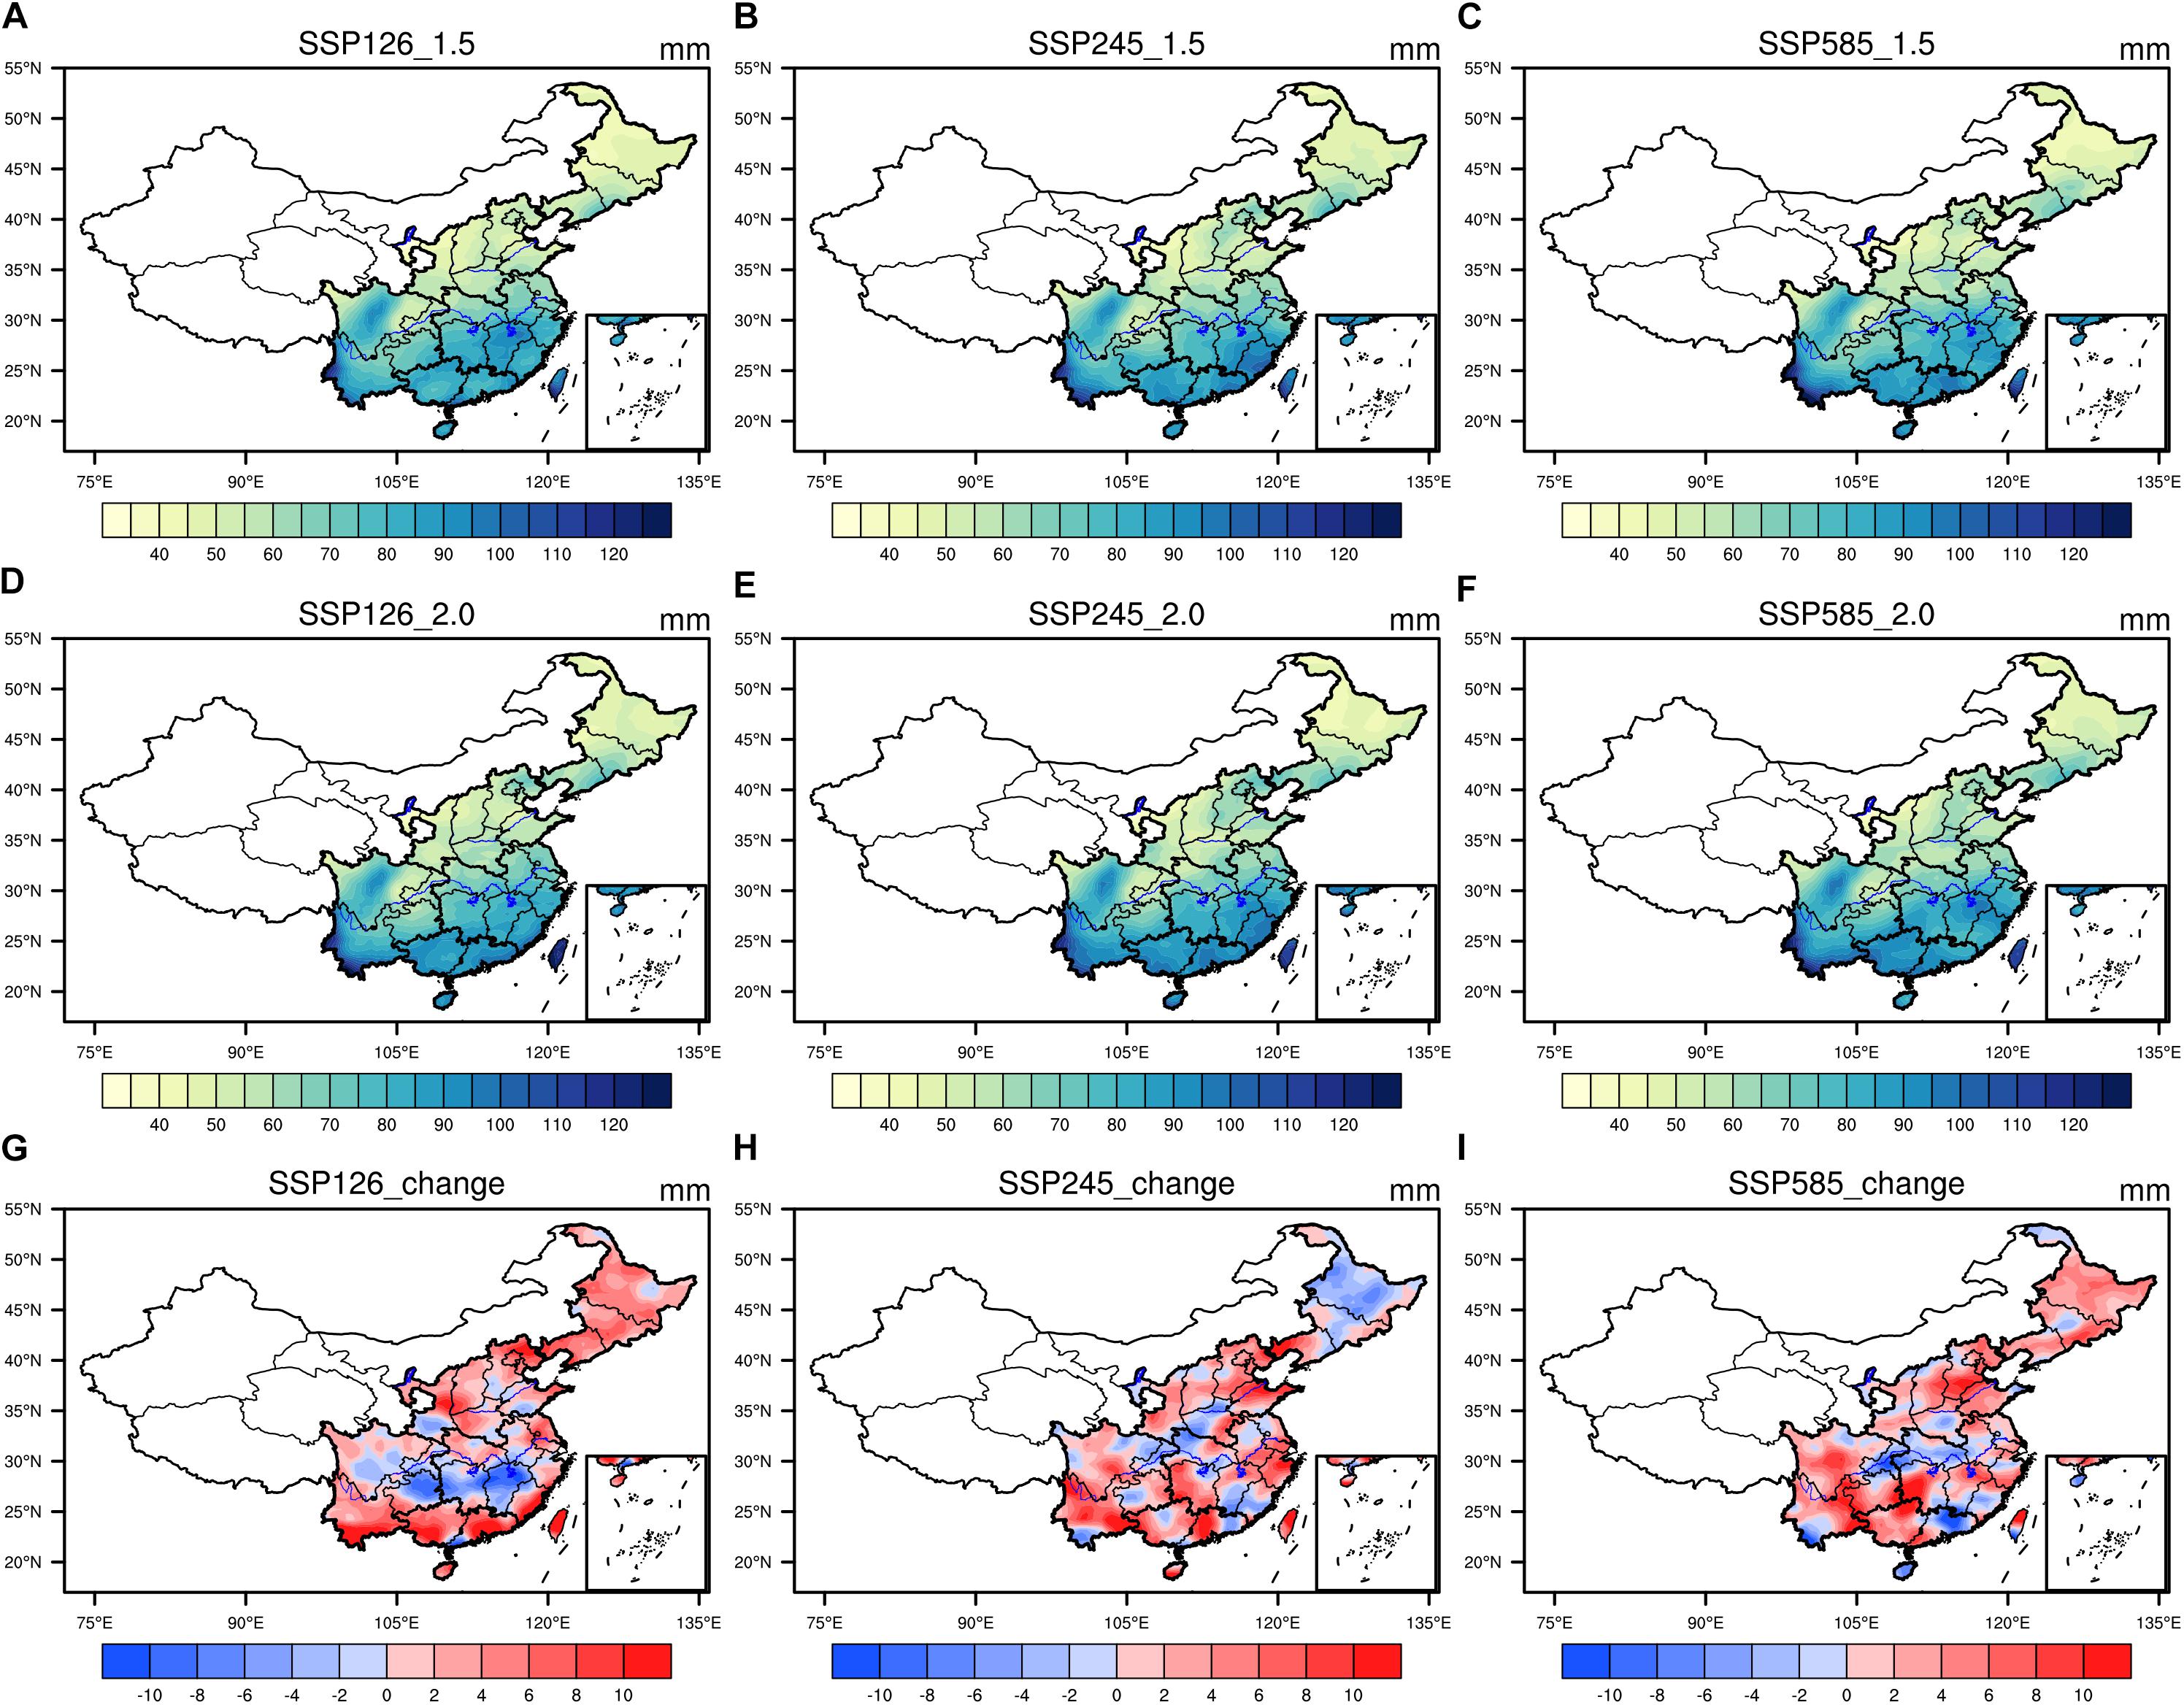
Figure 7. Distribution of 5-day maximum precipitation (Rx5day) at 1.5 and 2°C. (A–C) Global warming at 1.5°C under SSP126, SSP245, and SSP585, respectively. (D–F) Global warming at 2°C under SSP126, SSP245, and SSP585, respectively. (G–I) The differences between global warming at 1.5 and 2°C.
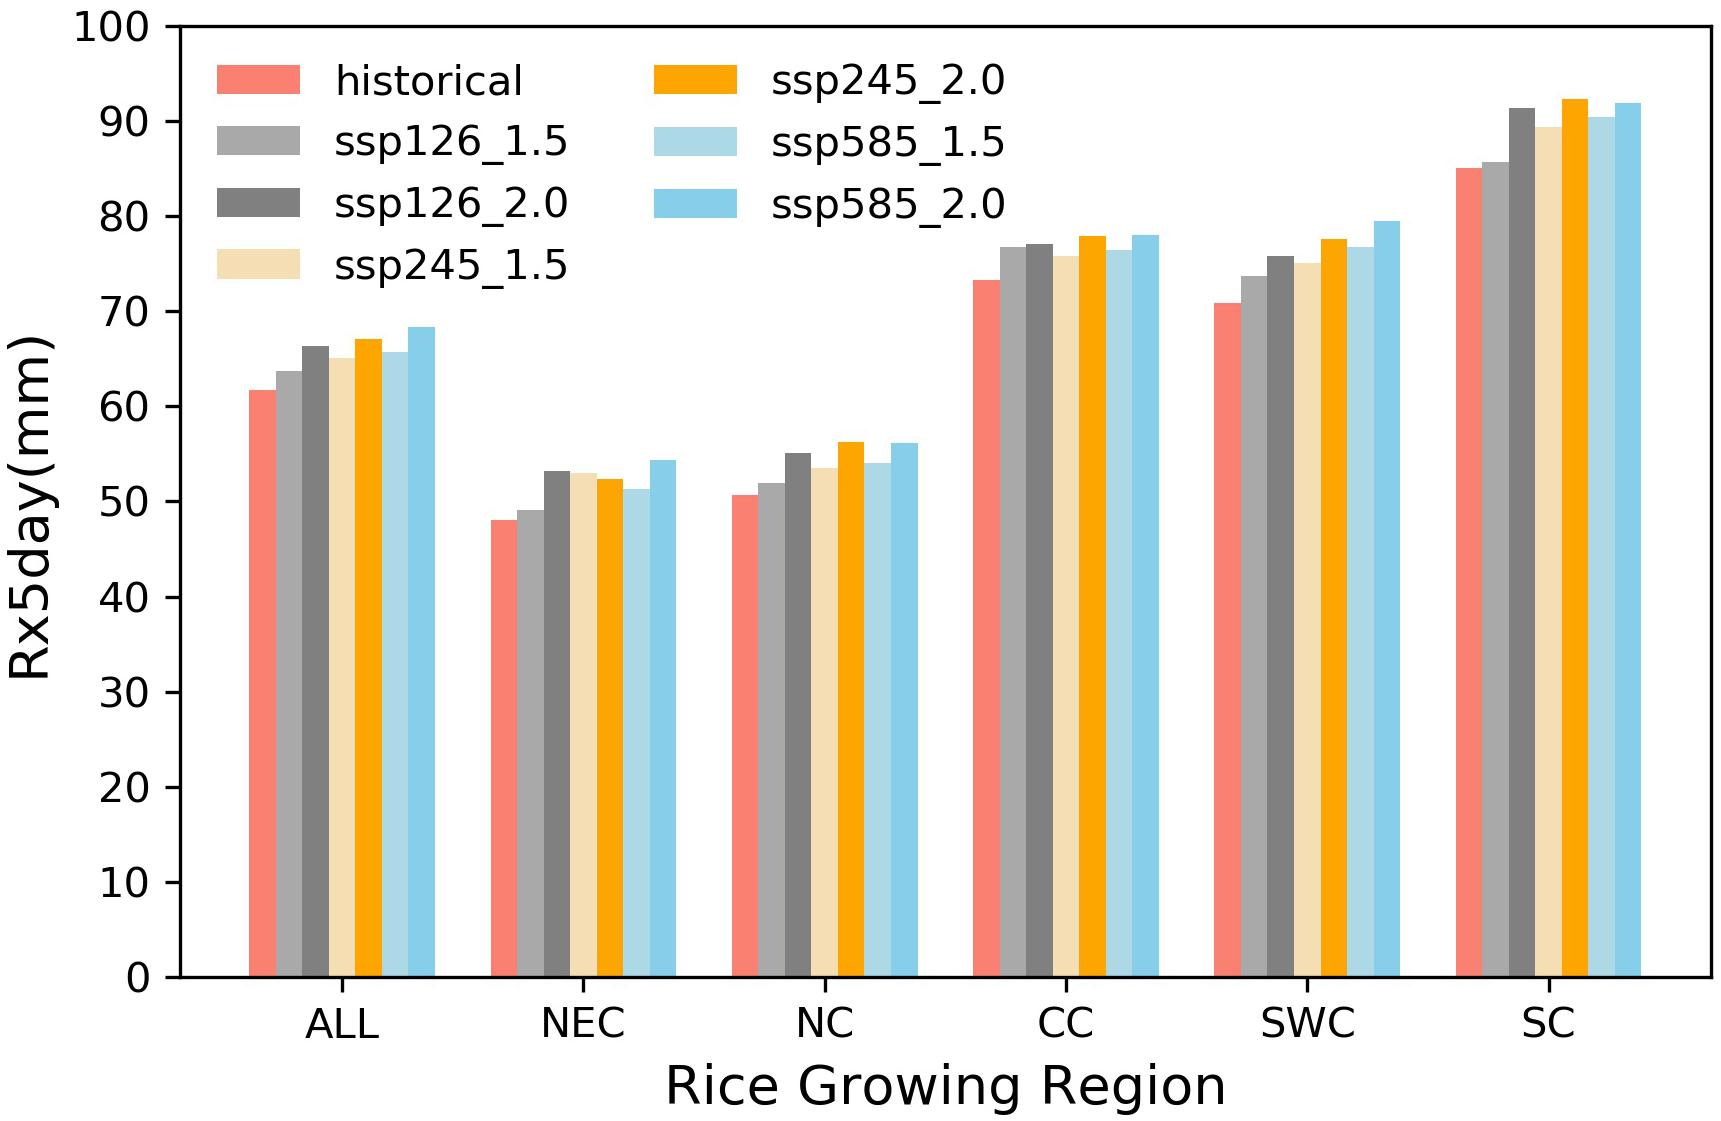
Figure 8. The same as Figure 6 but for the changes in 5-day maximum precipitation (Rx5day) (mm).
Under 2°C of global warming, the distribution of the Rx5day in the rice-growing regions was similar to that under 1.5°C of global warming. Taking the SSP245 scenario as an example, the Rx5day in the NEC, NC, CC, SWC, and SC reached 52.3, 56.2, 77.9, 77.6, and 92.3 mm, respectively.
Under the scenario of an additional 0.5°C increase in global temperature from 1.5 to 2°C, the Rx5day showed an increase of approximately 2.5 mm in almost every rice-growing region. However, there were large differences under different scenarios in the NC. Under the SSP126 scenario and SSP585 scenario, the Rx5day showed increases of 3.2 and 3.1 mm, respectively, but under the SSP585 scenario, it showed a decrease of 0.6 mm.
Under a 1.5°C of global warming, the R99pTOT in the rice-growing regions under the different scenarios mainly showed a gradually decreasing distribution from south to north (Figure 9). Taking the SSP245 scenario as an example, the R99pTOT in the NEC, NC, CC, SWC, and SC reached 38.9, 42.2, 54.2, 49.8, and 60.8 mm, respectively (Figure 10).
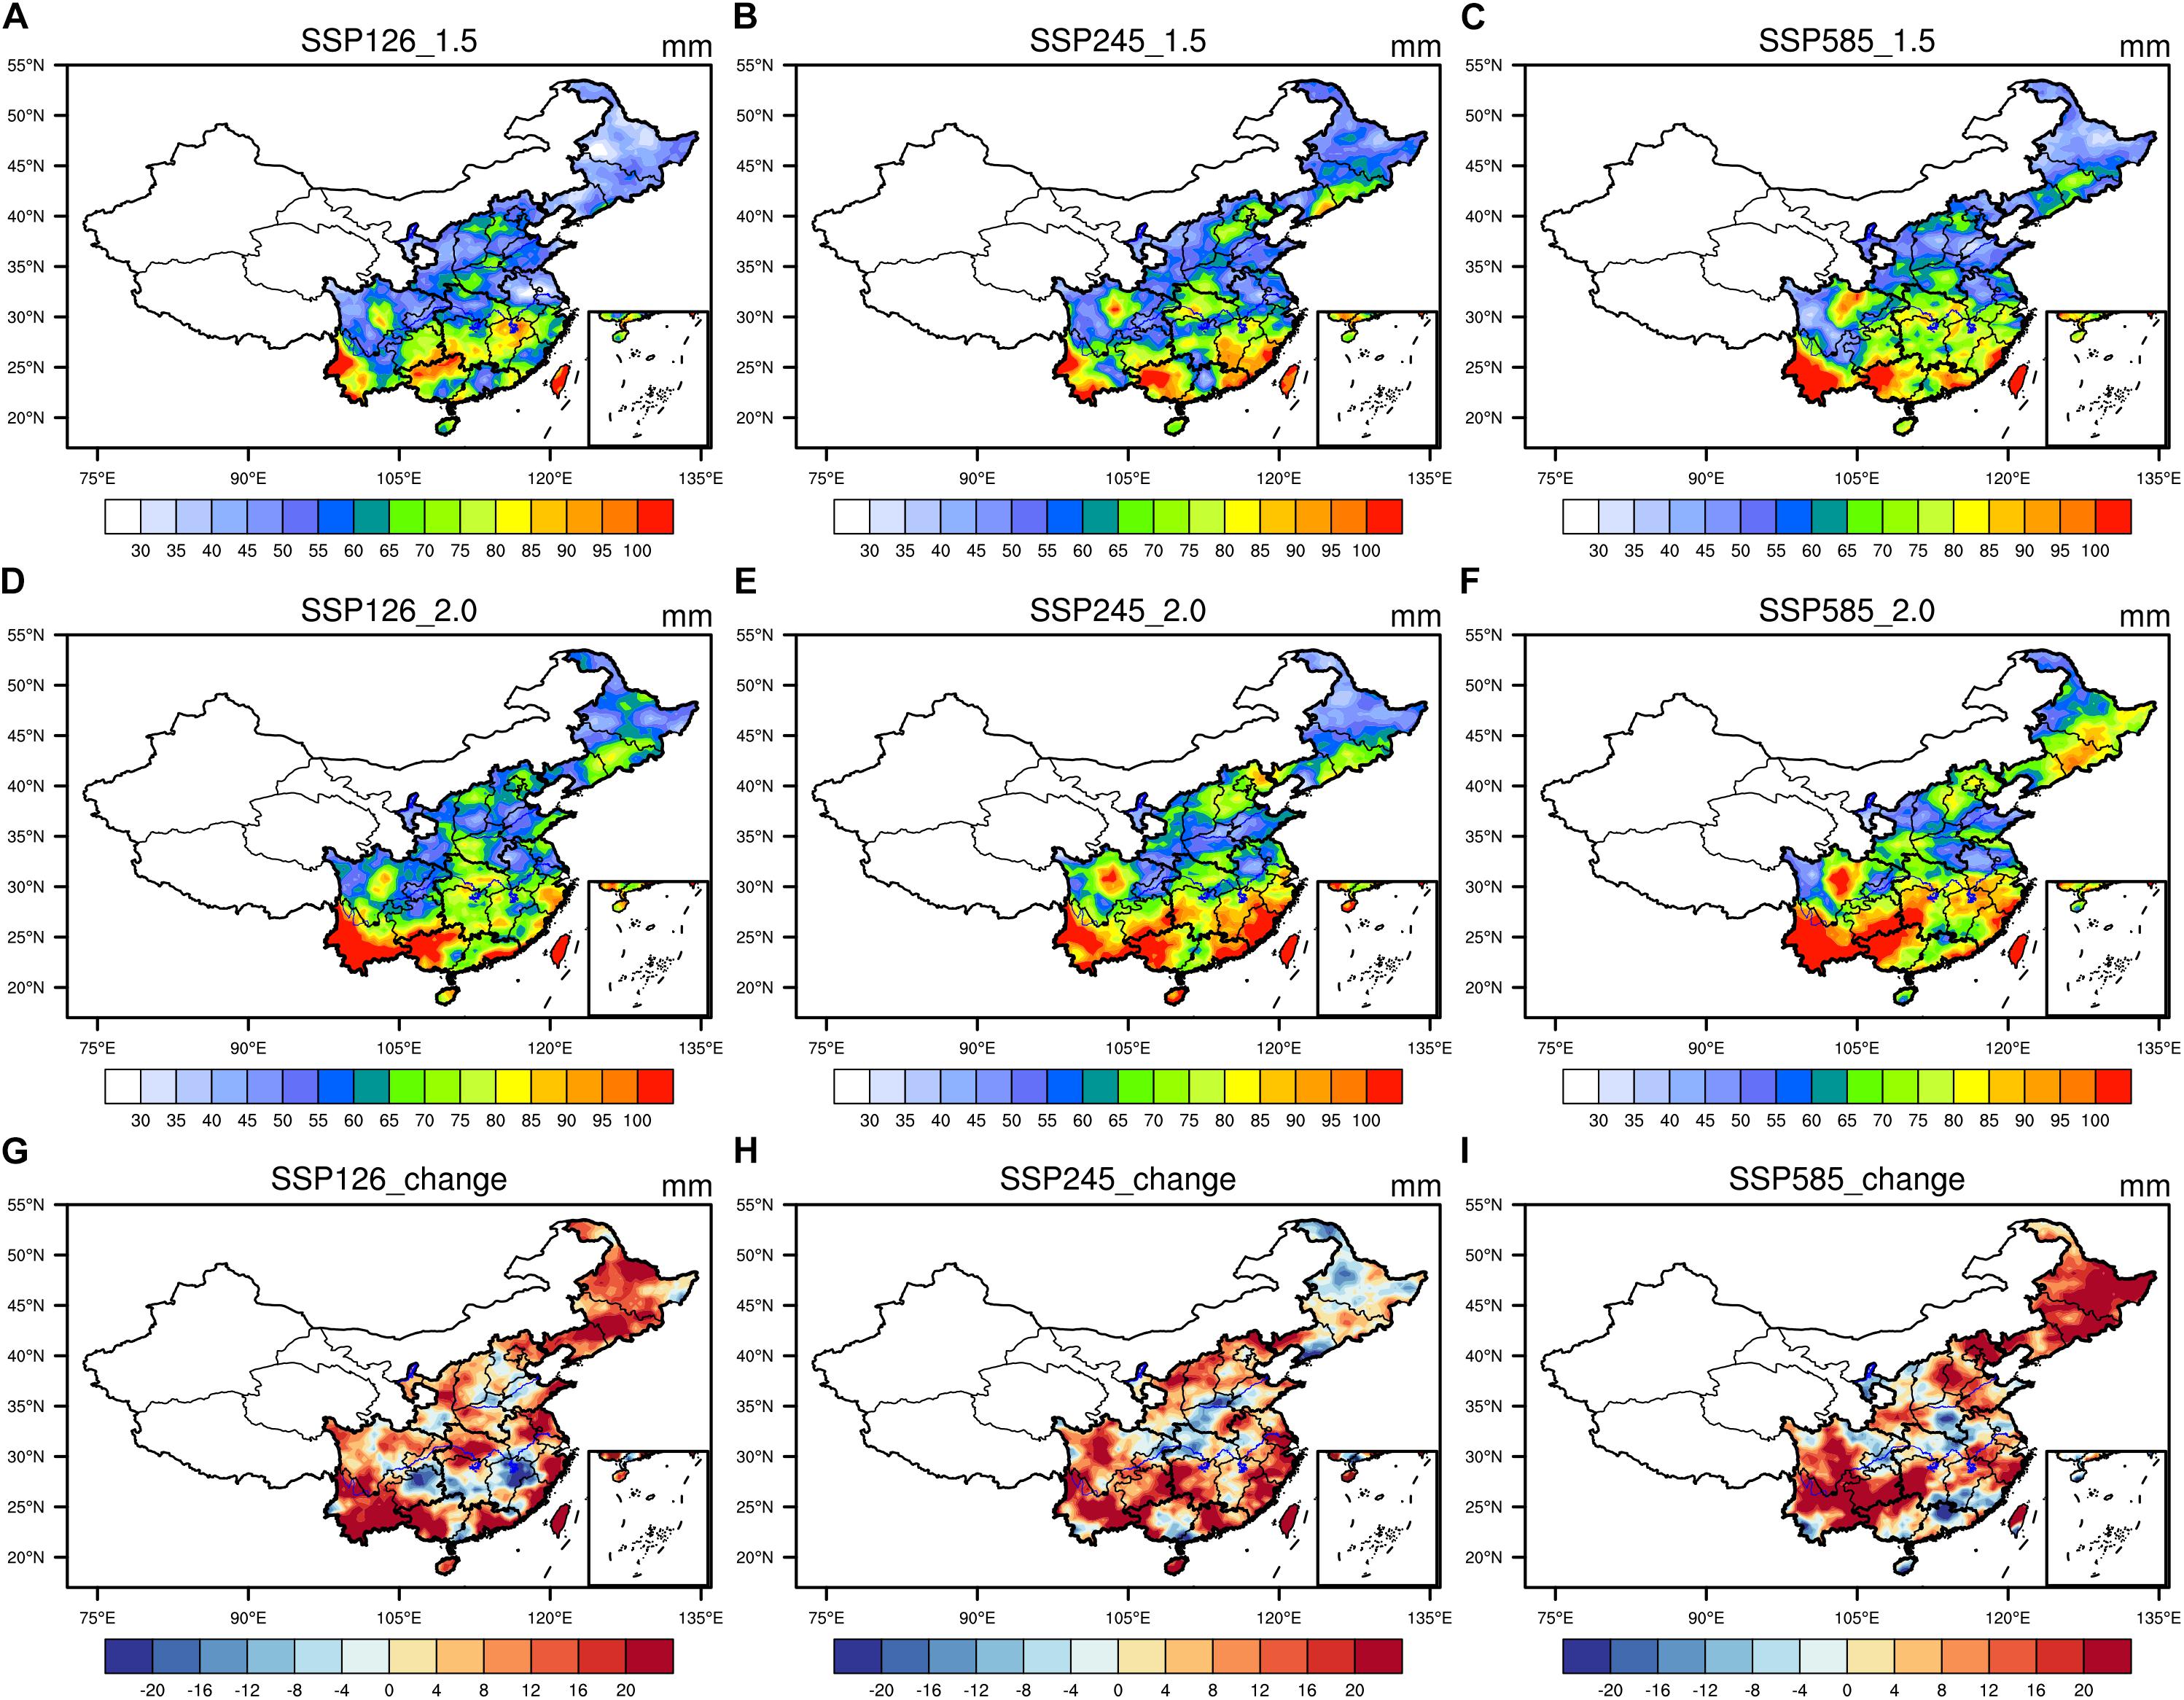
Figure 9. Distribution of annual total extreme precipitation (R99pTOT) at 1.5 and 2°C. (A–C) Global warming at 1.5°C under SSP126, SSP245, and SSP585, respectively. (D–F) Global warming at 2°C under SSP126, SSP245, and SSP585, respectively. (G–I) The differences between global warming at 1.5 and 2°C.
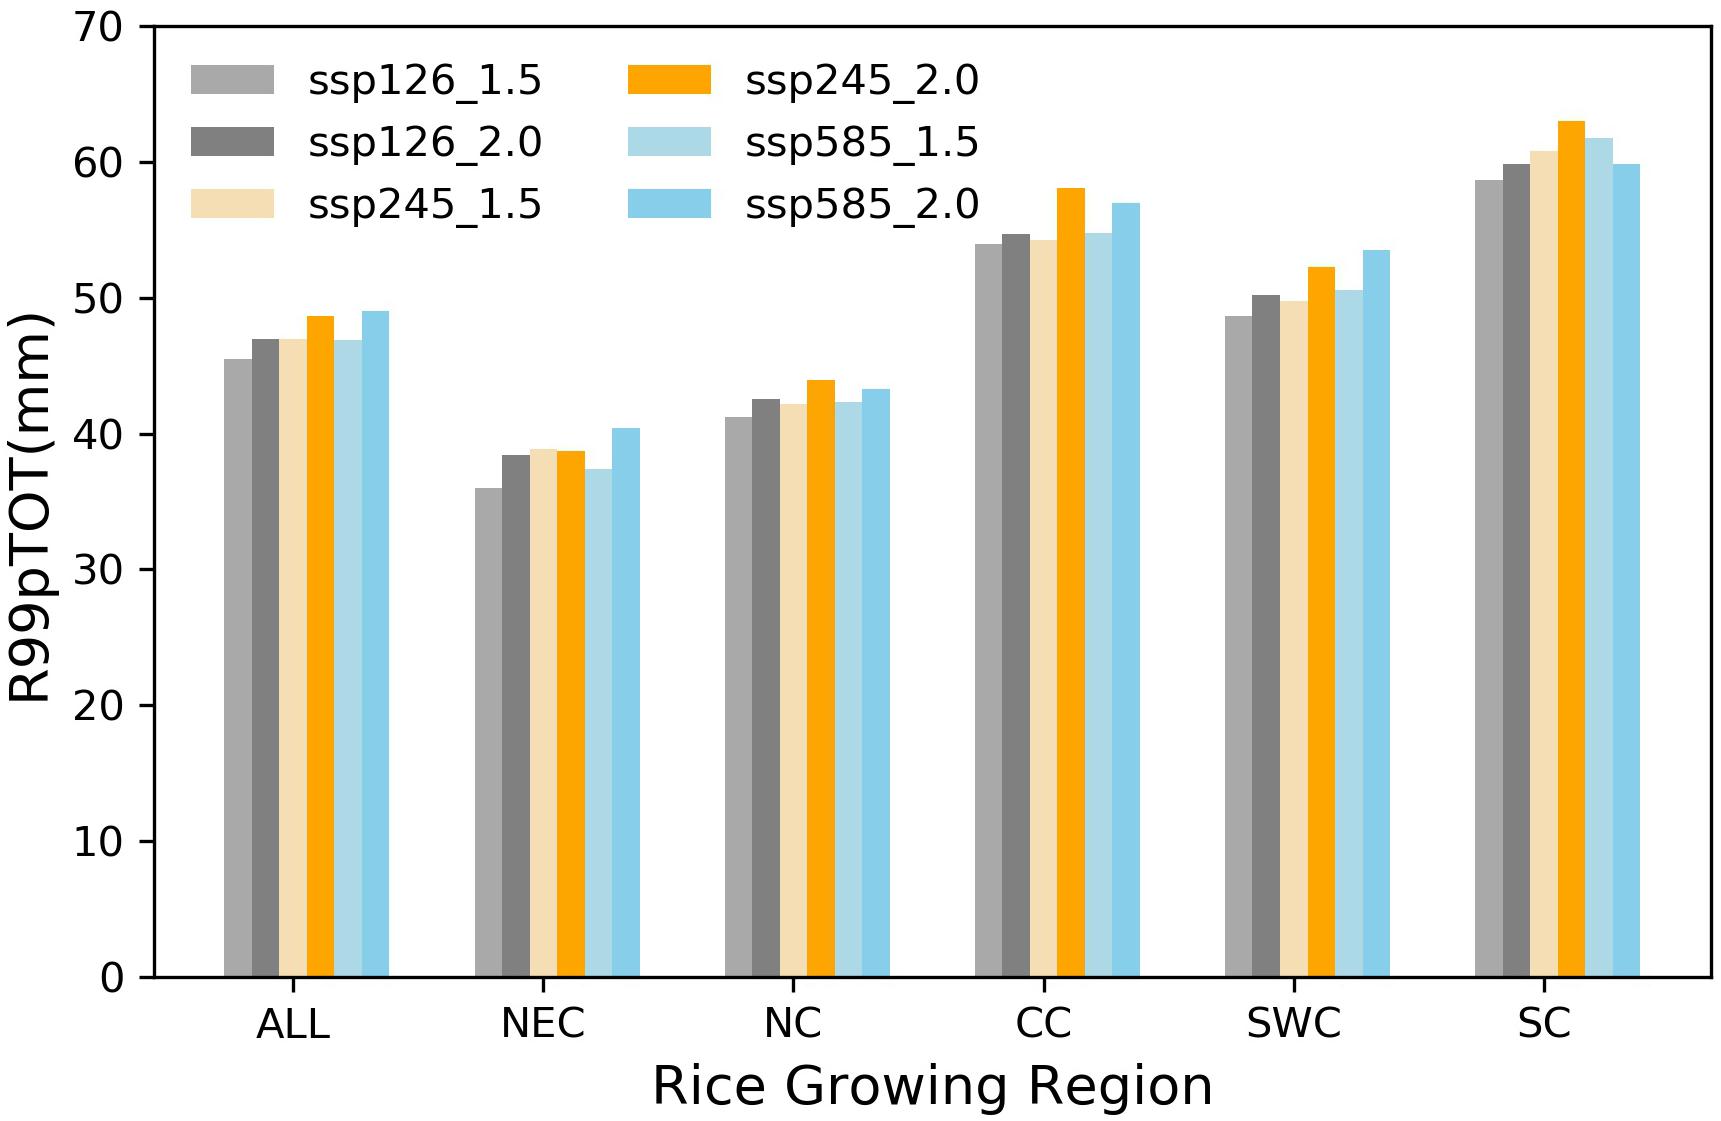
Figure 10. The same as Figure 6 but for the changes in annual total extreme precipitation (R99pTOT) (mm).
Under 2°C of global warming, the distribution of R99pTOT in the rice-growing regions was similar to that under global warming of 1.5°C. Taking the SSP245 scenario as an example, the R99pTOT in the CC, SWC, and SC reached 58.0, 52.2, and 63.0 mm, respectively.
Under the scenario of an additional 0.5°C increase in global temperature from 1.5 to 2°C, the R99pTOT showed an increasing trend in rice-growing regions. The R99pTOT increased significantly, especially in the SWC. Under the SSP245 scenario, the R99pTOT increased by as much as 3.8 mm. However, under the different scenarios, there were large differences in the NC. Under the SSP126 scenario and SSP585 scenario, the R99pTOT increased by 2.5 and 2.9 mm, respectively, but under the SSP585 scenario, it decreased by 0.2 mm.
The TX90p were calculated based on the historical time period. Under 1.5°C of global warming, the TX90p in the CC and SC were significantly higher than those in the other rice-growing regions. There were large differences among the different scenarios. The number of Tx90p increased significantly under the high emission pathway, especially in the NEC and NC.
Under the scenario of an additional 0.5°C increase in global temperature from 1.5 to 2°C, the number of Tx90p showed an increasing trend in the rice-growing regions (Figure 11). Under the same amount of temperature rise, the increase in the number of Tx90p under the high-emission scenario was significantly greater than that under the low-emission scenario. Under the SSP245 scenario, the number of Tx90p in the NEC, NC, CC, SWC, and SC was increased by 12.1, 11.0, 14.4, 12.6, and 13.7 days, respectively, and the increase under the SSP585 scenario was as high as 16.2, 18.5, 22.2, 22.0, and 25.1 days, respectively.
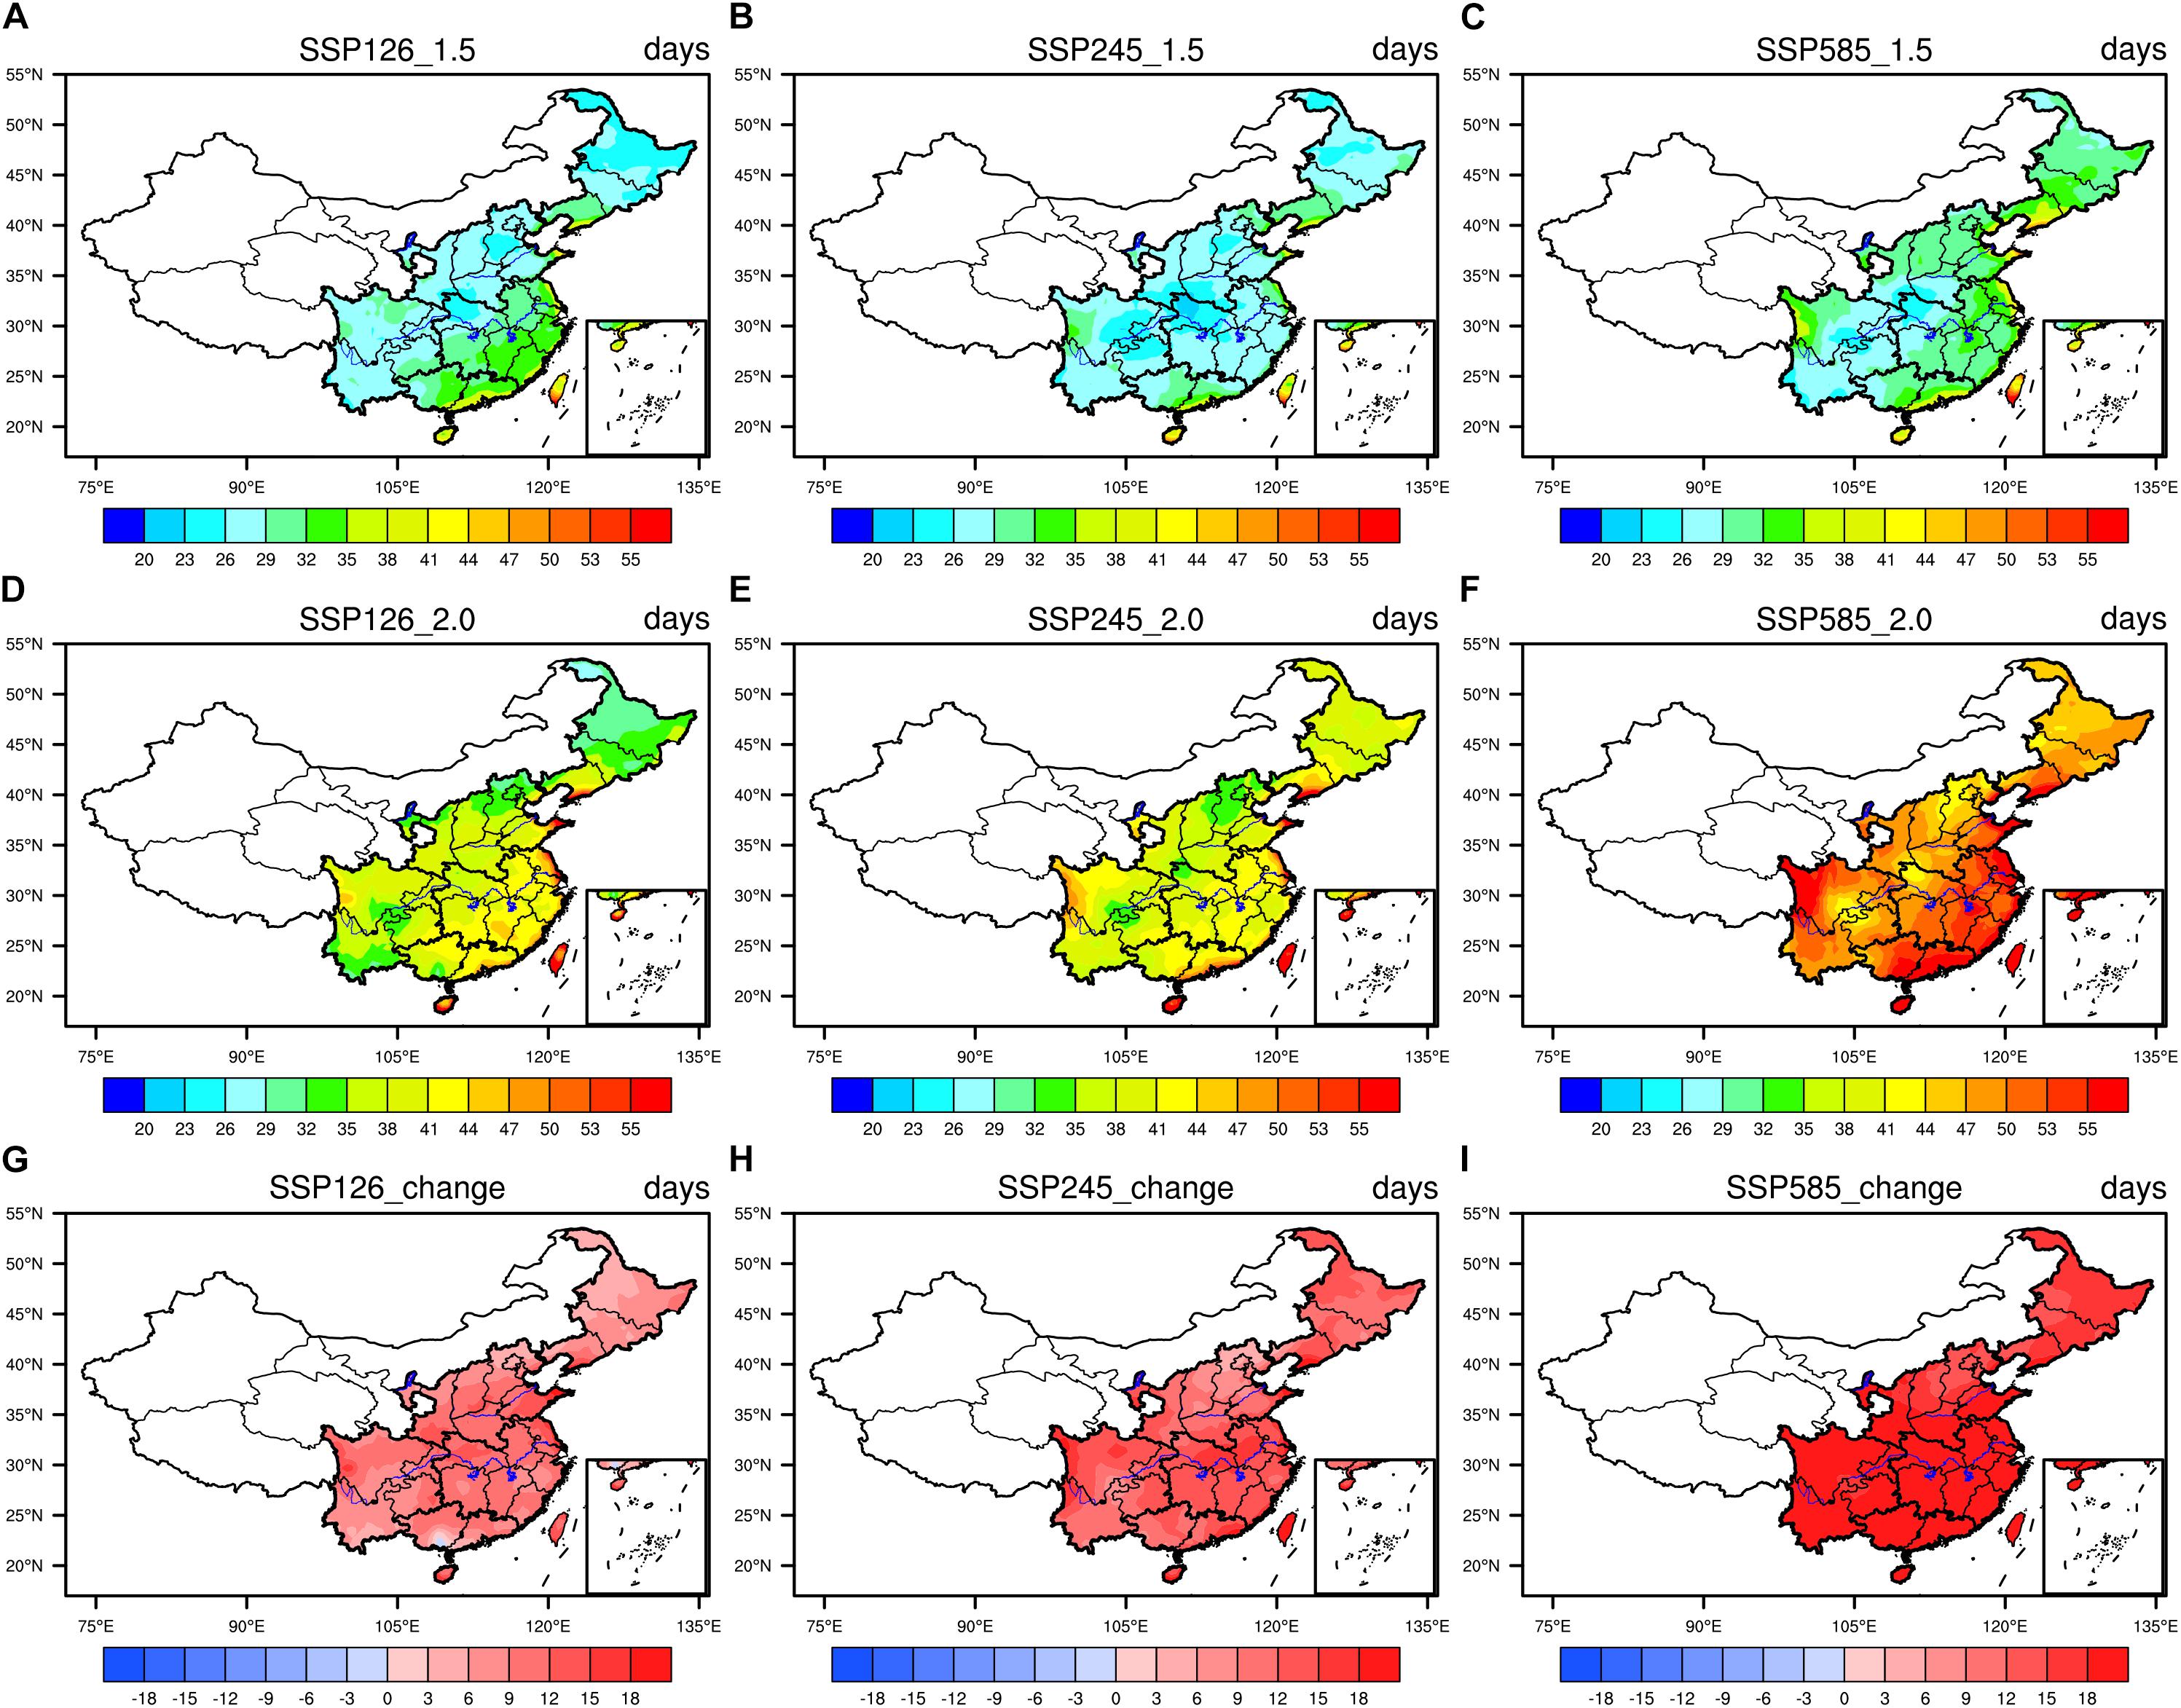
Figure 11. Distribution of warm days (TX90p) at 1.5 and 2°C. (A–C) Global warming at 1.5°C under SSP126, SSP245, and SSP585, respectively. (D–F) Global warming at 2°C under SSP126, SSP245, and SSP585, respectively. (G–I) The differences between global warming at 1.5 and 2°C.
Based on the rice booting-flowering period and rice filling period in the different regions, the Ha of each region was calculated. Future heat damage to rice mainly occurred in the NC and CC (Figure 12).
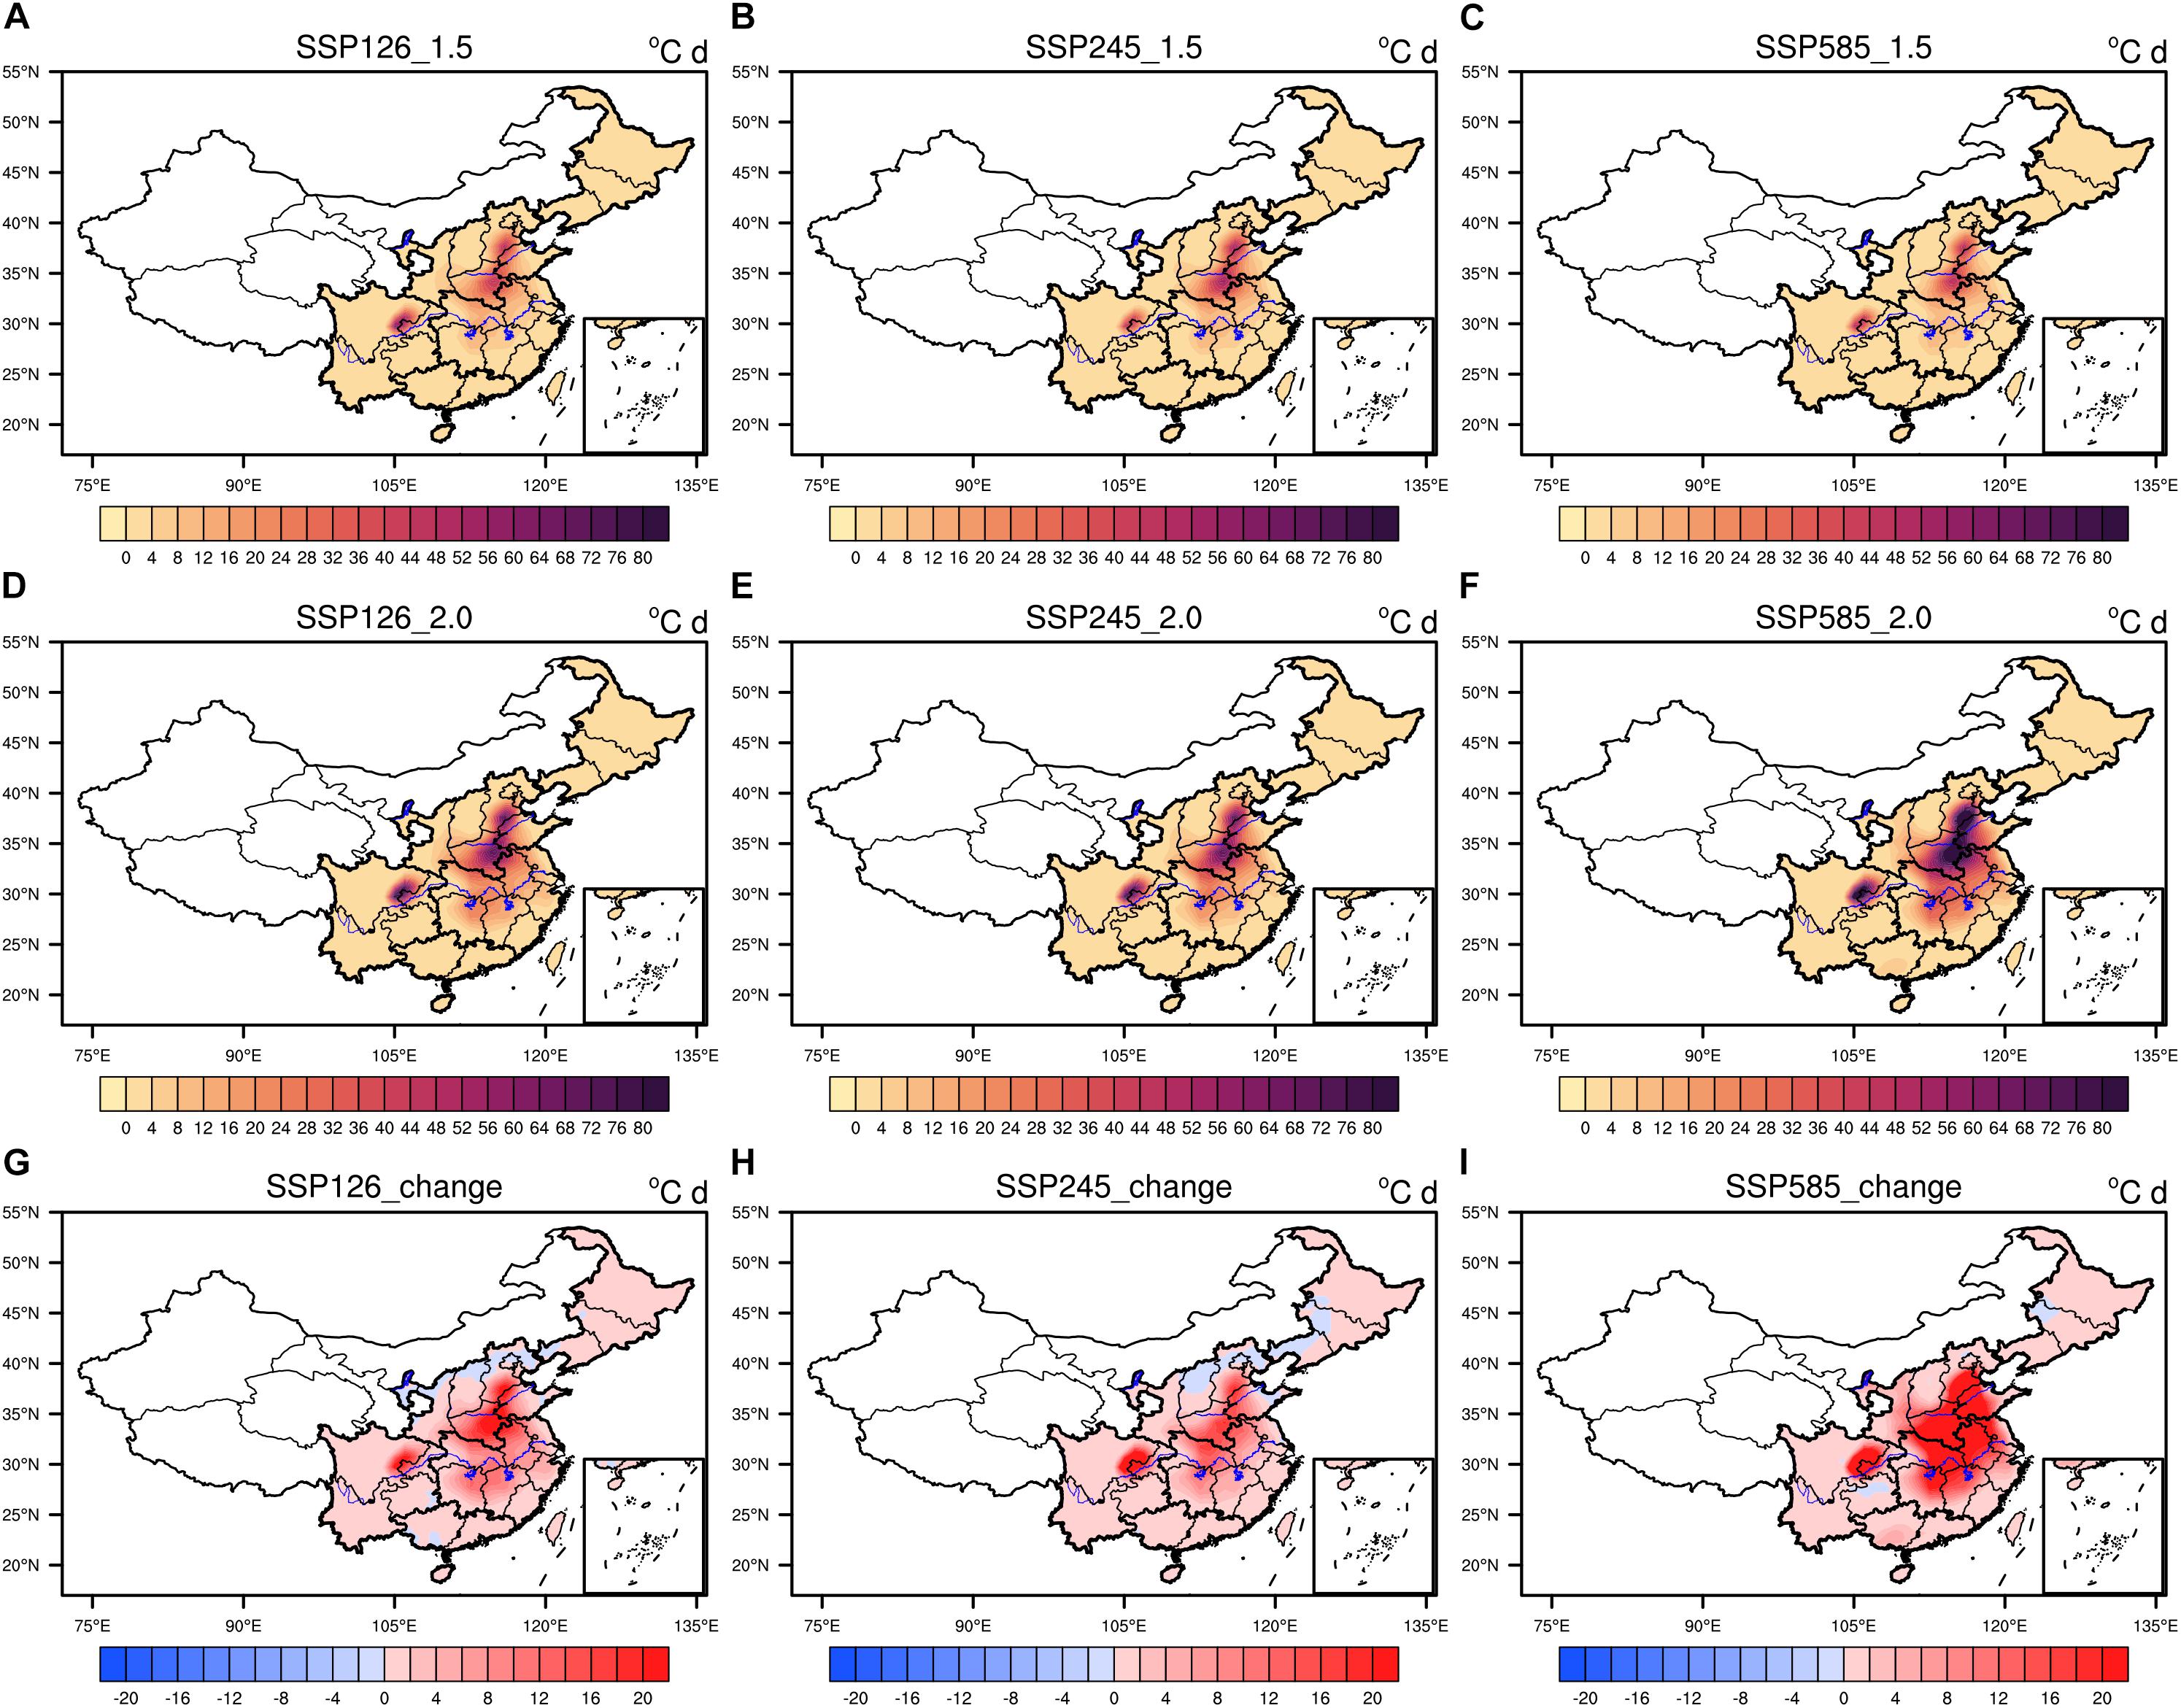
Figure 12. Distribution of rice heat damage index (Ha) at 1.5 and 2°C. (A–C) Global warming at 1.5°C under SSP126, SSP245, and SSP585, respectively. (D–F) Global warming at 2°C under SSP126, SSP245, and SSP585, respectively. (G–I) The differences between global warming at 1.5 and 2°C.
Under the scenario of an additional 0.5°C increase in global temperature from 1.5 to 2°C, the area and intensity of heat damage in the NC and CC increased significantly, and the increase was more significant under the high-emission scenario than under the low-emission scenario. Taking the SSP245 scenario as an example, the Ha in the NC and CC increased by 3.4 and 4.3°C/day under different temperature rise scenarios, respectively, and the amount of heat damage increased 0.4- and 0.6-fold, respectively.
timesFigure 13 shows that the Cd mainly occurred in the NEC and SWC.
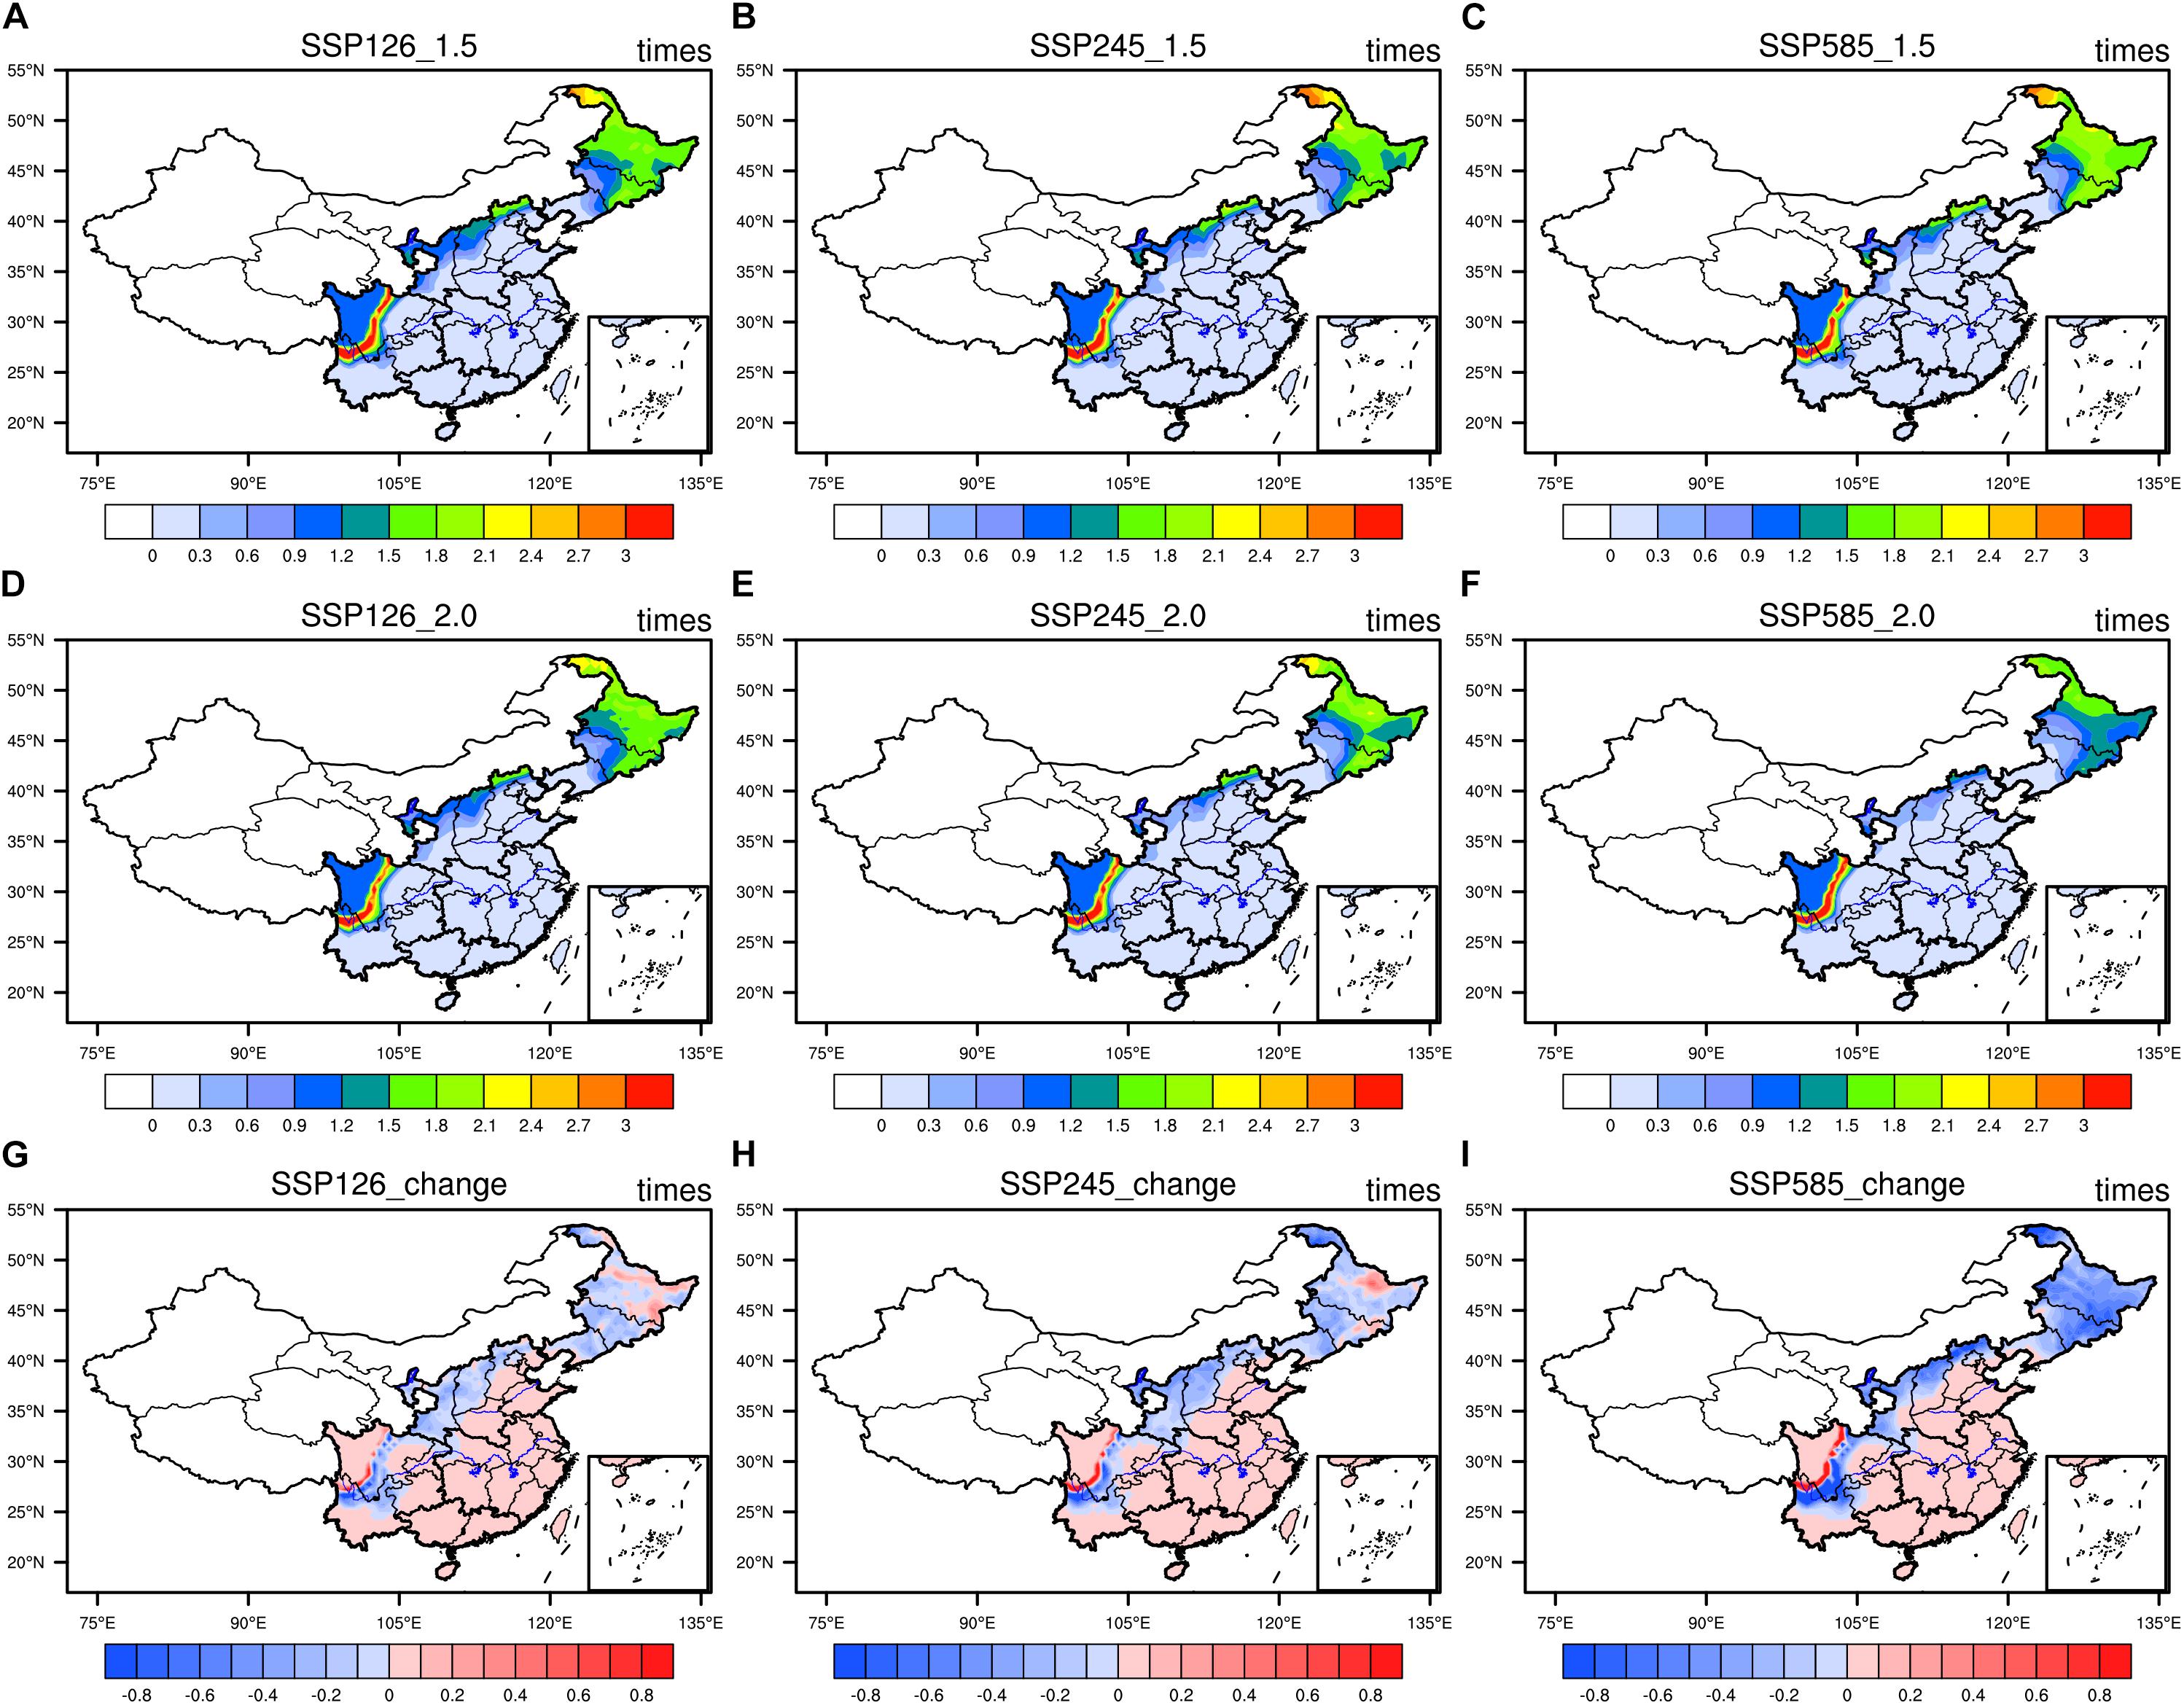
Figure 13. Distribution of rice cold damage index (Cd) at 1.5 and 2°C. (A–C) Global warming at 1.5°C under SSP126, SSP245, and SSP585, respectively. (D–F) Global warming at 2°C under SSP126, SSP245, and SSP585, respectively. (G–I) The differences between global warming at 1.5 and 2°C.
Under the scenario of an additional 0.5°C increase in the global temperature from 1.5 to 2°C, the Cd in the NEC and SWC decreased. Moreover, different scenarios were consistent. Taking the SSP245 scenario as an example, the Cd in the NEC decreased by 0.33 compared with that in the historical period. Under a 2°C temperature increase, the Cd was 0.14 times less than that under a 1.5°C temperature increase.
This article is mainly based on CMIP6 data, and it explores the time points when the global temperature is projected to increase by 1.5 and 2.0°C under different social scenarios. Based on the time period in the moderate emission scenario (SSP245) when the global temperature will increase by 1.5 and 2.0°C, the risk of extreme climate events in rice-growing regions was explored. Then, we analyzed the changes in extreme climate events in the rice-growing regions in the future under different temperature increase targets. The main conclusions obtained are as follows:
(1) The years when global temperature was projected to increase by 1.5 and 2.0°C were different under the different scenarios. The years when 1.5°C of warming occurred in the SSP126, SSP245, and SSP585 scenarios were 2,030, 2,029, and 2,026, respectively. The years when 2°C of global warming occurred in the SSP245 and SSP585 scenarios were 2049 and 2039, respectively. Under the high emission scenarios, the global temperature easily increased by 2°C. To control global warming and ensure an increase of 1.5°C, more stringent emission reduction measures need to be implemented.
(2) The risk of extreme climate events occurring in the rice-growing regions of China at a temperature increase of 2.0°C was significantly higher than the risk at a temperature increase of 1.5°C. The number of TX90p, Ha, Rx5day and R99pTOT in the rice-growing regions of China increased. In contrast, the CDD and Cd decreased. However, the changes in the different rice-growing regions were relatively different. The R99pTOT and the Rx5day increased significantly in the CC and the SWC. The CDD decreased significantly in the NC and SC. The Ha of the NC and the CC increased by 3.4 and 4.3, respectively. The rice cold damage index in the NEC decreased by 0.33.
(3) Under the different socio-scenarios of SSP126, SSP245 and SSP585, the CDD, the Rx5day, the R99pTOT, the number of Tx90p, and the Ha increased, and the Cd decreased. The increase in extreme climate events under the high emission scenario was more obvious. However, there were differences in the results under the different social scenarios for the CDD, the Rx5day, and the R99pTOT in the NEC.
(4) In general, the risk of extreme high-temperature events occurring in the rice-growing regions of China will increase in the future, and the risk of extreme low-temperature events occurring will decrease. In particular, the NC and CC will experience a significant increase in the risk of extreme heat disasters. The risk of low-temperature disasters in the NEC will be reduced. In addition, in the future, the risk of extreme precipitation events in the rice-producing areas will increase, especially in the SWC and the SC. The risk of extreme precipitation events in the NEC in the future is highly uncertain.
(5) This study helps to understand the climate change trend and risk situation in Chinese rice-production areas. The risk of extreme high-temperature events and extreme precipitation events occurring in the rice-producing areas will increase. In addition, this study also provides information that will help with early warning and forecasting of extreme disaster events, preventing disasters and mitigating disasters, as well as with rationally laying out rice production and responding to risk, which are important scientifically and practically. This study is mainly based on CMIP6 model data. Although in comparison to other models, the CMIP6 model can better simulate changes in historical periods, future climate changes will be affected by various natural and human factors and other uncertain factors. In addition, there are uncertainties within global climate models such as those related to the simulation of future temperature and precipitation. This article only studied the overall trend in the changes in future extreme climate events in the five main rice producing areas of China, but for specific small areas, there is a lack of more refined research. In future work, dynamic downscaling of the climate model could be used to improve the resolution of the model and to conduct a more refined study of changes in future extreme climate events in the rice-growing regions.
Publicly available datasets were analyzed in this study. This data can be found here: https://esgf-node.llnl.gov/projects/cmip6/.
WZ and JC: conceptualization. WZ: methodology, software, resources, writing-review and editing, writing-original draft preparation, and supervision. WZ, JL, and MS: validation. FY: formal analysis. YX and YL: investigation. JC: data curation, visualization, and funding acquisition. YX: project administration. All authors have read and agreed to the published version of the manuscript.
This work was supported by the National Key Research and Development Program of China (2016YFA0602703; 2018YFC1509003) and the National Natural Science Foundation of China (42075167).
The authors declare that the research was conducted in the absence of any commercial or financial relationships that could be construed as a potential conflict of interest.
Almazroui, M., Saeed, S., and Saeed, F. (2020). Projections of precipitation and temperature over the South Asian Countries in CMIP6. Earth Syst. Environ. 4, 297–320. doi: 10.1007/s41748-020-00157-7
Chen, H., Sun, J., Lin, W., and Xu, H. (2020). Comparison of CMIP6 and CMIP5 models in simulating climate extremes. Sci. Bull. 65, 1415–1418. doi: 10.1016/j.scib.2020.05.015
Chen, W., Xu, Z., and Tang, L. (2017). 20 years; development of super rice in China—The 20th anniversary of the super rice in China. J. Integr. Agric. 16, 981–983. doi: 10.1016/S2095-3119(16)61612-X
Chou, J., Dong, W., and Yan, X. (2016). The impact of climate change on the socioeconomic system: a mechanistic analysis. Chin. J. Atmos. Sci. 40, 191–200. doi: 10.3878/j.issn.1006-9895.1507.15131
Chou, J., Xian, T., Dong, W., and Xu, Y. (2019a). Regional temporal and spatial trends in drought and flood disasters in china and assessment of economic losses in recent years. Sustainability 11:55. doi: 10.20944/preprints201811.0340.v1
Chou, J., Xu, Y., and Dong, W. (2019b). Research on the variation characteristics of climatic elements from April to September in China’s main grain-producing areas. Theor. Appl. Climatol. 137, 3197–3207. doi: 10.1007/s00704-019-02795-y
Dan, L., Ji, J., and Li, Y. (2002). Climate simulations based on a different-grid nested and coupled model. Adv.Atmos. Sci. 19, 487–499. doi: 10.1007/s00376-002-0081-1
Dosio, A. (2016). Projections of climate change indices of temperature and precipitation from an ensemble of bias-adjusted high-resolution EURO-CORDEX regional climate models. J. Geophys. Res. Atmos. 121, 5488–5511. doi: 10.1002/2015JD024411
Feng, J., Yonghe, L., and Yan, Z. (2014). Analysis of surface air temperature warming rate of China in the last 50 years (1962–2011) using k-means clustering. Theor. Appl. Climatol. 120, 785–796. doi: 10.1007/s00704-014-1216-x
Gaupp, F., Hall, J., and Hochrainer-Stigler, S. (2019). Changing risks of simultaneous global breadbasket failure. Nat. Clim. Chang. 10, 54–57. doi: 10.1038/s41558-019-0600-z
Guo, X., Huang, J., and Luo, Y. (2017). Projection of heat waves over China for eight different global warming targets using 12 CMIP5 models. Theor. Appl. Climatol. 128, 507–522. doi: 10.1007/s00704-015-1718-1
Haylock, M., Cawley, G., Harpham, C., Wilby, R., and Goodess, C. (2006). Downscaling heavy precipitation over the United Kingdom: a comparison of dynamical and statistical methods and their future scenarios. Int. J. Climatol. 26, 1397–1415. doi: 10.1002/joc.1318
Hu, Y., Dong, W., and He, Y. (2007). Progress of the study of extreme weather and climate events at the beginning of the twenty first century. Adv. Earth Sci. 10, 1066–1075.
IPCC (2013). Climate Change (2013): The Physical Science Basis. Cambridge: Cambridge University Press, 1535.
IPCC (2018). Global Warming of 1.5 C (2018). An IPCC Special Report on the Impacts of Global Warming of 1.5 C Above Pre-Industrial levels and Related Global Greenhouse gas Emission Pathways, in the Context of Strengthening the Global Response to the Threat of Climate Change, Sustainable Development, and Efforts to Eradicate Poverty. Geneva: IPCC.
Ju, H., van der Velde, M., Lin, E., Xiong, W., and Li, Y. (2013). The impacts of climate change on agricultural production systems in China. Clim. Change 120, 313–324. doi: 10.1007/s10584-013-0803-7
Knutti, R., Rogelj, J., Sedláček, J., and Fischer, E. M. (2016). A scientific critique of the two-degree climate change target. Nat. Geosci. 9, 13–18. doi: 10.1038/ngeo2595
Li, D., Zhou, T., Zou, L., Zhang, W., and Zhang, L. (2018). Extreme high-temperature events over East Asia in 1.5°C and 2°C warmer futures: analysis of NCAR CESM low-warming experiments. Geophys. Res. Lett. 45, 1541–1550. doi: 10.1002/2017GL076753
Li, Q., Dong, W., and Li, W. (2010). Assessment of the uncertainties in temperature change in China during the last century. Chin. Sci. Bull. 55, 1974–1982. doi: 10.1007/s11434-010-3209-1
Luo, Y., Zhang, Z., Chen, Y., Li, Z., and Tao, F. (2020). ChinaCropPhen1km: a high-resolution crop phenological dataset for three staple crops in China during 2000–2015 based on leaf area index (LAI) products. Earth Syst. Sci. Data 12, 197–214. doi: 10.5194/essd-12-197-2020
Nangombe, S., Zhou, T., and Zhang, W. (2018). Record-breaking climate extremes in Africa under stabilized 1.5°C and 2°C global warming scenarios. Nat. Clim. Change 8, 375–380. doi: 10.1038/s41558-018-0145-6
Ren, G., Feng, G., and Yan, Z. (2010). Progresses in observation studies of climate extremes and changes in Mainland China (in Chinese). Clim. Environ. Res. 15, 337–353. doi: 10.3878/j.issn.1006-9585.2010.04.01
Sun, W., and Huang, Y. (2011). Global warming over the period 1961-2008 did not increase high-temperature stress but did reduce low temperature stress in irrigated rice across China. Agric. For. Meteorol. 151, 1193–1201. doi: 10.1016/j.agrformet.2011.04.009
Tian-Yun, D., Dong, W., Yan, G., and Chou, J. (2018). Future temperature changes over the critical Belt and Road region based on CMIP5 models. Adv. Clim. Change Res. 9, 57–65.
Ukkola, A. M., De Kauwe, M. G., Roderick, M. L., Abramowitz, G., and Pitman, A. J. (2020). Robust future changes in meteorological drought in CMIP6 projections despite uncertainty in precipitation. Geophys. Res. Lett. 46:e2020GL087820. doi: 10.1029/2020GL087820
Wang, P., Zhang, Z., and Chen, Y. (2016). How much yield loss has been caused by extreme temperature stress to the irrigated rice production in China? Clim. Change 134, 635–650. doi: 10.1007/s10584-015-1545-5
Wheeler, T., and von Braun, J. (2013). Climate change impacts on global food security. Science 341, 508–513. doi: 10.1126/science.1239402
Wu, J., Han, Z., Xu, Y., Zhou, B., and Gao, X. (2020). Changes in extreme climate events in China under 1.5 C–4 C global warming targets: projections using an ensemble of regional climate model simulations. J. Geophys. Res. Atmos. 125:e2019JD031057. doi: 10.1029/2019JD031057
Xiong, W., Skalský, R., Porter, C. H., Balkovič, J., Jones, J. W., and Yang, D. (2016). Calibration-induced uncertainty of the EPIC model to estimate climate change impact on global maize yield. J. Adv. Model. Earth Syst. 8, 1358–1375. doi: 10.1002/2016MS000625
Xu, Y., Zhang, Y., Lin, Y., Lin, E., Lin, W., and Dong, W. (2006). Analysis of regional climate change response in China under SRES B2 scenario using PRECIS (in Chinese). Chin. Sci. Bull. 17, 2068–2074. doi: 10.1360/csb2006-15-17-2068
Xuejie, G., Zongci, Z., and Giorgi, F. (2002). Changes of extreme events in regional climate simulations over East Asia. Adv. Atmos. Sci. 19, 927–942. doi: 10.1007/s00376-002-0056-2
Yang, S., Feng, J., Dong, W., and Chou, J. (2014). Analyses of extreme climate events over China based on CMIP5 historical and future simulations. Adv. Atmos. Sci. 31, 1209–1220. doi: 10.1007/s00376-014-3119-2
Zhang, W., Zhou, T., and Zou, L. (2018). Reduced exposure to extreme precipitation from 0.5°C less warming in global land monsoon regions. Nat. Commun. 9:3153. doi: 10.1038/s41467-018-05633-3
Zhou, T., Chen, Z., Zou, L., and Chen, X. (2020). Development of climate and earth system models in China: past achievements and new CMIP6 results. J. Meteorol. Res. 34, 1–19. doi: 10.1007/s13351-020-9164-0
Keywords: global warming, 15cpsdummy°C and 2cpsdummy°C warming target, extreme climate events, rice growing regions, risk
Citation: Chou J, Zhao W, Li J, Xu Y, Yang F, Sun M and Li Y (2021) Changes in Extreme Climate Events in Rice-Growing Regions Under Different Warming Scenarios in China. Front. Earth Sci. 9:655128. doi: 10.3389/feart.2021.655128
Received: 18 January 2021; Accepted: 04 March 2021;
Published: 22 April 2021.
Edited by:
Boyin Huang, National Centers for Environmental Information, National Oceanic and Atmospheric Administration, United StatesCopyright © 2021 Chou, Zhao, Li, Xu, Yang, Sun and Li. This is an open-access article distributed under the terms of the Creative Commons Attribution License (CC BY). The use, distribution or reproduction in other forums is permitted, provided the original author(s) and the copyright owner(s) are credited and that the original publication in this journal is cited, in accordance with accepted academic practice. No use, distribution or reproduction is permitted which does not comply with these terms.
*Correspondence: Weixing Zhao, MjAxOTIxMDUxMTQ2QG1haWwuYm51LmVkdS5jbg==
Disclaimer: All claims expressed in this article are solely those of the authors and do not necessarily represent those of their affiliated organizations, or those of the publisher, the editors and the reviewers. Any product that may be evaluated in this article or claim that may be made by its manufacturer is not guaranteed or endorsed by the publisher.
Research integrity at Frontiers
Learn more about the work of our research integrity team to safeguard the quality of each article we publish.