
94% of researchers rate our articles as excellent or good
Learn more about the work of our research integrity team to safeguard the quality of each article we publish.
Find out more
ORIGINAL RESEARCH article
Front. Earth Sci., 31 May 2021
Sec. Hydrosphere
Volume 9 - 2021 | https://doi.org/10.3389/feart.2021.651731
 Moein Mellat1,2*†
 Hannah Bailey1
 Kaisa-Riikka Mustonen1
 Hannu Marttila2
 Eric S. Klein3
 Konstantin Gribanov4
 M. Syndonia Bret-Harte5Artem V. Chupakov6Dmitry V. Divine7
 Brent Else8Ilya Filippov9Valtteri Hyöky1,10Samantha Jones8
 Sergey N. Kirpotin11,12Aart Kroon13Helge Tore Markussen7Martin Nielsen13Maia Olsen14
 Riku Paavola15Oleg S. Pokrovsky11,16
 Anatoly Prokushkin17,18
 Morten Rasch13Katrine Raundrup14Otso Suominen19Ilkka Syvänperä19
 Sölvi Rúnar Vignisson20
 Evgeny Zarov9
 Jeffrey M. Welker1,21,22
Arctic sea-ice loss is emblematic of an amplified Arctic water cycle and has critical feedback implications for global climate. Stable isotopes (δ18O, δ2H, d-excess) are valuable tracers for constraining water cycle and climate processes through space and time. Yet, the paucity of well-resolved Arctic isotope data preclude an empirically derived understanding of the hydrologic changes occurring today, in the deep (geologic) past, and in the future. To address this knowledge gap, the Pan-Arctic Precipitation Isotope Network (PAPIN) was established in 2018 to coordinate precipitation sampling at 19 stations across key tundra, subarctic, maritime, and continental climate zones. Here, we present a first assessment of rainfall samples collected in summer 2018 (n = 281) and combine new isotope and meteorological data with sea ice observations, reanalysis data, and model simulations. Data collectively establish a summer Arctic Meteoric Water Line where δ2H = 7.6⋅δ18O–1.8 (r2 = 0.96, p < 0.01). Mean amount-weighted δ18O, δ2H, and d-excess values were −12.3, −93.5, and 4.9‰, respectively, with the lowest summer mean δ18O value observed in northwest Greenland (−19.9‰) and the highest in Iceland (−7.3‰). Southern Alaska recorded the lowest mean d-excess (−8.2%) and northern Russia the highest (9.9‰). We identify a range of δ18O-temperature coefficients from 0.31‰/°C (Alaska) to 0.93‰/°C (Russia). The steepest regression slopes (>0.75‰/°C) were observed at continental sites, while statistically significant temperature relations were generally absent at coastal stations. Model outputs indicate that 68% of the summer precipitating air masses were transported into the Arctic from mid-latitudes and were characterized by relatively high δ18O values. Yet 32% of precipitation events, characterized by lower δ18O and high d-excess values, derived from northerly air masses transported from the Arctic Ocean and/or its marginal seas, highlighting key emergent oceanic moisture sources as sea ice cover declines. Resolving these processes across broader spatial-temporal scales is an ongoing research priority, and will be key to quantifying the past, present, and future feedbacks of an amplified Arctic water cycle on the global climate system.
Over the past two decades Arctic surface air temperature (SAT) has increased by +1.7°C relative to the long-term mean (1981–2010) (Overland et al., 2019). This rapid warming has occurred at twice the global mean rate (i.e., Arctic amplification), and coincides with pronounced changes in the Arctic hydrologic cycle including marine and terrestrial ice loss, increased atmospheric humidity, shifting ocean circulation regimes, and changes in the magnitude and frequency of extreme weather events (Stroeve and Notz, 2018; Huang et al., 2019; Kapsch et al., 2019; Smith and Sheridan, 2020; Bailey et al., 2021). Understanding and tracing these complex interactions in the coupled ocean-atmosphere-cryosphere system is key to resolving pan-Arctic moisture budgets and feedbacks into the global climate system over the coming decades (Vihma et al., 2016), particularly considering the forecast ice-free Arctic Ocean by summer 2050 (SIMIP Community, 2020).
Stable isotopes (18O/16O and 2H/1H) and the secondary parameter deuterium (d)-excess are valuable hydrological tracers (Galewsky et al., 2016; Bowen et al., 2019). Six decades after the pioneering work of Dansgaard (1964) and facilitated by the Global Network of Isotopes in Precipitation (GNIP: IAEA/WMO, 2019) and regional sampling efforts such as the U.S. Network for Isotopes in Precipitation (USNIP: Welker, 2000, 2012), the research community has established and applied a deep understanding of stable isotope geochemistry to constrain complex environmental processes through space and time (Rozanski et al., 1992; Galewsky et al., 2016; Bowen et al., 2019). For example, existing Arctic studies have used localized water isotope measurements to: understand dynamic processes related to atmospheric humidity, wind, and sea surface temperatures (SST) (Klein and Welker, 2016; Bonne et al., 2019); to explore how shifts in the stratospheric polar vortex and transient cyclones transport moisture from the Arctic to North America (Klein et al., 2015; Puntsag et al., 2016); to partition hydro- and biogeochemical fluxes and regimes in high latitude freshwater systems (Bhatia et al., 2011; Fransson et al., 2020; Juhls et al., 2020); and to quantify how these processes manifest in water isotopologues past and present (Steen-Larsen et al., 2011; Bailey et al., 2014; Klein et al., 2016; Biskaborn et al., 2019; Kostrova et al., 2019). Whereas traditional applications have focused on the temperature-dependency of stable isotope fractionation in precipitation (Dansgaard, 1964), these contemporary studies highlight the multitude of natural processes influencing stable isotope geochemistry across variable spatial domains. Hence, our ability to fully utilize stable isotope data across the Arctic is dependent on a contemporary, dense observational network of accurate event-based δ18O/δ2H measurements. Yet, of the 78 GNIP stations located in the Arctic (north of 60°N), just seven (9%) are active in 2020 and all comprise monthly composited data, thus limiting our ability to quantify and apply local- to regionally resolved climate-isotope relations across the Arctic at the event scale.
To address this knowledge gap and provide a community-driven data infrastructure and resource, the Pan-Arctic Precipitation Isotope Network (PAPIN) was established in 2018 and today comprises 28 sampling stations across the Arctic spanning key tundra, subarctic, maritime, and continental climate zones (Figure 1). Here, we present a first assessment of precipitation isotope data from rainfall events collected in summer 2018 when 19 sites were operational. These novel data represent a new empirical network for monitoring hydrological changes across the northern high latitudes, and provide valuable baseline information for: (1) quantifying the spatial-temporal variability in mean δ18O, δ2H, and d-excess values across the Arctic; (2) constraining the meteorological and geographical controls on δ18O, δ2H, and d-excess values across contrasting climate zones of the Arctic, simultaneously; (3) assessing the dynamic drivers influencing moisture transport processes in the Arctic; and (4) a new empirical framework for interpreting modern and paleo- water isotope data in context of pan-Arctic environmental processes and change.
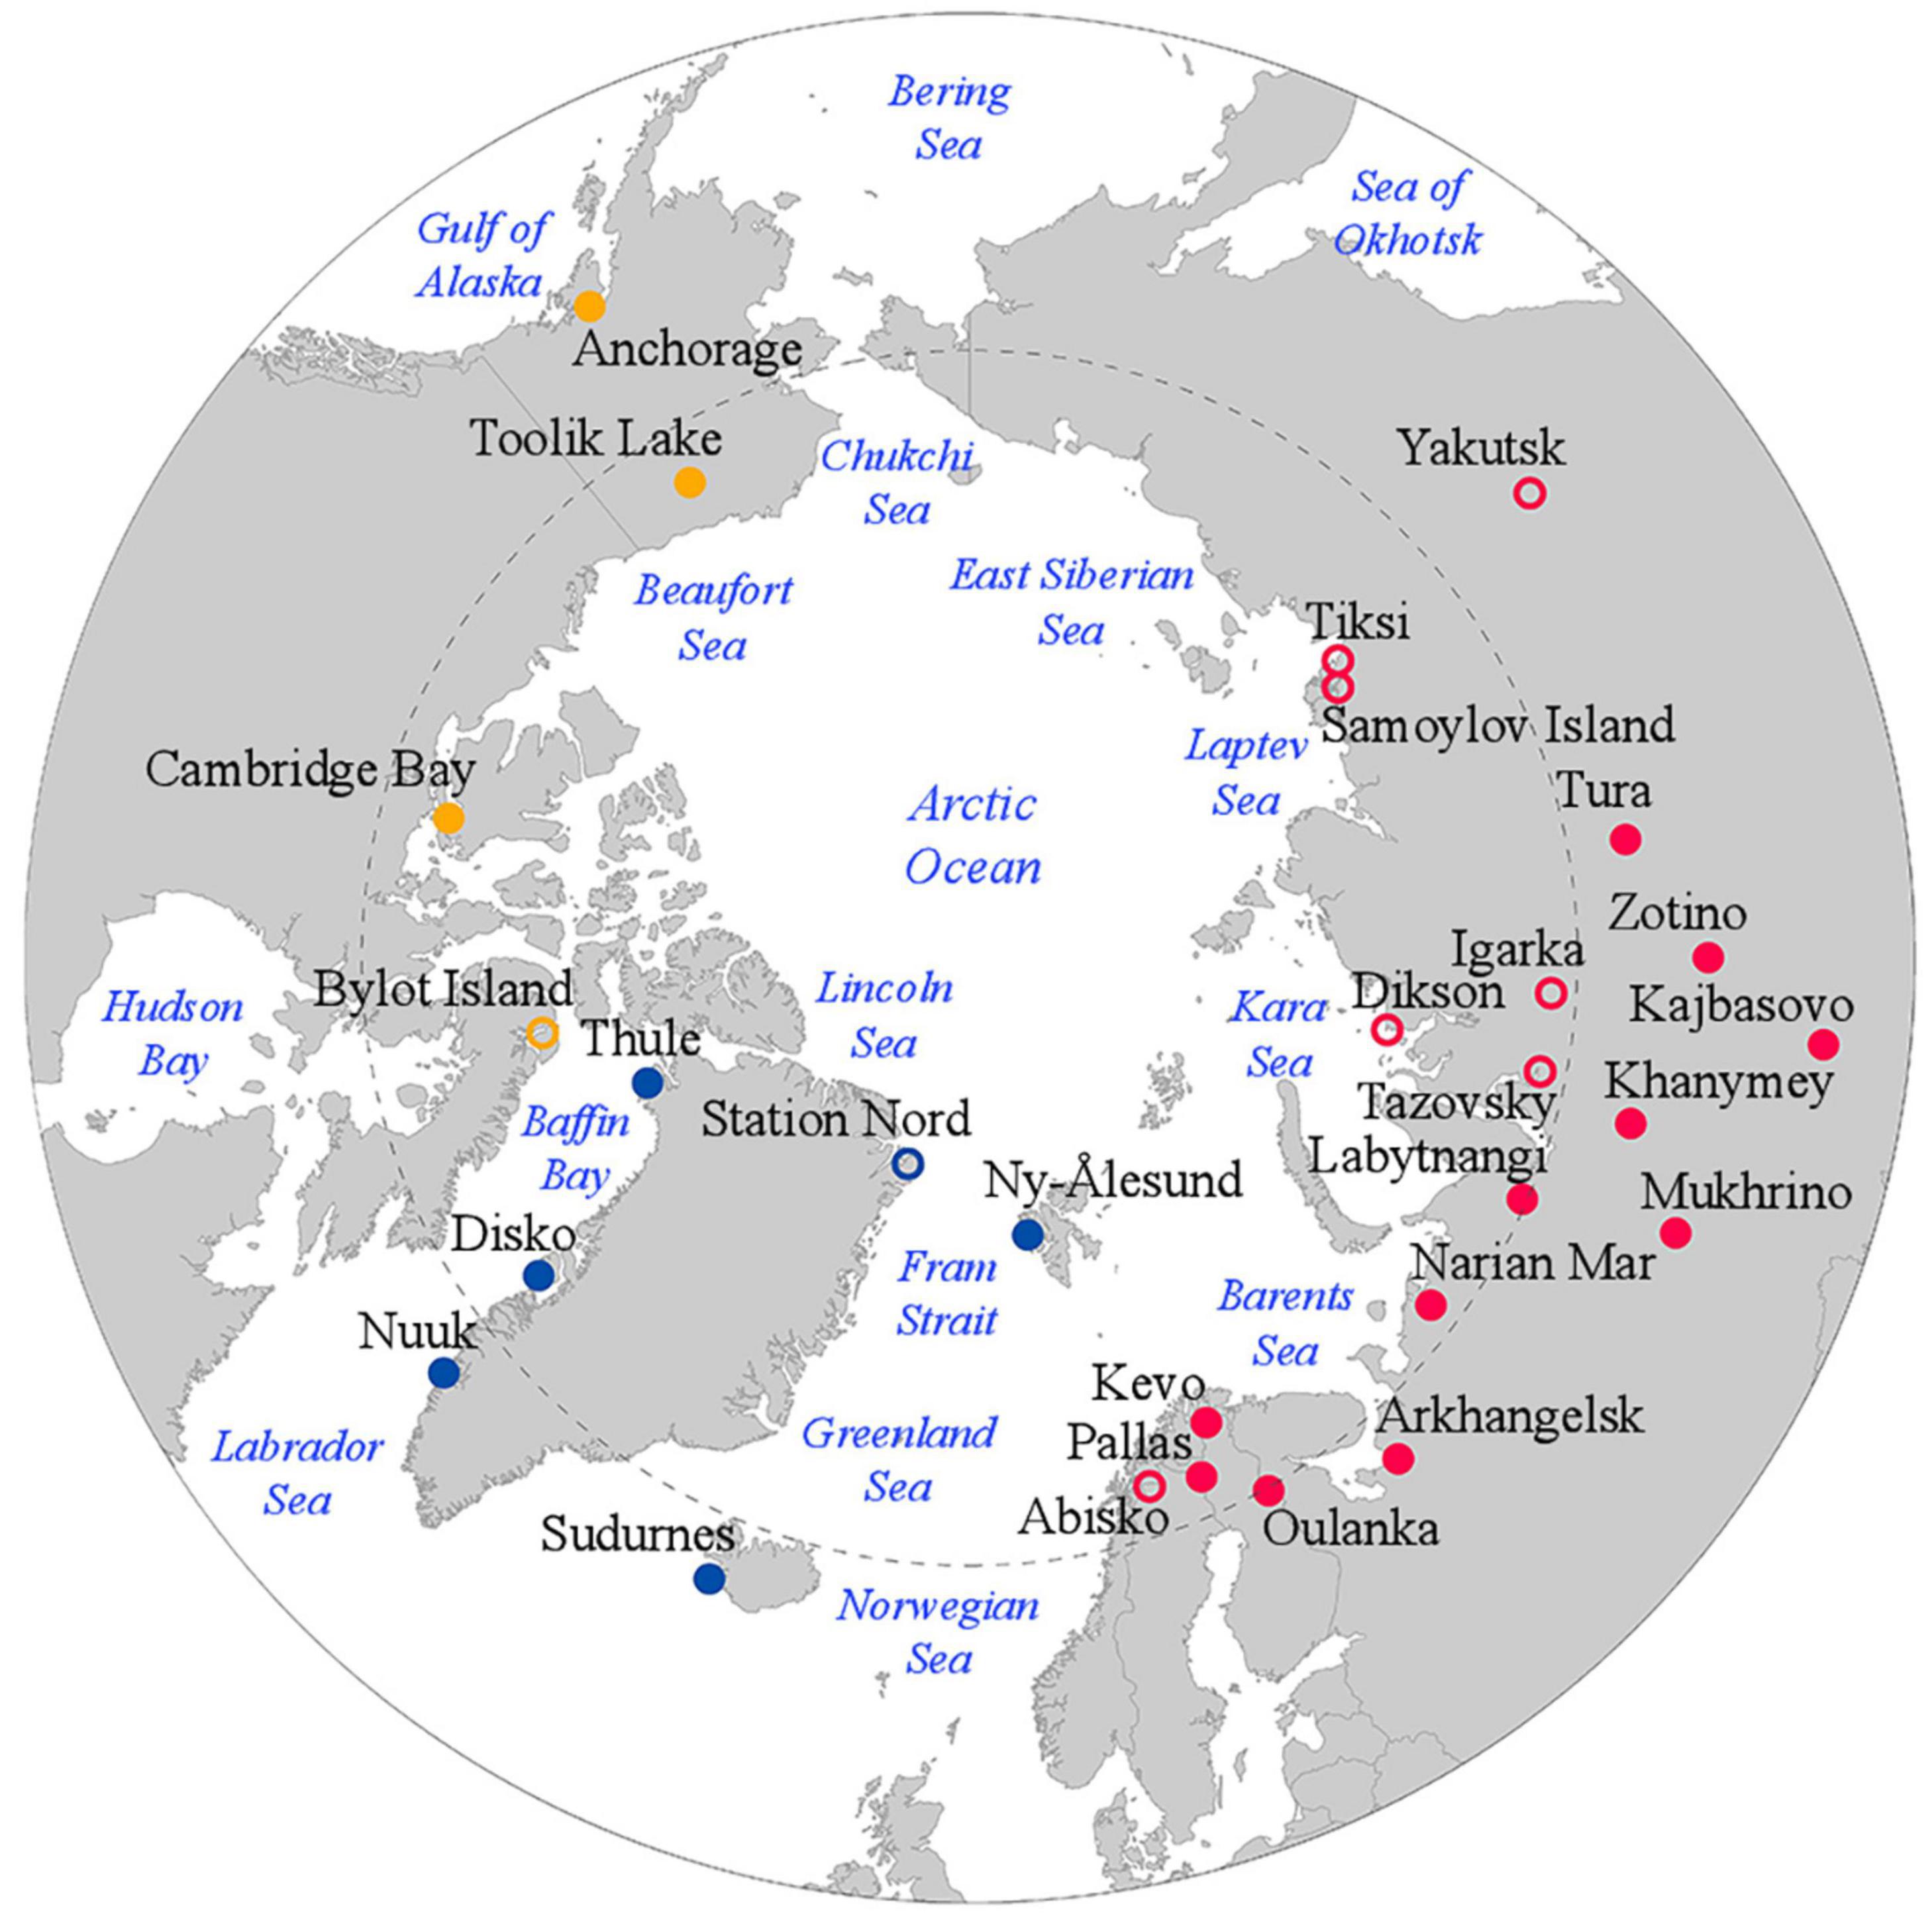
Figure 1. Pan-Arctic Precipitation Isotope Network (PAPIN) research stations (solid circles) participating in sample collection during summer 2018 and categorized by Arctic sector: North American (orange), Atlantic (blue), and Eurasian (red). Open circles indicate new participating stations from 2020. The dashed circle indicates the 66° N latitude band encompassing the Arctic Circle.
Precipitation samples were collected at 19 research stations across the Arctic between 1 June and 31 August 2018 (i.e., “summer”) (Figure 1 and Supplementary Table 1). The network of stations spans seven countries and a latitudinal range from 57°N in subarctic Russia to 79°N in the High Arctic Svalbard archipelago. To focus our analyses, stations are categorized into three Arctic sectors: North American (United States and Canadian stations), Atlantic (Greenland, Iceland, and Svalbard), and Eurasian (Finland and Russia; Figure 1 and Table 1).
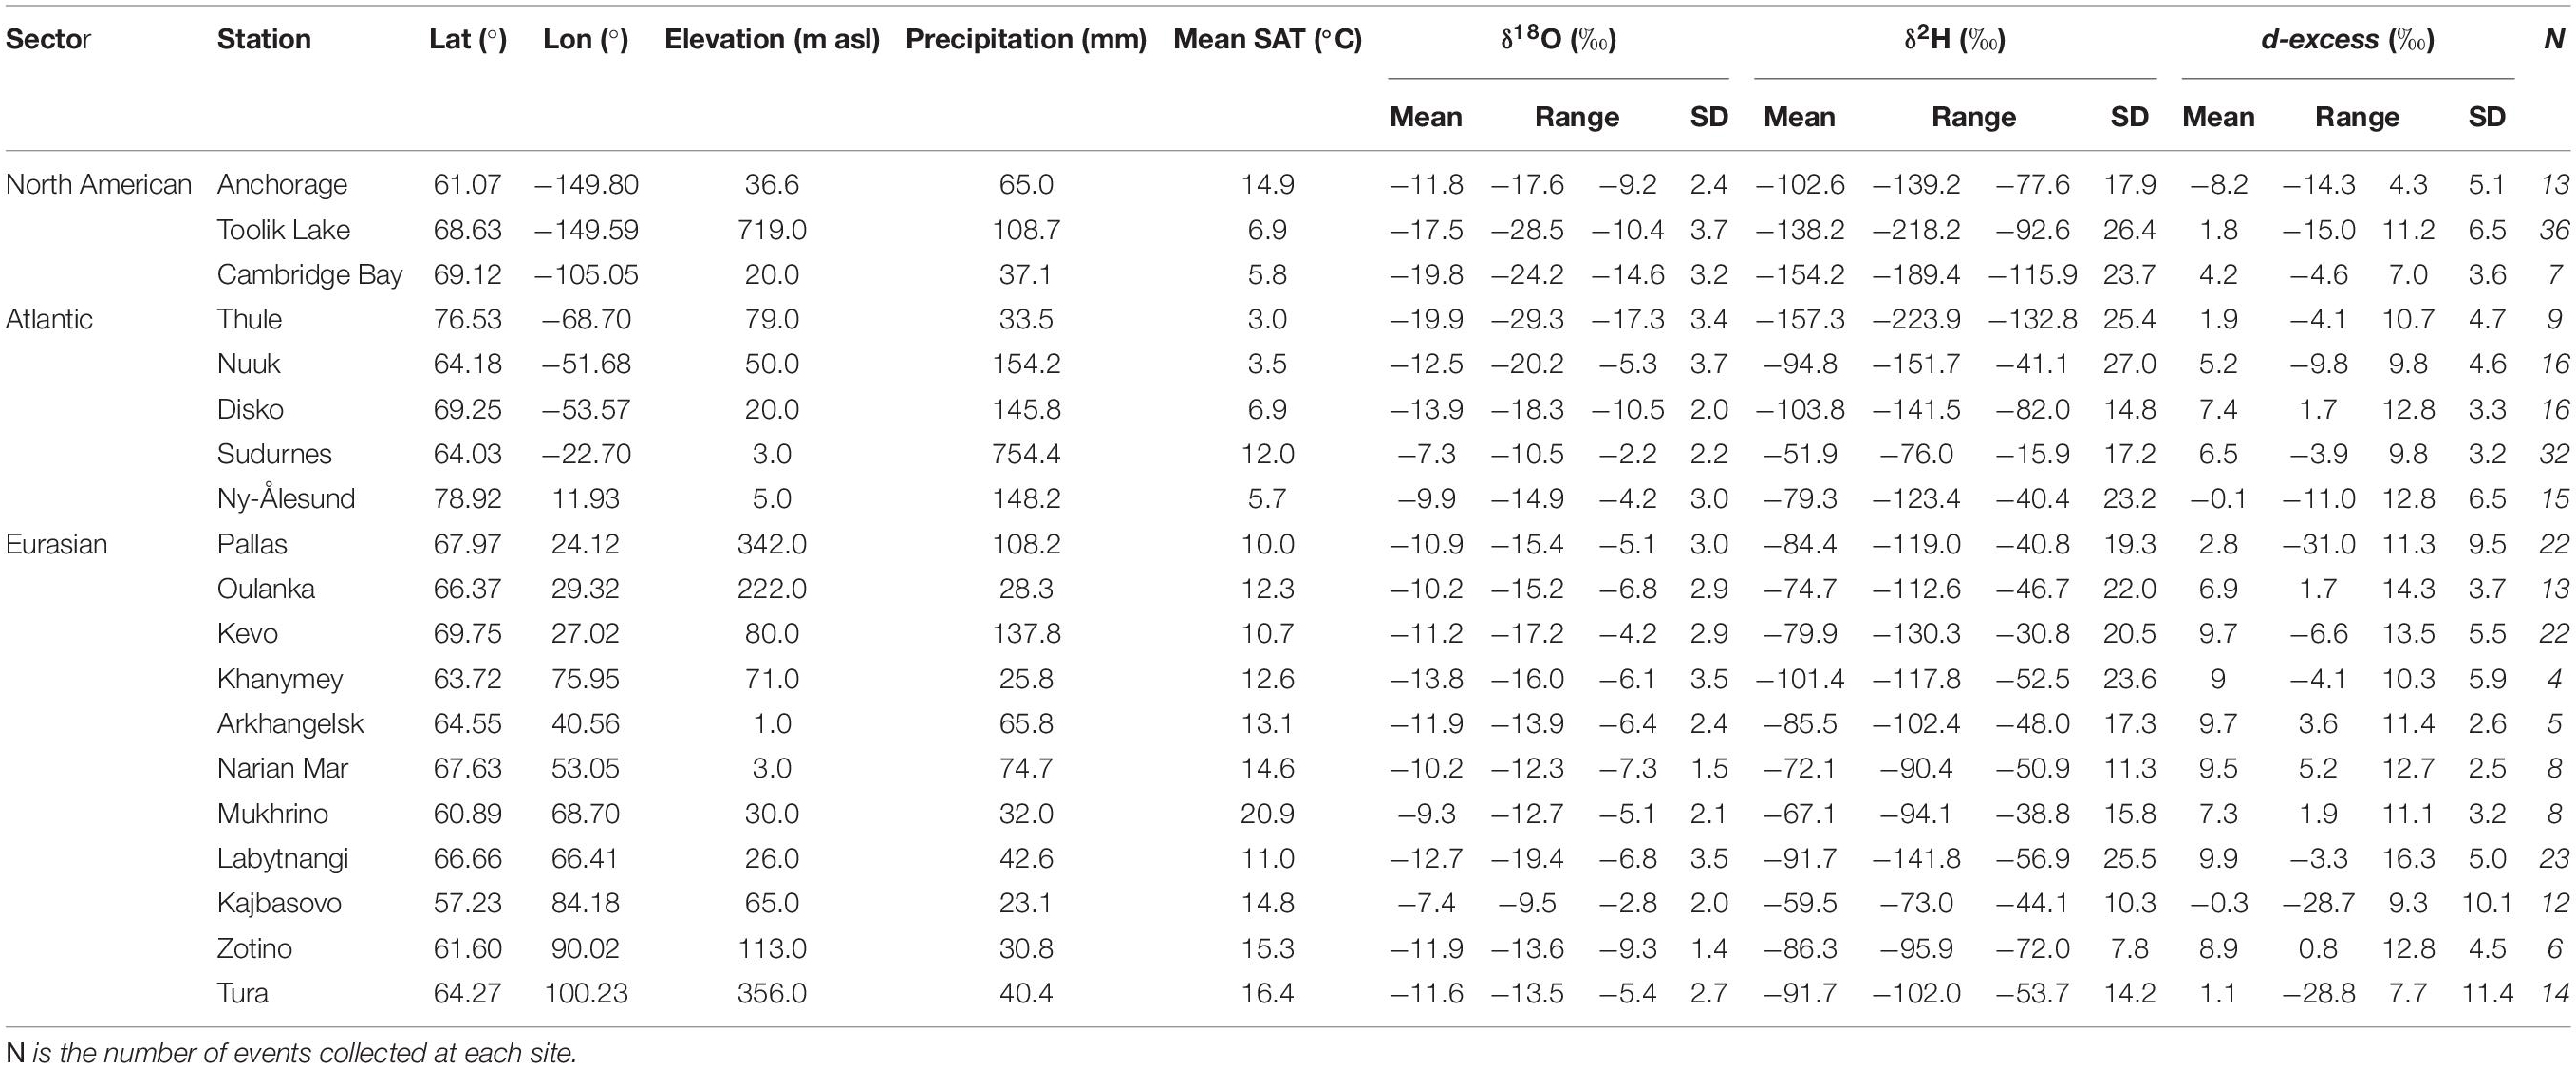
Table 1. Summary of PAPIN station details and summer 2018 meteorological and precipitation-weighted isotope data.
A total of 281 rainfall event samples were collected during summer 2018 using a standard established protocol (Bailey et al., 2019). At each station, a precipitation gauge was installed in an open location between 0.5 and 1.5 m above ground level (to assure no contamination from windblown snow). Samples were retrieved at the end of each rainfall event to minimize evaporation, and in some instances an event lasted several days. Samples were poured directly from the gauge into 50 ml screw-cap vials and sealed before the gauge was dried and reinstalled. For each event, the sampling date, time of day, SAT, and rainfall amount were recorded manually or from the on-site automated weather station (Supplementary Table 1). All Russian samples (n = 20) were transported to the Laboratory of Biogeochemical Cycles in Forest Ecosystems at the V.N. Sukachev Institute of Forest SB RAS (St. Petersburg, Russia), and all remaining samples (n = 261) were shipped to the Stable Isotope Laboratory at the University of Oulu (Finland). Prior to analysis, all samples were individually pipetted into 2 ml septa-capped glass vials and stored refrigerated at 4°C. The remaining precipitation samples were archived frozen.
Stable isotope ratios (δ18O and δ2H) were measured using a Picarro L2130-i isotope and gas concentration analyzer fitted with an autosampler (A0325) and vaporizer unit (A0211). Both laboratories followed the same analytical protocol, whereby each sample was measured seven times and data from the first three measurements were discarded to limit potential memory effects. Samples were reanalyzed if the standard deviation exceeded 0.3‰ for δ18O and/or 3.0‰ for δ2H, or if the reference standard used in the run differed from the known isotope value by greater than ±0.2 or ±2.0‰, respectively. Reference standards were used within each analytical run to monitor for and correct instrumental drift, and included: USGS-45 (δ18O: −2.2‰, δ2H: −10.3‰) and USGS-46 (δ18O: −29.8‰, δ2H: −235.8‰) distributed by the U.S. Geological Survey, and SPB-2 (δ18O: −9.7‰, δ2H: −74.1‰), VSPB-2 (δ18O: −26.7‰, δ2H: −207.0‰), and Vostok (δ18O: −52.2‰, δ2H: −406.3‰) distributed by the Arctic and Antarctic Research Institute. These standards span the full isotopic range of precipitation measurements during Summer 2018. Based on within-run replicate analyses of standard waters, mean analytical precision was ±0.2‰ for δ18O and ±2.0‰ for δ2H. Reference standards were used to normalize all data to the international Vienna Standard Mean Ocean Water (VSMOW) isotopic scale, and results are expressed as δ-values in parts per thousand difference (per mil; ‰).
The secondary parameter d-excess was calculated as:
(Craig, 1961), and mean isotope values at each station were converted to precipitation amount-weighted values using the equation:
where δ is either δ18O or δ2H, Pi and δi denote the amount (mm) of precipitation per event and its measured isotope composition, respectively, and n represents the number of precipitation events at each station.
Simple linear regression models were used to quantify the relationships between δ18O and local air temperatures, and between δ18O and precipitation amounts. A threshold of p < 0.05 was considered for significant relationships.
To evaluate the influence of air mass transport history on precipitation geochemistry we used the HYbrid Single-Particle Lagrangian Integrated Trajectory (HYSPLIT) model (Stein et al., 2015; Rolph et al., 2017). The model was coupled with NOAA’s 0.5° three-dimensional Global Data Assimilation (GDAS) dataset (temperature, altitude, zonal and meridional horizontal wind components, and surface pressure) to calculate air parcel back-trajectories from each station. The GDAS reanalysis package was selected for our analyses because (1) it integrates the shortest possible time step (1 h) when calculating trajectories, thereby minimizing any integration error, and (2) it offers highly resolved pan-Arctic coverage, thereby enabling the model to assimilate complex topographic features. Trajectories were initiated at a starting height of 1,500 m above sea level (asl) and traced back in time 120 h (5 days) (Kurita, 2011; Klein et al., 2015) to encompass the typical time taken for an air mass to cross the Arctic Ocean (Woods and Caballero, 2016; Ali and Pithan, 2020). Additionally, the residence time for meteoric vapor (i.e., the time between evaporation and precipitation) is 3–4 days in the eastern Arctic Ocean region (Trenberth, 1998; Läderach and Sodemann, 2016). The atmospheric flow attenuation by surface friction was diminished by choosing 1,500 m altitude as an initiation point (Bailey et al., 2019). On-site meteorological data were used to select the trajectory starting times to coincide with the end of each precipitation event, and data were further used to classify the prevailing air mass trajectory to each station. Back trajectory errors are an estimated 15–30% of the trajectory length and relate to how well the numerical fields estimate the true flow field in space and time (Stein et al., 2015; Rolph et al., 2017).
For geospatial data analyses, mean monthly sea ice extent and daily sea ice concentration grids (25 km2 resolution) were obtained from the National Snow and Ice Data Center (NSIDC) (NSIDC, 2019). A sea ice concentration threshold of 15% was used to define mean sea ice extent. Daily mean sea level pressure (SLP) and monthly mean 850 hPa geopotential heights (z850) were obtained from the NCEP/NCAR reanalysis dataset (Kalnay et al., 1996). Daily North Atlantic Oscillation (NAO) index data were obtained from the National Centers for Environmental Information (NOAA, 2019).
PAPIN observations from summer 2018 yield mean precipitation-weighted δ18O, δ2H, and d-excess values of −12.3, −93.5, and 4.9‰, respectively (Table 1 and Supplementary Data 1). Values ranged from −2.2 to −29.3‰ for δ18O, and −15.9 to −223.9‰ for δ2H. d-excess values ranged between −31.0 and 16.3‰. Mean maximum δ18O values were observed at Sudurnes in Iceland (−7.3‰) and mean minimum values in northwest Greenland at Thule (−19.9‰). Conversely, mean maximum d-excess values were observed at Labytnangi in northern Russia (9.9‰), and mean minimum at Anchorage, Alaska (−8.2‰) (Figure 2).
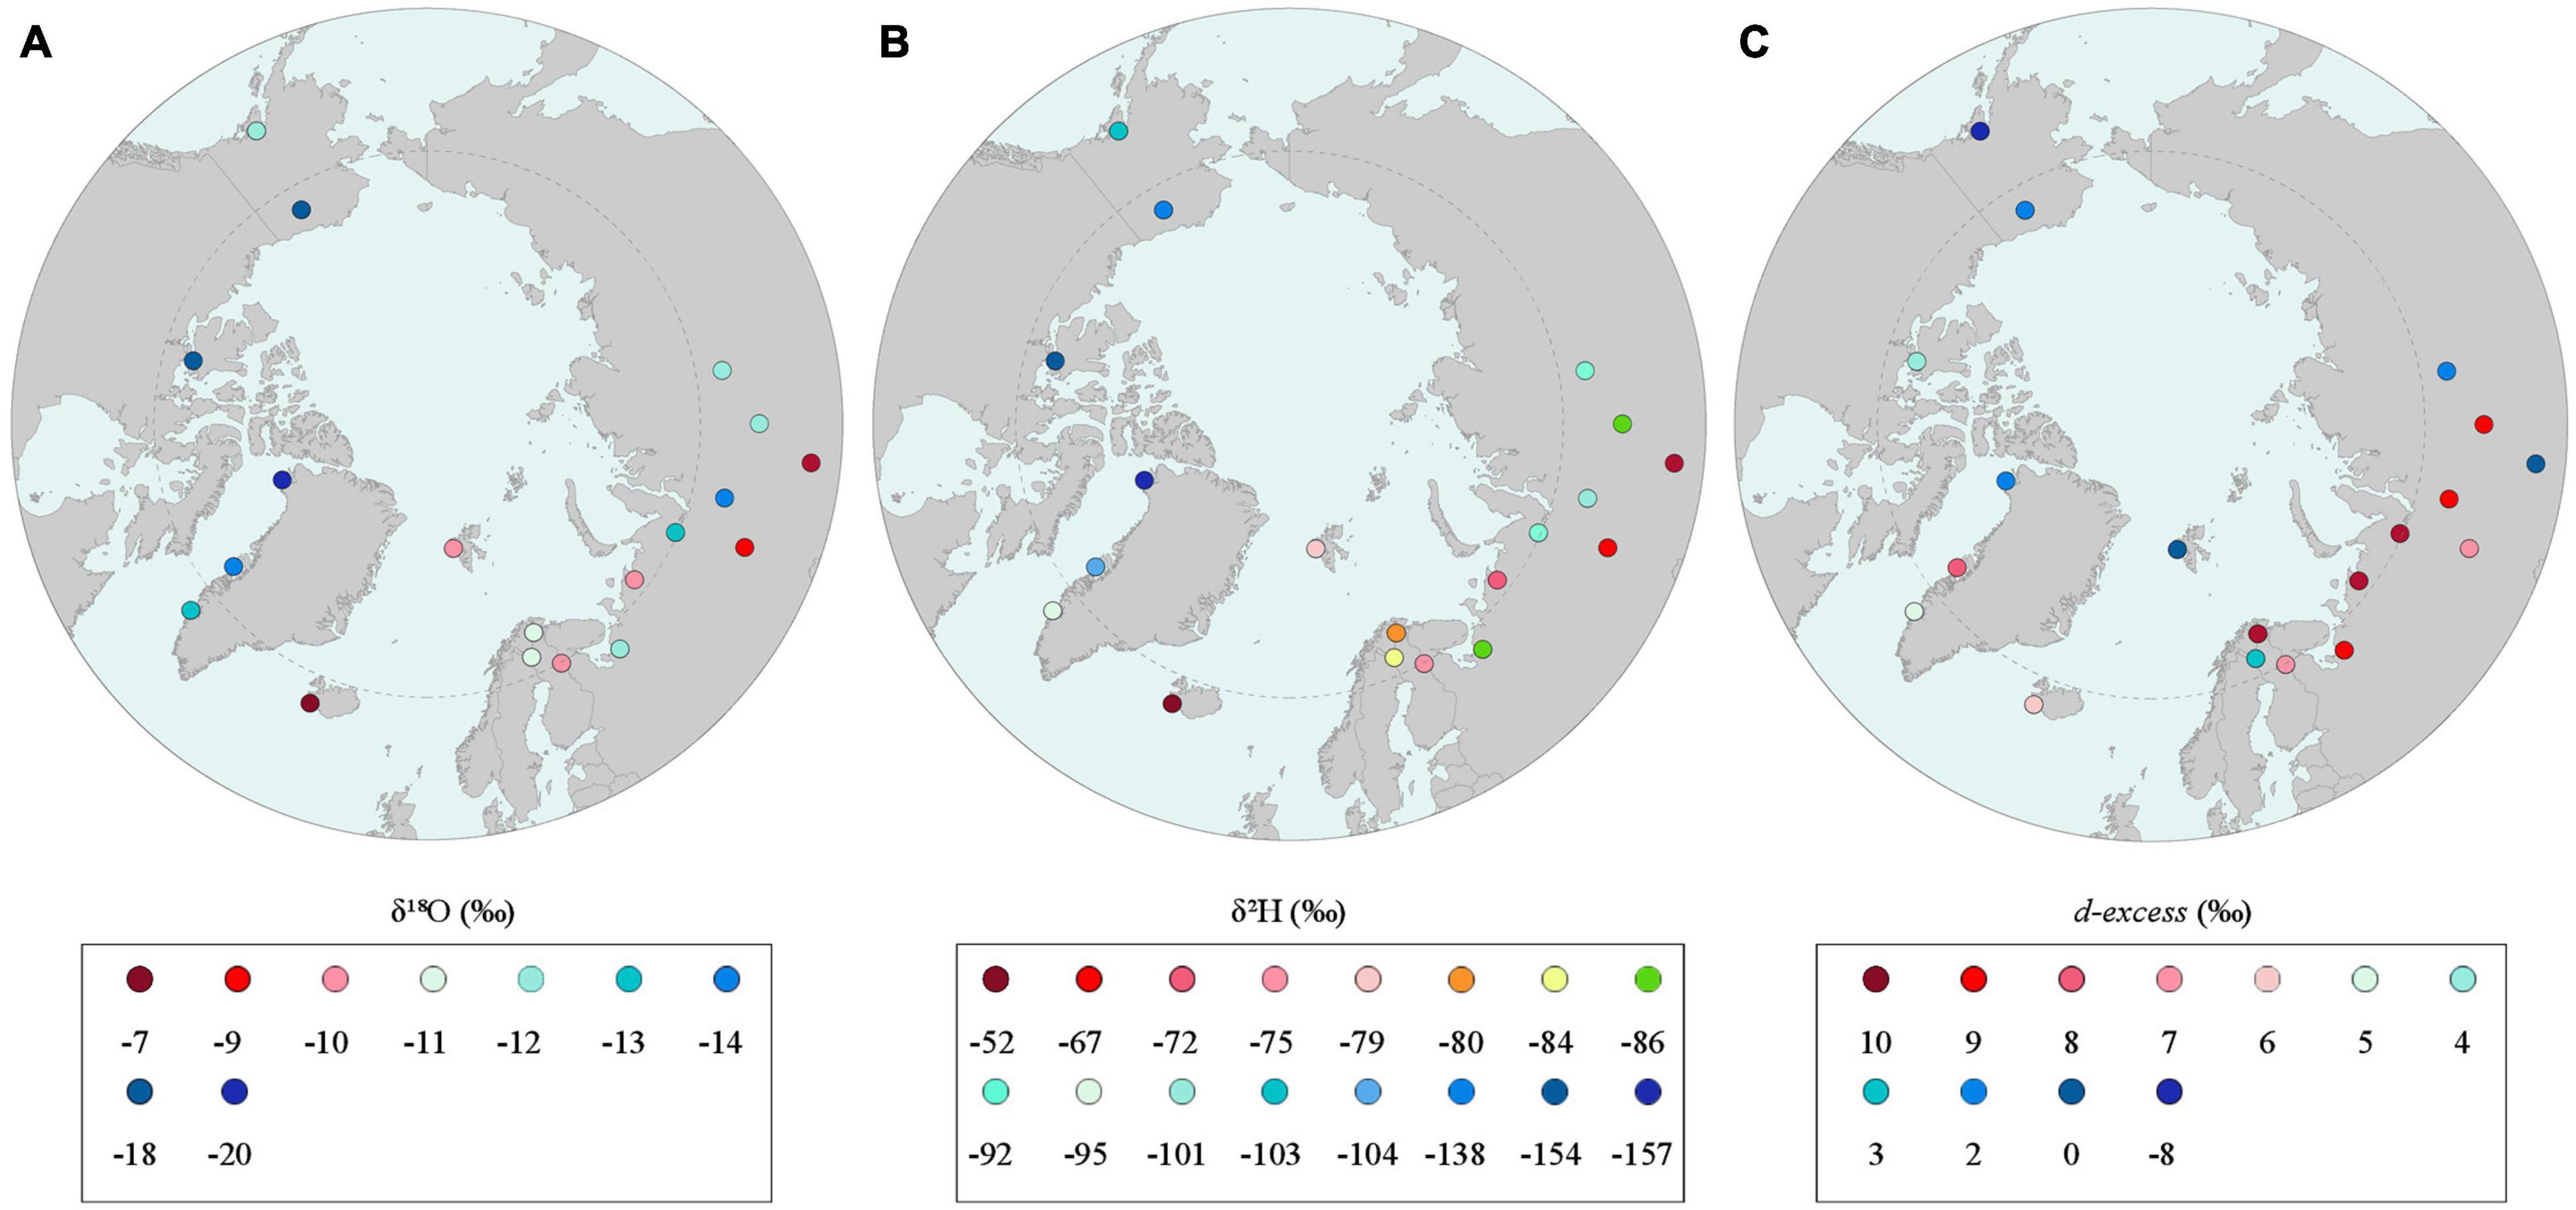
Figure 2. Amount-weighted summer 2018 mean precipitation (A) δ18O, (B) δ2H, and (C) d-excess.
At the regional scale, δ18O values in the North American sector ranged from −9.2 to −28.5‰ (mean, −16.4‰). The highest mean δ18O values were observed at Anchorage and lowest at Cambridge Bay, and the contrary for d-excess (Figure 2). At all three North American stations the lowest δ18O and δ2H values were typically recorded in August. In the Eurasian sector, the range of precipitation δ-values across all stations was quite small (δ18O = ±0.4‰, δ2H = ±9.2‰), whereas d-excess exhibited a larger range (±5.9‰, Table 1) that suggests more variable moisture source regions (Kurita et al., 2004; Kostrova et al., 2020). Kajbasovo, the most southerly PAPIN station, recorded the highest mean δ18O value (−7.4‰) in this sector of the Arctic, while the lowest mean δ18O was measured at Khanymey (−13.8‰) (Table 1 and Figure 2). Conversely, Kajbasovo precipitation recorded the lowest mean d-excess (−0.3‰) and Labytnangi in northern Russia the highest d-excess (9.9‰). In the Atlantic sector, the highest mean δ18O values were recorded in Iceland (−7.3‰) and the lowest at Thule (−19.9‰). Mean d-excess values ranged from −0.1‰ in Ny-Ålesund to 7.4‰ at Disko (Table 2).
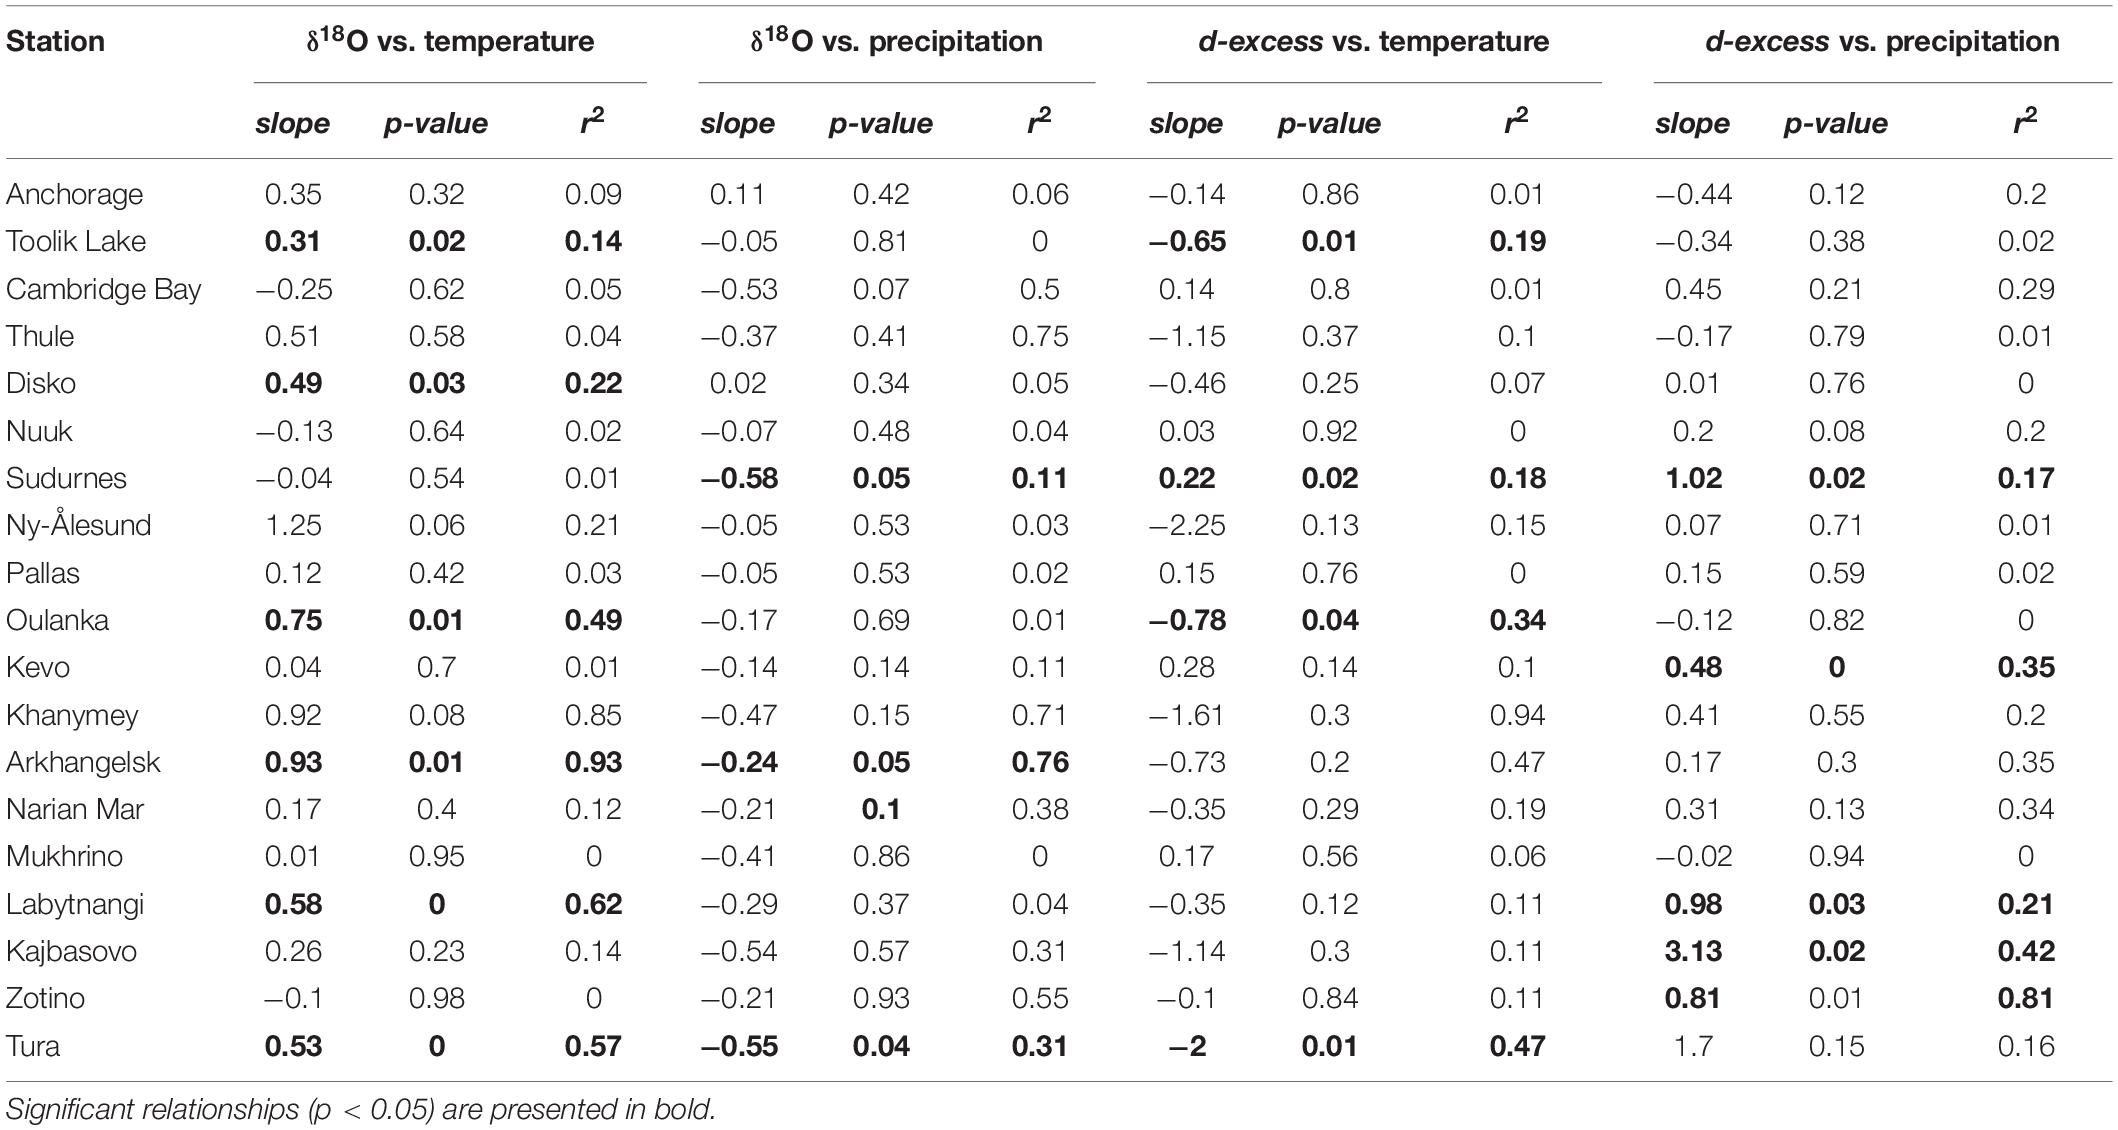
Table 2. Summer 2018 linear regression results between precipitation isotope and meteorological data.
Collectively, the data establish a summer Arctic meteoric water line (AMWL) where:
(r2 = 0.96, p < 0.01, n = 281; Figure 3). The AMWL slope and intercept are slightly lower than the global meteoric water line (GMWL) where δ2H = 8.0 ⋅ δ18O + 10.0 (Craig, 1961), and this is somewhat expected considering the summer focus of our study. On a regional scale, rainfall events in the Atlantic sector plot closer to the GMWL compared to the North American and Eurasian, which plot below (Figure 3). The low slope of the Eurasian MWL (6.4) is primarily driven by precipitation events at the three most easterly Russian stations: Kajbasovo (4.1), Tura (4.6), and Zotino (5.2) (Supplementary Figure 1) and may reflect non-equilibrium conditions associated with summer rainfall (i.e., sub-cloud secondary evaporation and/or post-condensation exchange) (Dansgaard, 1964)—a phenomenon previously observed in summer precipitation across Russia (Kurita et al., 2004).
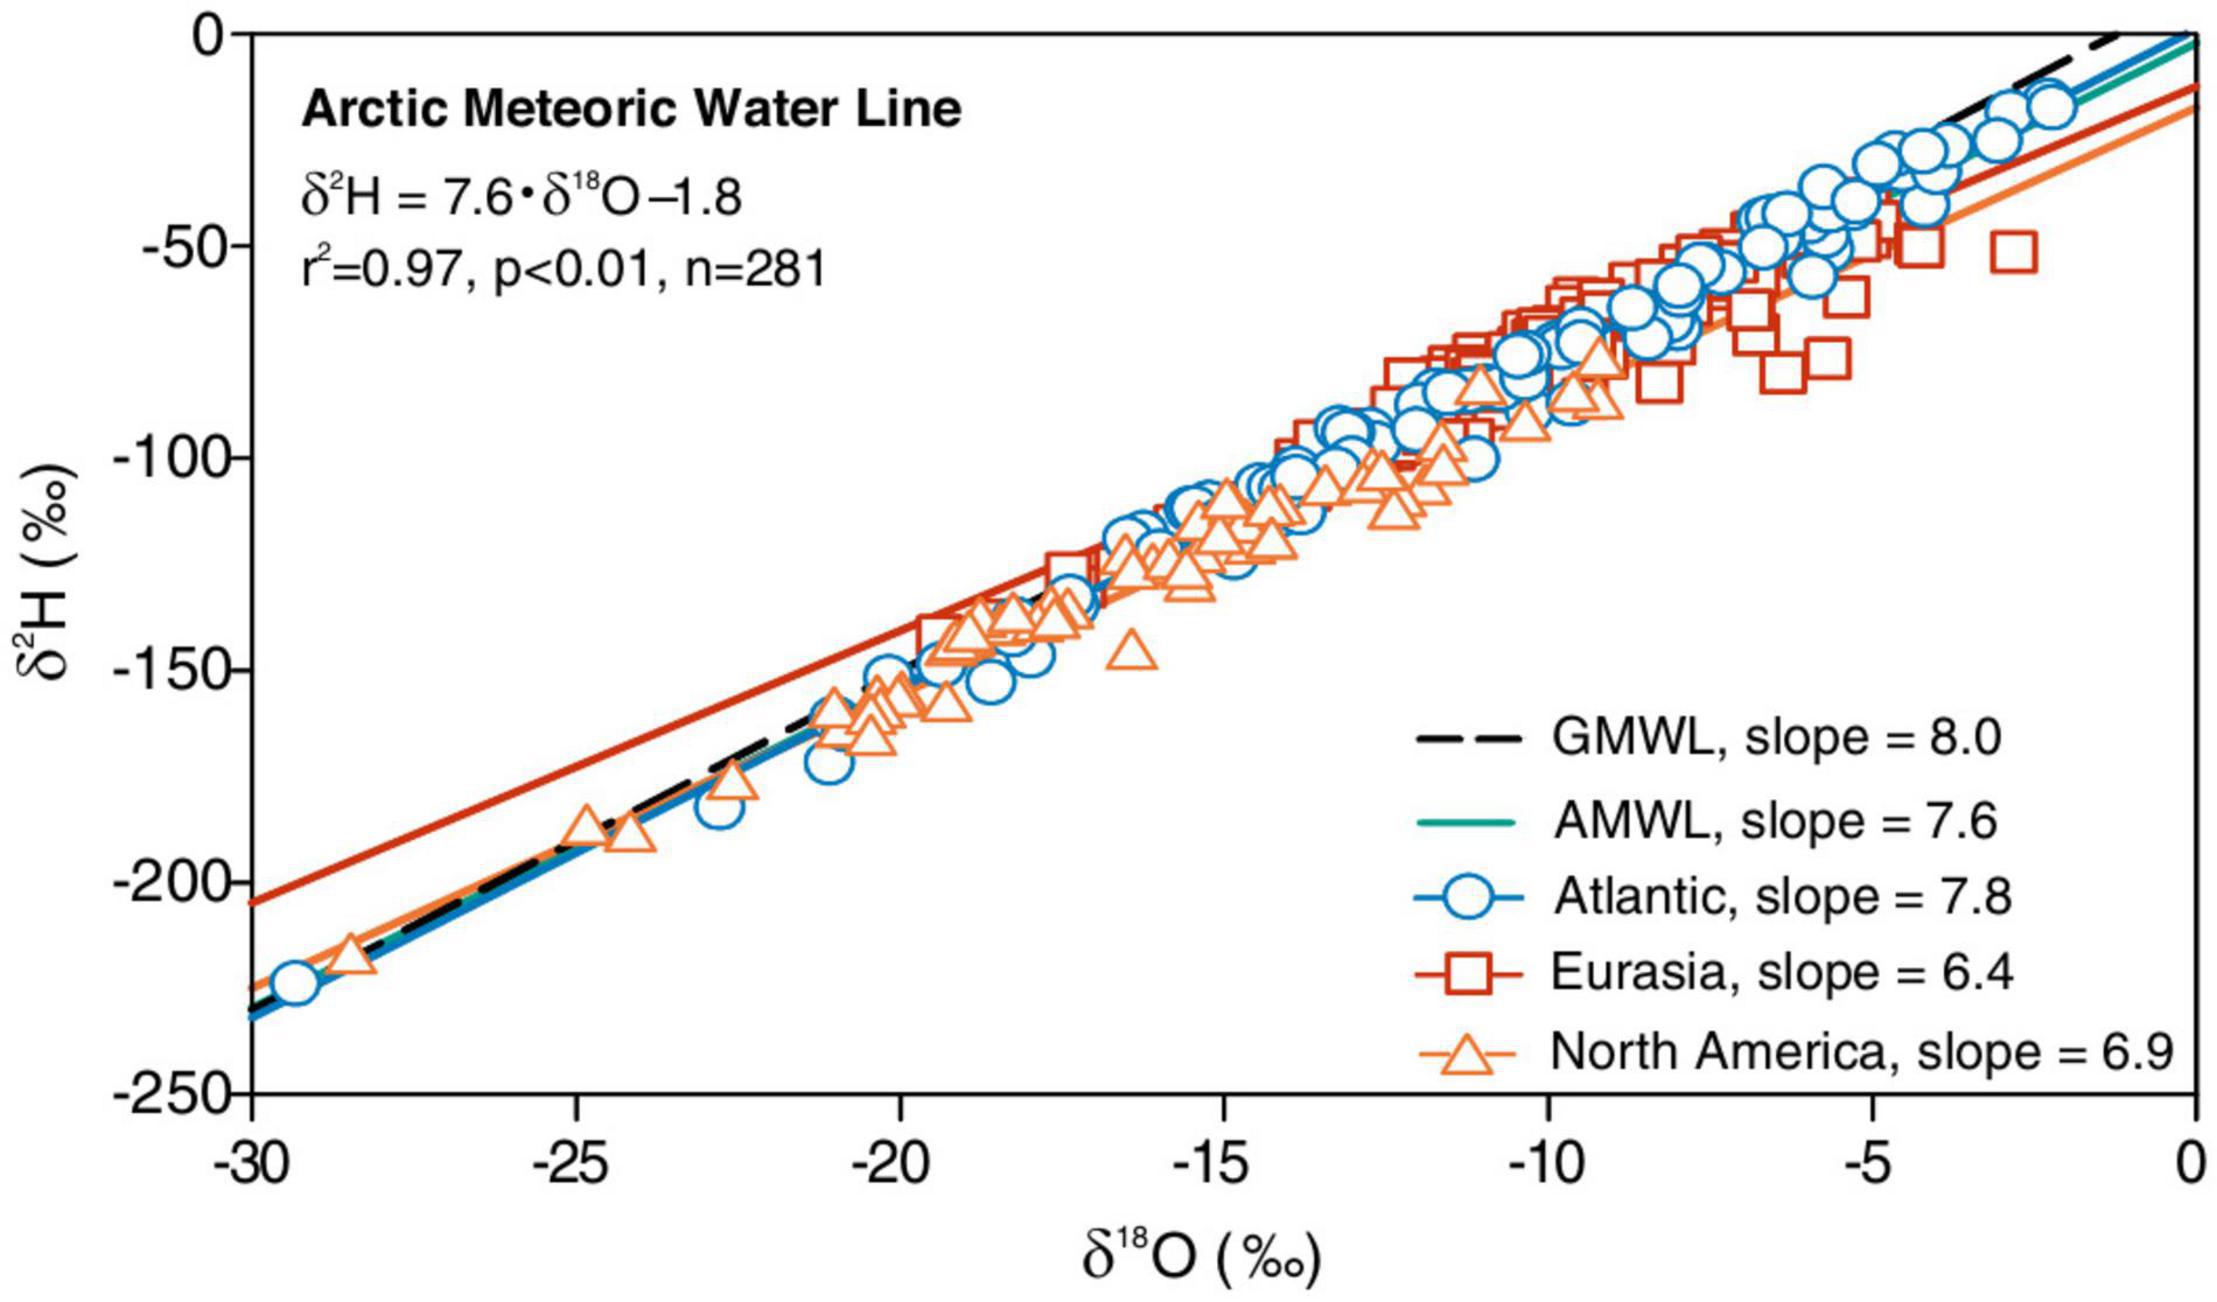
Figure 3. Relationship between event-based precipitation δ18O and δ2H during summer 2018 across the Arctic and in individual sectors, compared to the global meteoric water line (GMWL). Collectively the PAPIN data derive a summer Arctic Meteoric Water Line (AMWL).
The spatial distribution of mean summer δ18O across the Arctic broadly conforms to theoretical and observed understanding: (1) decreasing δ18O with increasing latitude (Dansgaard, 1964), and (2) decreasing δ18O with increasing continentality (Rozanski et al., 1992; Figure 2). Yet the network also reveals marked spatial variability and particularly among values of d-excess (Figure 2). In general, the North American (/Eurasian) sector in the western (/eastern) Arctic is characterized by precipitation with lower (/higher) d-excess values (Figure 2). More broadly, the Eurasian sector also encompasses a wider range of δ18O and d-excess values, yet this may partly reflect the regional sampling bias that includes a higher number of stations (and thus a wider data range) in the Eurasian sector compared to the North American. Previous studies based on GNIP monthly composite precipitation samples have identified a latitude-δ18O relationship of around −0.60‰/degree of latitude in Europe and the United States, and up to −2.0‰/degree of latitude in Antarctica (Gat et al., 2001). Across the Arctic we find an overall weak and insignificant relationship of −0.30‰/degree of latitude (r2 = 0.16, p < 0.12; Figure 4A), yet this is primarily due to anomalously high δ18O values recorded at Ny-Ålesund—the most northerly station in the network. Conversely, the North American sector exhibits a latitude effect similar to the global trend where Δδ18 ≈ −0.66‰/degree of latitude (r2 = 0.28, p < 0.05; Figure 4A). In the Atlantic sector, there is also a clear decreasing δ18O signal with increasing latitude from the most southern site Nuuk, to Disko and Thule station in northwest Greenland, where Δδ18 ≈ −0.61‰/degree of latitude (r2 = 0.94, p < 0.05; Figure 2 and Table 1). However, the overall latitude-δ18O relationship for the Atlantic sector is weaker (Δδ18 ≈ −0.34‰/degree of latitude, r2 = 0.15, p < 0.05) due to the relatively high δ18O values recorded at Ny-Ålesund. In Eurasia we find no evidence of a latitude effect in our summer data (Δδ18 ≈ −0.05‰/degree of latitude, r2 = 0.01, p < 0.68), though this may reflect the relatively small latitudinal range of sites across this region. Similarly, across all PAPIN summer data there is no significant relationship between mean δ18O and station elevation.
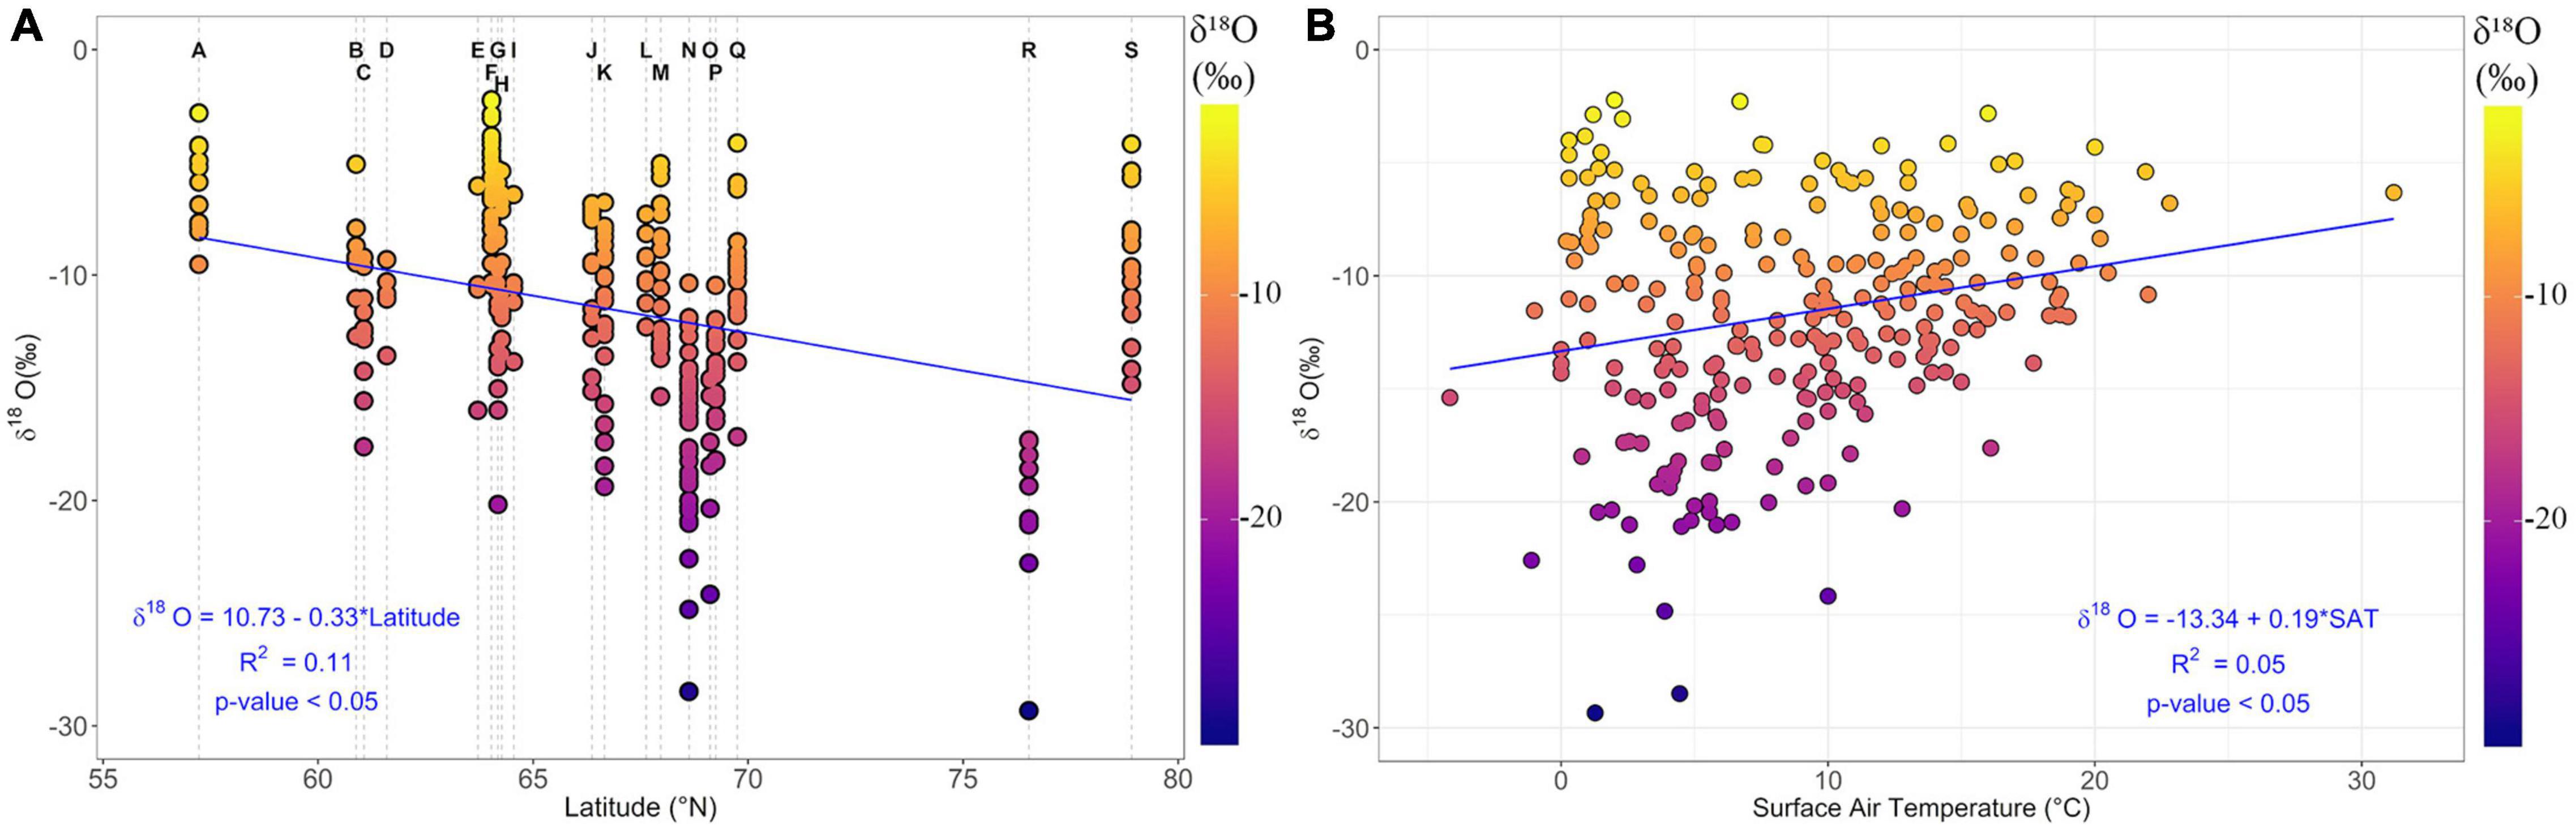
Figure 4. Graphs show the linear trend (blue line) between precipitation event δ18O and (A) station latitude, and (B) local surface air temperature, during summer 2018. The vertical dashed lines in (A) depict the latitude for individual stations marked; A, Kajbasovo; B, Mukhrino; C, Anchorage; D, Zotino; E, Khanymey; F, Sudurnes; G, Nuuk; H, Tura; I, Arkhangelsk; J, Oulanka; K, Labytnangi; L, Narian Mar; M, Pallas; N, Toolik Lake; O, Cambridge Bay; P, Disko; Q, Kevo; R, Thule; S, Ny-Ålesund.
Temperature and the isotopic composition of precipitation are significantly correlated on global and seasonal scales (Craig, 1961; Dansgaard, 1964). Previous studies using monthly composited GNIP samples have identified a mean temperature-δ18O relation of ∼0.60‰/°C in the mid- to high-latitudes (Rozanski et al., 1992). Across the Arctic the δ18O-temperature regression ranges from 0.31‰/°C (Toolik Lake) to 0.93‰/°C (Arkhangelsk) (Table 2). Significant relationships were observed at six stations where slopes were generally lower than the global mean, yet collectively the data show a significant but weak positive relation (r2 = 0.05, p < 0.05, n = 281; Figure 4B). The steepest temperature-δ18O slope was observed at Arkhangelsk in Russia (0.93‰/°C, r2 = 0.93) and resembles slopes reported in Antarctica (Peel et al., 1988). However, Arkhangelsk was also the second driest station during summer 2018 with only five precipitation events recorded, and hence our ability to fully constrain the temperature-δ18O relationship at this site is limited. Significant positive relations were also observed in Russia at Labytnangi (0.58‰/°C, r2 = 0.62) and Tura (0.53‰/°C, r2 = 0.57), and are similar to a regional Siberian slope of 0.50‰/°C that was proposed by Kostrova et al. (2020). Toolik Lake in Alaska (0.31‰/°C) and Disko in Greenland (0.49‰/°C) also exhibit significant positive temperature-δ18O relationships, albeit relatively weak, and these slopes are similar to previously reported regional values for Alaska and Greenland (Klein et al., 2016; Bailey et al., 2018; Akers et al., 2020). Across all sites, the steepest temperature-δ18O slopes (between 0.93 and 0.75‰/°C) were observed at the continental stations—a pattern also observed across the United States (Vachon et al., 2010; Akers et al., 2017), Europe (Rozanski et al., 1982), and Antarctica (Peel and Mulvaney, 1992). Conversely, aside from Disko station, there are no significant temperature-δ18O relationships at any of the coastal PAPIN stations (Table 2), indicating that summer δ18O variability at the event-scale is not readily explained by condensation temperature as the primary driver of isotopic variability.
Precipitation varied markedly in the Arctic during summer 2018 and was characterized by severe drought across Eurasia and wetter-than-average conditions in the Atlantic sector (Blunden and Arndt, 2019). These contrasting regimes were due to the spatial configuration of SLP anomalies: a deep low-pressure system over the Atlantic sector that steered storms poleward to Iceland and Svalbard, while a blocking high pressure system anchored over Eurasia. This spatial pattern of SLP anomalies was well-reflected in the NAO index that exhibited the highest mean summer NAO value (+1.48 σ) since records began in 1950 (NOAA, 2019). Accordingly, of the events sampled, Sudurnes in Iceland recorded the highest total precipitation (754 mm) and Kajbasovo in Russia the lowest (23 mm) (Table 1). In total, June was the driest month at all PAPIN stations and August the wettest (Supplementary Data 1). At Toolik, Thule, Labytnangi, and Khanymey this likely reflected the more extensive local sea ice coverage in June (e.g., in the Chukchi and Kara Seas, Baffin Bay) that may have limited atmospheric moisture availability (Ala-aho et al., 2021; Bailey et al., 2021; Figure 5).
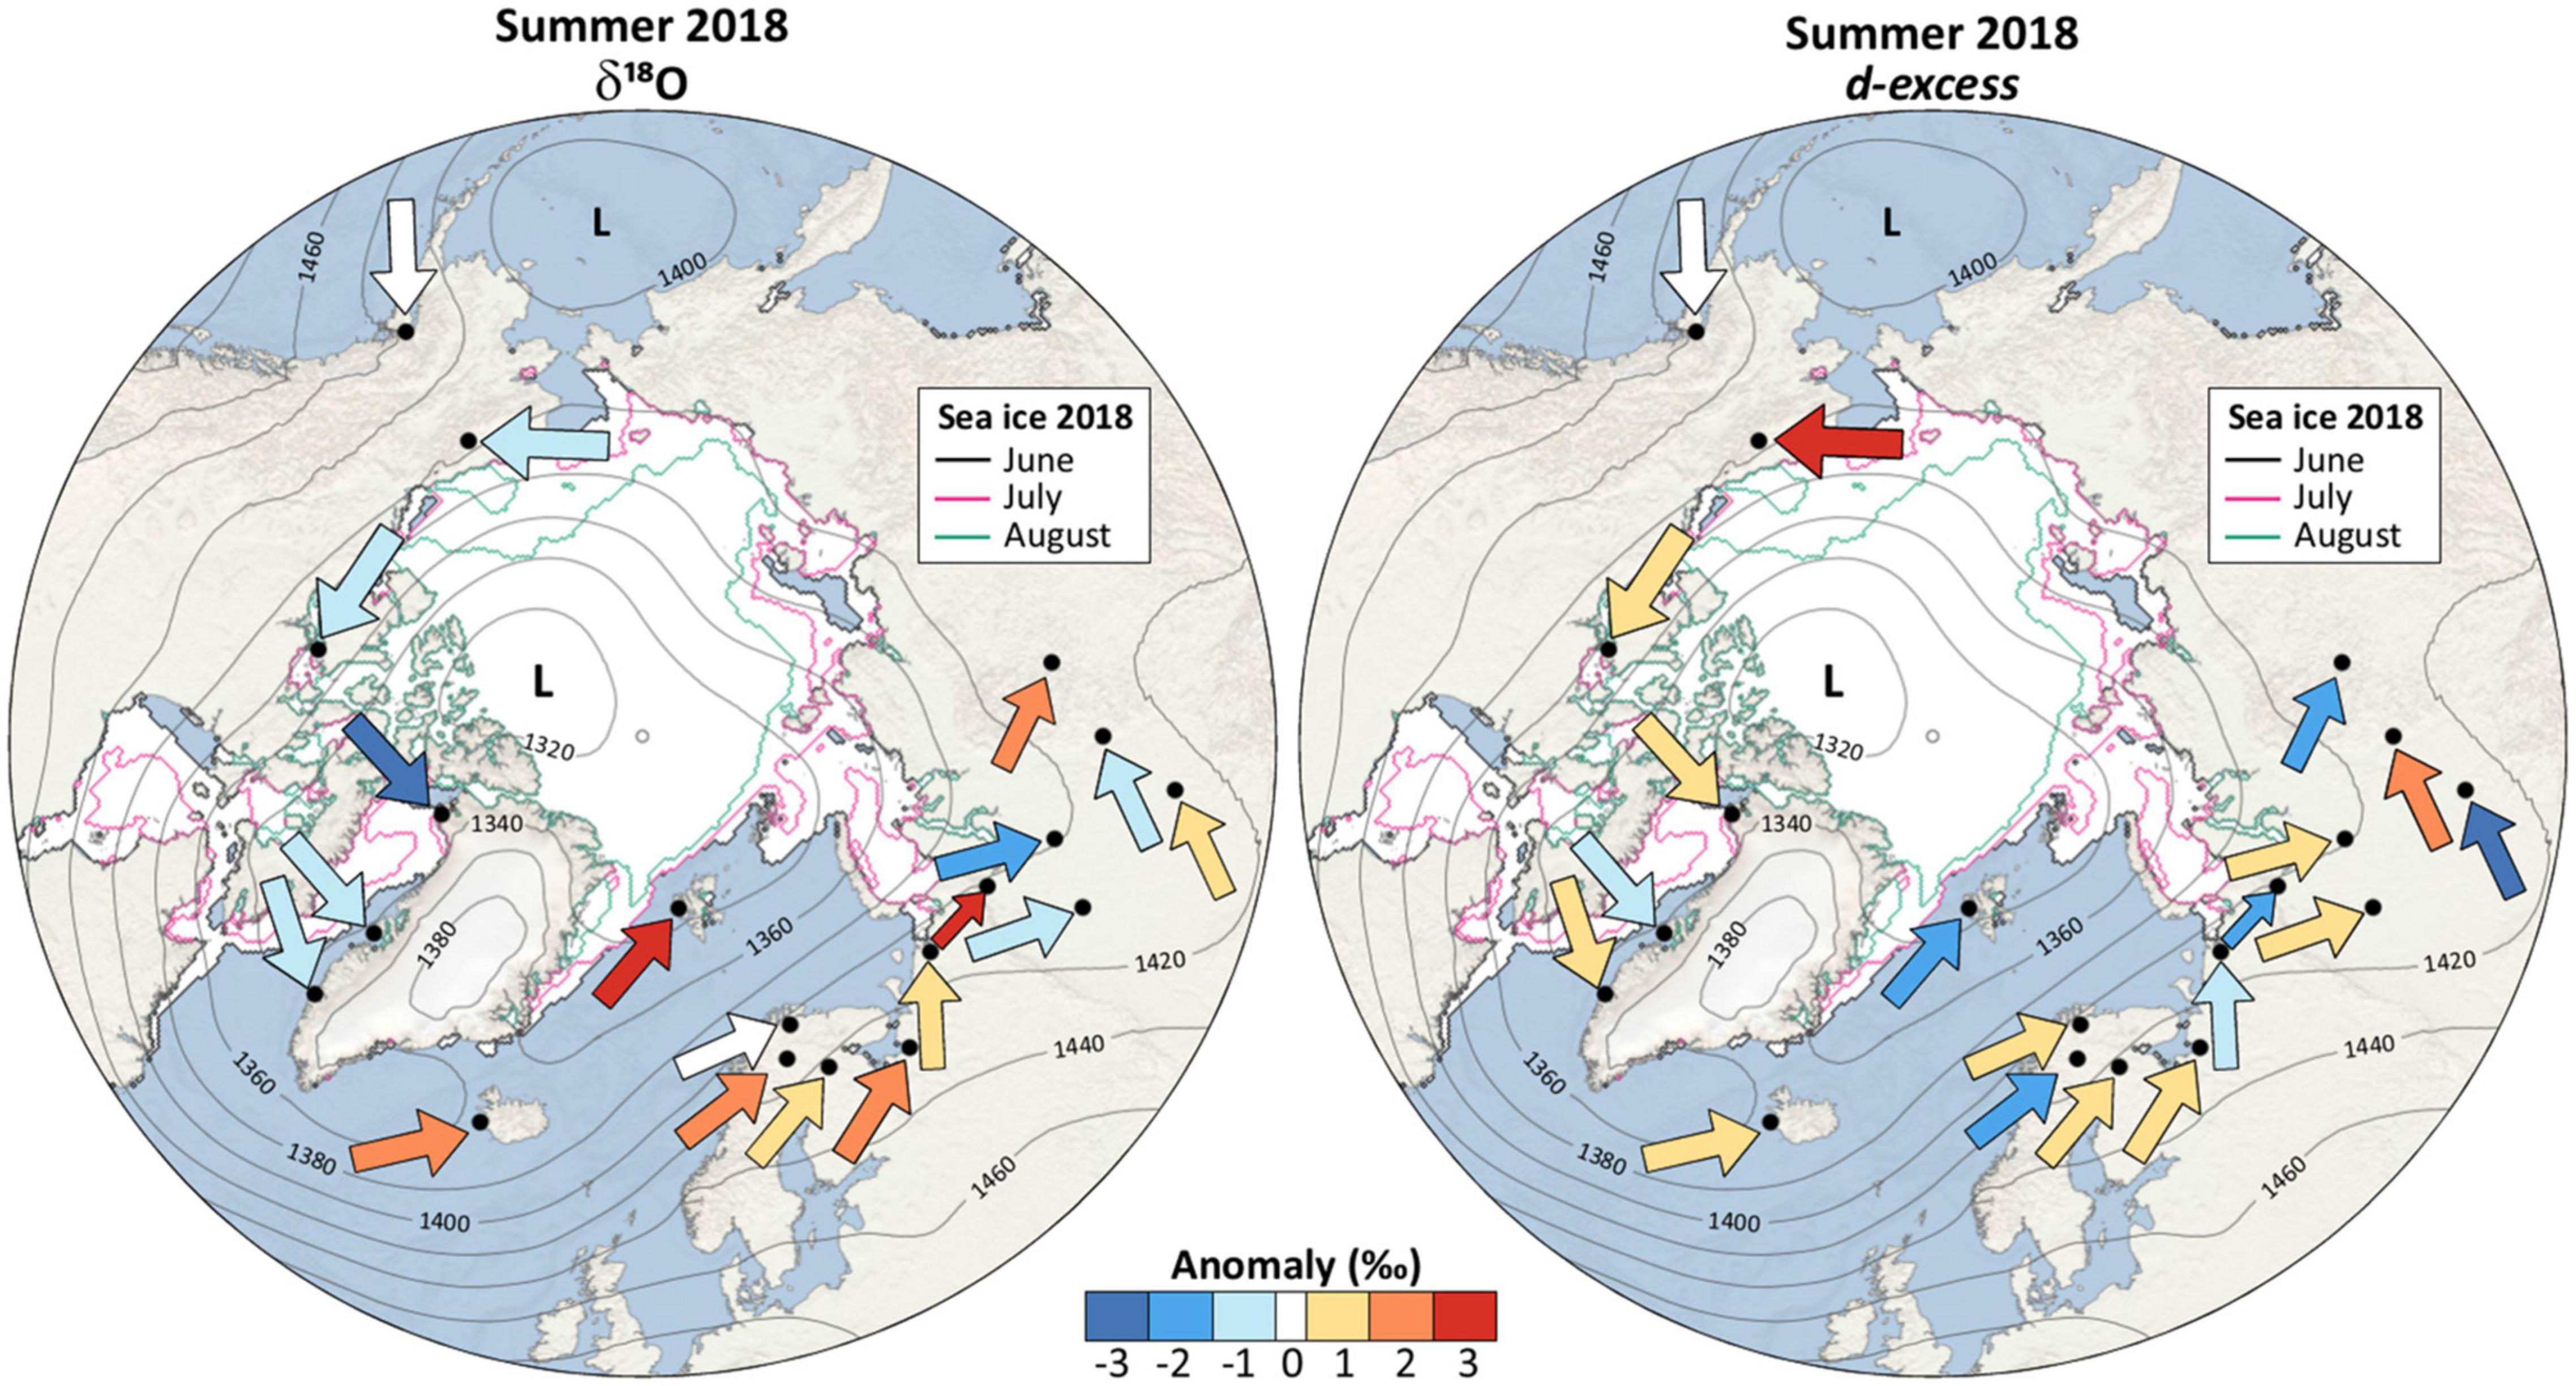
Figure 5. Maps indicate the prevailing trajectory (arrow) of all precipitating air masses sampled at PAPIN stations in summer 2018, based on 5-day HYSPLIT back-trajectory output. Arrow colors reflect the corresponding mean precipitation δ18O (left) and d-excess (right) anomaly for the prevailing track direction, relative to the stations summer mean isotope value. Contour lines depict mean 850 hPa geopotential heights (m) during summer 2018 from NCEP/NCAR (Kalnay et al., 1996), with the corresponding high (H) and low (L) pressure centers. Monthly mean sea ice area (white shaded) and extent (colored lines) are shown for June (black), July (pink), and August (green) 2018 (NSIDC, 2019).
We identify significant negative relationships between precipitation amount and δ18O at three PAPIN stations: Arkhangelsk (−0.24‰/mm, r2 = 0.76), Tura (−0.55‰/mm, r2 = 0.31), and Sudurnes (−0.58‰/mm, r2 = 0.11; Table 2). However, the strong negative relation observed at Arkhangelsk is again constrained by the relatively small sample number. Considering the very low MWL slope for this station and a mean negative d-excess value of −0.04‰, these findings further suggest a strong influence of sub-cloud processes affecting isotopic variability at this continental site (Kurita et al., 2004).
In addition to local meteorological controls, recent work has highlighted how precipitation isotope variability also reflects synoptic-scale atmospheric circulation patterns that drive changes in air mass trajectories with varying moisture sources, transport, and rainout histories (Kurita, 2011; Welker, 2012; Bonne et al., 2014; Bailey et al., 2019, 2021; Kostrova et al., 2020). To constrain these processes across the Arctic we use our 5-day back-trajectories to identify the air mass “source” (at 120 h) and transport history for each precipitation event. Although the evaporative uptake points along individual trajectories are not additionally modeled, this method provides key information on the broad vapor source regions and specific transport pathways of precipitating air masses, and has been widely applied in Arctic studies (Klein et al., 2015; Puntsag et al., 2016; Kostrova et al., 2020). All individual back-trajectories are presented in Supplementary Figures 2–6, and for clarity only the prevailing trajectories at each site are presented in Figure 5.
Summer 2018 trajectories span a wide latitudinal range from 35 to 90°N (Supplementary Figures 2–6). Model output indicates that 72% of all trajectories had an oceanic origin (at 120 h), while 28% a continental origin. In the North American sector, precipitating air masses derived from the North Pacific region (64.3%) or Arctic Ocean (35.7%) (Figure 5). Conversely, prevailing westerlies dominated the atmospheric transport regime in the Atlantic and Eurasian sectors (Figure 5). Collectively, we identify three broad pan-Arctic summer moisture transport regimes: into, within, and out of the Arctic (broadly defined as the region north of 60°N). Herein we describe these regimes and utilize individual precipitation events as case studies of the divergent mechanisms influencing summer pan-Arctic isotope composition (Figure 6 and Table 3).
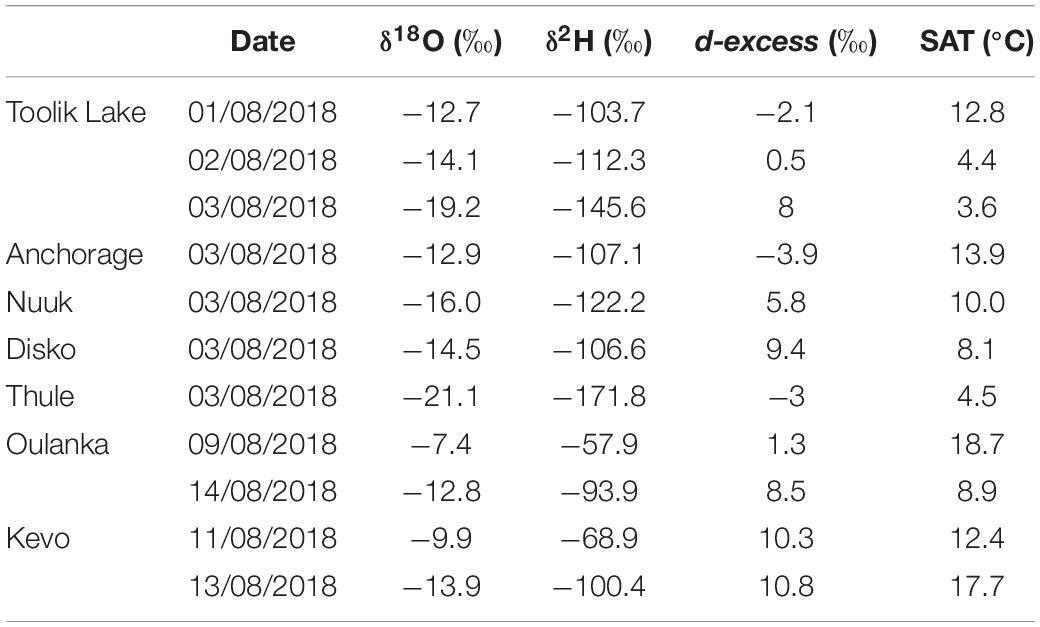
Table 3. Summary of precipitation event data presented in Figure 6.
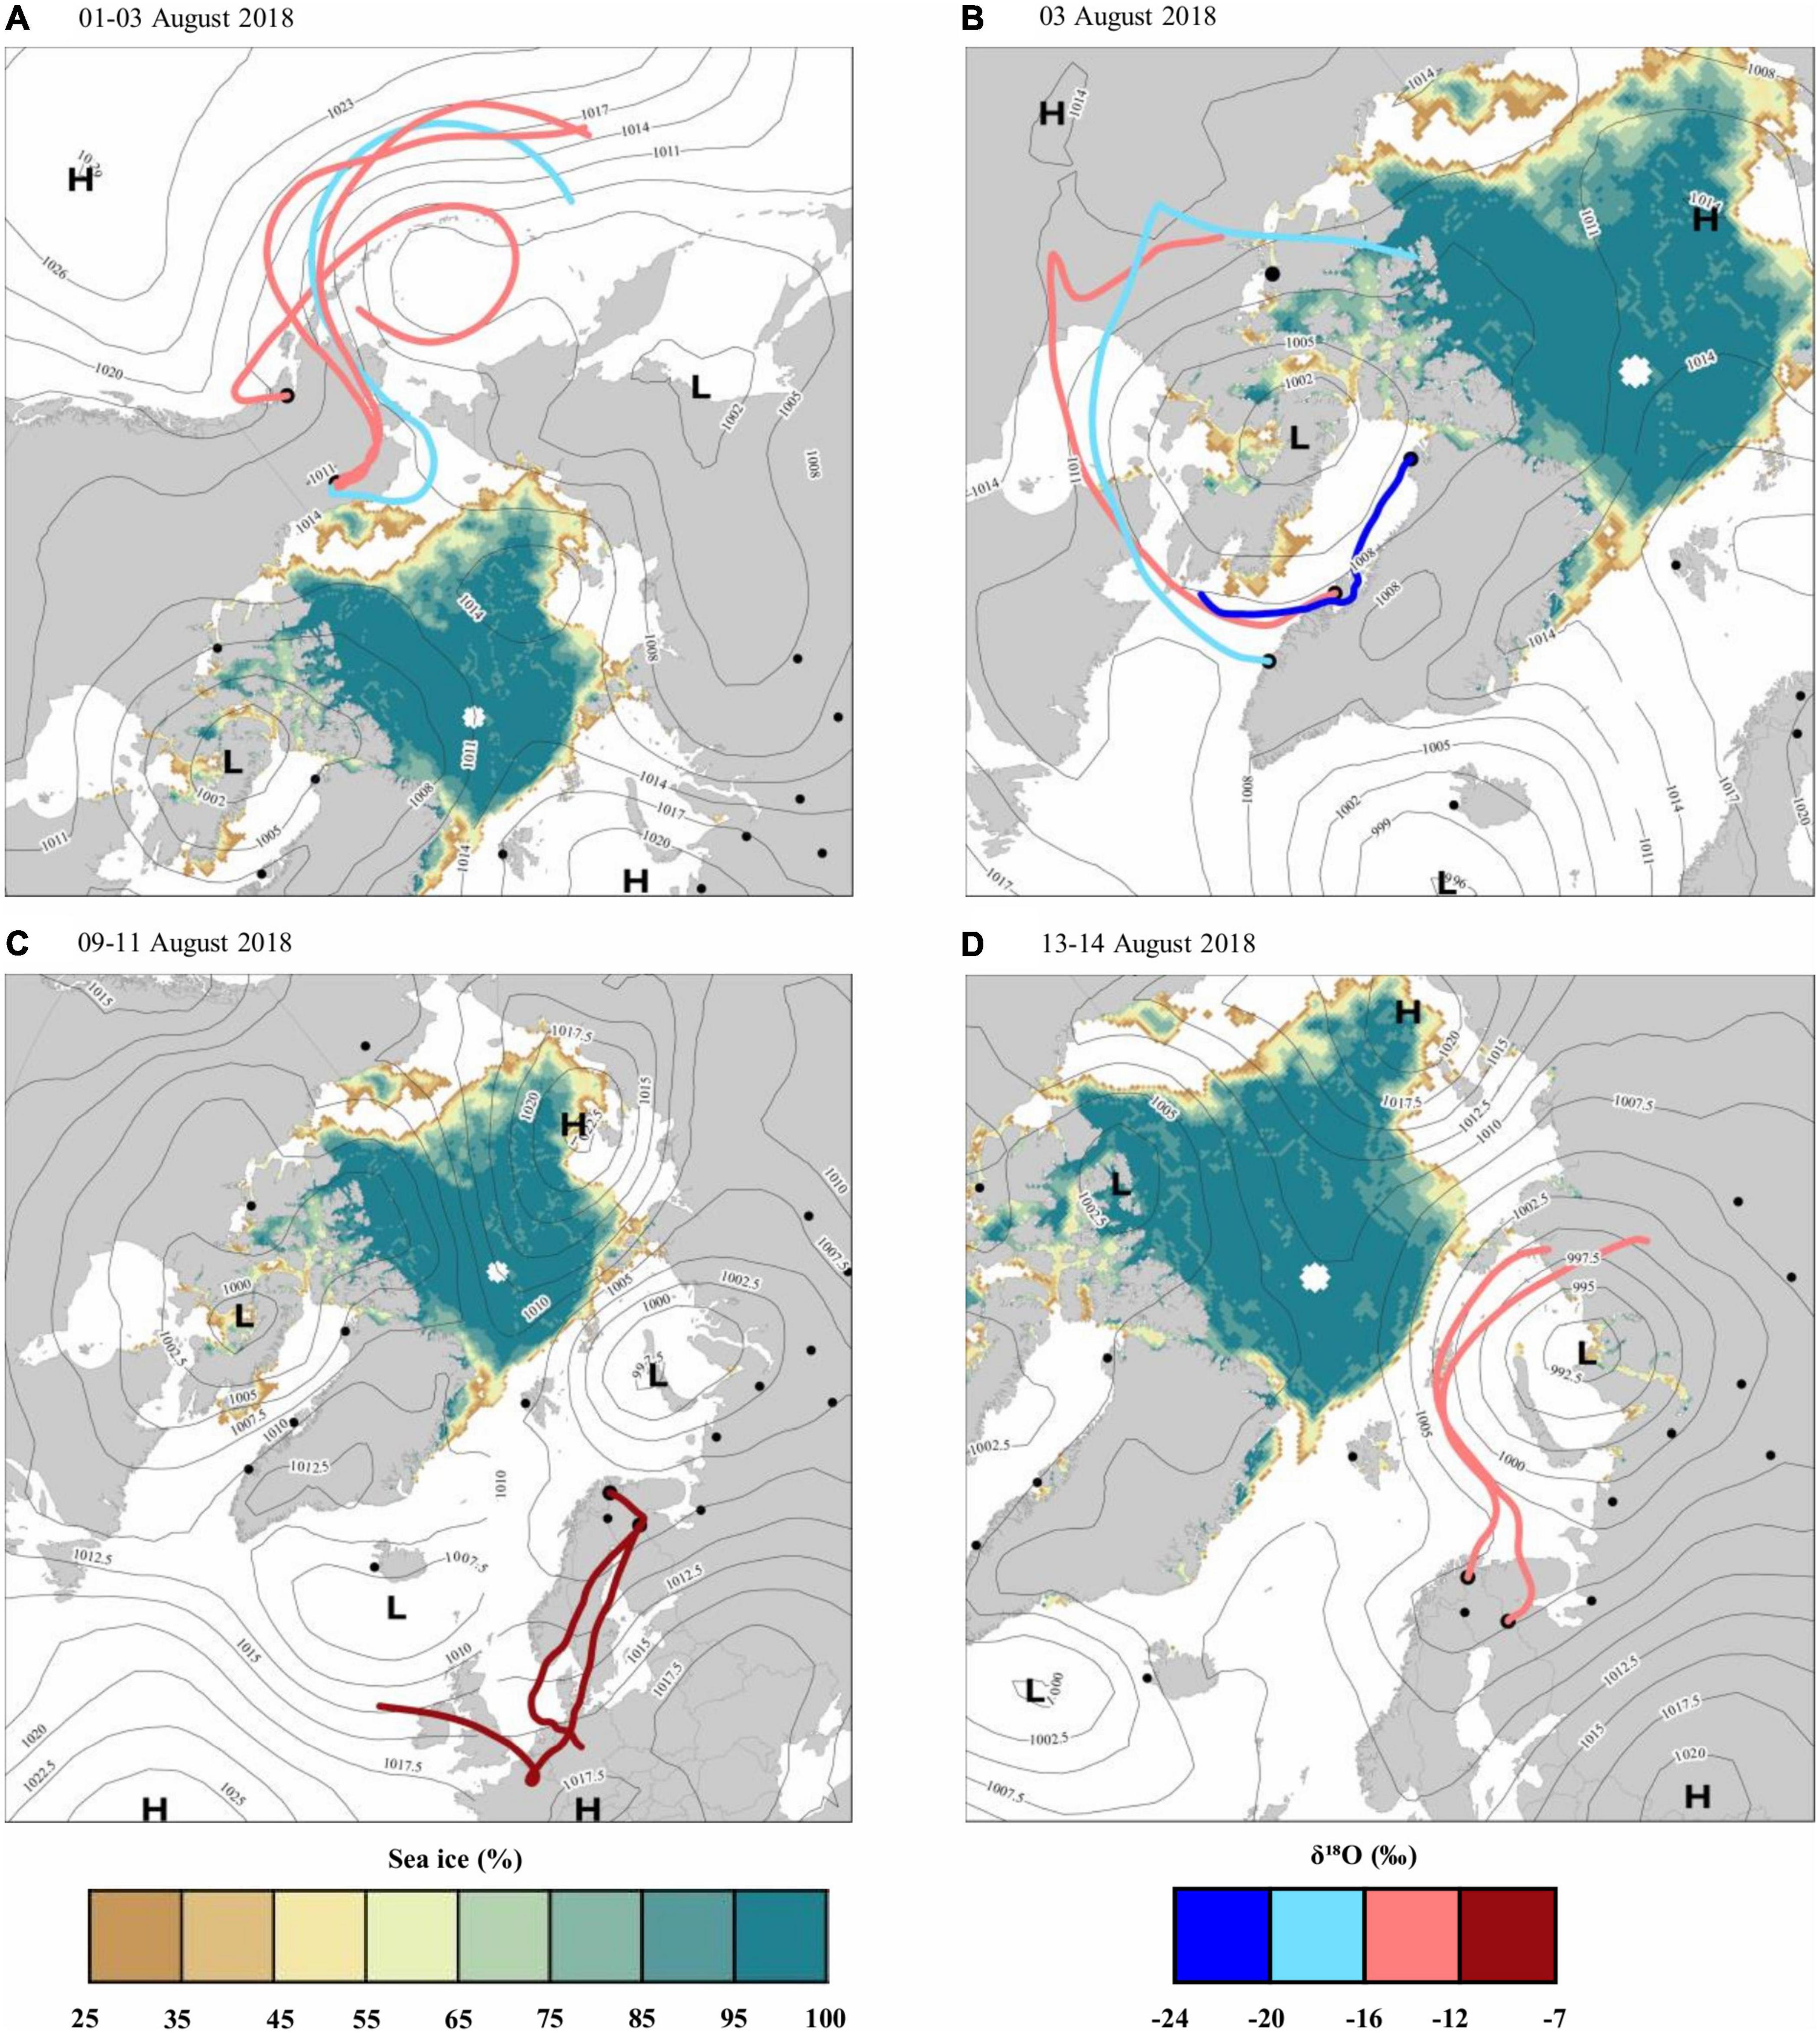
Figure 6. Five-day (120 h) HYSPLIT back-trajectory case examples to (A) Alaska, (B) Greenland, and (C,D) Finland during August 2018. Trajectory colors represent the δ18O value of the corresponding precipitation event. Black contour lines depict mean daily composited sea level pressure (mb) during the corresponding interval from NCEP/NCAR reanalysis (Kalnay et al., 1996), with low- and high-pressure systems indicated by L and H, respectively. Shaded contours depict daily mean sea ice concentration on the date of the last event on each map (NSIDC, 2019). Black circles indicate PAPIN sampling stations.
Our analyses reveal that 68% of the precipitating air masses sampled in summer 2018 were transported into the Arctic from mid-latitudes (as south as 35°N) (Figure 5 and Supplementary Figures 2–6). These findings support earlier studies suggesting that the Arctic atmospheric moisture budget is dominated by the meridional moisture flux from lower latitudes (Gimeno et al., 2019 and references therein). In summer 2018 this poleward transport regime was intensified in the Atlantic sector due to deep Icelandic Low circulation that advected storms north to Iceland and Svalbard, in association with the anomalous NAO+ (Kopec et al., 2016; Figures 5, 6 and Table 1). Rainfall associated with these trajectories have the highest δ18O values, reflecting the meridional transport, entrainment, and continuous isotopic exchange of relatively warm, moist, mid-latitude vapor enriched in 18O (Figures 2, 5; Aggarwal et al., 2005; Bailey et al., 2015). Characteristic examples include Ny-Ålesund and Iceland where poleward tracks are associated with positive precipitation δ18O anomalies (Figure 5). Conversely, precipitation d-excess values from meridional flow patterns were more variable (Figure 5). This phenomenon may partly reflect divergent relative humidity (RH) conditions over the North Atlantic (lower RH, higher d-excess) compared to the North Pacific (higher RH, lower d-excess) (Supplementary Figure 7) that drive variable surface evaporation and non-equilibrium fractionation conditions (Pfahl and Sodemann, 2014).
Poleward transport patterns also dominated rainfall events in the Eurasian sector and were typically characterized by positive δ18O anomalies, particularly in the west due to the stronger maritime Atlantic influence (Figure 5). For instance, in early August 2018 the synoptic configuration drove south-westerly air masses to Finland carrying enriched 18O moisture to Oulanka (9 Aug) and subsequently Kevo (11 Aug) (Figure 6C). We captured a gradual decrease (/increase) of 2.5‰ (/8.7‰) in precipitation δ18O (/d-excess) from Oulanka to Kevo (∼390 km site-to-site distance), confirming that as moisture was gradually removed from the air mass as it progressed north and cooled, the δ18O (d-excess) of residual vapor decreased (/increased) with decreasing water vapor content (Rozanski et al., 1992; Table 3). We observe this poleward pattern to dominate moisture transport to Finland during the summer, with Oulanka precipitation exhibiting the highest mean δ18O values followed by Pallas and Kevo, respectively, and the contrary trend for d-excess (Figure 2 and Table 1). An identical pattern was also observed in eastern Russia, with mean summer d-excess (/δ18O) progressively increasing (/decreasing) with increasing latitude between Kajbasovo and Zotino stations due to prevailing southerly flow (Figure 5). In total, southerly trajectories accounted for 73.7% of Eurasian transport regimes in summer 2018. In Russia these trajectories do not pass over any marine reservoirs (Supplementary Figures 3–6), hence δ-values are representative of recycled continental moisture (i.e., evaporation/evapotranspiration) rather than oceanic (Kurita et al., 2004). In summer 2018, these processes were likely augmented due to the relatively high SATs across Russia (Table 1).
Meridional moisture transport patterns were also observed in the North American sector, particularly at Anchorage where all summer 2018 trajectories derived from the North Pacific region due to the dominance of the North Pacific High (Figure 6 and Supplementary Figure 2A). This prevailing flow pattern was also previously identified by Bailey et al. (2019), yet we find that summer mean Anchorage δ18O values are typically lower than in the maritime Atlantic sector from similar meridional flow patterns (e.g., at Sudurnes, Ny-Ålesund) (Figure 5). These nuances likely reflect the topographic barriers in coastal southern Alaska that induce an isotopic rain shadow effect and depletion of 18O in moist air masses converging in Anchorage. Meridional air masses sourced from the North Pacific delivered lower rainfall δ18O values at Toolik compared to Anchorage, reflecting rainout processes and isotopic depletion over the Alaska and Brooks Mountain Ranges (Klein et al., 2016). Yet we also observed complex cases where atmospheric moisture was advected from the North Pacific across the Bering Sea into Alaska, such as in early August 2018 (Figure 6). Consecutive daily precipitation events were collected at Toolik between 1 and 3 August, while precipitation was simultaneously collected at Anchorage on 3 August and reflected the tail end of this system (Figure 6A). The highest δ18O value at Toolik was recorded on the first day of the event (−12.7‰) yet is analogous to Anchorage δ18O on the third day (−12.9‰). Considering Toolik’s higher latitude, we propose these relatively high δ18O values reflect the supplemental injection of water vapor from the Alaskan interior as the air mass transited north, for instance due to evapotranspiration and/or evaporation from terrestrial open water sources such as lakes, rivers, and tundra wetlands (Klein et al., 2016). Precipitation δ18O (/d-excess) values at Toolik gradually decreased (/increased) during the subsequent 2 days in concert with a SAT decrease of 9.2°C between 1 and 3 August (Table 3). Our model output reveals that these trends reflect the gradual northerly shift of trajectories to Toolik, with precipitation on 3 August derived from an air mass that passed over the Chukchi Sea where it entrained ocean evaporate relatively depleted in 18O (Figure 6A). Additionally, the anomalously high Toolik d-excess on 3 August (8.1‰) likely reflects the large-humidity gradients between the Chukchi Sea surface and relatively dry atmosphere, leading to strong non-equilibrium (kinetic) fractionation and an evaporate characterized by relatively high d-excess and low δ18O that was injected south out of the Arctic (Kurita, 2011; Klein et al., 2015; Putman et al., 2017).
The second most dominant atmospheric regime in summer 2018 encompassed northerly air mass transport from the Arctic toward lower latitudes (32% of all trajectories). Previous studies have suggested that the northerly moisture flux out of the Arctic is a winter phenomenon typically associated with cold air outbreak events (Puntsag et al., 2016; Nygård et al., 2020). Yet to the contrary, our model output indicates the central Arctic Ocean, as well as the Beaufort, Chukchi, East Siberian, Laptev, Barents, Kara, and Lincoln Seas to be key regions over which northerly trajectories passed and entrained moisture in summer 2018 (Supplementary Figure 2).
The Atlantic sector was associated with the highest frequency of northerly trajectories (38.6%), followed by the North American (35.7%) and Eurasian (26.3%). This pattern in the Atlantic sector primarily reflected the strong NAO+ circulation regime characterized by deep cyclonic activity (Figures 5, 6). Our data indicate that precipitation associated with these north-northwesterly air flows were characterized by anomalously low δ18O and high d-excess values, such as at Thule in northwest Greenland (Figure 2). A recent study also observed a similar relation between the NAO and atmospheric water vapor isotopes measured at Thule between 2017 and 2019, whereby NAO+ circulation phases suppressed southerly flow into Thule, leading to cooler SATs and lower δ-values and higher d-excess (Akers et al., 2020). Additionally, approximately 61% of Toolik trajectories started from central Arctic regions, with precipitation characterized by anomalously low δ18O and high d-excess (Figure 5), with the lowest measured δ18O value reaching −28.5‰ (28 Aug) that derived from the central Arctic basin and passed over the Chukchi Sea.
In the Eurasian sector ∼26.3% of summer trajectories derived from the Arctic Ocean and Barents-Kara region. These tracks were associated with precipitation characterized by considerably higher mean summer δ18O values, between −7 and −14‰, compared to the North American sector (−15 to −20‰; Figure 2). The rate of surface warming and sea ice loss has been the highest in this region of Arctic in recent decades (Lind et al., 2018; Stroeve and Notz, 2018). This “Atlantification” of the Barents-Kara region reflects the increased inflow of warmer Atlantic water to the region (Faber et al., 2017; Årthun et al., 2019) and is a potential source of the observed precipitation δ18O variability in the east and western Arctic. For instance, precipitation in the Eurasian sector from northerly air masses are comparatively enriched in Atlantified 18O evaporate from the Barents-Kara Seas, contrary to the more depleted North American precipitation derived from the central Arctic basin where sea ice concentration was higher (Figure 6). Labytnangi in northern Russia is a characteristic example where northerly Barents-derived trajectories were characterized by high δ18O and low d-excess anomalies during summer 2018 (Figure 5).
A key driving mechanism of sea ice variability in the Barents-Kara Region relates to summer cyclone activity, that in turn can influence meteoric isotope composition (Klein et al., 2015). This process was well-captured in Finland on 13 and 14 August 2018 at Kevo and Oulanka, respectively. While southerly air flow prevailed during the preceding 2 days (Aug 9–11) (Figure 6C; section “Out of the Arctic”), a deepening low-pressure system over the Kara Sea (993 hPa) subsequently induced a rapid transition to northerly air flow in Finland on 13 August (Figure 6D). At Kevo and Oulanka these northerly trajectories delivered precipitation from the Barents Sea that was relatively enriched in 18O (−12.8‰) compared to Chukchi Sea-derived moisture to Toolik (−19.2‰). Yet, precipitation isotope composition was characterized by overall lower (/higher) δ18O (/d-excess) compared to the southerly trajectory precipitation at Kevo/Oulanka during the preceding days (Figure 6C and Table 3). Additionally, although Oulanka is located ∼400 km south of Kevo and the Barents air mass was subject to rainout and isotopic depletion during transit south; precipitation δ18O values on 13 and 14 August were remarkably similar among the two sites (±1.1‰, Table 3), likely reflecting the 8.8°C warmer SATs at Kevo during the event (Table 3) and highlighting the multitude of environmental factors influencing precipitation isotope variability at any individual site.
Our model output identifies a third atmospheric transport regime that broadly reflects precipitation events distinguished by back-trajectory pathways that remain within the Arctic (Supplementary Figures 2–6), although we acknowledge overlap with the flow regime described previously (section “Out of the Arctic”). Characteristic examples include at Cambridge Bay, where ∼62% of precipitation derived from zonal westerly trajectories originating over the Chukchi Sea and Alaska that induced anomalously low (/high) mean δ18O (/d-excess) values relative to the summer mean (Figure 5 and Supplementary Figure 2C). Additionally, summer precipitation in western Greenland was primarily charged by moisture sourced from Baffin Bay and the Canadian Archipelago that followed WNW trajectories, and was characterized by anomalously low δ18O and high d-excess relatively to the summer mean (Figure 5 and Supplementary Figures 2, 3). In summer 2018, these flow regimes to Greenland were amplified due to the prevailing NAO+ pattern and enhanced cyclonic circulation over the western Arctic. For example, simultaneous precipitation events sampled on 3 August at all Greenland sites were delivered by trajectories centered around a low-pressure system anchored over the Canadian Archipelago (Figure 6B). In accordance with our observed pan-Arctic δ18O-latitude/temperature trends, precipitation at Thule—the most northerly Greenland station—was characterized by the lowest δ18O (−21.1‰; Table 3). Precipitation δ18O at Disko was +1.5‰ higher than at Nuuk despite the former’s higher latitude (Figure 6) and may instead reflect the higher topography surrounding Nuuk that induced isotopic depletion of 18O within the precipitating air mass.
PAPIN is the first coordinated event-based sampling network used to quantify the spatial-temporal patterns of precipitation isotopes, simultaneously, across the Arctic. While this initial assessment of summer 2018 data indicates the myriad processes influencing precipitation isotope geochemistry at any one site, we also observe key emergent trends that provide new insight into the controls on pan-Arctic isotope variability, as well as an empirical framework for interpreting summer paleo-precipitation isotope data in climate archives (Biskaborn et al., 2019; Kostrova et al., 2019). Our modeled back-trajectories depict two dominant, yet divergent, summer moisture transport regimes operating in the Arctic today: (1) a prevailing poleward moisture flux characterized by precipitation with relatively high δ18O, and (2) moist northerly Arctic incursions characterized by relatively lower δ18O and higher d-excess. Notably, whereas previous studies have suggested that a northerly moisture flux out of the Arctic is primarily a winter phenomenon typically associated with cold air outbreak events (Puntsag et al., 2016; Nygård et al., 2020); to the contrary, our analyses indicate that the central Arctic Ocean, as well as the Beaufort, Chukchi, East Siberian, Laptev, Barents, Kara, and Lincoln Seas are key regions over which northerly air masses entrained moisture in summer 2018.
Considering the forecast strengthening and poleward shift of the mid-latitude storm track (Bintanja et al., 2020), our data suggest this increased flux of warm, mid-latitude vapor may contribute an overall isotopic enriching trend in Arctic precipitation δ18O values in the future. Yet the data also implicate that with continued Arctic sea ice decline, this isotope trend may be offset by new emergent oceanic moisture sources (Klein and Welker, 2016; Sime et al., 2019; Bailey et al., 2021), potentially leading to precipitation and continental freshwaters that are increasingly higher (lower) in d-excess (δ-values) relative to the long-term mean, as per trends observed in northeast North America in recent decades (Puntsag et al., 2016). Resolving these processes at sub-/diurnal, monthly, seasonal, and annual timescales using a spatially dense monitoring network is an ongoing research priority, and will be key to quantifying past, present, and future feedbacks of an amplified Arctic water cycle on the global climate system.
PAPIN data from summer 2018 are available in the Supplementary Data file and on the Zenedo repository (https://doi.org/10.5281/zenodo.476705).
JW designed and directed the project. JW, EK, and HB contributed to the implementation of the research. KG, MB-H, AC, DD, BE, IF, VH, SJ, SK, AK, HM, MN, MO, RP, OP, AP, MR, KR, OS, IS, SV, EZ, and JW contributed to precipitation sample collection. K-RM and MM managed the dataset and isotopic analysis results. MM provided HYSPLIT modeling and statistical data analysis. MM and HB designed the figures. MM, HB, K-RM, HM, and JW contributed to the discussion and interpretation of data and the writing of the manuscript. All authors contributed to the article and approved the submitted version.
The Pan-Arctic Precipitation Isotope Network (PAPIN) received funding from the European Union’s Horizon 2020 Project INTERACT, under Grant Agreement No.730938 (JW PI). An Academy of Finland Grant (316014-JW PI). Support was also provided by a University of the Arctic Research Chairship to JW that funded isotope analyses and provided postdoctoral support for HB and K-RM and postgraduate research support for MM. A Russian Science Foundation Grant (No. 18-11-00024) to KG funded isotope analyses. SK was thankful to Russian Science Foundation (No. 20-67-46018). Russian Foundation for Basic Research (BFBR) supported isotopic analyses conducted by AP (#18-05-60203-Arktika).
The authors declare that the research was conducted in the absence of any commercial or financial relationships that could be construed as a potential conflict of interest.
We gratefully acknowledge all participating PAPIN stations. Tarja Törmänen and Aino Erkinaro assisted with sample analysis at the Stable Isotope Laboratory, University of Oulu. Shawn Marriott, Patrick Duke and Polar Knowledge Canada are acknowledged for their support with the Canadian High Arctic Research Station. Sergey Serikov and Aleksandr Sokolov assisted with Russian precipitation sampling. The NOAA Air Resources Laboratory (ARL) is gratefully acknowledged for provision of the HYSPLIT transport model used in this study. NCEP/NCAR data were obtained from the National Oceanic and Atmospheric Administration (NOAA) Earth System Research Laboratory’s (ESRL) Physical Sciences Laboratory database.
The Supplementary Material for this article can be found online at: https://www.frontiersin.org/articles/10.3389/feart.2021.651731/full#supplementary-material
Aggarwal, P. K., Froehlich, K. F., and Gat, J. R. (2005). Isotopes in the Water Cycle. Dordrecht: Springer.
Akers, P. D., Kopec, B. G., Mattingly, K. S., Klein, E. S., Causey, D., and Welker, J. M. (2020). Baffin Bay sea ice extent and synoptic moisture transport drive water vapor isotope (δ18O, δ2H, and deuterium excess) variability in coastal northwest Greenland. Atmos. Chem. Phys. 20, 13929–13955. doi: 10.5194/acp-20-13929-2020
Akers, P. D., Welker, J. M., an Brook, G. A. (2017). Reassessing the role of temperature in precipitation oxygen isotopes across the eastern and central United States through weekly precipitation-day data. Water Resour. Res. 53, 7644–7661. doi: 10.1002/2017wr020569
Ala-aho, P., Welker, J. M., Bailey, H., Højlund Pedersen, S., Kopec, B., Klein, E., et al. (2021). Arctic snow isotope hydrology: a comparative snow-water vapor study. Atmosphere 12:150. doi: 10.1038/s41561-021-00719-y
Ali, S. M., and Pithan, F. (2020). Following moist intrusions into the Arctic using SHEBA observations in a Lagrangian perspective. Q. J. R. Meteorol. Soc. 146, 3522–3533. doi: 10.1002/qj.3859
Årthun, M., Eldevik, T., and Smedsrud, L. H. (2019). The role of Atlantic heat transport in future Arctic winter sea ice loss. J. Clim. 32, 3327–3341. doi: 10.1175/jcli-d-18-0750.1
Bailey, H. L., Henderson, A. C., Sloane, H. J., Snelling, A., Leng, M. J., and Kaufman, D. S. (2014). The effect of species on lacustrine δ18Od and its implications for palaeoenvironmental reconstructions. J. Quat. Sci. 29, 393–400. doi: 10.1002/jqs.2711
Bailey, H. L., Kaufman, D. S., Henderson, A. C., and Leng, M. J. (2015). Synoptic scale controls on the δ18O in precipitation across Beringia. Geophys. Res. Lett. 42, 4608–4616. doi: 10.1002/2015gl063983
Bailey, H. L., Kaufman, D. S., Sloane, H. J., Hubbard, A. L., Henderson, A. C., Leng, M. J., et al. (2018). Holocene atmospheric circulation in the central North Pacific: a new terrestrial diatom and δ18O dataset from the Aleutian Islands. Quat. Sci. Rev. 194, 27–38. doi: 10.1016/j.quascirev.2018.06.027
Bailey, H. L., Klein, E. S., and Welker, J. M. (2019). Synoptic and mesoscale mechanisms drive winter precipitation δ18O/δ2H in south-central Alaska. J. Geophys. Res. 124, 4252–4266. doi: 10.1029/2018jd030050
Bailey, H., Hubbard, A., Klein, E. S., Mustonen, K. R., Akers, P. D., Mattila, H., et al. (2021). Arctic sea-ice loss fuels extreme European snowfall. Nat. Geosci. 1–6.
Bhatia, M. P., Das, S. B., Kujawinski, E. B., Henderson, P., Burke, A., and Charette, M. A. (2011). Seasonal evolution of water contributions to discharge from a Greenland outlet glacier: insight from a new isotope-mixing model. J. Glaciol. 57, 929–941. doi: 10.3189/002214311798043861
Bintanja, R., van der Wiel, K., Van der Linden, E. C., Reusen, J., Bogerd, L., Krikken, F., et al. (2020). Strong future increases in Arctic precipitation variability linked to poleward moisture transport. Sci. Adv. 6:eaax6869. doi: 10.1126/sciadv.aax6869
Biskaborn, B. K., Nazarova, L. B., Pestryakova, L. A., Syrykh, L., Funck, K., Meyer, H., et al. (2019). Spatial distribution of environmental indicators in surface sediments of Lake Bolshoe Toko, Yakutia, Russia. Biogeosciences 16, 4023–4049. doi: 10.5194/bg-16-4023-2019
Blunden, J., and Arndt, D. S. (2019). State of the Climate in 2018. Bull. Am. Meteorol. Soc. 100:Si–S306. doi: 10.1175/2019bamsstateoftheclimate.1
Bonne, J. L., Behrens, M., Meyer, H., Kipfstuhl, S., Rabe, B., Schönicke, L., et al. (2019). Resolving the controls of water vapour isotopes in the Atlantic sector. Nat. Commun. 10, 1–10. doi: 10.1038/s41467-019-09242-6
Bonne, J. L., Masson-Delmotte, V., Cattani, O., Delmotte, M., Risi, C., Sodemann, H., et al. (2014). The isotopic composition of water vapour and precipitation in Ivittuut, southern Greenland. Atmos. Chem. Phys. 14, 4419–4439. doi: 10.5194/acp-14-4419-2014
Bowen, G. J., Cai, Z., Fiorella, R. P., and Putman, A. L. (2019). Isotopes in the water cycle: regional-to global-scale patterns and applications. Annu. Rev. Earth Planet. Sci. 47, 453–479. doi: 10.1146/annurev-earth-053018-060220
Craig, H. (1961). Isotopic variations in meteoric waters. Science 133, 1702–1703. doi: 10.1126/science.133.3465.1702
Dansgaard, W. (1964). Stable isotopes in precipitation. Tellus 16, 436–468. doi: 10.3402/tellusa.v16i4.8993
Faber, A. K., Vinther, B. M., Sjolte, J., and Pedersen, R. A. (2017). How does sea ice influence δ18O of Arctic precipitation? Atmos. Chem. Phys. 17, 5865–5876. doi: 10.5194/acp-17-5865-2017
Fransson, A., Chierici, M., Nomura, D., Granskog, M. A., Kristiansen, S., Martma, T., et al. (2020). Influence of glacial water and carbonate minerals on wintertime sea-ice biogeochemistry and the CO2 system in an Arctic fjord in Svalbard. Ann. Glaciol. 1–21. doi: 10.1017/aog.2020.52
Galewsky, J., Steen-Larsen, H. C., Field, R. D., Worden, J., Risi, C., and Schneider, M. (2016). Stable isotopes in atmospheric water vapor and applications to the hydrologic cycle. Rev. Geophys. 54, 809–865. doi: 10.1002/2015rg000512
Gat, J. R., Mook, W. G., and Meijer, H. A. (2001). Environmental Isotopes in the Hydrological Cycle, Principles and Applications. Groningen: UNESCO/IAEA
Gimeno, L., Vázquez, M., Eiras-Barca, J., Sorí, R., Algarra, I., and Nieto, R. (2019). Atmospheric moisture transport and the decline in Arctic Sea ice. Wiley Interdiscip. Rev. 10;e588. doi: 10.1002/wcc.588
Huang, Y., Dong, X., Bailey, D. A., Holland, M. M., Xi, B., DuVivier, A. K., et al. (2019). Thicker clouds and accelerated Arctic sea ice decline: the atmosphere-sea ice interactions in spring. Geophys. Res. Lett. 46, 6980–6989. doi: 10.1029/2019gl082791
Juhls, B., Stedmon, C. A., Morgenstern, A., Meyer, H., Hölemann, J., Heim, B., et al. (2020). Identifying drivers of seasonality in lena river biogeochemistry and dissolved organic matter fluxes. Front. Environ. Sci. 8:53. doi: 10.3389/fenvs.2020.00053
Kalnay, E., Kanamitsu, M., Kistler, R., Collins, W., Deaven, D., Gandin, L., et al. (1996). The NCEP/NCAR 40-year reanalysis project. Bull. Am. Meteorol. Soc. 77, 437–472. doi: 10.1175/1520-0477
Kapsch, M. L., Skific, N., Graversen, R. G., Tjernström, M., and Francis, J. A. (2019). Summers with low Arctic sea ice linked to persistence of spring atmospheric circulation patterns. Clim. Dyn. 52, 2497–2512. doi: 10.1007/s00382-018-4279-z
Klein, E. S., and Welker, J. M. (2016). Influence of sea ice on ocean water vapor isotopes and Greenland ice core records. Geophys. Res. Lett. 43, 12475–12483. doi: 10.1002/2016gl071748
Klein, E. S., Cherry, J. E., Young, J., Noone, D., Leffler, A. J., and Welker, J. M. (2015). Arctic cyclone water vapor isotopes support past sea ice retreat recorded in Greenland ice. Sci. Rep. 5:10295. doi: 10.1038/srep10295
Klein, E. S., Nolan, M., McConnell, J., Sigl, M., Cherry, J., Young, J., et al. (2016). McCall Glacier record of Arctic climate change: interpreting a northern Alaska ice core with regional water isotopes. Quat. Sci. Rev. 131, 274–284. doi: 10.1016/j.quascirev.2015.07.030
Kopec, B. G., Feng, X., Michel, F. A., and Posmentier, E. S. (2016). Influence of sea ice on Arctic precipitation. Proc. Natl. Acad. Sci.U.S.A. 113, 46–51. doi: 10.1073/pnas.1504633113
Kostrova, S. S., Meyer, H., Bailey, H. L., Ludikova, A. V., Gromig, R., Kuhn, G., et al. (2019). Holocene hydrological variability of Lake Ladoga, northwest Russia, as inferred from diatom oxygen isotopes. Boreas 48, 361–376. doi: 10.1111/bor.12385
Kostrova, S. S., Meyer, H., Fernandoy, F., Werner, M., and Tarasov, P. E. (2020). Moisture origin and stable isotope characteristics of precipitation in southeast Siberia. Hydrolo. Process. 34, 51–67. doi: 10.1002/hyp.13571
Kurita, N. (2011). Origin of Arctic water vapor during the ice-growth season. Geophys. Res. Lett. 38, L02709. doi: 10.1029/2010gl046064
Kurita, N., Yoshida, N., Inoue, G., and Chayanova, E. A. (2004). Modern isotope climatology of Russia: a first assessment. J. Geophys. Res. 109:D03102. doi: 10.1029/2003jd003404
Läderach, A., and Sodemann, H. (2016). A revised picture of the atmospheric moisture residence time. Geophys. Res. Lett. 43, 924–933. doi: 10.1002/2015gl067449
Lind, S., Ingvaldsen, R. B., and Furevik, T. (2018). Arctic warming hotspot in the northern Barents Sea linked to declining sea-ice import. Nat. Clim. Chang. 8, 634–639. doi: 10.1038/s41558-018-0205-y
NOAA (2019). Climate Prediction Center: Teleconnections – Monthly Indices, National Weather Service. Washington, DC: NOAA.
NSIDC (2019). National Ice Center and National Snow and Ice Data Center. Meier, W. N., F. Fetterer, M. Savoie, S. Mallory, R. Duerr, and J. Stroeve. 2017. NOAA/NSIDC Climate Data Record of Passive Microwave Sea Ice Concentration, Version 3. Boulder, CO: National Snow and Ice Data Center, doi: 10.7265/N59P2ZTG
Nygård, T., Naakka, T., and Vihma, T. (2020). Horizontal moisture transport dominates the regional moistening patterns in the Arctic. J. Clim. 33, 6793–6807. doi: 10.1175/jcli-d-19-0891.1
Overland, E., Hannah, E., Hanssen-Bauer, I., Kim, S.-J., Walsh, J. E., Wang, M., et al. (2019). Surface Air Temperature. Arctic Report Card 2019, J. Richter-Menge, M. L. Druckenmiller, and M. Jeffries, Eds. Available online at: http://www.arctic.noaa.gov/Report-Card (accessed November 20, 2019).
Peel, D. A., and Mulvaney, R. (1992). Time-trends in the pattern of ocean-atmosphere exchange in an ice core from the Weddell Sea sector of Antarctica. Tellus B 44, 430–442. doi: 10.1034/j.1600-0889.1992.00018.x
Peel, D. A., Mulvaney, R., and Davison, B. M. (1988). Stable-isotope/air-temperature relationships in ice cores from Dolleman Island and the Palmer Land plateau, Antarctic Peninsula. Ann. Glaciol. 10, 130–136. doi: 10.3189/s0260305500004304
Pfahl, S., and Sodemann, H. (2014). What controls deuterium excess in global precipitation? Clim. Past 10, 771–781. doi: 10.5194/cp-10-771-2014
Puntsag, T., Mitchell, M. J., Campbell, J. L., Klein, E. S., Likens, G. E., and Welker, J. M. (2016). Arctic Vortex changes alter the sources and isotopic values of precipitation in northeastern US. Sci. Rep. 6, 1–9. doi: 10.1038/srep22647
Putman, A., Feng, X., Sonder, L., and Posmentier, E. (2017). Annual variation in event-scale precipitation δ2H at Barrow, AK, reflects vapor source region. Atmos. Chem. Phys. 17, 4627–4639. doi: 10.5194/acp-17-4627-2017
Rolph, G., Stein, A., and Stunder, B. (2017). Real-time environmental applications and display sYstem: READY. Environ. Model. Softw. 95, 210–228. doi: 10.1016/j.envsoft.2017.06.025
Rozanski, K., Araguas-Araguas, L., and Gonfiantini, R. (1992). Relation between long-term trends of oxygen-18 isotope composition of precipitation and climate. Science 258, 981–985. doi: 10.1126/science.258.5084.981
Rozanski, K., Sonntag, C., and Münnich, K. O. (1982). Factors controlling stable isotope composition of European precipitation. Tellus 34, 142–150. doi: 10.1111/j.2153-3490.1982.tb01801.x
Sime, L. C., Hopcroft, P. O., and Rhodes, R. H. (2019). Impact of abrupt sea ice loss on Greenland water isotopes during the last glacial period. Proc. Natl. Acad. Sci.U.S.A. 116, 4099–4104. doi: 10.1073/pnas.1807261116
Smith, E. T., and Sheridan, S. C. (2020). Where do Cold Air Outbreaks occur and how have they changed over time? Geophys. Res. Lett. 47:e2020GL086983. doi: 10.1029/2020gl086983
Steen-Larsen, H. C., Masson-Delmotte, V., Sjolte, J., Johnsen, S. J., Vinther, B. M., Bréon, F. M., et al. (2011). Understanding the climatic signal in the water stable isotope records from the NEEM shallow firn/ice cores in northwest Greenland. J. Geophys. Res. Atmos. 116:D06108. doi: 10.1029/2010jd014311
Stein, A. F., Draxler, R. R., Rolph, G. D., Stunder, B. J., Cohen, M. D., and Ngan, F. (2015). NOAA’s HYSPLIT atmospheric transport and dispersion modeling system. Bull. Am. Meteorol. Soc. 96, 2059–2077. doi: 10.1175/bams-d-14-00110.1
Stroeve, J., and Notz, D. (2018). Changing state of Arctic sea ice across all seasons. Environ. Res. Lett. 13:103001. doi: 10.1088/1748-9326/aade56
Trenberth, K. E. (1998). Atmospheric moisture residence times and cycling: implications for rainfall rates and climate change. Clim. Change 39, 667–694. doi: 10.1023/a:1005319109110
Vachon, R. W., Welker, J. M., White, J. W. C., and Vaughn, B. H. (2010). Monthly precipitation isoscapes (δ18O) of the United States: connections with surface temperatures, moisture source conditions, and air mass trajectories. J. Geophys. Res. Atmos. 115:D21126. doi: 10.1029/2010jd014105
Vihma, T., Screen, J., Tjernström, M., Newton, B., Zhang, X., Popova, V., et al. (2016). The atmospheric role in the Arctic water cycle: a review on processes, past and future changes, and their impacts. J. Geophys. Res. Biogeosci. 121, 586–620. doi: 10.1002/2015jg003132
Welker, J. M. (2000). Isotopic (δ18O) characteristics of weekly precipitation collected across the USA: an initial analysis with application to water source studies. Hydrol. Process. 14, 1449–1464. doi: 10.1002/1099-1085(20000615)14:8<1449::aid-hyp993>3.0.co;2-7
Welker, J. M. (2012). ENSO effects on δ18O, δ2H and d-excess values in precipitation across the US using a high-density, long-term network (USNIP). Rapid Commun. Mass Spectrom. 26, 1893–1898. doi: 10.1002/rcm.6298
Keywords: Arctic, precipitation, sea ice, stable isotopes, atmospheric circulation, water cycle
Citation: Mellat M, Bailey H, Mustonen K-R, Marttila H, Klein ES, Gribanov K, Bret-Harte MS, Chupakov AV, Divine DV, Else B, Filippov I, Hyöky V, Jones S, Kirpotin SN, Kroon A, Markussen HT, Nielsen M, Olsen M, Paavola R, Pokrovsky OS, Prokushkin A, Rasch M, Raundrup K, Suominen O, Syvänperä I, Vignisson SR, Zarov E and Welker JM (2021) Hydroclimatic Controls on the Isotopic (δ18 O, δ2 H, d-excess) Traits of Pan-Arctic Summer Rainfall Events. Front. Earth Sci. 9:651731. doi: 10.3389/feart.2021.651731
Received: 11 January 2021; Accepted: 27 April 2021;
Published: 31 May 2021.
Edited by:
Nils Moosdorf, Leibniz Centre for Tropical Marine Research (LG), GermanyReviewed by:
Niels Munksgaard, James Cook University, AustraliaCopyright © 2021 Mellat, Bailey, Mustonen, Marttila, Klein, Gribanov, Bret-Harte, Chupakov, Divine, Else, Filippov, Hyöky, Jones, Kirpotin, Kroon, Markussen, Nielsen, Olsen, Paavola, Pokrovsky, Prokushkin, Rasch, Raundrup, Suominen, Syvänperä, Vignisson, Zarov and Welker. This is an open-access article distributed under the terms of the Creative Commons Attribution License (CC BY). The use, distribution or reproduction in other forums is permitted, provided the original author(s) and the copyright owner(s) are credited and that the original publication in this journal is cited, in accordance with accepted academic practice. No use, distribution or reproduction is permitted which does not comply with these terms.
*Correspondence: Moein Mellat, bW9laW4ubWVsbGF0QGF3aS5kZQ==
†Present address: Moein Mellat, Polar and Terrestrial Environmental Systems, Alfred Wegener Institute Helmholtz Centre for Polar and Marine Research, Potsdam, Germany
Disclaimer: All claims expressed in this article are solely those of the authors and do not necessarily represent those of their affiliated organizations, or those of the publisher, the editors and the reviewers. Any product that may be evaluated in this article or claim that may be made by its manufacturer is not guaranteed or endorsed by the publisher.
Research integrity at Frontiers
Learn more about the work of our research integrity team to safeguard the quality of each article we publish.