
94% of researchers rate our articles as excellent or good
Learn more about the work of our research integrity team to safeguard the quality of each article we publish.
Find out more
ORIGINAL RESEARCH article
Front. Earth Sci. , 02 June 2021
Sec. Interdisciplinary Climate Studies
Volume 9 - 2021 | https://doi.org/10.3389/feart.2021.650882
This article is part of the Research Topic Advances in Global Warming Observations and their Uncertainties View all 17 articles
 Yu Zhang1
 Guohua Fang1*
 Zhengyang Tang2,3Xin Wen1Hairong Zhang2,3
 Ziyu Ding1
 Xin Li1Xinsheng Bian4
 Zengyun Hu5
River flooding affects more people worldwide than other natural hazards. Thus, analysis of the changes in flood regime caused by global warming and increasing anthropogenic activities will help us make adaptive plans for future flood management. The nonstationary flood behavior in the upper Yangtze River was examined comprehensively in terms of trend, change point, and periodicity with co-usage of different methods. Results show that there are decreasing tendencies in the corresponding series of annual maximum flood peak flow and flood volume in four out of six control stations, except Pingshan and Wulong stations in the Jinsha River and the Wu River, respectively, and the flood peak occurrence time appears earlier mostly. The uniformity of flood process increases in four main tributaries, while it decreases in mainstream of the Yangtze River (Yichang and Pingshan stations). The rates of both rising limb and recession limb of all the typical flood process flowing through the six stations were analyzed. 77.8% of the rates of rising limb decrease, while 61.1% of the rates of recession limb increase, which is almost consistent with the variation reflected by the uniformity. The change points of most evaluation indicators happened in 1970s–1990s. The first main periodicity of evaluation indicators in Yichang is about 45 years, while that of other stations is about 20 years. Invalidity of stationarity in the flood series can be attributed to the intensified construction on major water conservancy projects, changes of underlying surface, and influences of climatic variables. The contributions of both climatic control and the Three Gorges Dam (TGD) to the variation of the annual flood peak in Yichang station were further quantitatively evaluated, which has verified that the construction of the TGD has played a positive role in peak-flood clipping.
With the influence of changing climate, land cover, channel morphology, and other human activities, the spatial–temporal distribution of water resources and the characteristics of runoff generation and flow concentration in the basin have changed, resulting in the shifts in the mechanisms that generate inundations (Fang et al., 2012; Guo et al., 2018; Akbari and Reddy, 2020). River flood risks are expected to rise as climate change intensifies the global hydrological cycle and more people live in floodplains (Field et al., 2012), which may be revealed by changes in the flood regime, including annual maximum flood peak flow, volume, flood peak occurrence time, rates of rising and recession limbs, and uniformity (Li et al., 2012; Bloschl et al., 2017; Slater and Wilby, 2017). Therefore, understanding the characteristics of changes in flood regime and further analyzing the reasons of these changes are important for flood management.
The Yangtze River Basin is home to 33% of China’s population and plays an important role in China’s economic development. The occurrence of flood in this basin is closely related to precipitation, while the spatial and temporal variability of precipitation in the basin is associated with monsoon activities that transport a huge amount of atmospheric moisture from the East and the South China Sea to the basin (Gao et al., 2012). In addition, the temporal distributions of precipitation are highly uneven, and over 60% of the annual precipitation occurs in summer, resulting in frequent floods. Historically, the Yangtze River catchment has been known for its frequent huge floods that halted the social advancement of the basin to a large degree.
The upstream of the Yichang hydrometric station is called the upper Yangtze River and has a drainage area of approximately 1.0 million km2. The upper Yangtze River is abundant in hydropower potential, with a suite of large reservoirs having been constructed in the past five decades. With the large-scale development of hydropower, the hydrological regimes in the basin, especially the spatial–temporal distribution of runoff at the outlet control hydrometric station, have presented a new situation, which also changes the flood regimes, therefore negatively affecting the efficiency of the planning and design of water conservancy projects and flood prevention management (Yao et al., 2006). There have been a lot of research results on the change characteristics of runoff and their attribution analysis in the Yangtze River (Jiang et al., 2007; Chen et al., 2014; Wei et al., 2014; Yang et al., 2015). However, research about the all-round change characteristics of flood regime is relatively few, and how to quantitatively evaluate the Three Gorges Dam’s (TGD) effect on peak-flood clipping is worthy of discussion. Specifically, it has been proven that the river engineering has amplified the flood hazard in the Mississippi River (Munoz et al., 2018).
Here, 12 evaluation indicators, including annual flood peak discharge, flood volume, flood timing, and uniformity, are used to comprehensively detect the flood regime change characteristics of the six control hydrometric stations in the upper Yangtze River from three perspectives of trend, change point, and periodicity, and the contributions of both climatic control and the TGD to the variation of the annual flood peak in Yichang station were further quantitatively evaluated. The main objectives of this study have been to: 1) detect the flood regime change, including the flood peak discharge, flood volume, time of flood peak occurrence, and uniformity of the upper Yangtze River; and 2) discuss how the annual maximum flood peak discharge is related to the TGD and the climatic control factors. This study will provide a better understanding on the all-round changes in flood regime of the upper Yangtze River, and how the dam-building activities and climate change affect the annual flood peak discharge in a long-term perspective.
The upper Yangtze River (UYR) is located in southwest China, spanning 21°8ʹ–34°20ʹN and 97°22ʹ–110°11ʹE. The UYR has a drainage area of 1.054 million km2, accounting for 59% of the total drainage area of the Yangtze River. It is composed of five river systems, that is, the Jinsha River, the Mintuo River, the Jialing River, the Wu River, and the trunk stream. The Jinsha River system is the main source of sediment in the Yangtze River, the Min River is the tributary with the largest water in UYR, the Jialing River is the tributary with the biggest drainage area in the UYR and the Wu River is the largest tributary on the right bank of the UYR. The flood in the Qing River always meets the flood in the trunk stream of the Yangtze River, which increases the threat to the Jingjiang embankment. The sketch map of the river systems and the digital elevation model (DEM) in the UYR are shown in Figure 1. The six key hydrometric stations and the TGD have been marked with asterisks and triangle symbol, respectively.
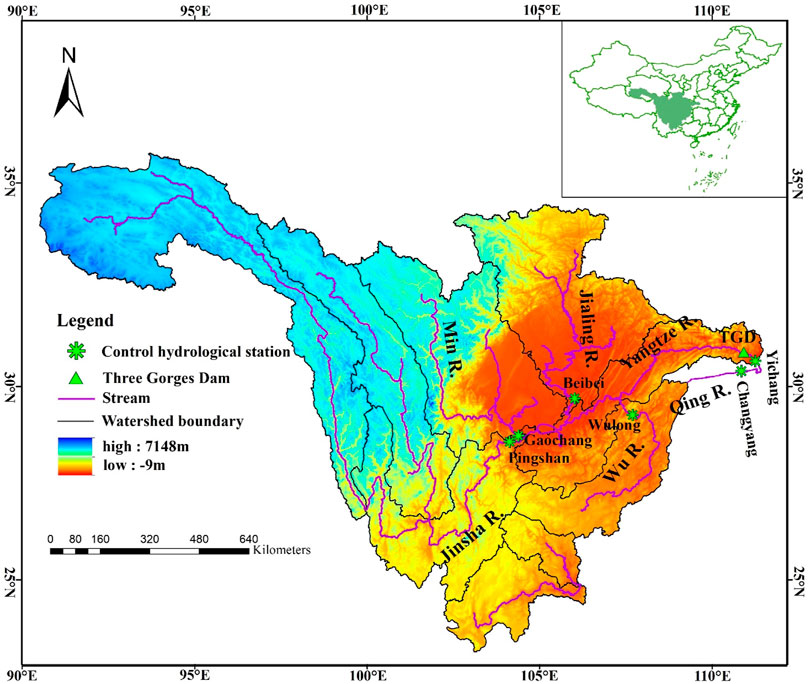
FIGURE 1. River systems and DEM of the upper Yangtze River.
The controlling hydrometric stations located at the outlets of the trunk stream, the Qing River, the Jialing River, the Wu River, the Min River, and the Jinsha River are Yichang, Changyang, Beibei, Wulong, Gaochang, and Pingshan, respectively. According to the multiyear daily runoff data of the six key hydrometric stations provided by the Hydrological Office, Yangtze Water Resources Committee, the typical flood events including the annual maximum peak discharge are selected to analyze the flood regime changes in the UYR. Due to the limitation of data availability, the length of data used in the six hydrometric stations is 139, 59, 61, 50, 55, and 71 years, respectively (see Table 1.
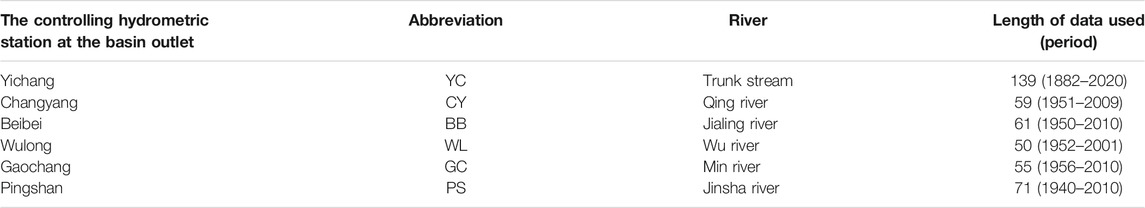
TABLE 1. Detailed information about the data used.
The climatic control factor data including the sunspot numbers (SSNs) and the North Atlantic Oscillation (NAO) are available at the websites https://psl.noaa.gov/gcos_wgsp/Timeseries/SUNSPOT/ and https://psl.noaa.gov/gcos_wgsp/Timeseries/NAO/, respectively.
On the basis of the measured daily runoff at six controlling hydrometric stations, namely, YC, CY, BB, WL, GC, PS, and the trend, abrupt change and periodicity analyses of 12 evaluation indicator time series extracted from the annual typical flood event are performed in each station. Therefore, the corresponding annual series derived from the daily data were actually analyzed in this study.
Recent evidences of the impact of regional climate variability, coupled with the intensification of human activities, have led hydrologists to study flood regime and test the hypothesis of stationarity (Bormann et al., 2011). In view of the magnitude and ubiquity of the human disturbances and hydro-climatic change, the stationarity of flood no long holds true because substantial anthropogenic and natural changes of climate are altering the means and extremes of precipitation, evapotranspiration, and rivers’ discharge rates (Milly et al., 2008). Salas once pointed out that there were no trends, shifts, or periodicity (cyclicity) in a consistent hydrological time series (Salas et al., 1980), so the non-stationarity was mainly manifested as the trend, abrupt change, and periodicity.
Most standard statistical techniques, including the Mann–Kendall test (Mann, 1945; Kendall, 1975), require the assumption that the analyzed series are the realizations of the independent random variables. However, most of the hydrological or climatological series are somehow correlated in time, which will make it easier for the trend test to obtain a conclusion that the trend is significant at a presetting level, even if the original series have no trend (Storch, 1995). An iterative pre-whitening process which was originally proposed by Zhang et al. (2000) and later refined by Wang and Swail (2001) can effectively diminish the impact of the series correlation on trend estimate and the trend test. This algorithm has been widely used (Alexander et al., 2006) and can be easily performed through an open R package zyp (Bronaugh and Werner, 2019). Periodic fluctuation is a common form of hydrologic process evolution and an important manifestation of hydrologic variation. The wavelet analysis (Kumar and Foufoula-Georgiou, 1993; Venugopal and Foufoula-Georgiou, 1996) is the commonly used periodicity identification analysis methods. The Morlet and Mexican Hat wavelet transforms are two kinds of the most popularly used continuous wavelet transforms (CWT) in revealing period properties of meteorological and hydrological signals (Mallat, 1989; Daubechies and Bates, 1993; Torrence and Compo, 1998).
In this study, a Theil–Sen slope estimator (Sen, 1968), and the pre-whitening approaches of Zhang et al. (2000), Wang and Swail (2001), and Yue et al. (2002) were used for trend analysis; the penalized maximal F test was used to detect the abrupt change point since there are no reference series (Wang, 2003; Wang, 2008a; Wang, 2008b); the Morlet wavelet transform was used to recognize the main period (Zhang et al., 2006; Zhang et al., 2010; Yu et al., 2012).
Each typical flood process is defined by the flows at n moments. The typical flood process of a given year (i) can be described as Eq. 1.
The initial time of the selected typical flood process is defined as the occurrence time of the first trough before the annual maximum peak discharge. According to the book “the Heavy Flood in China—a Brief Description of Disastrous Floods” (Luo and Le, 1996), the duration of the flood process is intercepted to make it as long as 30 days, namely,
The 12 evaluation indicators are concluded in Table 2, most of which have a clear meaning, except the rates of rising and recession limbs and the uniformity.
(1) The flood duration is divided, and the corresponding flood volume is calculated as
(2) The percentage of the flood volume in the total flood volume is calculated as Eq. 2.
(3) The information entropy of the typical flood process is calculated as Eq. 3.
(4) The uniformity of the typical flood process is defined as the ratio of the actual entropy value to the maximum entropy value, as is shown in Eq. 4.
The uniformity of the flood process can be represented by entropy. The higher the entropy value, the more dispersed the distribution of flood volume, which further indicates that the difference of flood volume in different time periods is smaller and that the flood process is more uniform. The absolute uniform state of the flood process means that the flood volume in each period is the same, when
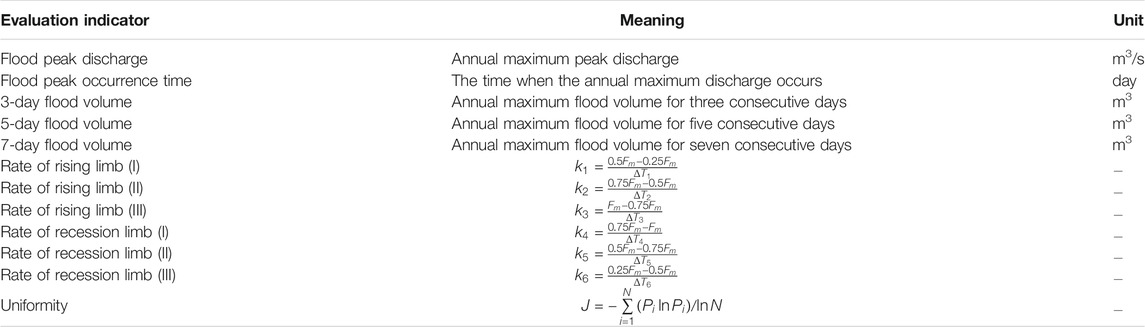
TABLE 2. Meanings of evaluation indicators extracted from the annual typical flood event.
The Yichang hydrometric station located at the outlet of the upper Yangtze basin was selected to visualize the results for analyzing the flood regime changes because of the availability of long-term daily discharge data from 1882 to 2020, which can provide sufficient information as far back from present to obtain the range of flood regime variation. The YC hydrometric station is merely 44 km downstream of the TGD, and the flood regime changes at this station provide a direct measurement of the impacts of the TGD. The analysis of the annual maximum flood peak discharge in YC is taken as an example. The non-stationarity analysis is carried out from three perspectives, that is, the trend, abrupt change, and periodicity.
The Theil–Sen slope estimator, wavelet decomposition, and the pre-whitening approaches of Zhang et al. (2000), Wang and Swail (2001), and Yue et al. (2002) were used to determine trends of the corresponding time series of the evaluation indicators. The Theil–Sen slope estimator is −57.02 with the intercept of 161,682.46. The trend results obtained by the pre-whitening approaches are listed in Table 3 (refer to the package “zyp” written by Bronaugh and Werner, (2019)) for the meanings of the parameters. And the trend calculated by the pre-whitening approach of Yue et al. (2002) is consistent with the Theil–Sen slope estimator. It is concluded that the annual maximum peak discharge in the Yichang station presents a significant decreasing trend at the 0.05 level from the Table 3 and the Theil–Sen slope estimator value.
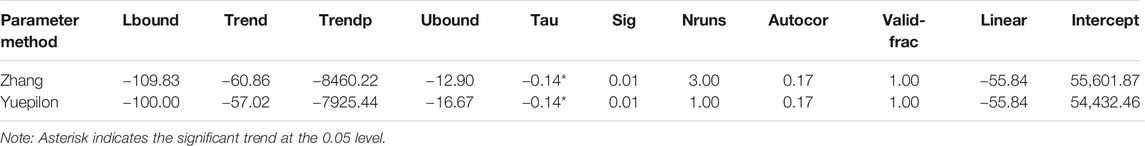
TABLE 3. The trend analysis results by the pre-whitening approaches.
The linear fitting line and curve of Morlet wavelet decomposition are shown in Figures 2, 3, respectively. The trend analyses of all the evaluation indicators time series at the six control hydrometric stations in the UYR are presented in Tables 4, 5.
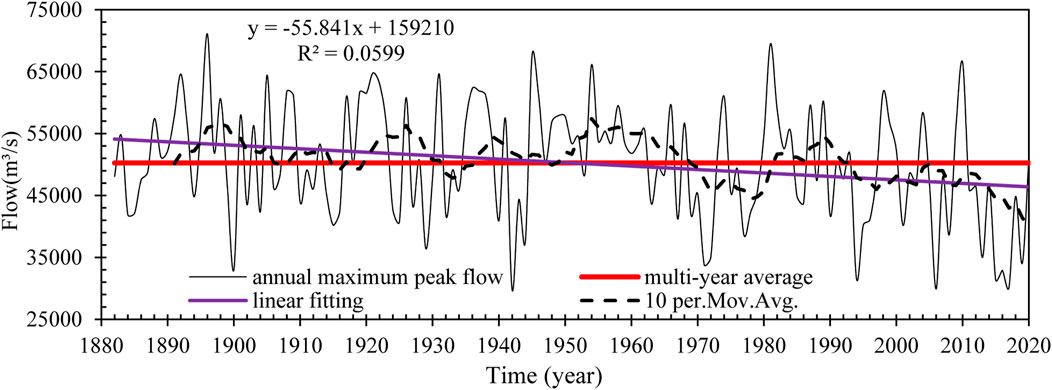
FIGURE 2. Curve of annual maximum flood peak discharge in YC.
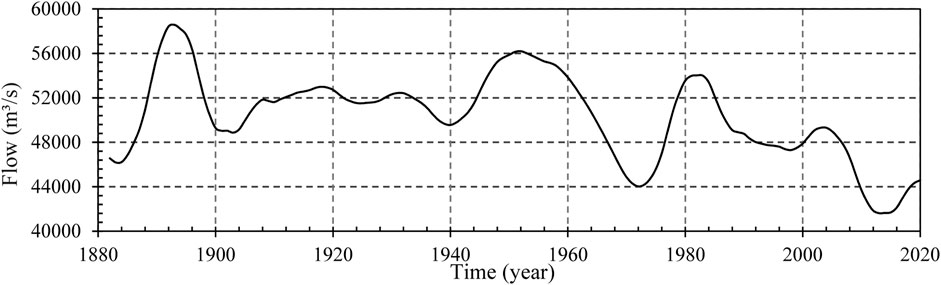
FIGURE 3. Curve of Morlet wavelet decomposition (A3) of the annual maximum flood peak discharge in YC.
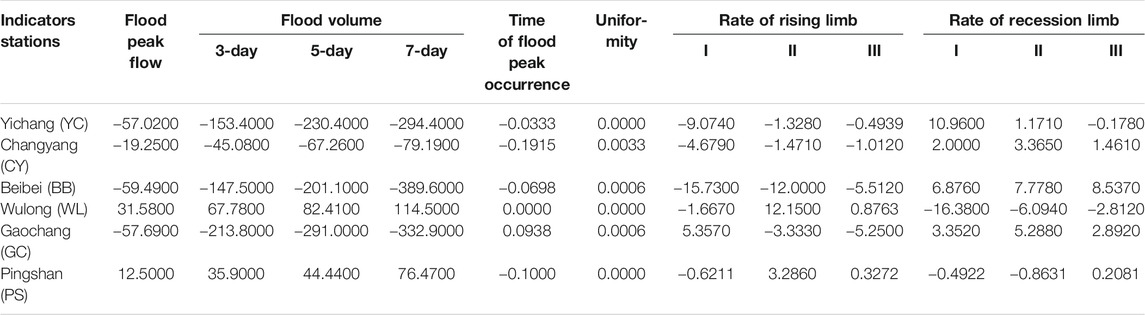
TABLE 4. The Theil–Sen slope estimator of evaluation indicators at the six stations in the UYR.
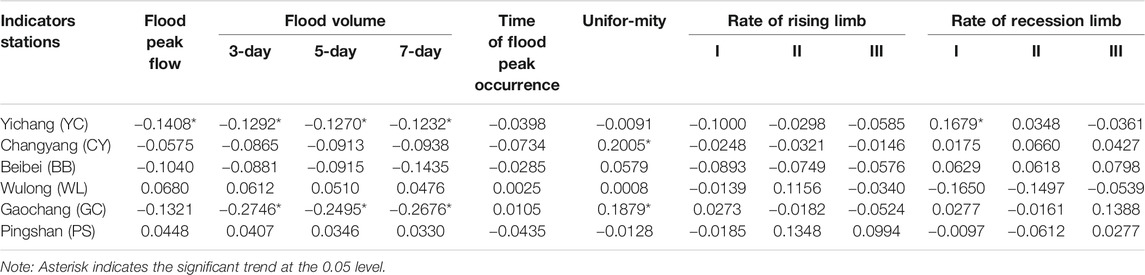
TABLE 5. Kendall’ tau statistic of evaluation indicators at the six stations in the UYR by zyp.zhang.
Figure 2 shows the linear fitting line, the line of the multiyear mean, and the 10-year moving average curve of the annual maximum peak discharge in YC. The decreasing trend and fluctuation are detected from the linear fitting line and the 10-year moving average curve, respectively. The multiyear mean of annual flood peak discharge is 50,264.91 m3/s. The maximum flood peak flow during the period from 1882 to 2011 occurred in 1896, with the value of 71,100 m3/s, while the minimum flood peak flow occurred in 1942, with the value of 29,800 m3/s. The linear fitting curve and the line of the multiyear mean intersected in the year of 1951, which means the multiyear average before 1951 was higher than 50,264.91 m3/s, while the multiyear average after 1951 was lower than 50,264.91 m3/s.
Figure 3 shows the wavelet decomposition (A3) graph of the time series of the annual maximum flood peak flow. There was a steep rise in 1889, and a steep fall in 1897, then a relatively flat change during 1900–1940, and a drastic change during 1940–1980. After 1980, there were two clear phases with a decreasing trend, namely, 1980–2000 and 2000–2020.
From Tables 4, 5, it can be seen that the annual maximum flood peak flow and flood volume in YC, CY, BB, and GC showed a decreasing trend, with a significant decrease in flood volume of YC and GC, while those in WL and PS showed an increasing trend. The flood peak occurrence time showed an insignificant forward (decreasing) trend, except for that in GC and WL. The uniformity of typical flood processes in YC and PS had an insignificant decreasing trend, while that of other stations in the four tributaries had an increasing trend, and a significant increasing trend in CY and GC at the significance level of 5%. There are 18 evaluation indicators of the rate of rising limb for typical flood processes in the six stations: 77.8% of which showed a decreasing trend, while 61.1% of evaluation indicators of rates of recession limb showed an increasing trend. It reflects that the flood events in the UYR are getting gradually uniform from the perspective of local fluctuation of the typical flood processes.
The penalized maximal F test allows the time series being tested to have a linear trend throughout the whole period of data record, with the annual cycle, linear trend, and lag-1 autocorrelation of the base series being estimated in tandem through iterative procedures, while accounting for all the identified mean shifts. No reference series will be used in functions including the FindU and Stepsize of PMF, according to Wang and Feng (2013). As for the annual maximum peak discharge time series of Yichang station, there are no Type-1 change points when the FindU function was called. From Table 6, we can know that the change points of the annual flood peak flow time series in BB and PS happened in 1989 and 1974, respectively, while no change points exist in other four stations; all the change points of flood volume (3-day; 5-day; and 7-day) time series in the six stations happened in 1970s–1990s; the change points of uniformity happened in 1980s–1990s, except for that in GC and PS; and the most change points of rates of rising and recession limb happened in 1960s–1990s.
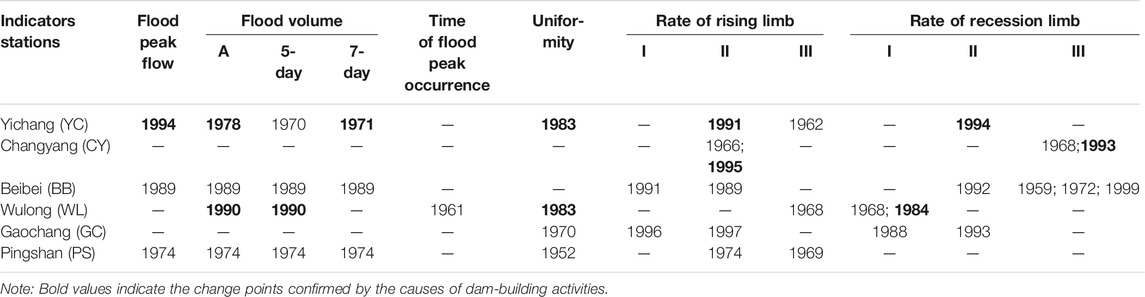
TABLE 6. List of abrupt change points of evaluation indicators at the six stations in the UYR by PMF.
The upper reaches of the Yangtze River are the most highly developed water system in China. Numerous large- and medium-sized reservoirs have been constructed along the upper reaches of the Yangtze River since 1970, forming the world’s largest reservoir group with the Three Gorges reservoir at its core. Here, we list the commencement and completion time of 16 key water conservancy projects closely related to the six control hydrometric stations in the mainstream of the Yangtze River and other five tributaries, as described in Table 7, and we draw the general graph of the location of these projects, as shown in Figure 4. All the documented changes in Table 7 that could cause a mean shift to be added in the file named Example_mCs.txt if they are not already here according to procedure 5) and procedure 7) of Trend Analysis and F5 of Periodicity Analysis in the RHtestsV4_UserManual. We found that 1994 (commencement time of the TGD) for flood peak flow in the Yichang station, and 1983 (completion time of Wujiangdu) for uniformity in Wulong station are the potential Type-0 change points which are statistically significant, and these two change points have been added in Table 6.
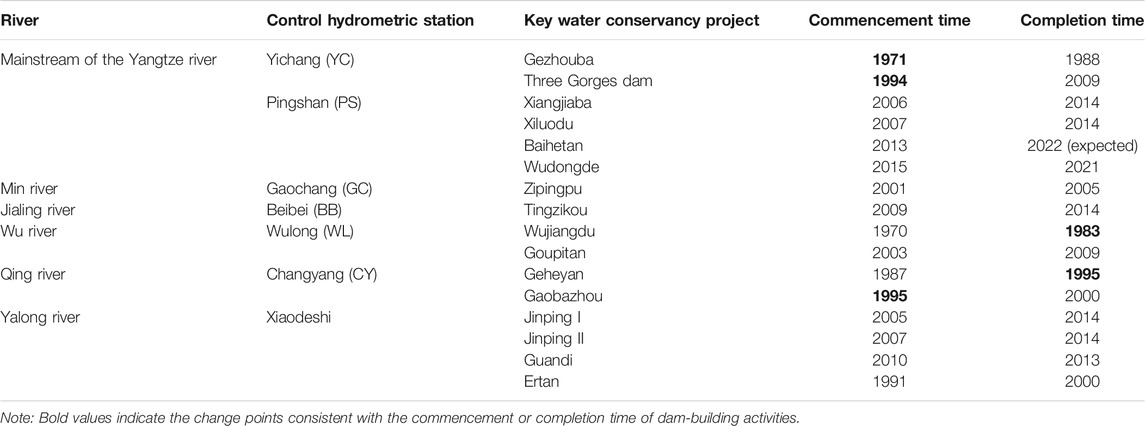
TABLE 7. The commencement and completion time of key water conservancy projects in the upper Yangtze River.
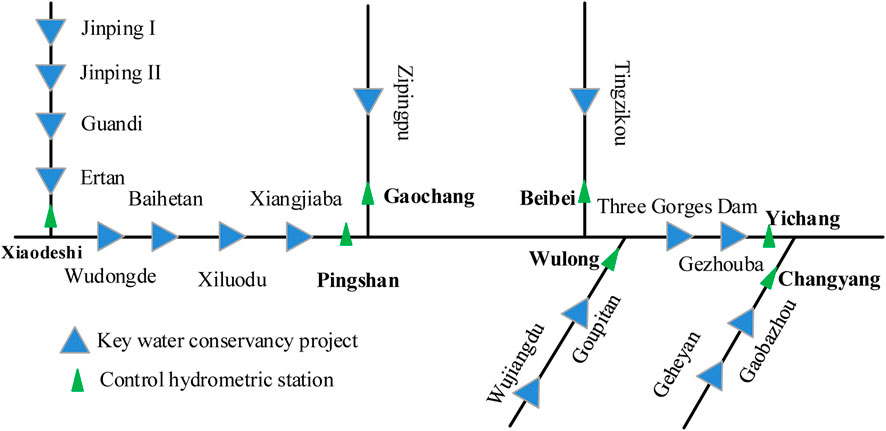
FIGURE 4. The general graph of the key water conservancy project location in the upper Yangtze River.
These reservoirs realize comprehensive utilization benefits by changing the spatial and temporal distribution characteristics of the natural streamflow, and transform flood regimes directly. For example, the construction of the TGD and the Gezhouba hydropower station in mainstream of the Yangtze River caused the abrupt change of the 5-day and 7-day flood volume, and the rate of recession limb (II) of Yichang station; the construction of Gaobazhou hydropower station in the Qing River caused the abrupt change of the rate of rising limb (II) of Changyang station, and the construction of Wujiangdu hydropower station corresponding to the change of rate of recession (I) in the Wulong station. In conclusion, the change points of flood peak discharge, 3-day flood volume, 7-day flood volume, uniformity, the rate of rising limb (II) and the rate of recession limb (II) in YC, the rate of rising limb (II) and the rate of recession limb (III) in CY, and 3-day flood volume, 5-day flood volume, uniformity, and the rate of recession limb (I) in WL are confirmed by the causes of dam-building activities listed in Table 7, which happened during or after the construction of corresponding water conservancy project; and the change points of the flood peak discharge, 7-day flood volume, the rate of recession limb (II) in YC, the rate of rising limb (II) in CY, and the uniformity in WL are completely consistent with the commencement time of the TGD and Gezhouba, the commencement time of Gaobazhou, and the completion time of Wujiangdu, respectively.
Although the intensified dam-building activities directly affected the flood regime change, the influence of the precipitation structure change is also non-negligible, since the Min River, the Jialing River, and the Yalong River are located in the rainstorm area in western Sichuan. From Table 6, we can find that the abrupt change points of Pingshan, Gaochang, and Beibei are not consistent with the commencement or completion time of corresponding major water conservancy projects. The change of precipitation structure is the most obvious indicator of the variation of water cycle (Moberg et al., 2006; Brommer et al., 2007; Zolina et al., 2010), and precipitation in July and August over the upper reaches of the Yangtze River is highly correlated with annual peak discharge (Li et al., 2020). Two abrupt climate change points of summer precipitation in China that occurred in 1978 and 1992 were identified by Ding et al. (2008), and the shift of the summer rainfall over the Yangtze River valley in the late 1970s was also identified (Gong and Ho, 2002; Gao and Xie, 2016). In addition, Ye et al. (2014) analyzed the spatiotemporal variability characteristics of precipitation structure across the upper reaches of the Yangtze River and found that the year of 1976 was marked by an abrupt change for the contribution rate of short-duration (1 and 2 days) precipitation events, while the timing of abrupt changes for the occurrence rate and the contribution rate of long duration (6 and 10 days) was in 1984 and 1999, respectively, all of which happened during 1970s–1990s and were consistent with the abrupt change points of Pingshan, Gaochang, and Beibei. Therefore, it can be concluded that the abrupt change points of Yichang, Changyang, and Wulong during 1970s–1990s are mainly caused by the dam-building activities, while those in Pingshan, Gaochang, and Beibei are mainly caused by the precipitation change in the late 1970s across the Yangtze River Basin, especially in the rainstorm area in western Sichuan.
The periodicity of all evaluation indicators was analyzed according to the Morlet wavelet transformation. The real part of the wavelet transform coefficient contains the information of the signal distribution and phase along the time axis under certain time scale. In the contour map of the real part of the wavelet coefficient, the positive value indicates that the annual maximum flood peak presents an increasing trend, while the negative value indicates that the annual maximum flood peak presents a decreasing trend. The modulus of the wavelet coefficient is equivalent to the wavelet energy spectrum, from which the oscillation energy of different scales (period) can be analyzed. When the modulus is larger, the periodicity of the corresponding time and scale is more obvious.
In regard to the annual peak-flood series in YC, the contour plot of the real part and modulus of the wavelet transformation coefficients and the global power spectrum are shown in Figures 5A–C, respectively. The periodicity analysis results of all evaluation indicators are concluded in Table 8.
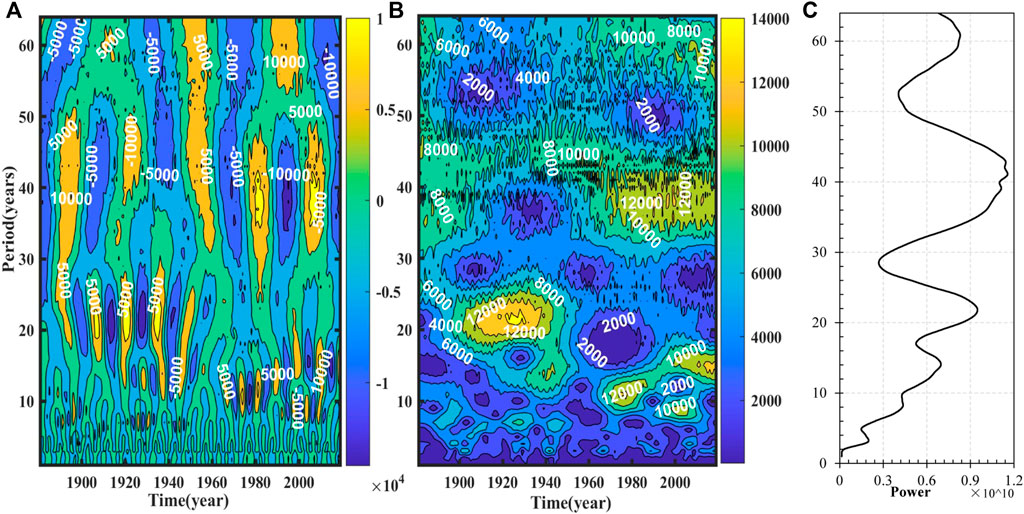
FIGURE 5. Contour plots of the real part (A), the modulus (B), and the global power spectrum (C) of Morlet wavelet transform coefficients.
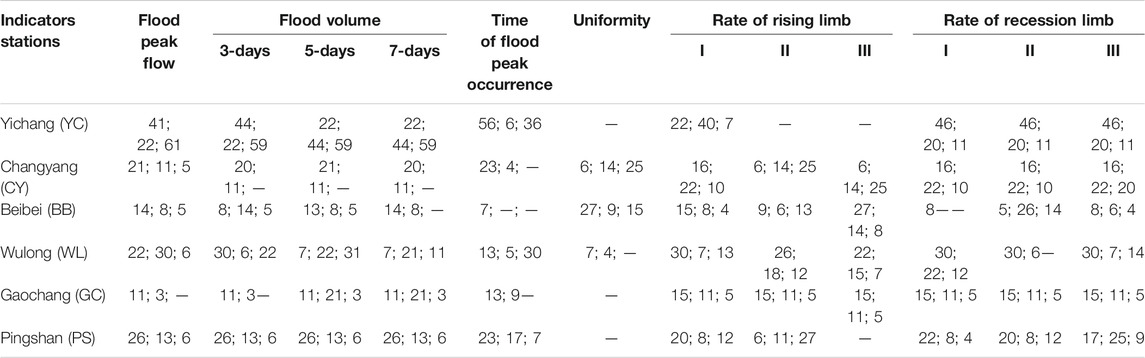
TABLE 8. Periodicity analysis of evaluation indicators at the six stations in the UYR.
For Figures 5A–C, the Y-coordinate represents period, while the X-coordinate represents time in (A) and (B) and power in (C), respectively. The positive value and the negative value in Figure 5A indicate that the annual maximum flood peak presents an increasing trend and a decreasing trend, respectively. And the modulus in Figure 5B represents the intensity of the periodicity: the larger the modulus, the stronger the periodicity.
It can be seen from Figure 5A that there were four clear periodicities of annual maximum flood peak flow time series in YC during the period from 1892 to 2020, which were 14a, 22a, 41a, and 61a, respectively. The periodicity of 41a existed throughout the whole study period with relatively stable performance, while 22a mainly existed from 1880s to 1960s, and 14a mainly existed from 1960s to 2020s. It can be seen from Figure 5B that the wavelet coefficient modulus corresponding to the periodicity of 41a is the largest, so the periodicity is the strongest, followed by 22a, as shown in Figure 5C.
From Table 8, we can know that the first main periodicity of most evaluation indicators in Y was about 45a. The first main periodicity of annual maximum flood peak time and flood volume series in CY was about 21a; the first main periodicity of the flood peak occurrence time and uniformity, and most rates of rising and recession limb were 23a, 6a, and 16a, respectively. The first main period of all evaluation indicators in BB and WL varied obviously, while that in GC are mainly 11a and 15a, and that in PS are mainly 26a and 20a.
The “stationarity” of flood-generating mechanism is lost under the changing environment. Climate and human forcings combined have been imposed on the flood regimes in the upper Yangtze River. Ye et al. (2015) applied univariate and the multivariate Mann–Kendall method to test the stationarity of the annual peak discharge and annual maximum 15-day volume of four control hydrological stations in the UYR. Xiong and Guo (2004) carried out the trend test and change-point analysis of the annual maximum, annual minimum, and annual mean discharge series in Yichang station during the period of 1882–2001. Zhang et al. (2006) detected the trend and periodicity of the annual maximum water level and streamflow of Yichang, Hankou, and the Datong station across the Yangtze River Basin. Most of the research aforementioned found the decreasing trend of flood peak discharge and flood volume due to the intensified dam-building, yet the other characteristics of flood regime, such as the timing of flood peak occurrence (Bloschl et al., 2017; Rokaya et al., 2018) and uniformity (Chen et al., 2015), were ignored. To improve the understanding of the all-round flood regime change in the UYR, the non-stationarity analysis of hydrological series, including 12 evaluation indicators time series extracted from the annual typical flood event, was performed.
For trend analysis, the annual flood peak discharge and flood volume present a decreasing trend except Pingshan and Wulong, since the length of the two stations are 71 (1940–2010) and 50 (1952–2001), respectively. The Xiangjiaba and Xiluodu dams were not fully built, and the construction of the Baihetan and Wudongde dams were not started yet before 2010. The four reservoirs are located in the lower reaches of the Jinsha River, which have direct influence on the flood regime in Pingshan station. The reason for the increasing trend of annual peak discharge and flood volume is similar for Wulong station, since the key reservoirs in the lower reaches of the Wu River have not been constructed yet. And therefore, the uniformity of the two stations exhibited no obvious change during the corresponding study period.
For abrupt change analysis, the abrupt change of flood regimes in YC, CY, and WL is mainly caused by the dam-building activities, while that in PS, GC, and BB is mainly caused by the precipitation change in the late 1970s across the Yangtze River Basin, especially in the rainstorm area in western Sichuan. For periodicity analysis, the major period of the Yichang station is longer than that of other stations. As the controlling station of the upper Yangtze River, it has stronger regulatory capacity, while other stations are more prone to be influenced by the human activities and climate change.
To better understand the role of peak-flood clipping the TGD plays, we quantitatively evaluate the contribution of the climatic control factors and the TDG to the variation of the annual flood peak in Yichang station. According to the time at which the TDG-building activities commenced, the whole study period (1882–2020) was divided into two phases: the period before 1994 (defined as the “baseline period”) and the period after 1994 (defined as the “modern period”). Accordingly, the observed discharge was also divided into two types: the observed discharged during the baseline period and that during the modern period as shown in Figure 6. It is clear that the mean value of the annual peak discharge before and after the TGD construction is 51,571.4 m³/s and 44,845.3 m³/s, respectively, which shows the important role of peak-flood clipping the TGD plays.
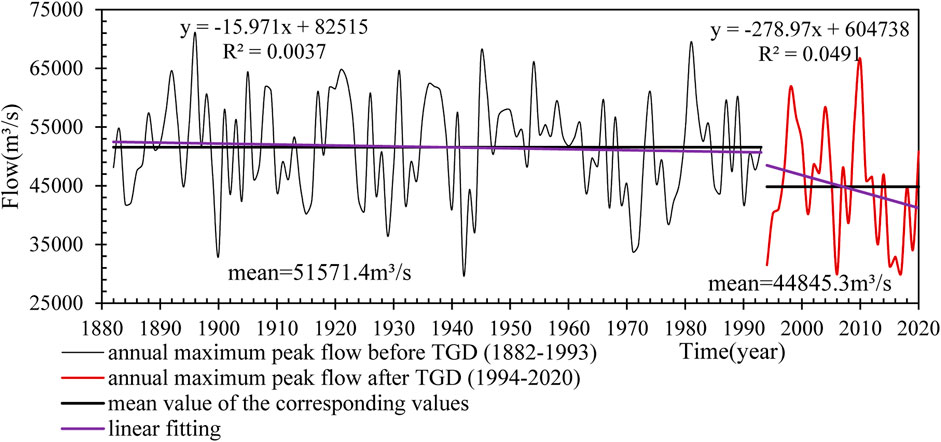
FIGURE 6. Variation of annual peak discharge before and after the Three Gorges Dam (TDG) construction.
To assess the effects of climatic control on flood peak discharge, the climate control factors need to be identified. The SSNs in March and the NAO in December were found to be highly correlated with annual peak discharges (Li et al., 2020). The SSNs in March during 1749–2020 and the North Atlantic Oscillation in December (1882–2020) are shown in Figures 7, 8, respectively. Over the nearly past 300 years, SSNs have exhibited an average 11-year cycle (Clette et al., 2014), while the NAO presents irregular oscillation without any obvious cycle (Gu et al., 2009).
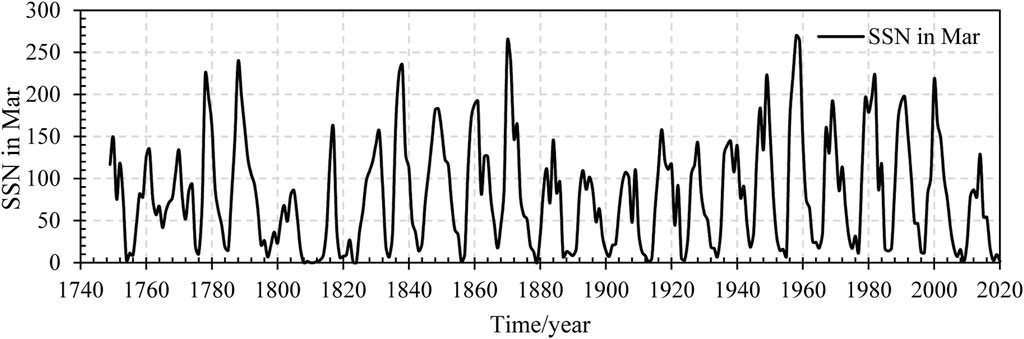
FIGURE 7. Sunspot numbers (SSNs) in March during 1749–2020.
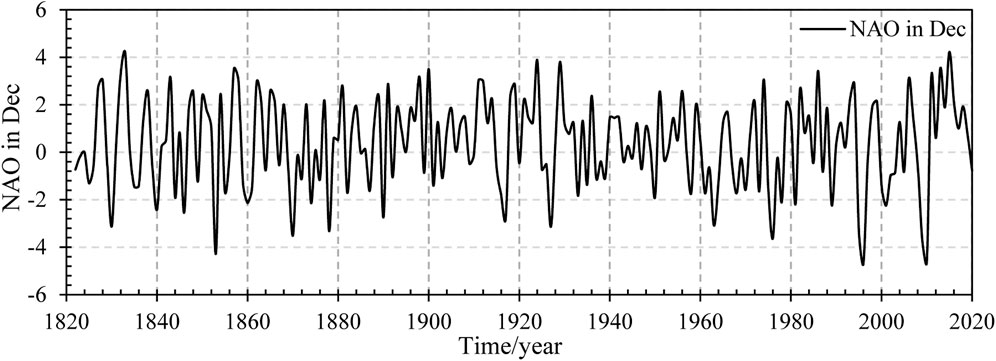
FIGURE 8. North Atlantic Oscillation (NAO) in December (1822–2020).
To separate the impacts of natural and human activities on the variation of the flood peak discharge, the reconstructed annual peak discharge during 1994–2020 was derived based on the back propagation neural network (BPNN) model, which was trained by the corresponding discharge, SSNs in March, NAO in December, and SSN–NAO, respectively (R2 = 0.69; 0.62; 0.57), as shown in Figure 9. In the absence of human activities, the SSN-only model predicts that Q10, Q100, Q1000, and Q10000 obtained by P-III fitting were 61,283.24; 74,061.72; 84,288.66; and 93,281.61 m³/s (in Table 9), respectively, accounting for approximately 56–83% of the observed decrease in discharge. This implies the remainder (approximately 17–44%) of the decline in flood magnitude is the result of the TGD construction. However, the results predicted by SSN–NAO (in Table 10) indicate that climatic controls and the TGD construction contribute − 53–44% and 56–153%, respectively. Therefore, the TGD construction has played a positive role in reducing flood magnitude with different recurrence intervals, especially for the flood with a 0.01% chance of exceedance in any year.
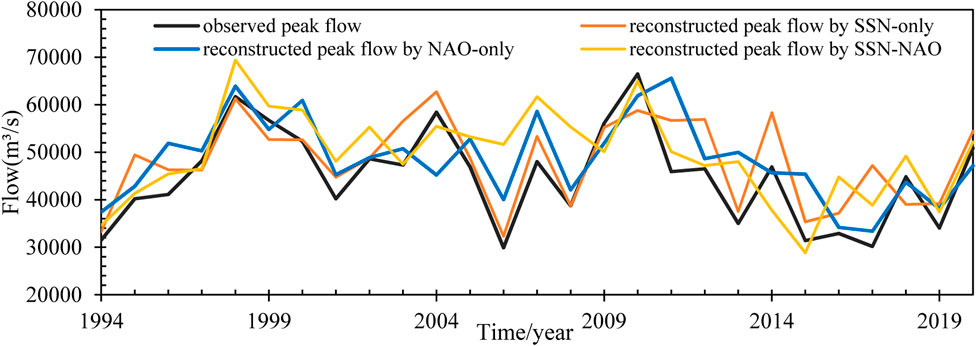
FIGURE 9. Reconstructed discharge through the BP neural network and observed discharge in the modern period.
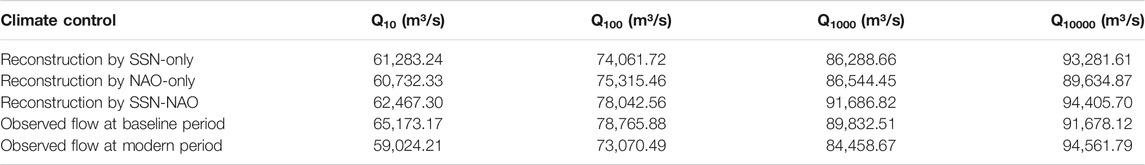
TABLE 9. Observed and reconstructed flood magnitudes with different recurrence intervals by the BP model after the construction of the TGD (1994–2020).
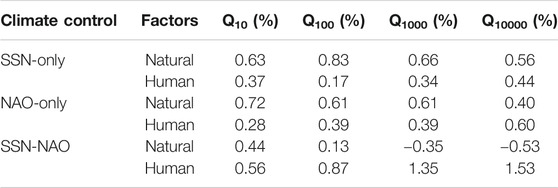
TABLE 10. Contributions of climatic control and human activities to floods with different recurrence intervals.
The original contributions presented in the study are included in the article, further inquiries can be directed to the corresponding author.
Conceptualization, review, and editing: GF, XW, and ZH; methodology, formal analysis, original draft preparation, and visualization: YZ; validation: ZD and XL; data curation and resources: XB, ZT, and HZ; supervision, funding acquisition, and project administration: GF and XW. All authors have read and agreed to the version of the manuscript.
The research was supported by the National Key Research and Development Program of China (2019YFE0105200 and 2018YFC0407902) and the National Natural Science Foundation of China (U1765201, 51909010, and 52079040).
Authors ZT and HZ were employed by the company China Yangtze Power Co., Ltd., and XB was employed by the company Jiangsu Water Source Co., Ltd.
The remaining authors declare that the research was conducted in the absence of any commercial or financial relationships that could be construed as a potential conflict of interest.
Thanks are due to the Hydrological Office, Yangtze Water Resources Committee for providing the hydrologic data, and to Liu, S. Q. for her linguistic assistance during the preparation of this manuscript.
Akbari, S., and Reddy, M. J. (2020). Non-stationarity Analysis of Flood Flows Using Copula Based Change-point Detection Method: Application to Case Study of Godavari River basin. Sci. Total Environ. 718, 134894. doi:10.1016/j.scitotenv.2019.134894
Alexander, L. V., Zhang, X., Peterson, T. C., Caesar, J., Gleason, B., Klein Tank, A. M. G., et al. (2006). Global Observed Changes in Daily Climate Extremes of Temperature and Precipitation. J. Geophys. Res. 111, 111. doi:10.1029/2005JD006290
Bloschl, G., Hall, J., Parajka, J., Perdigão, R. A. P., Merz, B., Arheimer, B., et al. (2017). Changing Climate Shifts Timing of European Floods. Science 357, 588–590. doi:10.1126/science.aan2506
Bormann, H., Pinter, N., and Elfert, S. (2011). Hydrological Signatures of Flood Trends on German Rivers: Flood Frequencies, Flood Heights and Specific Stages. J. Hydrol. 404, 50–66. doi:10.1016/j.jhydrol.2011.04.019
Brommer, D. M., Cerveny, R. S., and Balling, R. C. (2007). Characteristics of Long-Duration Precipitation Events across the United States. Geophys. Res. Lett. 34, 34. doi:10.1029/2007gl031808
Bronaugh, D., and Werner, A. (2019). Zyp: Zhang + Yue Pilon Trends Package. Available at: https://cran.r-project.org/web/packages/zyp/index.html.
Chen, H. J., Xie, P., Xie, J. H., et al. (2015). Variation Analysis Method for Flood Process Homogeneity Based on the Information entropy:Taking the Flood Series of Longchuan Station in Dongjiang River Basin as an Example (In Chinese). J. Hydraulic Eng. [J] 46 (10), 1233–1239.
Chen, J., Wu, X., Finlayson, B. L., Webber, M., Wei, T., Li, M., et al. (2014). Variability and Trend in the Hydrology of the Yangtze River, China: Annual Precipitation and Runoff. J. Hydrol. 513, 403–412. doi:10.1016/j.jhydrol.2014.03.044
Clette, F., Svalgaard, L., Vaquero, J. M., and Cliver, E. W. (2014). Revisiting the Sunspot Number. Space Sci. Rev. 186, 35–103. doi:10.1007/s11214-014-0074-2
Daubechies, I., and Bates, B. J. (1993). Ten Lectures on Wavelets. The J. Acoust. Soc. America 93, 1671. doi:10.1121/1.406784
Ding, Y., Wang, Z., and Sun, Y. (2008). Inter‐decadal Variation of the Summer Precipitation in East China and its Association with Decreasing Asian Summer monsoon.Part I: Observed Evidences. Int. J. Climatol. 28, 1139–1161. doi:10.1002/joc.1615
Fang, H., Han, D., He, G., and Chen, M. (2012). Flood Management Selections for the Yangtze River Midstream after the Three Gorges Project Operation. J. Hydrol. 432-433, 1–11. doi:10.1016/j.jhydrol.2012.01.042
Field, C. B., Barros, V., Stocker, T. F., et al. (2012). Managing the Risks of Extreme Events and Disasters to Advance Climate Change Adaptation. IPCC Special Report [M]. in IEEE Transactions on Automatic Control. Cambridge: Cambridge University Press, 582.
Gao, B., Yang, D., Zhao, T., and Yang, H. (2012). Changes in the Eco-Flow Metrics of the Upper Yangtze River from 1961 to 2008. J. Hydrol. 448-449, 30–38. doi:10.1016/j.jhydrol.2012.03.045
Gao, T., and Xie, L. (2016). Spatiotemporal Changes in Precipitation Extremes over Yangtze River basin, China, Considering the Rainfall Shift in the Late 1970s. Glob. Planet. Change 147, 106–124. doi:10.1016/j.gloplacha.2016.10.016
Gong, D.-Y., and Ho, C.-H. (2002). Shift in the Summer Rainfall over the Yangtze River valley in the Late 1970s. Geophys. Res. Lett. 29, 78–81. doi:10.1029/2001gl014523
Gu, W., Li, C., Li, W., Zhou, W., and Chan, J. C. L. (2009). Interdecadal Unstationary Relationship between NAO and east China's Summer Precipitation Patterns. Geophys. Res. Lett. 36, 36. doi:10.1029/2009GL038843
Guo, L., Su, N., Zhu, C., and He, Q. (2018). How Have the River Discharges and Sediment Loads Changed in the Changjiang River basin Downstream of the Three Gorges Dam? J. Hydrol. 560, 259–274. doi:10.1016/j.jhydrol.2018.03.035
Jiang, T., Su, B., and Hartmann, H. (2007). Temporal and Spatial Trends of Precipitation and River Flow in the Yangtze River Basin, 1961-2000. Geomorphology 85, 143–154. doi:10.1016/j.geomorph.2006.03.015
Kumar, P., and Foufoula-Georgiou, E. (1993). A Multicomponent Decomposition of Spatial Rainfall fields: 1. Segregation of Large- and Small-Scale Features Using Wavelet Transforms. Water Resour. Res. 29, 2515–2532. doi:10.1029/93WR00548
Li, H., Liu, P., Guo, S., Cheng, L., and Yin, J. (2020). Climatic Control of Upper Yangtze River Flood hazard Diminished by Reservoir Groups. Environ. Res. Lett. 15, 124013. doi:10.1088/1748-9326/abc4fe
Li, S. F., Yu, P., and Sun, S. H. (2012). Flood Flow Processes Variation and Influencing Factors in Zijingguan Watershed (In Chinese). Eng. J. Wuhan Univ. [J] 45 (2), 166–170.
Luo, C. Z., and Le, J. X. (1996). The Heavy Flood in China - a Brief Description of Disastrous Floods [M]. Cathay Bookshop. doi:10.1142/9789814447195_0001
Mallat, S. G. (1989). A Theory for Multiresolution Signal Decomposition: the Wavelet Representation. IEEE Trans. Pattern Anal. Machine Intell. 11, 674–693. doi:10.1109/34.192463
Mann, H. B. (1945). Nonparametric Tests against Trend. Econometrica 13, 245–259. doi:10.2307/1907187
Milly, P. C. D., Betancourt, J., Falkenmark, M., Hirsch, R. M., Kundzewicz, Z. W., Lettenmaier, D. P., et al. (2008). Stationarity Is Dead: Whither Water Management? Science 319, 573–574. doi:10.1126/science.1151915
Moberg, A., Jones, P. D., Lister, D., Walther, A., Brunet, M., Jacobeit, J., et al. (2006). Indices for Daily Temperature and Precipitation Extremes in Europe Analyzed for the Period 1901-2000. J. Geophys. Res. 111, 111. doi:10.1029/2006JD007103
Munoz, S. E., Giosan, L., Therrell, M. D., Remo, J. W. F., Shen, Z., Sullivan, R. M., et al. (2018). Climatic Control of Mississippi River Flood hazard Amplified by River Engineering. Nature 556, 95–98. doi:10.1038/nature26145
Rokaya, P., Budhathoki, S., and Lindenschmidt, K.-E. (2018). Trends in the Timing and Magnitude of Ice-Jam Floods in Canada. Sci. Rep. 8, 5834. doi:10.1038/s41598-018-24057-z
Salas, J. D., Delleur, J. W., and Yevjevich, V. (1980). Applied Modeling of Hydrologic Time Series[M]. Littleton: Colorado and Water Resources Publications.
Sen, P. K. (1968). Estimates of the Regression Coefficient Based on Kendall's Tau. J. Am. Stat. Assoc. 63 (324), 1379–1389. doi:10.1080/01621459.1968.10480934
Slater, L. J., and Wilby, R. L. (2017). Measuring the Changing Pulse of Rivers. Science 357, 552. doi:10.1126/science.aao2441
Storch, H. V. (1995). “Misuses of Statistical Analysis in Climate [M].“ in Analysis of Climate Variability, Berlin Heidelberg: Springer.
Torrence, C., and Compo, G. P. (1998). A Practical Guide to Wavelet Analysis. Bull. Amer. Meteorol. Soc. 79, 61–78. doi:10.1175/1520-0477(1998)079<0061:apgtwa>2.0.co;2
Venugopal, V., and Foufoula-Georgiou, E. (1996). Energy Decomposition of Rainfall in the Time-Frequency-Scale Domain Using Wavelet Packets. J. Hydrol. 187, 3–27. doi:10.1016/s0022-1694(96)03084-3
Wang, X. L. (2008a). Accounting for Autocorrelation in Detecting Mean Shifts in Climate Data Series Using the Penalized Maximal T or F Test. J. Appl. Meteorology Climatology [J] 47, 2423–2444. doi:10.1175/2008jamc1741.1
Wang, X. L. (2003). Comments on "Detection of Undocumented Changepoints: A Revision of the Two-phase Regression Model". J. Clim. 16, 3383–3385. doi:10.1175/1520-0442(2003)016<3383:codouc>2.0.co;2
Wang, X. L., and Feng, Y. (2013). RHtestsV4 User Manual. Available at: https://github.com/ECCC-CDAS/RHtests.
Wang, X. L. (2008b). Penalized Maximal F Test for Detecting Undocumented Mean Shift without Trend Change. J. Atmos. Oceanic Technology [J] 25, 368–384. doi:10.1175/2007jtecha982.1
Wang, X. L., and Swail, V. R. (2001). Changes of Extreme Wave Heights in Northern Hemisphere Oceans and Related Atmospheric Circulation Regimes. J. Clim. 14, 2204–2221. doi:10.1175/1520-0442(2001)014<2204:coewhi>2.0.co;2
Wei, W., Chang, Y., and Dai, Z. (2014). Streamflow Changes of the Changjiang (Yangtze) River in the Recent 60 years: Impacts of the East Asian Summer Monsoon, ENSO, and Human Activities. Quat. Int. 336, 98–107. doi:10.1016/j.quaint.2013.10.064
Xiong, L., and Guo, S. (2004). Trend test and change-point detection for the annual discharge series of the Yangtze River at the Yichang hydrological station/Test de tendance et détection de rupture appliqués aux séries de débit annuel du fleuve Yangtze à la station hydrologique de Yichang. Hydrological Sci. J. 49, 99–112. doi:10.1623/hysj.49.1.99.53998
Yang, S. L., Xu, K. H., Milliman, J. D., Yang, H. F., and Wu, C. S. (2015). Decline of Yangtze River Water and Sediment Discharge: Impact from Natural and Anthropogenic Changes. Sci. Rep. 5, 12581. doi:10.1038/srep12581
Yao, Y. H., Zhang, B. P., Ma, X. D., et al. (2006). Large-scale Hydroelectric Projects and Mountain Development on the Upper Yangtze River. Mountain Res. Development [J] 26, 109–114. doi:10.1659/0276-4741(2006)26[109:LHPAMD]2.0.CO;2
Ye, L., Zhou, J., Zeng, X., and Tayyab, M. (2015). Hydrological Mann-Kendal Multivariate Trends Analysis in the Upper Yangtze River Basin. J. Geo. Environ. Prot. 3, 34–39. doi:10.4236/gep.2015.310006
Ye, Y. T., Liang, L. L., Gong, J. G., et al. (2014). Spatial-temporal Evolution of Precipitation Structure in the Upper Reaches of the Yangtze River Basin (In Chinese). Adv. Water Sci. [J] 25 (2), 164–171.
Yu, S.-P., Yang, J.-S., Liu, G.-M., Yao, R.-J., and Wang, X.-P. (2012). Multiple Time Scale Characteristics of Rainfall and its Impact on Soil Salinization in the Typical Easily Salinized Area in Huang-Huai-Hai Plain, China. Stoch Environ. Res. Risk Assess. 26, 983–992. doi:10.1007/s00477-012-0557-1
Yue, S., Pilon, P., Phinney, B., and Cavadias, G. (2002). The Influence of Autocorrelation on the Ability to Detect Trend in Hydrological Series. Hydrol. Process. 16, 1807–1829. doi:10.1002/hyp.1095
Zhang, Q., Liu, C., Xu, C.-Y., Xu, Y., and Jiang, T. (2006). Observed Trends of Annual Maximum Water Level and Streamflow during Past 130 Years in the Yangtze River basin, China. J. Hydrol. 324, 255–265. doi:10.1016/j.jhydrol.2005.09.023
Zhang, Q., Xu, C.-Y., and Chen, Y. D. (2010). Wavelet-based Characterization of Water Level Behaviors in the Pearl River Estuary, China. Stoch Environ. Res. Risk Assess. 24, 81–92. doi:10.1007/s00477-008-0302-y
Zhang, X., Vincent, L. A., Hogg, W. D., and Niitsoo, A. (2000). Temperature and Precipitation Trends in Canada during the 20th century. Atmosphere-Ocean 38, 395–429. doi:10.1080/07055900.2000.9649654
Keywords: flood regime, evaluation indicators, temporal trend, change point, periodicity, the upper Yangtze River
Citation: Zhang Y, Fang G, Tang Z, Wen X, Zhang H, Ding Z, Li X, Bian X and Hu Z (2021) Changes in Flood Regime of the Upper Yangtze River. Front. Earth Sci. 9:650882. doi: 10.3389/feart.2021.650882
Received: 08 January 2021; Accepted: 10 May 2021;
Published: 02 June 2021.
Edited by:
Xiaolan L. Wang, Environment and Climate Change, CanadaReviewed by:
Panfeng Zhang, Jilin Normal University, ChinaCopyright © 2021 Zhang, Fang, Tang, Wen, Zhang, Ding, Li, Bian and Hu. This is an open-access article distributed under the terms of the Creative Commons Attribution License (CC BY). The use, distribution or reproduction in other forums is permitted, provided the original author(s) and the copyright owner(s) are credited and that the original publication in this journal is cited, in accordance with accepted academic practice. No use, distribution or reproduction is permitted which does not comply with these terms.
*Correspondence: Guohua Fang, aGh1ZmdoQDE2My5jb20=
Disclaimer: All claims expressed in this article are solely those of the authors and do not necessarily represent those of their affiliated organizations, or those of the publisher, the editors and the reviewers. Any product that may be evaluated in this article or claim that may be made by its manufacturer is not guaranteed or endorsed by the publisher.
Research integrity at Frontiers
Learn more about the work of our research integrity team to safeguard the quality of each article we publish.