
95% of researchers rate our articles as excellent or good
Learn more about the work of our research integrity team to safeguard the quality of each article we publish.
Find out more
ORIGINAL RESEARCH article
Front. Earth Sci. , 21 July 2021
Sec. Biogeoscience
Volume 9 - 2021 | https://doi.org/10.3389/feart.2021.650662
This article is part of the Research Topic Observing, Modeling and Understanding Processes in Natural and Managed Peatlands View all 17 articles
 James W. McLaughlin*
 Maara S. Packalen
Peatlands help regulate climate by sequestering (net removal) carbon from the atmosphere and storing it in plants and soils. However, as mean annual air temperature (MAAT) increases, peat carbon stocks may decrease. We conducted an in-depth synthesis of current knowledge about ecosystem controls on peatland carbon storage and fluxes to constrain the most influential parameters in probabilistic modelling of peat carbon sinks, such as Bayesian belief networks. Evaluated parameters included climate, carbon flux and mass, land cover, landscape position (defined here as elevation), fire records, and current and future climate scenarios for a 74,300 km2 landscape in the Hudson Bay Lowlands, Canada. The Bayesian belief network was constructed with four tiers: 1) exposure, expressed as MAAT, and the state variables of elevation and land cover; 2) sensitivity, expressed as ecosystem conditions relevant to peat carbon mass and its quality for decomposition, peat wetness, and fire; 3) carbon dioxide and methane fluxes and peat combustion; and 4) vulnerability of peat carbon sink strength under warmer MAAT. Simulations were conducted using current (−3.0 to 0.0°C), moderately warmer (0.1–4.0°C), and severely warmer (4.1–9.0°C) climate scenarios. Results from the severely warmer climate scenario projected an overall drying of peat, with approximately 20% reduction in the strong sink categories of net ecosystem exchange and peat carbon sink strength for the severely and, to a lesser degree, the moderately warmer climate scenarios relative to current MAAT. In the warmest temperature simulation, probability of methane emission decreased slightly and the probability of the strong peat carbon sink strength was 27% lower due to peat combustion. Our Bayesian belief network can assist land planners in decision-making for peatland-dominated landscapes, such as identifying high carbon storage areas and those projected to be at greatest risk of carbon loss due to climate change. Such areas may be designated, for example, as protected or reduced management intensity. The Bayesian belief network presented here is built on an in-depth knowledge synthesis to construct conditional probability tables, so is expected to apply to other peatland-dense jurisdictions by changing only elevation, peatland types, and MAAT.
Peatlands (40 cm or more of peat accumulation) supply many ecosystem functions that maintain values or provide services beneficial to people, such as climate regulation (Bonn et al., 2016). Many beneficial services in the boreal and subarctic regions center around the accumulation, storage, and decomposition of peat. For example, climate regulation by peatlands is partly a consequence of carbon (C) accumulation in peat over the millennia resulting from cold temperatures and wet soils (Gorham, 1991), herein referred to as peat C sink strength, and is the focus of this paper.
Conserving peat C sink strength is a relatively new concept in land use and climate adaptation planning and complicates both the development of planning tools and plan implementation. For example, McLaughlin and Webster (2014) showed peat depth, inception, and age represented long-term factors that influence total amount of peat C at a site, while long term rates of C accumulation (LORCA) represented peat C sink strength over millennia. Longer-term indicators were less likely to change in response to climate change than those with shorter (annual to decadal) C exchange timeframes (e.g., greenhouse gases; GHGs).
Greenhouse gas [i.e., carbon dioxide (CO2) and methane (CH4)] fluxes are commonly used indicators in peatland C reporting and monitoring programs (IPCC et al., 2014). Of the C indicators tested, however, GHG fluxes were the least useful for detecting changes in ecosystem conditions, primarily due to small sample sizes and highly variable data (McLaughlin and Webster, 2014). For example, in a synthesis of published research, Frolking et al. (2011) reported uncertainties up to 100% in GHG estimates for peatlands that varied by more than an order of magnitude. Also, the Canadian Model for Peatlands (CaMP) is being considered for peat C inventories to meet Canada’s commitments to the United Nations Framework on Climate Change (Bona et al., 2020). However, CaMP overestimated net ecosystem exchange (NEE) of fens by more than 100% relative to site measurements, which was attributed to poorly calibrated decomposition and net primary production coefficients (Bona et al., 2020). In contrast, Roulet et al. (2007) reported contemporary C balance (NEE + CH4 emission + DOC leaching) collected over 6 years was comparable to LORCA estimates at the Me Bleu Bog, Canada.
Peatland fires may contribute up to 23% of the direct C emissions in Canada (Zoltai et al., 1998; Turquety et al., 2007). While peat ignites at less than 30% moisture (water) content by weight, combustion and vertical or lateral burn expansion can be maintained at moisture contents ranging from 160 to nearly 500% (Chistjakov et al., 1983; Huang and Rein, 2015; Prat-Guitart et al., 2016). Critical thresholds to maintain future background peat moisture content were estimated to be about 25% more precipitation input when air temperatures were 3–4°C warmer than current conditions (Rouse, 1998).
Hydro-climate data, such as mean annual air temperature (MAAT), mean annual precipitation (MAP), and potential evapotranspiration (PET), have effectively explained peatland C sinks and sources at landscape (Beilman et al., 2009; Packalen et al., 2016) and site (Webster et al., 2013; Wu and Roulet, 2014) scales in boreal and sub-arctic regions. Webster et al. (2013) developed a regression equation using hydro-climate data to predict water table level (WTL) in open (i.e., rich and moderately rich) and treed (i.e., poor) fens. In that study, PET was a particularly important influence on WTL, with the latter linked to plant functional types.
Globally, land use planners are considering peat C sinks in large (thousands km−2) tracts of land, and frequently in combination with other ecological and human values (Bonn et al., 2016). Therefore, effective and efficient planning tools need to be scientifically credible, robust, easily applied to landscapes, and amenable to integration with other values of interest by planning teams. A Bayesian belief network (BBN) is a method that simplifies complex ecological processes into basic probabilities of occurrence that can support land use planning to minimize perceived risks to soils in the short and long term (Webster and McLaughlin, 2014). Bayesian belief networks are also amenable to different types of learning, for example, Indigenous social and cultural values, as well as technical based indicators for clean air, soil, and water.
The vulnerability assessment reported here was based on sensitivity and direction of change in peat C sink strength by way of alterations in net CO2 exchange between peatlands and the atmosphere (defined here as NEE), CH4 emission, and peat C combustion due to fire using future climate scenarios of the International Panel on Climate Change (IPCC et al., 2014). To construct conditional probability tables that informed the BBN, previously published data were synthesized and new data were analyzed pertaining to C flux and mass, land cover, elevation, fire records, and current and future climate scenarios.
Our conceptual model says geology has been the key driver of peat C sink strength in the Hudson Bay Lowlands throughout the Holocene (Packalen et al., 2014; Packalen et al., 2016). However, many poorly documented variables interactively affect peat C sink strength, impeding its use in land planning and policymaking. We grouped interactive variables into a hierarchical framework to conduct a landscape assessment of peat C sink strength (Figures 1,2). In the Hudson Bay Lowlands, glacial isostatic adjustment of the land during the last 6,000–8,000 years (Mid-Holocene) created elevational gradients that restricted water movement (Andrews and Peltier, 1976; Glaser et al., 2004). Resulting water inundation created anaerobic soils that favored peat initiation, development, and expansion throughout the Mid-Holocene (Hargan et al., 2015). Although a net CO2 sink during this timeframe, peatlands in the Hudson Bay Lowlands were net CH4 sources to the atmosphere, the effect of which has been an overall net C sink (Packalen and Finkelstein, 2014; Davies et al., 2021).
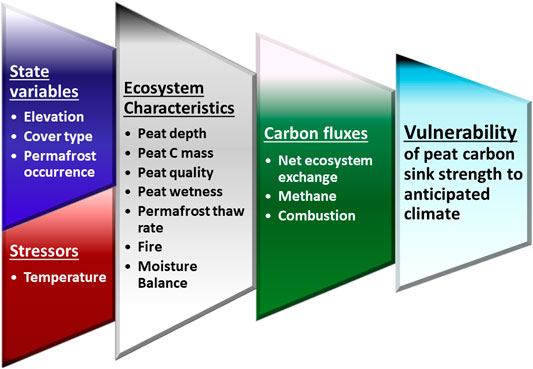
FIGURE 1. Conceptual framework used in this study to assess vulnerability of peatland carbon to climate change.
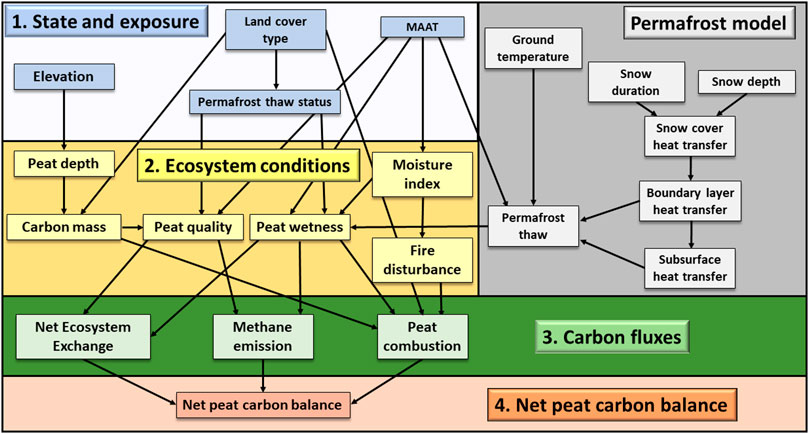
FIGURE 2. General structure of influence diagram of Bayesian belief network framework for the study area in the southern Hudson Bay Lowlands under current climate. Arrows connect parent nodes to child nodes and black bars indicate state (terminal parent nodes) or probability of influence based on conditional probabilities (child nodes).
During the Late Holocene MAAT warmed, but changes in MAP were marginal. Increasing MAAT and stable MAP contributes to drying conditions (i.e., lower moisture index; MAP/PET) as water demand of plants increases under warmer temperatures (Roulet et al., 1992; Rouse, 1998). Peat drying appears to be occurring faster in bogs than fens (Bunbury et al., 2012; O’Reilly et al., 2014). Furthermore, drier peat is released from anaerobic controls on litter and peat decomposition and replaced by mostly aerobic controls (Laiho, 2006). Elevated decomposition produces more CO2 that is released to the atmosphere (Preston et al., 2012), with the net balance dependent on ecosystem conditions (Figures 1,2). Furthermore, the amount and severity of fire may increase CO2 fluxes, while CH4 emissions will likely decrease as peat dries (Webster et al., 2018). Combined, higher C fluxes may weaken landscape scale peat C sink strength.
We expect glacial isostatic adjustment to remain the key control of peat C sink strength in future, with bogs drying more rapidly than fens (Bunbury et al., 2012; O’Reilly et al., 2014). Permafrost occurrence has also affected peat C sink strength, with NEE rates near neutrality (Table 1). Permafrost occurrence in the study area results primarily from presence of a combination of high elevation and forested or treed bogs (Ou et al., 2016B; Pironkova, 2017). However, collapsing peat and subsequent water inundation create anaerobic soil, enhancing both CH4 emissions and CO2 uptake in wetter and warmer peat in thermokarst in future years relative to non-thawed peat (Table 1).
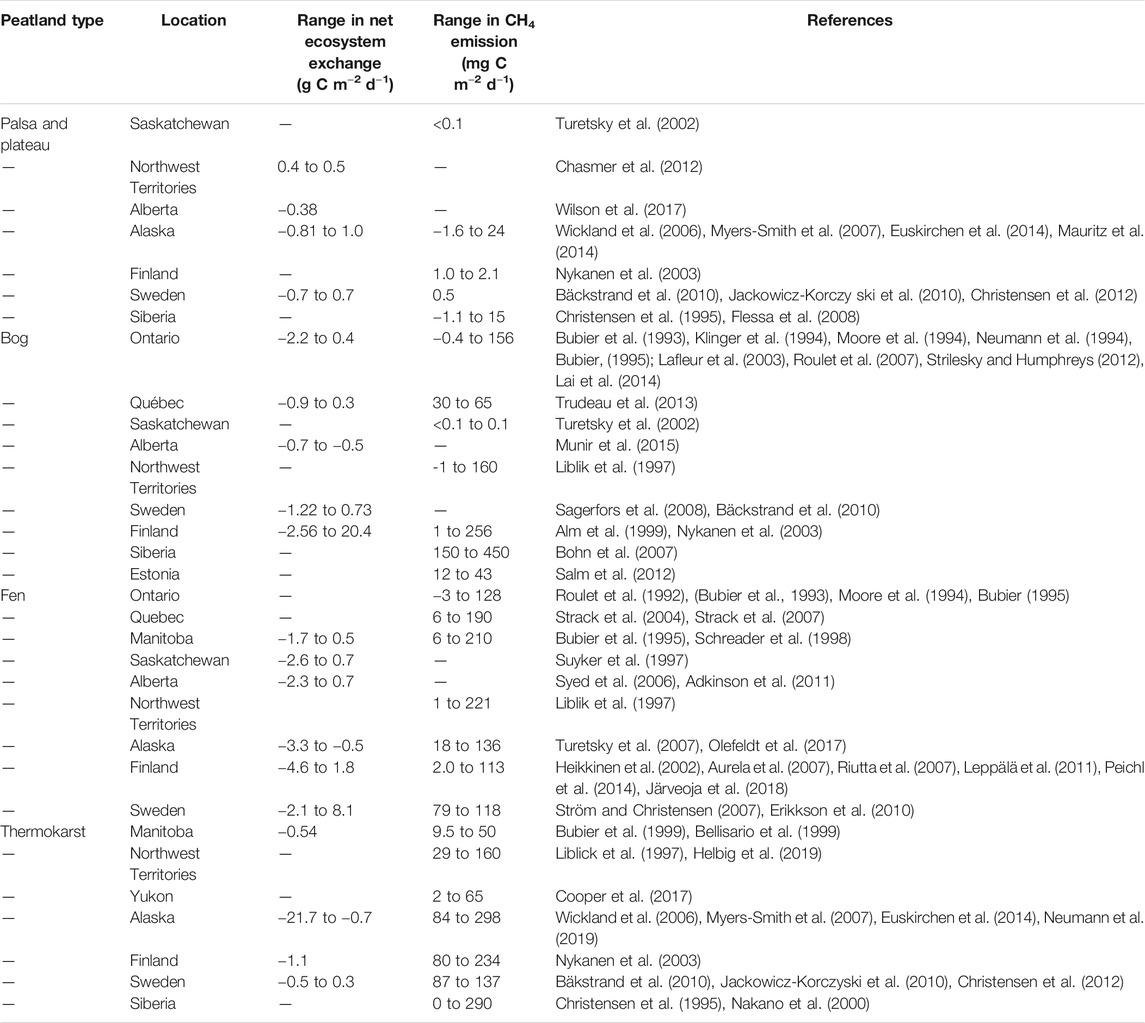
TABLE 1. Range in data for net ecosystem exchange and methane (CH4) emissions for peatlands north of 45⁰ latitude.
To test the conceptual model, we categorized a 74,300 km2 landscape in the southern Hudson Bay Lowlands (Figures 3A,B) by: 1) state variables of elevation, land cover and permafrost occurrence, and stressor variable of MAAT; 2) ecosystem condition was defined by peat depth, C mass, susceptibility to decomposition, wetness, moisture index, permafrost thaw, and fire, all of which depend on their respective state or stressor variables (Figures 1,2); 3) carbon fluxes defined by CO2 fluxes from NEE and peat combustion by fires, and CH4 emissions, all of which depend on ecosystem conditions; and 4) peat C sink strength, which depends on C fluxes. Data sources included climate scenarios, satellite imagery, field sampling, and literature syntheses to inform a probabilistic model known as a BBN to simulate probabilities of change in peat C sink strength for future years as a result of climate change. The power of the BBN lies in user-defined conditional probability tables. To construct these tables, previously published data were synthesized and analyzed pertaining to the state, stressors, ecosystem condition, and C fluxes (Figures 1,2) in peatlands. Simulations were conducted for three common land cover types in the Hudson Bay Lowlands—bog, fen, permafrost (defined here as palsa, peat plateau, internal lawn, or collapse scar) — to describe baseline and project future conditions using current (−3.0° to 0.0°C), moderately (0.1° to 4.0°C), and severely (4.1° to 9.0°C) warmer scenarios.
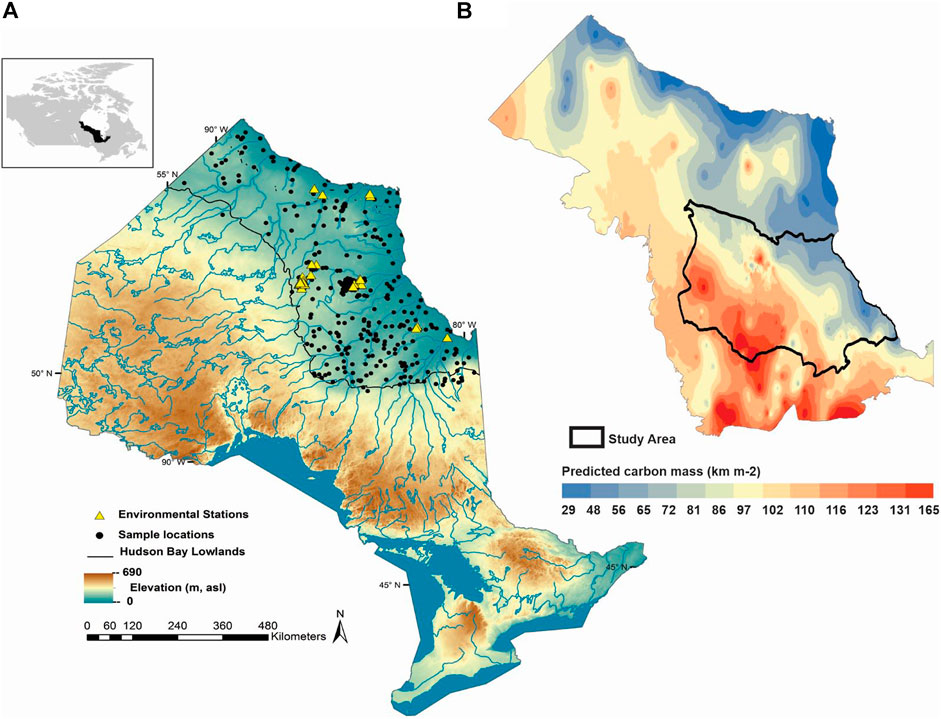
FIGURE 3. Location of study site in northern Ontario, Canada, and maps of (A) elevation and peat sampling points and (B) predicted peat carbon mass for Ontario’s portion of the Hudson Bay Lowlands (location indicated in insert) and the study area (outlined in black).
The vulnerability assessment was created using Netica (ver 5.18, Norsys Software Corp, 2014). Netica is a user-friendly software program that provides a framework to create probabilistic expert systems, known as BBN. The first tier contained the exposure and state variables. Tier 1 was parent node for the ecosystem conditions, which defined the sensitivity to changing MAAT in Tier 2. Ecosystem conditions were the parent nodes for C fluxes of NEE, CH4, and peat combustion (Tier 3), which in turn were parent nodes for peat C sink strength (Tier 4). Response of peat C sink strength was considered to reflect the peatlands’ vulnerability in the future. A previously published BBN for permafrost thaw in the Hudson Bay Lowlands (Webster and McLaughlin 2014) was adapted and linked to MAAT and peat wetness; all other nodes were retained as presented by Webster and McLaughlin (2014). Simulations also included a permafrost thaw effects node, which indirectly affected fens, but had no effect on bogs because they were considered to occur at high elevation when permafrost was present. Adding permafrost effects was necessary to constrain peat wetness in the absence of permafrost.
In the study area, permafrost features may span across bog, forest, or swamp land categories, and thermokarst features, such as internal lawns, may span across fen categories (Ontario Ministry of Natural Resources and Forestry, 2014). Additionally, small pools may cover much of peatland landscapes in the Hudson Bay Lowlands (McLaughlin and Webster, 20131). Pools may be derived from different processes, such as rapid elevational changes in peat surfaces caused by permafrost thawing or by gradual changes over thousands of years of peatland development.
We chose not to pursue detailed separation of bog/permafrost or fen/thermokarst because of the difficulties in separating those features in 30 m pixels. Furthermore, a goal is to provide land planners a peat C vulnerability assessment for large landscapes using currently available tools and data sets for large tracts of land in the Hudson Bay Lowlands. Therefore, and for the purpose of the current study, we assumed that thermokarst covered 6% of the fen area. Permafrost features in the study area occur on ombrotrophic peat deposits about 150–350 cm thick (Ou et al., 2016A) so we assigned a conservative estimate of 6% of the bogs to contain permafrost, although some palsas/peat plateaus are also classified as forests or swamps, which we assumed to be approximately 3% of those cover types. We recognize the importance of separating bog/permafrost and fen/thermokarst features from non-permafrost features, particularly when large tracts of land containing permafrost are considered in land use planning decisions. For example, and from a peat C perspective, NEE and CH4 emission may differ significantly between permafrost/thermokarst and non-permafrost features (Table 1).
Conditional probability tables have one probability for every possible combination of the parent nodes. To constrain the range of possible responses in a given child node, the number of parent nodes was restricted to four and the maximum number of conditions was generally restricted to three or four. In some cases, four conditions and four parent nodes were used to describe the probability distribution of a child node; however, resulting combinations that were not possible in nature were suppressed in the conditional probability tables (Webster and McLaughlin, 2014).
Data produced from the analyses described below were used to inform the range in conditions for MAAT, elevation, and land cover associated with each of the ecosystem conditions using the conditional probability tables. The number of responses ranged from a minimum of nine (three states and two parent nodes) to a maximum of 81 (three states and four parent nodes), with exceptions as noted above. Most conditional probability tables were symmetrical, meaning that when the responses of parent nodes were maximized, the probability value of the largest (strongest) condition was also maximized. For example, when C loss from NEE, CH4 emission, and peat C combustion is low, the probability of a strong peat C sink (child node) is maximized; the conditional probability table is symmetrical in that when the loss of C from each potential parent node is high, the probability of the child node being a peat C source is maximized.
We used the Shannon entropy [H(X)] (Equation 1) to calculate uncertainty in the BBN. Shannon entropy indicates the average information conveyed by data sources used to develop a BBN and H(X) values vary between 0 and 1, with high values indicating variables in the BBN requiring additional information to improve projections (Uusiitalo et al., 2015; Thomsen et al., 2016; Pagano et al., 2018).
We calculated H(X) for ecosystem conditions, C fluxes, and peat C sink strength to identify key variables requiring additional information. For example, the conditional probability table for C fluxes consisted of 27 combinations of NEE (strong sink, weak sink, source), C combustion (high, moderate, low), and CH4 emissions (high, moderate, low). Using knowledge obtained (as per methods described in subsequent sections below), we assigned probabilities of occurrence as 90, 7, and 3% for the conditions of NEE source, high peat combustion, and CH4 emission using Eq. 2. We then calculated the mean H(X) for C fluxes across the 27 combinations of NEE and CH4 emission, which resulted in a 29.1% uncertainty in the probability distribution of peat C sink strength, with minimum and maximum uncertainties of 26.3 and 72.5% across the 27 combinations of the C flux conditional probability tables. Mean H(X) values, as well as those for ecosystem conditions were ranked, with values > 30% uncertainty identified as the most uncertain. The H(X) values were then standardized relative to overall peat C sink strength to evaluate the cumulative uncertainty of ecosystem conditions and C fluxes relative to peat C sink strength.
uncertainty in the peat C sink strength.
Gridded contemporary climate data (Price et al., 2011) were used to examine the role of climate (Figures 3A,B) on ecosystem conditions, C fluxes, and peat C sink strength. Gridded climate data sets were generated in the ANUSPLINE climate model, which helps to interpolate verified North American hydro-climate station data using thin-plate smoothing splines to generate a continuous climate estimate (Price et al., 2011). Hydro-climate variables considered to describe baseline and future C processes and functions in this analysis were MAAT, MAP, and PET. Monthly PET values were provided by the Canadian Forest Service Natural Resources Canada and were based on incoming solar radiation calculated using a modified form of the Priestley and Taylor equation (Bonan, 1989). The method assumes soil heat flux is equal to zero when averaged over several days and that net radiant flux is proportional to solar irradiance (Rs) and air temperature (Ta) and is calculated as Ep = a∗(Ta + b): Rs where Ep is mean monthly PET (cal cm−2 day−1), Ta mean is the monthly air temperature (°C), Rs mean monthly solar radiation (cal cm−2 day−1), and a and b are empirically derived site constants defined by elevation (m) and saturation vapor pressures (mbar) at the mean maximum and mean minimum daily temperatures, respectively, of the warmest month of the year. A gridded moisture index was calculated as the ratio of MAP to PET (MAP:PET) across the study area. High MAP:PET values represent wet conditions while low MAP:PET values indicate dry conditions. Additional details were documented by Packalen et al. (2016).
Climate scenarios used in the IPCC’s Fifth Assessment Report (AR5)2 were denoted by representative concentration pathways (RCP); RCP4.5 and RCP8.5 were used in this study, representing lower and higher atmospheric CO2 concentrations, respectively (IPCC et al., 2014). Projections of future climate for the study area were produced for 2041–2070 and 2071–2,100, referred to as 2050s and 2080s, respectively. Climate data sets were obtained using the AR5 composite model adapted from Price et al. (2011). Current and projected gridded climate data for the study area were evaluated in ArcGIS (ESRI, 2011) and descriptive statistics (mean, standard deviation, minimum, maximum, and range) calculated for all available hydro-climate parameters.
The Ontario land cover classification (Ontario Ministry of Natural Resources and Forestry, 20143) involving satellite imagery of 1:50,000 to 1:100,000 images was used to classify wetlands in this study. Landsat 5-TM satellite imagery captured at 30 m pixel resolution was extracted from Land Information Ontario4 and land cover interpretations were consistent with data specifications for classification used by the Ontario Ministry of Natural Resources and Forestry, (2014).
Elevation in the study area the was extracted from the Ontario Digital Elevation Model (Figure 4A) obtained from Land Information Ontario (Ontario Ministry of Natural Resources and Forestry 2016). Coverage was sourced from 1 arc-second space-borne C-band Interferometric radar data, which was used to create the Ontario radar digital surface model data product, providing a 30 m resolution. Further details are provided by Ontario Ministry of Natural Resources and Forestry, (2016).
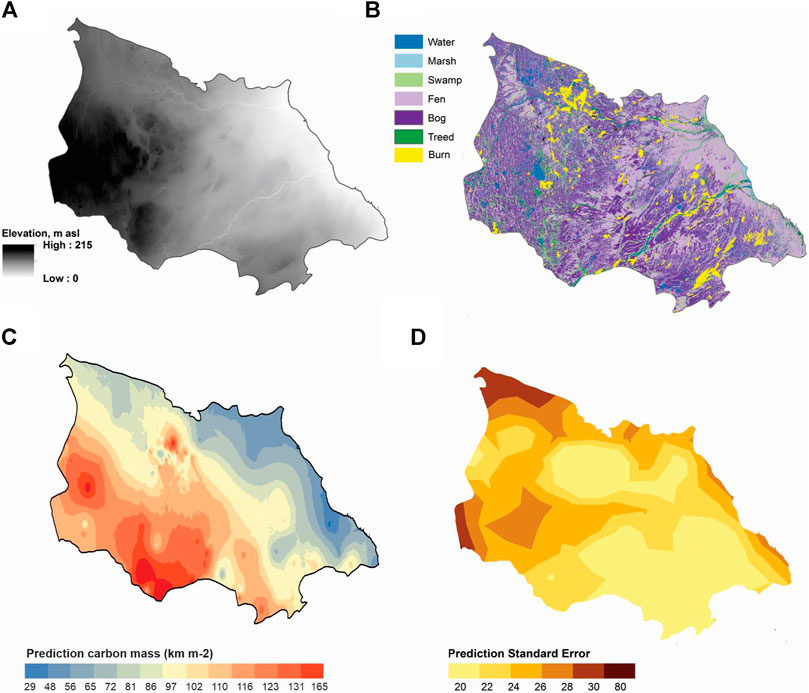
FIGURE 4. Selected characteristics in the 74,300 km2 study area in the southern Hudson Bay Lowlands: (A) elevation, (B) land cover, (C) peat carbon mass, and (D) uncertainty of peat carbon mass; expressed as standard error of carbon mass measurements.
Estimating C storage at landscape scale requires calculating peat C mass per unit area of dry peat (e.g., kg C m−2) as per Eq. 3. In this study, peat C storage was defined as the product of C mass and area of peatland in a landscape estimated using remote sensing, modelling, or geospatial statistical methods.
Previously published data sets containing 364 peat depths, 100 peat ages, and 42 profiles of peat chemical and physical properties were assembled for the Hudson Bay Lowlands (Packalen and Finkelstein, 2014; Packalen et al., 2014, 2016). To estimate peat C mass from peat depth, a regression equation was produced (Eq. 4). Spatial patterns of peat C mass calculated from Eq. 1, Eq. 2 were interpolated using empirical Bayesian kriging (EBK) implemented in ArcGIS geostatistical analyst (ESRI 2011). The EBK was informed by an updated version of the data set used by Packalen et al. (2016) that included 525 peat depth measurements from the Hudson Bay Lowlands, from which 237 depth measurements were specific to the current study area (Figure 3A); herein referred to as the Packalen et al. (2016) equation. This approach was considered a top-down estimation of peat C mass because it was calculated for the entire Hudson Bay Lowlands (approximately 372,000 km2). Even though data from the 74,300 km2 study area were included in the amalgamation for the Hudson Bay Lowlands, it is uncertain if the Packalen et al. (2016) equation calculated C mass adequately in smaller landscapes.
The top-down equation (e.g., Packalen et al., 2016) was tested against a linear and a power estimation of peat C mass produced by fitting Equation 1 to 44 measurements of peat C concentration, bulk density, and depth collected in the 74,300 km2 studied landscape and designated as calibration peat, or bottom-up equations (e.g., specific information) to assess net changes in peat C mass in response to changing climate. Following calibration, 22 independent measurements of peat C, bulk density, and depth in the study area previously reported (Packalen et al., 2016) were designated as test peat. The three equations were tested for their applicability in predicting C mass from 177 peat depth measurements in the study area (Figures 3A,B). Evaluations included testing slopes of the regression lines, residual (observed–predicted C mass) plots, Kruskal-Wallis tests of no difference among equations, and Mann-Whitney U test of no difference in calculated C mass between peat types.
Quality of surface peat (upper 50 cm; the most biologically active region) for microbial decomposition was used to indicate peat susceptibility to changes in climate. We used peat C to N ratio (C:N) as the indicator of surface peat C susceptibility. The C:N ratio reflects mass loss of organic matter and changes in its functional composition in response to the microbial and plant communities present (Turetsky et al., 2015). Peat from six study sites that represented a range in C:N values of 17–73 was incubated to measure potential peat respiration at known C:N values; analyses were conducted using consistent methods across studies (Godin et al., 2012; Myers et al., 2012; Preston et al., 2012; Haynes et al., 2015).
Data from McLaughlin and Webster (2014) were updated, with 36 published studies selected for further analyses in this study (Table 1). Compiled from the publications were data sets of 215 measurements of NEE, peat temperature, and WTL and 188 measurements of CH4 emission, peat temperature, and WTL. Temperature measurements selected were restricted to the surface peat (i.e., 0–30 cm) to represent the approximate range in depth of the long-term acrotelm in peatlands in the study area (Bunbury et al., 2012; O’Reilly et al., 2014). Mean CH4 emissions were compared against those from independent published studies from the Hudson Bay Lowlands (Turetsky et al., 2014; Webster et al., 2018) and CO2 fluxes were compared with those measured at two eddy covariance flux towers in the north-central part of the study area operated by the Ontario Ministry of Environment, Conservation, and Parks (Humphreys et al., 2014; Helbig et al., 2019).
In addition to descriptive statistics (e.g., mean, standard deviation, and coefficient of variation), peat temperature, WTL, and NEE or CH4 emission, the Man Whitney test was used to test hypotheses of no differences in NEE or CH4 fluxes between bogs and fens. Numbers and percentages of positive, negative, and no significant correlations of each GHG with peat temperature and WTL were calculated for each published study to represent possible spatial patterns for baseline conditions of the two GHGs.
Fire patterns in the study area were inferred using the Ontario satellite-derived disturbance mapping product (1:50,000–1:100,000) to evaluate vegetation change for three time periods: before 1990, 1990–2000, and 2000–2009 (Ontario Ministry of Natural Resources and Forestry, 2014). Interpretation of fire events before 1990 were based on an historical time series of aerial photography dating to the mid-1980s that were classified alongside three Landsat 5-TM images (30 m pixel resolution) on which features as small as 0.5 ha were identified. Additional details are provided by Ontario Ministry of Natural Resources and Forestry, (2014).
Data describing fire and its regulation of peatland C fluxes in the Hudson Bay Lowlands are limited, but about 25 and 5% of the above- and belowground C fractions, respectively, may be susceptible to combustion (Balshi et al., 2009). These fractions were assumed to represent peatlands in the study area, with potentially available peat fuel calculated as the product of peat depth or C mass multiplied by 0.05 fraction of belowground peat potentially susceptible to fire since the 1980s. Estimates of consumed peat for bogs (10–14 cm) and fens (7–10 cm) were consistent with the estimated 5–20 cm of peat consumed during wildfires in western Canada and Alaska (Zoltai et al., 1998; Turetsky et al., 2011). The amount per unit area of potentially consumable C (t ha−1) was then calculated from Eq. 5 using 0.45 and 0.05 fractions of burned area for bogs and fens, respectively, since the 1980s and total consumable C (Mt) was calculated from Eq. 6.
Baseline MAAT (1971–2000) in the study area was −1.7 ± 0.6°C (mean ± standard deviation) and was projected to increase to 2.0 to 7.6°C by the 2080s (Supplementary Table 1.1 and Supplementary Table 1.2). Baseline MAP in the study area was 590 ± 39 mm and was projected to increase to 610–665 mm for all timeframes simulated (Supplementary Table 1.2). Baseline moisture index was lowest (i.e., driest) along much of the James Bay coast and progressively increased to the west, north, and south (Figures 5A,B). Both warming scenarios projected drying (i.e., lower moisture index) would occur across the study area.
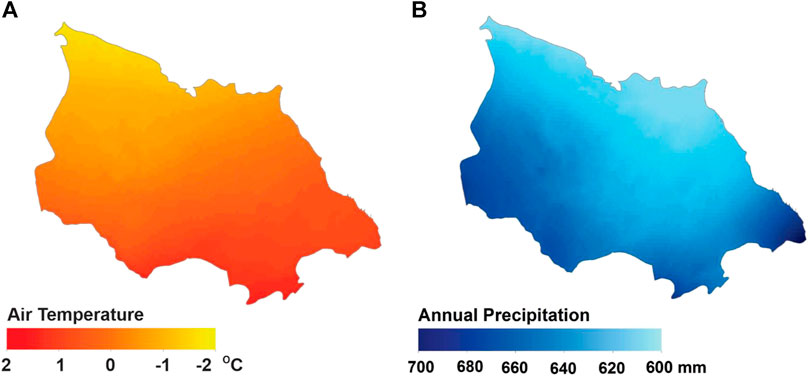
FIGURE 5. Mean annual air temperature (A) and mean annual precipitation (B) for the 74,300 km2 study area in the southern Hudson Bay Lowlands, Canada, for the period 1971–2000.
Based on previous work, moisture index values between 1.4 and 2.0 were deemed optimal for C storage and sequestration (Webster et al., 2013; McLaughlin and Webster, 2014; Packalen et al., 2016). As the moisture index decreases to between 1.4 and 1.2, peatland C sink strength is expected to decrease but peatlands frequently remain net C sinks. A moisture index of 1.2 was assigned as the threshold value below which net C uptake from the atmosphere and its storage in peat are endangered through lower net primary production and more widespread fires that burn deeper into the peat. Only the severely warmer scenario projected moisture index conditions near the 1.2 threshold for the 2080s (Supplementary Table 1.2), primarily in the southern and eastern parts of the study area, although drying near the James Bay coast was apparent for the moderately warmer scenario in the 2080s (Figures 6, 7).
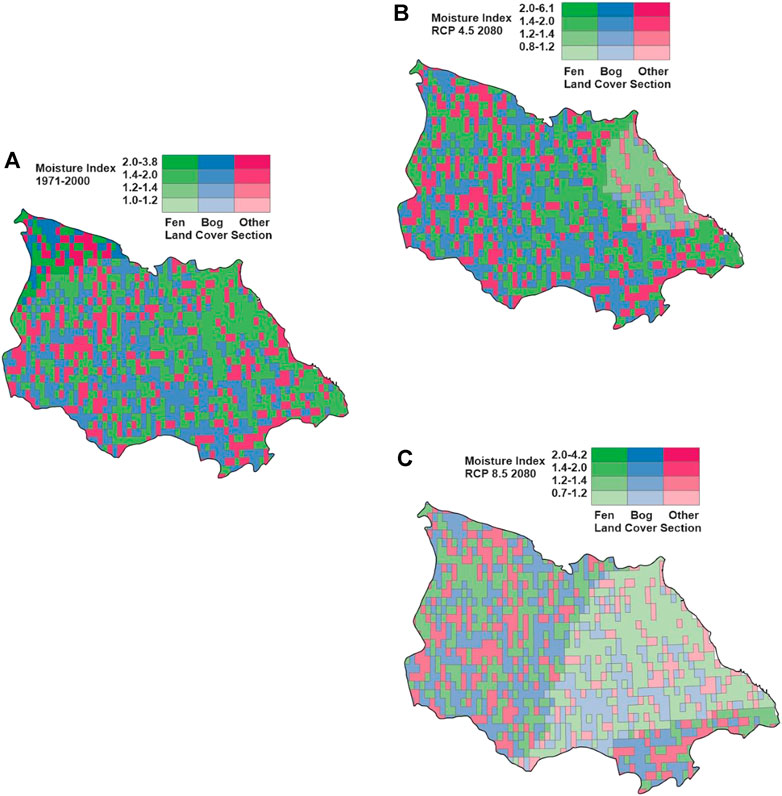
FIGURE 6. Bivariate maps for the 74,300 km2 study area for land cover baseline (A), the 2080s for RCP4.5 (B), and RCP8.5 (C).
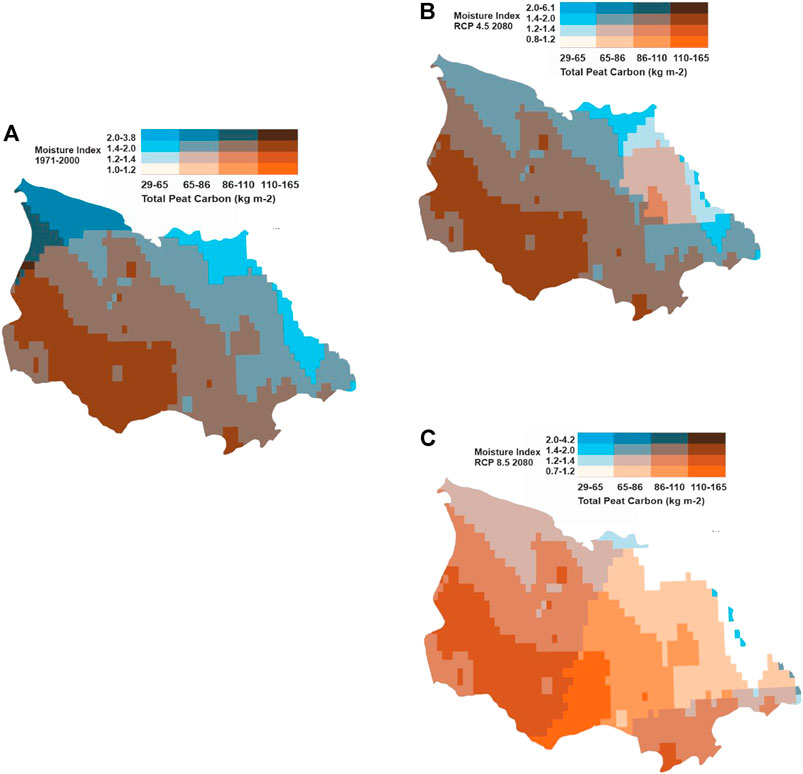
FIGURE 7. Bivariate maps for the 74,300 km2 study area and peat carbon mass baseline (A), the 2080s for RCP4.5 (B), and RCP8.5 (C).
Fens (41%) and bogs (35%) dominated the land cover, with treed fens the most prevalent and open fens the least prevalent peatland types by area. However, based on verification by field sampling, misclassification of open vs. treed fen was more than 50%, whereas more than 80% of open and treed bogs were correctly classified (Akumu and McLaughlin, 2014; Ou et al., 2016; Pironkova, 2017). Therefore, data are presented for bogs and fens, both of which include treed and open peatlands.
Fens are common throughout the study area, but are most abundant within about 100 km of the James Bay coast, which is at the lowest elevation in the study area (Figures 4A,B). Bogs are most prevalent in interior portions of the study area; they occur primarily at high elevation and are often inter-mixed with fens resulting in the patterned nature of the peatlands in the region. Elevation of the study area ranges between 0 and 215 m above sea level and is highest in the western part, decreasing in a north-easterly direction. About 40% of the peatland area was projected to be at or below the 1.2 moisture index threshold for current peat accumulation rates to be maintained in the 2080s under the severely warmer scenario (Figure 6). More fens than bogs were present, with nearly 50% of fens compared to about 30% of bogs occurring where projected moisture index was 1.2 or less.
At the calibration peatlands (N = 44), neither mean peat C concentration (48 ± 3%, p = 0.27) nor bulk density (0.097 ± 0.054 g cm−3, p = 0.35) differed between bogs and fens. However, bogs had the deepest peat; hence they had the highest C mass (Table 2). All three regression equations were consistent in predicting peat C mass (R2 = 0.64–0.73, p < 0.0001) based on residual plots (Figures 8A–D). Nevertheless, the highest C mass was predicted with the linear equation when peat depth was less than about 150 cm and lowest C mass was predicted for the deepest peat. Also, the power equation produced more positive residuals (e.g., underpredicting), and the Packalen et al. (2016) equation (e.g., top-down) produced more negative residuals (overpredicting) than did the linear equation. In spite of these differences, and across bogs and fens, the slopes of the three equations did not differ (p = 0.66–0.93) and mean C mass (p = 0.10) predicted by all equations was similar and within 10% of the C mass measured in the calibration cores (Table 2).
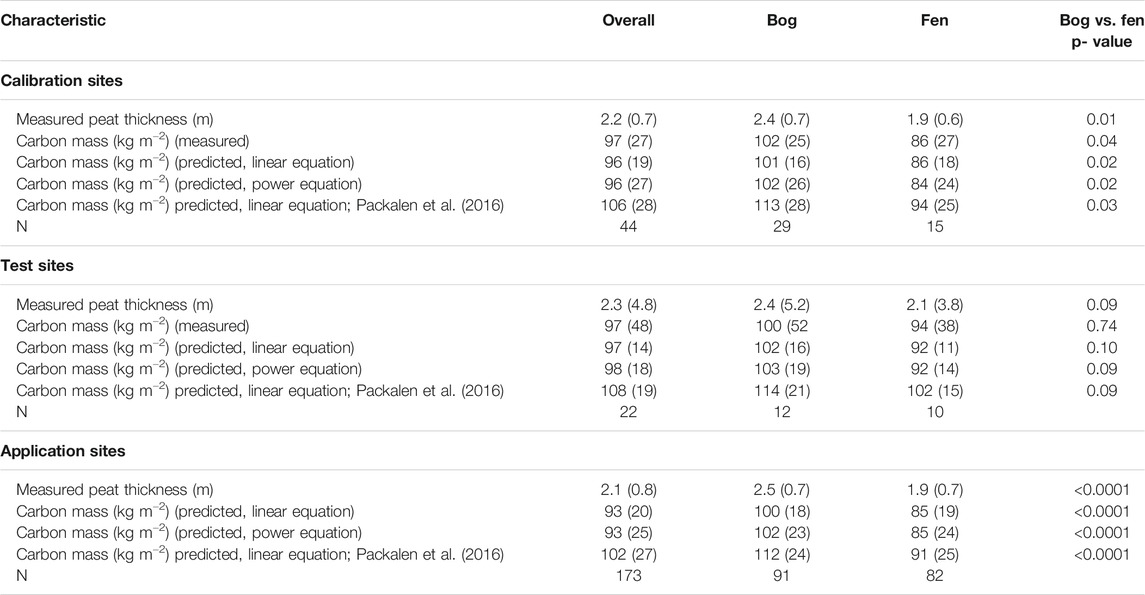
TABLE 2. Mean (±standard deviation) peat depth and carbon mass for 45 calibration, 22 test, and 117 application sites sampled in the 74,300 km2 study area in the southern Hudson Bay Lowlands, Canada.
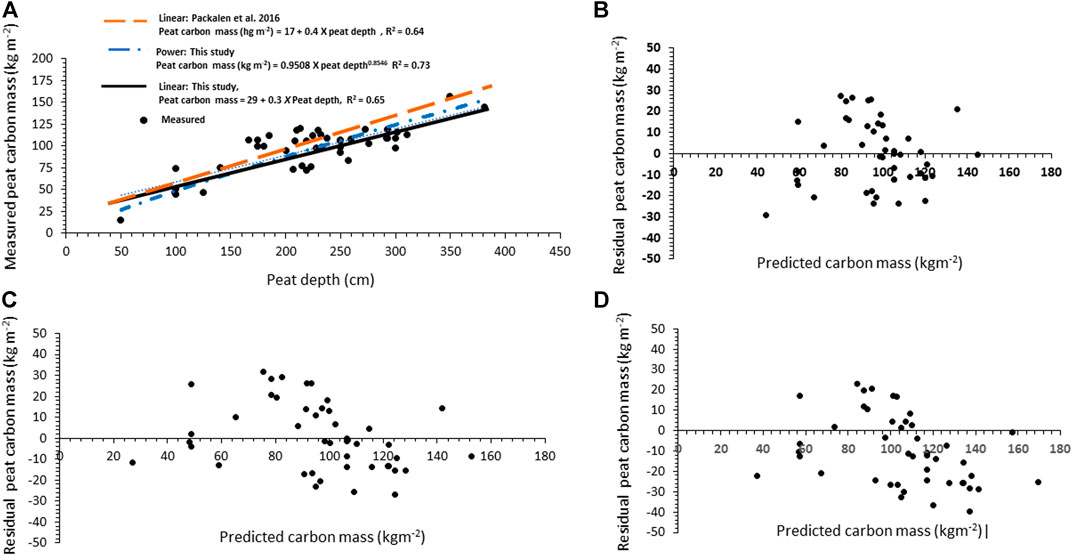
FIGURE 8. Peat carbon mass calculations based on 44 peat profiles sampled in the 74,300 km2 study area in the southern Hudson Bay Lowlands, Canada, for (A) peat depth vs. measured carbon mass for three regression equations, (B) measured–predicted residual carbon mass for (B) linear, (C) power, and (D)Packalen et al. (2016) regression equations.
At the test peatlands (N = 22), measured peat C concentration (50 ± 4%, p = 0.15) and bulk density (0.087 ± 0.010 g cm−3, p = 0.57) were similar for bogs and fens. In contrast to the calibration peat, measured peat depth (p = 0.09) and C mass (p = 0.74) were similar for the two peat types (Table 2). Across bogs and fens, the three equations produced similar mean C mass (p = 0.08) and predicted values within 11% of mean C mass measured at test sites (Table 2). Again, the top-down equation (e.g., Packalen et al., 2016) seemed to overpredict peat C mass relative to the two bottom-up equations (Figures 8A–D). At the application peatlands (N = 173 peat depth measurements), peat depth and estimated C mass differed between peat types and among equations (p = 0.001), with the top-down equation predicting higher mean C mass than the bottom–up linear (p = 0.001) or power (p = 0.001) equations; the latter two equations predicted similar mean C mass (p = 0.87) (Table 2).
Peat depth measurements were most common in the southeastern part of the study area, producing low uncertainty (measured as standard error) in peat C mass estimates (Figure 1A, Figure 4C,D). In contrast, depth measurements in western parts were underrepresented relative to the rest of the studied landscape, producing higher uncertainty in peat C mass estimates. Peat C mass generally was highest in the southwestern portion of study area; consistent with high elevation, a moisture index between 1.4 and 2.0, and bog-dominated (Figure 4C,D; Figure 6C,D). Similar to peatland area, nearly 40% of the peat C in the study area was projected to occur in areas at, or below, the 1.2 threshold moisture index in the 2080s when simulated with the severely warmer scenario (Figure 7C), representing 0.3–0.4 Gt and 1.8–2.4 Gt of C in fen and bog peat, respectively.
The literature synthesis indicated bogs and fens, combined, were net CO2 sinks of 0.54 ± 1.07 g CO2–C m2 d−1 and NEE was similar (p = 0.69) between peatland types, and neither peat temperature or WTL explained significant variation in NEE for bogs and fens, combined (Supplementary Figure 1A). However, peat temperature and NEE were negatively correlated (r = −0.70, p = 0.03) in bogs but not fens (r = −0.19, r = 0.76). Furthermore, NEE was correlated negatively with peat temperature more often in bogs than fens, when calculated for individual studies, whereas NEE and WTL were positively correlated more frequently in bogs than fens (decreasing CO2 sink as WTL increased) (Table 3). For the entire data set, NEE and peat temperature of bogs was best explained by a quadratic equation, with peat temperature explaining 64% (p < 0.001) of the variation in NEE (Supplementary Figure 2A). In contrast, WTL failed to explain significant variation in NEE of bogs.
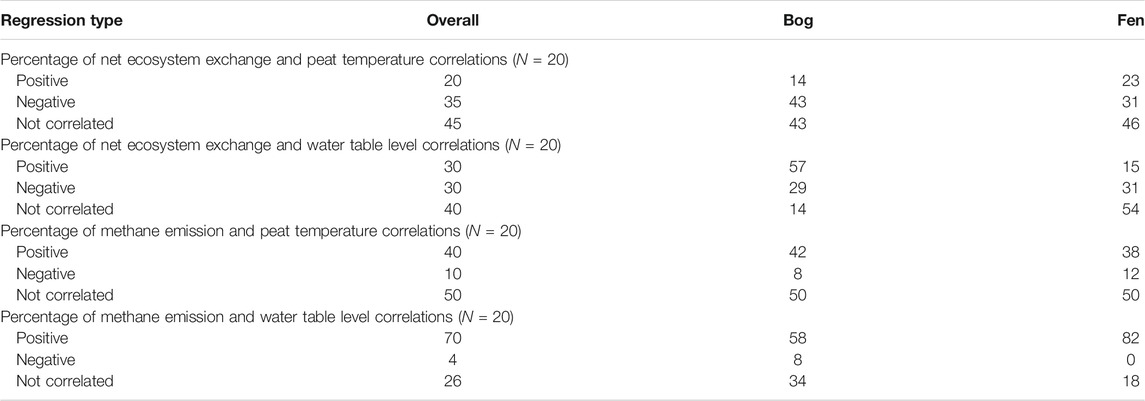
TABLE 3. Percentages of net ecosystem exchange or methane correlations with peat temperature in the upper 0.3 m and water table level for overall peatlands, bogs, and fens calculated from 20 peatlands in the boreal and subarctic regions analyzed from the literature.
Peatlands in the current study were net CH4 sources of 48 ± 67 mg CH4-C m−2 d−1, a finding that was similar between bogs and fens. Correlations between CH4 and WTL of fens were 34% more likely be positive (increasing CH4 emission with increasing WTL) than those of bogs, whereas less than 10% of peatlands had negative (i.e., increasing CH4 emissions at lower WTL) correlations (Table 3).
For the entire data set (i.e., across published studies, N = 188), CH4 emission and peat temperature were significantly correlated in bogs only (r = 0.50, p = 0.04), but regression analyses showed neither peat temperature nor WTL explained significant amounts of variation in CH4 emission (Supplementary Figure 1B). However, bogs and fens combined had low CH4 emission when WTL was less than −35 cm, at which point both CH4 emission rate and its variability increased as WTL increased, and peak CH4 emissions occurred between WTL of about −25 to 5 cm below the peat surface (Supplementary Figure 2B). Most of the variation was due to microtopography, with wet features (i.e., lawns, carpets, hollows, and pools) emitting more CH4 than dry features (i.e., hummocks) when WTL favors high CH4 emissions (Supplementary Figure 2C).
Peat available for consumption by fire in bogs during baseline conditions ranged from 10 to 14 cm (25th–75th percentiles) that contained 48–63 t C ha−1 (25th–75th percentiles). Assuming 90% of the peat fires (45% of total burned area) occurred in bogs and 10% of the landscape burned (Figure 4B), since the 1980s 5.6–7.4 Mt (106 tons or 1012 g) C may have been released to the atmosphere from the study area by fires. An estimated 1.8–2.4 Mt C (25th–75th percentiles) in bog peat may be exposed to a moisture index of 1.2 or less in the 2080s under the severely warmer scenario. In fens, peat available for consumption by fire during baseline conditions ranged from 7 to 10 cm (25th–75th percentiles) that contained 39–55 t C ha−1 (25th–75th percentiles). Assuming 10% of the peat fires (5% total burn area) occurred in fens and 10% of the landscape burned, 0.6–0.8 Mt C (25th–75th percentiles) of fen peat C may have been combusted in the study area since the 1980s, with 0.3–0.4 Mt C (25th–75th percentiles) potentially exposed to a future moisture index of 1.2 or less under the severely warmer scenario.
Applying the BBN to the proportion of total peat area occurring as bog (43%), fen (51%), and permafrost (6%) in the study area produced similar probabilities for their distributions for peat C mass across MAAT regimes. Peat C mass was more susceptible to decomposition based on increased probabilities of high and moderate susceptibility classes when MAAT exceeded current conditions. Fire disturbance was under the influence of the net moisture index, and transitioned from less than 20% to almost 50% high fire occurrence in the 1.4 to 2.0 moisture index category (range for optimal C storage and sequestration) under the most severe MAAT scenario. (See Supplementary Tables 2.1–2.9 for conditional probability tables).
All 3 C fluxes responded to warmer temperature (Figures 9A–C). The strong sink category for CO2 was 27% lower and was offset by more sources in the severely and, to a lesser degree, in the moderately warmer scenario relative to current MAAT (Figure 9A). Methane had slightly higher probabilities of low emission, offset by lower probabilities of moderate and high CH4 emission categories (Figure 9B). Probability of peat C combustion increased with warmer MAAT, as suggested by smaller probabilities for the low category of combustion offset by larger probabilities for the high combustion class (Figure 9C). Combined, changes in NEE, CH4, and peat C combustion contributed to a 21% lower probability of a strong C sink under severe MAAT (Figure 9A).
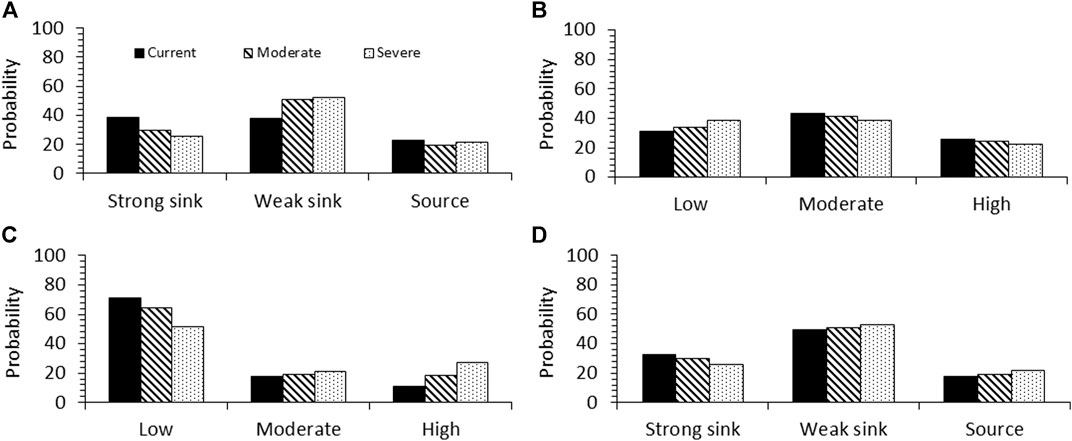
FIGURE 9. In consideration of current, moderate, and severely warmer scenarios of a landscape containing 43% bogs, 51% fens, and 6% permafrost, probabilities of (A) strong sink, weak sink, and source of carbon dioxide; (B) low, moderate, and high methane emissions, (C) low, moderate, and high peat combustion, and (D) a strong sink, weak sink, and source of peat C.
Sensitivity analyses revealed all 3 C fluxes responded to peat wetness, with NEE and CH4 emission being most responsive to peat wetness, and peat C combustion most responsive to fire disturbance and the peat C sink strength was mostly a function of NEE (Figure 10). Net ecosystem exchange (27%) was the only variable (i.e., node) to contribute more than 1% of the influence on peat C sink strength (Supplementary Tables 3.1–3.4), which in turn had an H(X) value of 29% (Figure 11A), with the cumulative percent uncertainty shown in Figure 11B.
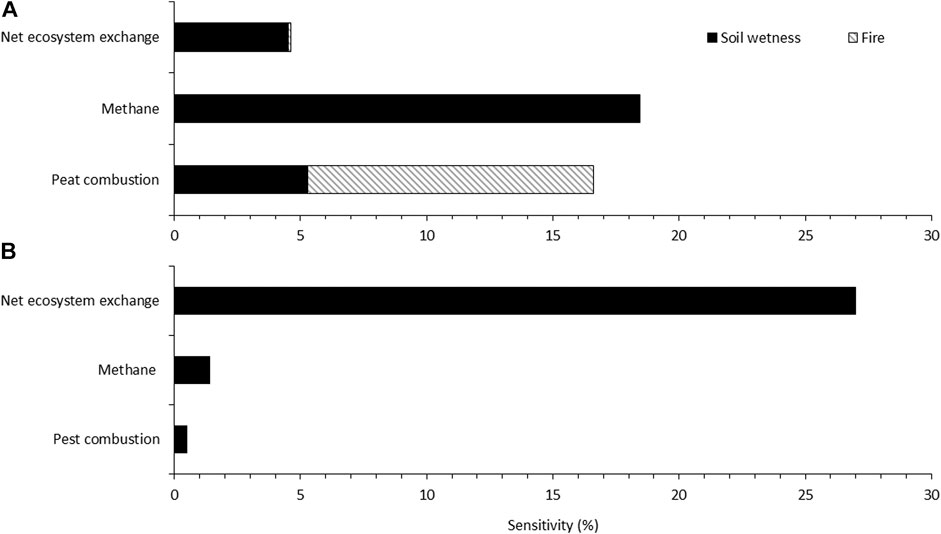
FIGURE 10. In consideration of current, moderate, and severely warmer scenarios of a landscape containing 43% bogs, 51% fens, and 6% permafrost, (A) sensitivities of net ecosystem exchange, methane emissions, and peat combustion to soil wetness and fire and (B) sensitivity of the net peat carbon balance to net ecosystem exchange, methane emissions, and peat combustion.
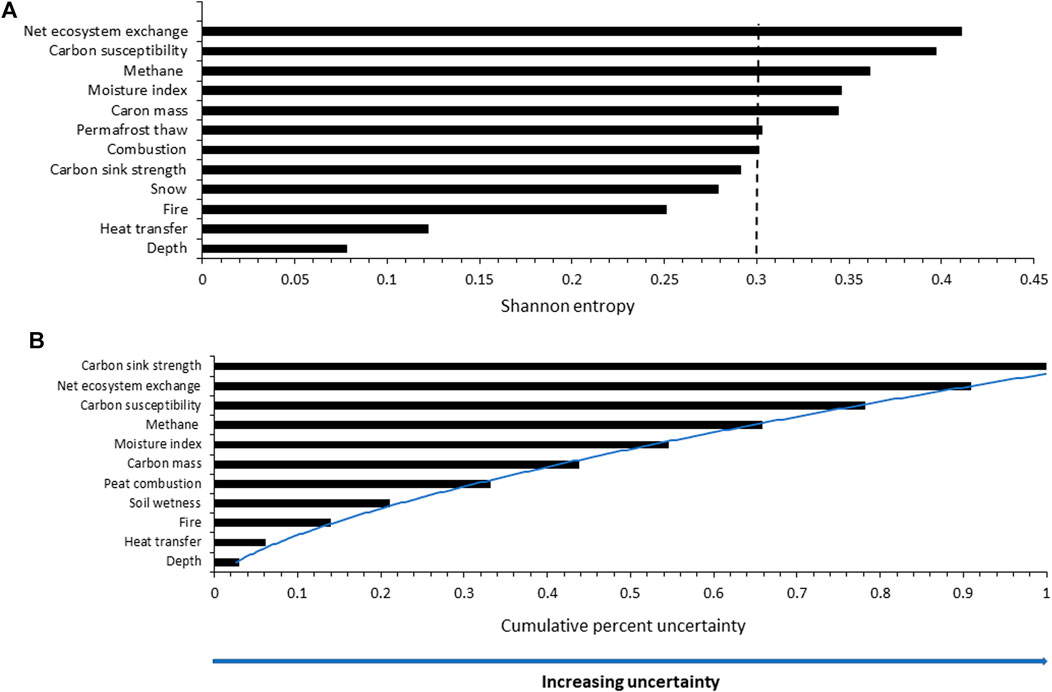
FIGURE 11. Uncertainty of results for selected variables describing (A) posterior probability dispersion (Shannon entropy) and (B) cumulative probability in the standardized
Baseline MAAT was –1.7±-0.6°C and was predicted to increase to 2.7–3.6°C in the 2050s and 2080s, respectively, when simulated with the moderately warmer scenario (Supplementary Table 1.2). The severely warmer simulation projected MAAT of 3.6 and 7.6°C for the 2050s and 2080s, respectively. Simulated warming was consistent with other lines of evidence for warming temperature in the region. For example, using the Northern Ecosystem Soil Temperature (NEST) model, MAAT was projected to have increased by 1.8–2.0°C between 1961–1970 and 2000–2010 in a 7,480 km2 landscape in the north-central part of the study area (Ou et al., 2016A). Also, the Canada Regional Climate Model (CRCM) projected MAAT increases of 3°C during 2041–2070 relative to 1961–1990 (Sushama et al., 2006). Paleoclimate records for the study area and surrounding Hudson Bay Lowlands also indicate warming and drying occurred during the last 600 years (Bunbury et al., 2012; Hargan et al., 2015).
Mean annual precipitation increased by 8 and 11% for the moderately and severely warmer simulations, respectively, compared with baseline MAP. Those values are well below the 25% precipitation increase threshold needed to maintain baseline soil moisture levels. For example, warming by 4.0°C resulted in more intensive soil moisture deficits during spring when precipitation did not change, caused primarily by higher PET rates compared with baseline conditions (Rouse, 1998). However, a 23% increase in precipitation was enough to maintain background PET and soil moisture levels. Additionally, warming fens by 3.5°C and increasing precipitation by 1 mm per month resulted in projected summer soil moisture deficits in excess of 100% in several northern fens (Roulet et al., 1992), further supporting likelihood of drying conditions and subsequently longer, more intensive soil moisture deficits in future.
Peatlands contributed 76% to the total land area, with bogs (41%) and fens (35%) contributing similarly to the total land cover in the 74,300 km2 landscape. This finding was consistent with other studies conducted in the Hudson Bay Lowlands (Glaser et al., 2004; Riley, 2011). About 30 and 50% of bog and fen area, respectively, was exposed to moisture index values that were less than 1.2, mostly occurring in the eastern part of the study area (Figure 6). Thus, on an area basis, fens are differentially exposed to severely warmer temperatures than bogs. Treed fens were the most common peatland type (Akumu and McLaughlin, 2014) but NEE results in treed fens varied and misclassification of open vs. treed fen was about 50% (Akumu and McLaughlin, 2014; Ou et al., 2016; Pironkova, 2017). Open fens may sequester more C from the atmosphere when MAAT is warmer and drier than current conditions (Fan et al., 2013; Webster et al., 2013). However, results have been inconsistent for treed fens, where they may be weaker (Gong et al., 2013; Webster et al., 2013; Wu and Roulet, 2014) or stronger (Flanagan and Syed, 2011) C sinks when MAAT is warmer and peat is drier. Thus, additional research is needed to improve the separation of open and treed fens using satellite techniques, such as Landsat 5-TM that was used in this study, as well as understanding work on NEE fluxes in open and treed fens.
At the calibration peatlands, bogs had deeper peat that contained more C mass than fens, but that was not the case at the test sites (Table 2). This discrepancy may be due to sample size differences between calibration (N = 44) and test (N = 22) peatlands. For example, previous work showed that across boreal and subarctic peatlands, a sample size of 55 was needed to detect a 20% difference in mean peat depth and C mass using statistical power of 70 and 5% level of significance (McLaughlin and Webster, 2014). In the current study, a sample size of 44 was adequate to detect differences in depth and C mass between bogs and fens at the calibration plots. However, a p-value of 0.09 produced from the Mann-Whitney test for differences in peat depth indicated the possibility of a Type II error occurring at the test sites because of the smaller sample size.
For the application peatlands, estimates of mean C mass in peat were similar from a top-down and two bottom-up equations; values were within 10% of that measured for the calibration and test peat samples (Table 2). However, in the shallowest peat situated closer to James Bay coast a power equation poorly predicted peat C mass relative to the two linear equations (Packalen et al., 2014). Residual plots indicated that, in addition to increased sample size, all equations would benefit from more independent variables, such as peat age or acrotelm-to-catotelm boundary, given they also differ across the studied landscape. For example, peat was deeper in a bog than a fen though they were of similar age (∼6,700 cal y BP) (Bunbury et al., 2012; O’Reilly et al., 2014). Furthermore, bogs and fens had similar C mass in the interior of the study area, but fens were most common closer to James Bay coast and contained about 40 g C m−2 compared with 99 kg m−2 in the interior (Packalen et al., 2014).
Although reduced, when simulated with moderately warmer temperature the moisture index was higher than the threshold value of 1.2 near the James Bay coast. However, drying was evident near James Bay, suggesting this region may account for the projected 10% reduction in the strong peat C sink category compared to baseline conditions projected by the BBN. This result is consistent with other evidence. For example, simulations using the Terrestrial Ecosystem Model (TEM) showed soil organic C increased between 2012 and 2061 for a rich fen in Alaska because of more NPP relative to decomposition (Fan et al., 2013). After 2061, the soil organic C sink weakened, potentially functioning as a soil C source as decomposition rates increased relative to NPP.
Paleoclimate records from a bog in the study area revealed most rapid peat C accumulation occurred before 5,500 cal y BP, followed by relatively steady LORCA values until 1,000–600 cal y BP when LORCA decreased, and continued to about 100 cal y BP, when LORCA again increased (Bunbury et al., 2012). In contrast, based on LORCA, an adjacent fen continued to lose C during the past 100 years. Differences may be due to development of acrotelm:catotelm boundary at 33 cm (520 cal y BP) in the bog that was not present in the fen. Acrotelm peat is composed primarily of Sphagnum remains, having lower bulk density that is less humified than the catotelm peat (Glaser et al., 2004). As such, more C accumulated in the bog than the adjacent fen (O’Reilly et al., 2014). Although LORCA may be overestimated in acrotelm relative to catotelm peat (Bunbury et al., 2012), 210Pb calculations indicate that, over the last 200 years, recent rates of C accumulation in acrotelm peat are as much as 40–126 g C m−2-yr−1, depending on wetness and depth of measurements (McLaughlin and Webster, 2014). A caveat is that the higher C accumulation rates measured with 210Pb may be important for conserving legacy C, but accumulation rates do not equal LORCA values of catotelm peat. For example, less than 10% of Sphagnum litter added to the acrotelm is deposited to the catotelm for long-term storage of recalcitrant peat (Laiho, 2006).
When simulated with the severely warmer scenario, moisture index in much of the eastern half of the study area was at or below the threshold value of 1.2 for the 2080s, exposing about one-third of the bogs and one-half of the fens to the driest future conditions. Bogs and fens containing the most C mass (Packalen et al., 2014) occurred in the southcentral part of the study area. This region may be most sensitive to peat C combustion, which may account for much of the 27–60% shift from low to high probability of fire occurrence projected in response to severely warmer temperatures from the BBN. In the rest of the study area, moisture index was projected to decrease to 1.2 to 1.4, indicating C mass reductions may arise from lower NPP relative to peat decomposition, as shown in other regions (Gong et al., 2013; Wu and Roulet, 2014). In contrast, using output from the Hadley Global Environment Model 2, simulations conducted with the LPJ-GUESS (Lund–Postdam–Jena General Ecosystem Simulator) showed possible LORCA increases up to 10 g C m−2- yr−1 in the Hudson Bay Lowlands during the 2080s when simulated with RCP8.5 (Chaudhary et al., 2017).
The quality of surface peat for microbial decomposition has often been identified as a key control on peat decomposition (Turetsky et al., 2011; Preston et al., 2012). In the current study, peat potential respiration was best explained by the natural log of the C:N ratio and potential peat decomposition rate was best explained by a power function, with rapid decreases in respiration occurring between C:N ratios of 20–40, after which respiration decreased at higher C:N values. The C:N gradient was consistent with a rich to moderately rich-- > poor fen-- > bog sequence, and to reduced alkalinity from smallest to largest C:N (McLaughlin and Webster, 2010, 2014; Webster and McLaughlin, 2010).
Decomposition proxies, such as C:N, reflect mass loss of organic matter and changes in its functional composition in response to the microbial and plant communities present (Turetsky et al., 2015). This change in organic matter contributes to fen peat commonly having lower C:N than bogs (Biester et al., 2014). However, alkalinity (favoring microbial activity) is generally higher, and combined with lower C:N, fen peat often has higher initial decomposability compared to bog peat. Conversely, based on Q10 values, bog peat was more sensitive to warmer temperature than fen peat (Preston et al., 2012). Lower WTL in bogs promotes oxygen penetration deeper into the peat, stimulating its decomposition. In contrast, shallow WTL in fens inhibits peat decomposition due to lack of oxygen but enhances methanogen activity and subsequent CH4 production (Godin et al., 2012). Similar to bogs, deepening WTL in fens promotes oxygen diffusion into the peat, enhancing its decomposition. Also, plant shifts from mosses to graminoids are known to reduce C use efficiency of microbial communities when peat is warm and dry (Dieleman et al., 2016). Thus, it is likely C use efficiency will continue to decrease in future years as more easily degradable graminoid litter is added to surface peat. As well, rooting depth of graminoids can exceed 2 m, contributing easily degradable C from root turnover, potentially functioning as a ‘primer’ for decomposition of deeper, more recalcitrant peat (Haynes et al., 2015; Kettridge et al., 2019).
Peatlands were net CO2 sinks of 58 ± 1.07 g CO2-C m−2 d−1, a result that did not differ between bogs and fens. Additionally, mean NEE was on the high end (smaller sink) of the range in annual NEE (−1.62 to −0.48 g CO2-C m−2 d−1) measured for a bog and fen at eddy covariance towers in the north-central part of the study area (Humphreys et al., 2014; Helbig et al., 2019). In the current study, and for baseline conditions, bogs and fens were net CO2 sources (positive correlations) about 14–23% of the time, respectively (Table 3). This finding is consistent with a 23% probability of bogs and fens, combined, being net CO2 sources projected using the BBN (Figure 9A). As well, about 30% of bogs and fens were net CO2 sources in boreal and subarctic peatlands (McLaughlin and Webster, 2014). Negative correlations between NEE and peat temperature indicate bogs were more likely than fens to be net CO2 sinks at warmer temperature (Table 3). This finding is broadly consistent with a 70 days longer CO2 sink period for the bog compared to the fen measured at the eddy covariance towers (Helbig et al., 2019). Bogs were also more likely to be net CO2 sinks when WTL deepened. However, differences between bog and fen responses to temperature and WTL were not reflected in annual or seasonal (May–October) NEE fluxes in the current study or at the eddy covariance towers (Helbig et al., 2019).
When simulated with the moderately warmer scenario, the probability of a strong CO2 sink decreased by 23% and was offset by a concomitant increase of the weak CO2 sink category in the BBN; consistent with previous results (Gong et al., 2013; Webster et al., 2013; Wu and Roulet, 2014). Simulations with severely warmer temperature produced minor changes in probabilities of strong and weak CO2 sink strengths relative to moderate warming. However, differences among type of bogs and fens should be considered in future work. For example, CO2 sink increased at warmer temperatures in an open rich fen when simulated with the Terrestrial Ecosystem Model (Fan et al., 2013), Wetland DNDC model (Webster et al., 2013), and measured (Euskirchen et al., 2014). In contrast, CO2 sink remained unchanged in a forested fen (Flanagan and Syed, 2011) or decreased but remained a sink (Webster et al., 2013), while a forested peat plateau and collapsed scar switched from CO2 sink to source (Euskirchen et al., 2014).
Peatlands in the current study were net CH4 sources of 48 ± 67 mg CH4-C m−2 d−1, which was similar between bogs and fens. Mean CH4 emission calculated in this study was the same order of magnitude as the 17–32 mg CH4-C m−2 d−1 previously reported in the Hudson Bay Lowlands (Webster et al., 2018) and the 26–51 mg CH4-C m−2 d−1 for boreal and subarctic regions (Turetsky et al., 2014). Positive correlations (CH4 source) between CH4 and temperature indicated bogs and fens were equally likely to be sources as temperature warms (Table 3). Positive correlations between CH4 and WTL indicated both peatland types were likely to be CH4 sources, with fens having a higher probability.
Neither peat temperature nor WTL explained significant amounts of variation in CH4 emission, likely attributable to variability in the data. For example, McLaughlin and Webster (2014) showed low statistical power for CH4 emissions that reduced the likelihood of detecting statistical relationships. However, in this study, peak emissions occurred when WTL was between −25 and 5 cm (Supplementary Figure 2B). Peatlands occurring in that WTL range largely consisted of lawn, carpet, and pool microtopographic features that emit large amounts of CH4 (McLaughlin and Webster, 2014). In contrast, hummock-hollow microtopography is common in bogs. While hollows emit relatively large amounts of CH4 to the atmosphere, hummocks release small amounts (Bubier et al., 1993). Therefore, the combined effect of hummocks and hollows to CH4 emission depends on the hummock:hollow ratio, with high ratios favoring low CH4 emission and low ratios favoring high CH4 emissions (McLaughlin and Webster, 2014). Thus, microtopography warrants consideration in landscape-scale assessments of CH4 emissions.
When simulated with the moderately warming scenario, the BBN showed bogs and fens, combined, had minor increases in the probability of low CH4 emission that was mostly offset by changes in the moderate emission category. Simulations with severely warmer MAAT showed the same trend as that for moderately warmer temperature, but differences were double (Figure 9B), a finding consistent with previous work (Webster et al., 2013; Wu and Roulet, 2014).
Data describing fire and its regulation of peatland C cycles and fluxes in the Hudson Bay Lowlands are limited, but the area is thought to have the lowest organic matter combusting rate in Canada (Balshi et al., 2009). Additionally, small peatlands bordering forested uplands may be most sensitive to fire, with smouldering fires being the most important in peatlands (Turetsky et al., 2015; Ingram et al., 2019). In small peatlands, moderate deepening of WTL can convert net C accumulating bogs to a shrub- and grass-dominated ecosystem, and thus a net C source (Kettridge et al., 2019; Dieleman et al., 2015, 2017). Furthermore, wildfires are more common in drained and mined peatlands than in undisturbed and large peatlands such as those in the Hudson Bay Lowlands, which may currently be resistant to large-scale fire disturbance.
In the current study, 48–63 t C ha−1 C was estimated to be available for consumption. Of this, since the 1980s, 5.6–7.4 Mt C may have been released to the atmosphere from the study area due to fires. Similarly, using the 5% organic layer consumed and 1.43 kg C ha m−2 per fire emission reported for the Hudson Bay Lowlands (Balshi et al., 2009), 48 Mt C was estimated to be available for combustion, of which 6.7 Mt were estimated to be combusted to the atmosphere (bog = 6.1 Mt C and fen = 0.6 Mt C) since the 1980s. Thus, both methods appear to be adequate representations of peat C combustion caused by fire. Of the total amount of peat available for consumption, about 2.4–2.7 Mt C were exposed to a moisture index of 1.2 or less in the 2080s under the RCP8.5, of which about 90% occurred in bogs.
In this study, a BBN projected severely warming MAAT (>4.0 C) reduced the probability of peat being a strong C sink by 21% that was mostly offset by a higher probability of peat being a weak C sink in the 2080s. Reduction in peat C sink strength was mostly due to lower probabilities of strong sinks for NEE and peat combustion (Figure 9D). The projections in this study were consistent with current knowledge of peat C cycling and fluxes. For example, and as discussed earlier, compared to baseline conditions drier peat enhances microbial decomposition rates (Godin et al., 2012; Preston et al., 2012) and fire frequency and depth of burning (Turetsky et al., 2011, 2015; Granath et al., 2016). Both conditions can increase net CO2 losses from peat, desite CH4 sink increases. That amount of change in the strong peat C sink strength is frequently on the threshold to detect differences using statistical hypothesis testing because of wide variation in climatic, ecosystem, and carbon conditions (McLaughlin and Webster, 2014). Thus, under the most severe MAAT increases, the peat C sink strength in the 74,300 km2 study area will likely remain an overall C sink and sequestration rates will decrease slightly, thereby displaying moderate vulnerability in response to warmer MAAT.
All 3 C fluxes responded to peat wetness, with NEE and CH4 emission being most responsive to peat wetness and peat combustion most responsive to fire disturbance, similar to other studies in northern peatlands (Webster et al., 2013; Turetsky et al., 2014; Webster and McLaughlin, 2014). Low (less than 20%) sensitivity values likely resulted from at least four causes: 1) wide variation in NEE and CH4 emission values within and among peatland types; 2) soils in the study area are frequently wetter than those in similar landcover types in other areas, such as western Canada and Alaska; 3) uncertainty in current and future peatland fire severity, frequency, longevity, and size; and 4) relatively similar MAAT across much of the study area (Figure 5A). Peat C sink strength was most sensitive to changes in NEE (Figures 10A,B), indicating field research and monitoring to obtain the data needed to constrain conditional probability tables for NEE in future versions of the BBN is a priority. Data from field research can also inform ecosystem conditions in numerical, semi-distributed, and process modelling of the net peat C balance.
The BBN approach relies on expert knowledge rather than explicit links to physical processes, as is the case in process-based models. The BBN approach simplifies the model and produces results that may be accurate, but not necessarily precise (Webster and McLaughlin, 2014). The extensive research presented here describing ecosystem controls on peatland C mass and GHG fluxes likely contributed adequate precision in projections based on the conditional probability tables. The BBN’s power lies in the conditional probability tables, and improving their accuracy provides more certain results. Based on the sensitivity analysis, as knowledge about the system improves, efforts are needed to refine the conditional probability tables relative to peat wetness, fire disturbance, and NEE.
A second limitation to the BBN includes inability to factor in how plant and microbial communities will change over time as peat becomes wetter or drier, for example in response to natural succession following fire. However, this limitation also applies to process-based models of peat C budgets (St.-Hilaire et al., 2010; Mezbahuddin et al., 2017). Another limitation of the BBN is the lack of linkages between C and other nutrient cycles, and that it does not include surface energy budgets.
Many of the processes captured in the framework of the BBN decision tool are fundamental to northern peatland dynamics; however, the Hudson Bay Lowlands is further characterized at the regional to landscape scale by a nearly continuous low relief surface driven by geophysical controls that unify the space and support consideration of other factors across a large geography. For example, the ratio of MAP:PET captures the influence of marine and continental climate regimes in the Hudson Bay Lowlands. The decision tool parameters used here are specified with regional current and future climate conditions, land cover, fire history, and empirically derived relationships for peat properties specific to the region, including permafrost. How these controls translate to other peatland geographies requires additional inquiry. Understanding the vulnerability of peatlands to climate change in the context of strategic land use decisions should be informed by a portfolio of approaches including integrative semi-quantitative decision tools, such as the BBN approach presented here.
Based on a combination of literature syntheses, field sampling, spatial analyses, and probabilistic modelling, about 40% of the peat C in the 74,300 km2 study area in northern Ontario, Canada, may be subjected to moisture index values below the 1.2 threshold needed to maintain the current C sink strengths. Using a BBN, severely warmer MAAT reduced, by about 20%, the probability that the peat C would be a strong sink would be a strong sink, a finding that was most persistent in the eastern half of the study area. Because of variation in climate, ecosystem, and C conditions, this value is on the threshold to detect statistical differences in hypothesis testing. Therefore, in this study area the peat C sink strength is expected to be moderately vulnerable to increasing MAAT. Sensitivity analyses revealed that NEE is the most uncertain C flux affecting the peat C sink strength, and peat wetness was the most uncertain ecosystem condition affecting NEE. As such, recommended research and monitoring projects are those that obtain data on NEE to improve projections of vulnerability in the net peat C balance when exposed to warmer MAAT. These include 1) obtaining additional data to constrain conditional probability tables for NEE, test the BBN in other peatland-dominated geographies, and apply a spatial BBN in landscapes; 2) additional field sampling of peat depth and C mass in areas with the most uncertain peat C mass estimates and measurements of fire patterns and their effects on peat C combustion; and 3) modelling studies to test numerical, semi-distributed, and process-based simulations of the peat C sink strength of large, intermediate, and small landscapes.
The raw data supporting the conclusions of this article will be made available by the authors, without undue reservation.
JM and MP: Conceptualization; data curation; formal analysis; methodology; investigation; visualization; writing.
The authors declare that the research was conducted in the absence of any commercial or financial relationships that could be construed as a potential conflict of interest.
We thank D. McKenny for providing climate projections; B. Hamel, M. Crofts, J. Ralston for their dedication to field work; and S.0. Bowman of the Ontario Forest Research Institute Laboratory Services’ for providing chemical analyses of samples, and Lisa Buse for editing previous versions of the manuscript. This research was funded by Ontario Ministry of Natural Resources and Forestry to JM and MP. Partial contents of this manuscript have previously appeared online (McLaughlin and Webster, 2013; McLaughlin et al., 2018).
The Supplementary Material for this article can be found online at: https://www.frontiersin.org/articles/10.3389/feart.2021.650662/full#supplementary-material
1http://www.climateontario.ca/scripts/MNR_Pub/publication_summary.php?pubId=25
2https://www.ipcc.ch/site/assets/uploads/2018/05/SYR_AR5_FINAL_full_wcover.pdf
3https://www.sse.gov.on.ca/sites/MNR-PublicDocs/EN/CMID/Far%20North%20Land%20Cover%20-%20Data%20Specification.pdf
Adkinson, A. C., Syed, K. H., and Flanagan, L. B. (2011). Contrasting Responses of Growing Season Ecosystem CO2exchange to Variation in Temperature and Water Table Depth in Two Peatlands in Northern Alberta, Canada. J. Geophys. Res. 116, G01004. doi:10.1029/2010JG00151510.1029/2010jg001512
Akumu, C. E., and McLaughlin, J. W. (2014). Modeling Peatland Carbon Stock in a Delineated Portion of the Nayshkootayaow River Watershed in Far North, Ontario Using an Integrated GIS and Remote Sensing Approach. Catena 121, 297–306. doi:10.1016/j.catena.2014.05.025
Alm, J., Schulman, L., Walden, J., Nykänen, H., Martikainen, P. J., and Silvola, J. (1999). Carbon Balance of a Boreal Bog during a Year with an Exceptionally Dry Summer. Ecology 80, 161–174. doi:10.1890/0012-9658(1999)080[0161:cboabb]2.0.co;2
Andrews, J. T., and Peltier, W. R. (1976). Collapse of the Hudson Bay Ice center and Glacio-Isostatic Rebound. Geol 4, 73–75. doi:10.1130/0091-7613(1976)4<73:cothbi>2.0.co;2
Aurela, M., Riutta, T., Laurila, T., Tuovinen, J. P., Vesala, T., Tuittila, E.-S., et al. (2007). CO2 Exchange of a Sedge Fen in Southern Finland-the Impact of a Drought Period. Tellus B: Chem. Phys. Meteorology 59, 826–837. doi:10.1111/j.1600-0889.2007.00309.x
Bäckstrand, K., Crill, P. M., Jackowicz-Korczyñski, M., Mastepanov, M., Christensen, T. R., and Bastviken, D. (2010). Annual Carbon Gas Budget for a Subarctic Peatland, Northern Sweden. Biogeosciences 7, 95–108. doi:10.5194/bg-7-95-2010
Balshi, M. S., McGuire, A. D., Duffy, P., FlanniganKicklighter, M. D. W., Kicklighter, D. W., and Melillo, J. (2009). Vulnerability of Carbon Storage in North American Boreal Forests to Wildfires during the 21st century. Glob. Change Biol 15, 1491–1510. doi:10.1111/j.1365-2486.2009.01877.x
Beilman, D. W., MacDonald, G. M., Smith, L. C., and Reimer, P. J. (2009). Carbon Accumulation in Peatlands of West Siberia over the Last 2000 Years. Glob. Biogeochem. CyclesCycles 23, a–n. doi:10.1029/2007GB003112
Biester, H., Knorr, K.-H., Schellekens, J., Basler, A., and Hermanns, Y.-M. (2014). Comparison of Different Methods to Determine the Degree of Peat Decomposition in Peat Bogs. Biogeosciences 11, 2691–2707. doi:10.5194/bg-11-2691-2014
Bohn, T. J., Lettenmaier, D. P., Sathulur, K., Bowling, L. C., Podest, E., McDonald, K. C., et al. (2007). Methane Emissions from Western Siberian Wetlands: Heterogeneity and Sensitivity to Climate Change. Environ. Res. Lett. 2, 045015. doi:10.1088/1748-9326/2/4/045015
Bonan, G. B. (1989). A Computer Model of the Solar Radiation, Soil Moisture, and Soil thermal Regimes in Boreal Forests. Ecol. Model. 45, 275–306. doi:10.1016/0304-3800(89)90076-8
Bonn, A., Allott, T., Evans, M., Jooston, H., and Stoneman, R. (2016). “Peatland Restoration and Ecosystem Services: an Introduction,” in Peatland Restoration and Ecosystem Services: Science, Policy and Practice. Editors A. Bonn, T. Allott, M. Evans, H. Joosten, and R. R. Stoneman (Cambridge University Press), 1–16.
Bubier, J., Costello, A., Moore, T. R., Roulet, N. T., and Savage, K. (1993). Microtopography and Methane Flux in Boreal Peatlands, Northern Ontario, Canada. Can. J. Bot. 71, 1056–1063. doi:10.1139/b93-122
Bubier, J. L., Frolking, S., Crill, P. M., and Linder, E. (1999). Net Ecosystem Productivity and its Uncertainty in a Diverse Boreal Peatland. J. Geophys. Res. 104, 27683–27692. doi:10.1029/1999jd900219
Bubier, J. L., Moore, T. R., Bellisario, L., Comer, N. T., and Crill, P. M. (1995). Ecological Controls on Methane Emissions from a Northern Peatland Complex in the Zone of Discontinuous Permafrost, Manitoba, Canada. Glob. Biogeochem. Cycles 9, 455–470 doi:10.1029/95gb02379
Bubier, J. L. (1995). The Relationship of Vegetation to Methane Emission and Hydrochemical Gradients in Northern Peatlands. J. Ecol. 83, 403–420. doi:10.2307/2261594
Bunbury, J., Finkelstein, S. A., and Bollmann, J. (2012). Holocene Hydro-Climatic Change and Effects on Carbon Accumulation Inferred from a Peat Bog in the Attawapiskat River Watershed, Hudson Bay Lowlands, Canada. Quat. Res. 78, 275–284. doi:10.1016/j.yqres.2012.05.013
Chasmer, L., Kenward, A., Quinton, W., and Petrone, R. (2012). CO2 Exchanges within Zones of Rapid Conversion from Permafrost Plateau to Bog and Fen Land Cover Types. Arctic, Antarctic, Alpine Res. 44, 399–411. doi:10.1657/1938-4246-44.4.399
Chaudhary, N., Miller, P. A., and Smith, B. (2017). Modelling Past, Present and Future Peatland Carbon Accumulation across the Pan-Arctic Region. Biogeosciences 14, 4023–4044. doi:10.5194/bg-14-4023-2017
Chistjakov, V. I., Kuprijanov, A. I., Gohrskov, V. V., and Artsybashe, E. S. (1983). “Measures for Fire protection on Peat Deposits,” in The Role of Fire in Circumpolar Ecosystems. Editors R. W. Wein, and D. A. MacLean (New York, NY: John Wiley), 259–271.
Christensen, T. R., Jackowicz-Korczyński, M., Aurela, M., Crill, P., Heliasz, M., Mastepanov, M., et al. (2012). Monitoring the Multi-Year Carbon Balance of a Subarctic Palsa Mire with Micrometeorological Techniques. Ambio 41 (Suppl. 3), 207–217. doi:10.1007/s13280-012-0302-5
Christensen, T. R., Jonasson, S., Callaghan, T. V., and Havström, M. (1995). Spatial Variation in High-Latitude Methane Flux along a Transect across Siberian and European Tundra Environments. J. Geophys. Res. 100, 21035–21045. doi:10.1029/95jd02145
Cooper, M. D. A., Estop-Aragonés, C., Fisher, J. P., Thierry, A., Garnett, M. H., Charman, D. J., et al. (2017). Limited Contribution of Permafrost Carbon to Methane Release from Thawing Peatlands. Nat. Clim Change 7, 507–511. doi:10.1038/nclimate3328
Davies, M. A., McLaughlin, J. W., Packalen, M. S., and Finkelstein, S. A. (2021). Using water table depths inferred from testate amoebae to estimate Holocene methane emissions from the Hudson Bay Lowlands, Canada. J. Geophys. Res. 126, doi:10.1029/2020JG005969
Dieleman, C. M., Branfireun, B. A., and Lindo, Z. (2017). Northern Peatland Carbon Dynamics Driven by Plant Growth Form - the Role of Graminoids. Plant Soil 415, 25–35. doi:10.1007/s11104-016-3099-3
Dieleman, C. M., Branfireun, B. A., McLaughlin, J. W., and Lindo, Z. (2015). Climate Change Drives a Shift in Peatland Ecosystem Plant Community: Implications for Ecosystem Function and Stability. Glob. Change Biol. 21, 388–395. doi:10.1111/gcb.12643
Dieleman, C. M., Branfireun, B. A., McLaughlin, J. W., and Lindo, Z. (2016). Enhanced Carbon Release under Future Climate Conditions in a Peatland Mesocosm experiment: the Role of Phenolic Compounds. Plant Soil 400, 81–91. doi:10.1007/s11104-015-2713-0
Erikkson, Y., Öquist, M. G., and Nilsson, M. B. (2010). Effects of Decadal Deposition of Nitrogen and Sulfur, and Increased Temperature, on Methane Emissions from a Boreal Peatland. J. Geophys. Res. 115, G04036. doi:10.1029/2010JG001285
Euskirchen, E. S., Bret-Harte, M. S., Scott, G. J., Edgar, C., and Shaver, G. R. (2012). Seasonal Patterns of Carbon Dioxide and Water Fluxes in Three Representative Tundra Ecosystems in Northern Alaska. Ecosphere 3, art4. doi:10.1890/ES11-00202.1
Euskirchen, E. S., Edgar, C. W., Turetsky, M. R., Waldrop, M. P., and Harden, J. W. (2014). Differential Response of Carbon Fluxes to Climate in Three Peatland Ecosystems that Vary in the Presence and Stability of Permafrost. J. Geophys. Res. Biogeosci. 119, 1576–1595. doi:10.1002/2014jg002683
Fan, Z., David McGuire, A., Turetsky, M. R., Harden, J. W., Michael Waddington, J., and Kane, E. S. (2013). The Response of Soil Organic Carbon of a Rich Fen Peatland in interior Alaska to Projected Climate Change. Glob. Change Biol. 19, 604–620. doi:10.1111/gcb.12041
Flanagan, L. B., and Syed, K. H. (2011). Stimulation of Both Photosynthesis and Respiration in Response to Warmer and Drier Conditions in a Boreal Peatland Ecosystem. Glob. Change Biol 17, 2271–2287. doi:10.1111/j.1365-2486.2010.02378.x
Flessa, H., Rodionoc, A., Guggenberger, G., Fuchs, H., Magdon, P., Shibistova, , et al. (2008). Landscape controls of CH4 fluxes in a catchment of the forest tundra ecotone in northern Siberia. Glob. Change Biol. 14, 2040–2056.
Frolking, S., Talbot, J., Jones, M. C., Treat, C. C., Kauffman, J. B., Tuittila, E. S., et al. (2011). Peatlands in the Earth's 21st century Climate System. Environ. Rev. 19, 371–396. doi:10.1139/a11-014
Glaser, P. H., Hansen, B. C. S., Siegel, D. I., Reeve, A. S., and Morin, P. J. (2004). Rates, Pathways and Drivers for Peatland Development in the Hudson Bay Lowlands, Northern Ontario, Canada. J. Ecol. 92, 1036–1053. doi:10.1111/j.0022-0477.2004.00931.x
Godin, A., McLaughlin, J. W., Webster, K. L., Packalen, M., and Basiliko, N. (2012). Methane and Methanogen Community Dynamics across a Boreal Peatland Nutrient Gradient. Soil Biol. Biochem. 48, 96–105. doi:10.1016/j.soilbio.2012.01.018
Gong, J., Kellomäki, S., Wang, K., Zhang, C., Shurpali, N., and Martikainen, P. J. (2013). Modeling CO2 and CH4 Flux Changes in Pristine Peatlands of Finland under Changing Climate Conditions. Ecol. Model. 263, 64–80. doi:10.1016/j.ecolmodel.2013.04.018
Gorham, E. (1991). Northern Peatlands: Role in the Carbon Cycle and Probable Responses to Climatic Warming. Ecol. Appl. 1, 182–195. doi:10.2307/1941811
Granath, G., Moore, P. A., Lukenbach, M. C., and Waddington, J. M. (2016). Mitigating Wildfire Carbon Loss in Managed Northern Peatlands through Restoration. Sci. Rep. 6, 28498. doi:10.1038/srep28498
Hargan, K. E., Rühland, K. M., Paterson, A. M., Holmquist, J., MacDonald, G. M., Bunbury, J., et al. (2015). Long-term Successional Changes in Peatlands of the Hudson Bay Lowlands, Canada Inferred from the Ecological Dynamics of Multiple Proxies. The Holocene 25, 92–107. doi:10.1177/0959683614556384
Haynes, K. H., Preston, M. D., McLaughlin, J. W., Webster, K., and Basiliko, N. (2015). Dissimilar Bacterial and Fungal Decomposer Communities across Rich to Poor Fen Peatlands Exhibit Functional Redundancy. Can. J. Soil Sci. 95, 19–30. doi:10.4141/cjss-2014-062
Heikkinen, J. E. P., Maljanen, M., Aurela, M., Hargreaves, K. J., and Martikainen, P. J. (2002). Carbon Dioxide and Methane Dynamics in a Sub-arctic Peatland in Northern Finland. Polar Res. 21, 49–62. doi:10.3402/polar.v21i1.6473
Helbig, M., Humphreys, E. R., and Todd, A. (2019). Contrasting Temperature Sensitivity of CO2 Exchange in Peatlands of the Hudson Bay Lowlands, Canada. J. Geophys. Res. Biogeosci. 124, 2126–2143. doi:10.1029/2019jg005090
Huang, X., and Rein, G. (2015). Computational Study of Critical Moisture and Depth of Burn in Peat Fires. Int. J. Wildland Fire 24, 798–808. doi:10.1071/wf14178
Humphreys, E. R., Charron, C., Brown, M., and Jones, R. (2014). Two Bogs in the Canadian Hudson Bay Lowlands and a Temperate Bog Reveal Similar Annual Net Ecosystem Exchange of CO2. Arctic, Antarctic, Alpine Res. 46, 103–113. doi:10.1657/1938-4246.46.1.103
Ingram, R. C., Moore, P. A., Wilkinson, S., Petrone, R. M., and Waddington, J. M. (2019). Postfire Soil Carbon Accumulation Does Not Recover Boreal Peatland Combustion Loss in Some Hydrogeological Settings. J. Geophys. Res. Biogeosci. 124, 775–788. doi:10.1029/2018jg004716
Jackowicz-Korczyski, M., Christensen, T. R., Bäckstrand, K., Crill, P., Friborg, T., Mastepanov, M., et al. (2010). Annual Cycle of Methane Emission from a Subarctic Peatland. J. Geophys. Res. 115, G03009. doi:10.1029/2008JG000913
Järveoja, J., Nilsson, M. B., Gažovič, M., Crill, P. M., and Peichl, M. (2018). Partitioning of the Net CO2 Exchange Using an Automated Chamber System Reveals Plant Phenology as Key Control of Production and Respiration Fluxes in a Boreal Peatland. Glob. Change Biol. 24, 3436–3451. doi:10.1111/gcb.14292
Kettles, L. M., Garneau, M., and Jette, H. (2000). Macrofossil, Pollen, and Geochemical Records of Peatlands in the Kinosheo Lake and Detour Lake Areas, Northern Ontario. Bulletin 545. 24p. Ottawa, ON: Geological Survey of Canada. Available at:. https://geoscan.nrcan.gc.ca/starweb/geoscan/servlet.starweb. (Accessed October 19, 2019). doi:10.4095/211326
Kettridge, N., Lukenbach, M. C., Hokanson, K. J., Devito, K. l., Petrone, R. M., Mendoza, C. A., et al. (2019). Severe Wildfire Exposes Remnant Peat Carbon Stocks to Increased post-fire Drying. Sci. Rep. 9, 3727. doi:10.1038/s41598-019-40033-7
Klinger, L. F., Zimmerman, P. R., Greenberg, J. P., Heidt, L. E., and Guenther, A. B. (1994). Carbon Trace Gas Fluxes along a Successional Gradient in the Hudson Bay Lowland. J. Geophys. Res. 99, 1469–1494. doi:10.1029/93jd00312
Lafleur, P. M., Roulet, N. T., Bubier, J. L., Frolking, S., and Moore, T. R. (2003). Interannual Variability in the Peatland-Atmosphere Carbon Dioxide Exchange at an Ombrotrophic Bog. Glob. Biogeochem. Cycles 17, a–n. doi:10.1029/2002GB001983
Lai, D. Y. F., Roulet, N. T., and Moore, T. R. (2014). The Spatial and Temporal Relationships between CO2 and CH4 Exchange in a Temperate Ombrotrophic Bog. Atmos. Environ. 89, 249–259. doi:10.1016/j.atmosenv.2014.02.034
Laiho, R. (2006). Decomposition in Peatlands: Reconciling Seemingly Contrasting Results on the Impacts of Lowered Water Levels. Soil Biol. Biochem. 38, 2011–2024. doi:10.1016/j.soilbio.2006.02.017
Leppälä, M., Laine, A. M., Seväkivi, M. L., and Tuittila, E. S. (2011). Differences in CO2 Dynamics between Successional Mire Plant Communities during Wet and Dry Summers. J. Veg. Sci. 22, 357–366. doi:10.1111/j.1654-1103.2011.01259.x
Libilik, L. K., Moore, T. R., Bubier, J. L., and Robinson, S. D. (1997). Methane Emissions from Wetlands in the Zone of Discontinuous Permafrost: Fort Simpson, Northwest Territories, Canada. Glob. Biogeochem. Cycles 11, 485–494. doi:10.1029/97GB01935
Mauritz, M., Bracho, R., Celis, G., Hutchings, J., Natali, S. M., Pegoraro, E., et al. (2014). Nonlinear CO2 Flux Response to 7 years of Experimentally Induced Permafrost Thaw. Glob. Chang. Biol. 23, 3646–3666. doi:10.1111/gcb.13661
McLaughlin, J., and Webster, K. (2014). Effects of Climate Change on Peatlands in the Far North of Ontario, Canada: A Synthesis. Arctic, Antarctic, Alpine Res. 46, 84–102. doi:10.1657/1938-4246-46.1.84
McLaughlin, J. W., Packalen, M. S., and Shrestha, B. (2018). Assessment of the Vulnerability if Peatland Carbon in the Albany Ecodistrict of the Hudson Bay Lowlands, Ontario, Canada to Climate Change. Climate Change Research Report 34. 151p. Ontario Ministry of Natural Resources, Applied Research and Development Branch. Sault Ste. Marie, ON, Canada. Available at: http://www.climateontario.ca/scripts/MNR_Pub/publication_summary.php?pubId=67 (Accessed January 4, 2019).
McLaughlin, J. W., and Webster, K. L. (2010). Alkalinity and Acidity Cycling and Fluxes in an Intermediate Fen Peatland in Northern Ontario. Biogeochemistry 99, 143–155. doi:10.1007/s10533-009-9398-5
McLaughlin, J. W., and Webster, K. L. (2013). Effects of a Changing Climate on Peatlands in Permafrost Zones: A Literature Review and Application to Ontario’s Far North. Climate Change Research Report 34. 151p. Ontario Ministry of Natural Resources, Applied Research and Development Branch. Sault Ste. Marie, ON, Canada. Available at: http://www.climateontario.ca/scripts/MNR_Pub/publication_summary.php?pubId=25 (Accessed June 20, 2014).
Mezbahuddin, M., Grant, R. F., and Flanagan, L. B. (2017). Coupled Eco-Hydrology and Biogeochemistry Algorithms Enable the Simulation of Water Table Depth Effects on Boreal Peatland Net CO2 Exchange. Biogeosciences 14, 5507–5531. doi:10.5194/bg-14-5507-2017
Moore, T. R., Heyes, A., and Roulet, N. T. (1994). Methane Emissions from Wetlands, Southern Hudson Bay Lowland. J. Geophys. Res. 99, 1455–1467. doi:10.1029/93jd02457
Munir, T. M., Perkins, M., Kaing, E., and Strack, M. (2015). Carbon Dioxide Flux and Net Primary Production of a Boreal Treed Bog: Responses to Warming and Water-Table-Lowering Simulations of Climate Change. Biogeosciences 12, 1091–1111. doi:10.5194/bg-12-1091-2015
Myers, B., Webster, K. L., McLaughlin, J. W., and Basiliko, N. (2012). Microbial Activity across a Boreal Peatland Nutrient Gradient: the Role of Fungi and Bacteria. Wetlands Ecol. Manage. 20, 77–88. doi:10.1007/s11273-011-9242-2
Myers-Smith, I. H., McGuire, A., Harden, J., and Chapin, F. (2007). Influence of disturbance on carbon exchange in a permafrost collapse and adjacent burned forest. J. Geophys. Res. 112, G04017. doi:10.1029/2007JG000423
Nakano, T., Kuniyoshi, S., and Fukuda, M. (2000). Temporal Variation in Methane Emission from Tundra Wetlands in a Permafrost Area, Northeastern Siberia. Atmos. Environ. 34, 1205–1213. doi:10.1016/s1352-2310(99)00373-8
Neumann, H. H., den Hartog, G., King, K. M., and Chipanshi, A. C. (1994). Carbon Dioxide Fluxes over a Raised Open Bog at the Kinosheo Lake tower Site during the Northern Wetlands Study (NOWES). J. Geophys. Res. 99, 1529–1538. doi:10.1029/93jd01360
Neumann, R. B., Moorberg, C. J., Lundquist, J. D., Turner, J. C., Waldrop, M. P., McFarland, J. W., et al. (2019). Warming Effects of spring Rainfall Increase Methane Emissions from Thawing Permafrost. Geophys. Res. Lett. 46, 1393–1401. doi:10.1029/2018gl081274
Nykänen, H., Heikkinen, J. E. P., Pirinen, L., Tiilikainen, K., and Martikainen, P. J. (2003). Annual CO2exchange and CH4fluxes on a Subarctic Palsa Mire during Climatically Different Years. Glob. Biogeochem. Cycles 17, 1018. doi:10.1029/2002GB001861
O'Reilly, B. C., Finkelstein, S. A., and Bunbury, B. (2014). Pollen-derived Paleovegetation Reconstruction and Long-Term Carbon Accumulation at a Fen Site in the Attawapiskat River Watershed, Hudson Bay Lowlands, Canada. Arct. Antarct. Alp. Res. 46, 6–18. doi:10.1657/1938-4246-46.1.6
Olefeldt, D., Euskirchen, E. S., Harden, J., Kane, E., McGuire, A. D., Waldrop, M. P., et al. (2017). A Decade of Boreal Rich Fen Greenhouse Gas Fluxes in Response to Natural and Experimental Water Table Variability. Glob. Change Biol. 23, 2428–2440. doi:10.1111/gcb.13612
Ontario Ministry of Natural Resource and Forestry (2016). Provincial Digital Elevation Model Technical Specification. Peterborough, ON, Canada. Available at: https://www.sse.gov.onca/sites/MNR-PublicDocs/EN/CMID/ProvDigitalElevationModelTechSpec.pdf (Accessed January 5, 2019).
Ontario Ministry of Natural Resources and Forestry (2014). Far North Land Cover Data Specifications Version 1.4. Peterborough, ON, Canada. Available at: https://www.sse.gov.on.ca/sites/MNR-PublicDocs/EN/CMID/Far%20North%20Land%20Cover%20-%20Data%20Specification.pdf (Accessed January 5, 2019).
Ou, C., Leblon, B., Zhang, Y., LaRocque, A., Webster, K., and McLaughlin, J. (2016). Modelling and Mapping Permafrost at High Spatial Resolution Using Landsat and Radarsat Images in Northern Ontario, Canada: Part 1 - Model Calibration. Int. J. Remote Sensing 37, 2727–2750. doi:10.1080/01431161.2016.1157642
Packalen, M. S., Finkelstein, S. A., and McLaughlin, J. W. (2016). Climate and Peat Type in Relation to the Spatial Distribution of the Peat Carbon Mass in the Hudson Bay Lowland, Canada. J. Geophys. Res. Biogeosci. 121, 1104–1117. doi:10.1002/2015JG002938
Packalen, M. S., Finkelstein, S. A., and McLaughlin, J. W. (2014). Holocene Peat Initiation, Carbon Storage and Potential Methane Production in the Hudson Bay Lowlands, Canada. Nat. Commun. 5, 4078. doi:10.1038/ncomms5078
Packalen, M. S., and Finkelstein, S. A. (2014). Quantifying Holocene Variability in Carbon Uptake and Release since Peat Initiation in the Hudson Bay Lowlands, Canada. The Holocene 24, 1063–1074. doi:10.1177/0959683614540728
Pagano, A., Pluchinotta, I., Giordano, R., Petrangeli, A. B., Fratino, U., and Vurro, M. (2018). Dealing with Uncertainty in Decision-Making for Drinking Water Supply Systems Exposed to Extreme Events. Water Resour. Manage. 32, 2131–2145. doi:10.1007/s11269-018-1922-8
Peichl, M., Öquist, M., Löfvenius, M. O., Ilstedt, U., Sagerfors, J., Grelle, A., et al. (2014). A 12-year Record Reveals Pre-growing Season Temperature and Water Table Level Threshold Effects on the Net Carbon Dioxide Exchange in a Boreal Fen. Environ. Res. Lett. 9, 05500. doi:10.1088/1748-9326/9/5/055006
Pironkova, Z. (2017). Mapping Palsa and Peat Plateau Changes in the Hudson Bay Lowlands, Canada, Using Historical Aerial Photography and High-Resolution Satellite Imagery. Can. J. Remote Sensing 43, 455–467. doi:10.1080/07038992.2017.1370366
Prat-Guitart, N., Rein, G., Hadden, R. M., Belcher, C. M., and Yearsley, J. M. (2016). Effects of Spatial Heterogeneity in Moisture Content on the Horizontal Spread of Peat Fires. Sci. Total Environ. 572, 1422–1430. doi:10.1016/j.scitotenv.2016.02.145
Preston, M. D., Smemo, K. A., McLaughlin, J. W., and Basiliko, N. (2012). Peatland Microbial Communities and Decomposition Processes in the James Bay Lowlands, Canada. Front. Microbio. 3, 70. doi:10.3389/fmicb.2012.00070
Price, D. T., McKenney, D. W., Joyce, L. A., Siltanen, R. M., Papadopol, P., and Lawrence, K. (2011). High-resolution Interpolation of Climate Scenarios for Canada Derived from General Circulation Model Simulations. Natural Resources Canada, Canadian Forest Service, Northern Forestry Centre, Edmonton, AB. Information Report NOR-X-421.Riley, J.L. 2011. Toronto, ON: Nature Conservancy of Canada, 156. Wetlands of the Ontario Hudson Bay Lowland: A Regional Overview.
Riley, J. L. (2011). Wetlands of the Ontario Hudson Bay Lowland: A Regional Overview. Toronto, ON: Nature Conservancy of Canada, 156.
Riutta, T., Laine, J., Aurela, M., Rinne, J., Vesala, T., Laurila, T., et al. (2007). Spatial Variation in Plant Community Functions Regulates Carbon Gas Dynamics in a Boreal Fen Ecosystem. Tellus B Chem. Phys. Meteorol. 59 (5), 838–852. doi:10.1111/j.1600-0889.2007.00302.x
IPCC (2014). in Synthesis Report. Contribution of Working Groups I, II and III to the Fifth Assessment Report of the Intergovernmental Panel on Climate Change [Core Writing Team. Editors R. K. Pachauri, and L. A. Meyer (Geneva, Switzerland: IPCC), 151. Available at: https://www.ipcc.ch/site/assets/uploads/2018/05/SYR_AR5_FINAL_full_wcover.pdf (Accessed June 19, 2019)., Editors].
Roulet, N., Moore, T., Bubier, J., and Lafleur, P. (1992). Northern Fens: Methane Flux and Climatic Change. Tellus B: Chem. Phys. Meteorology 44, 100–105. doi:10.3402/tellusb.v44i2.15429
Rouse, W. R. (1998). A Water Balance Model for a Subarctic Sedge Fen and its Application to Climatic Change. Clim. Change 38, 207–234. doi:10.1023/a:1005358017894
Sagerfors, J., Lindroth, A., Grelle, A., Klemedtsson, L., Weslien, P., and Nilsson, M. (2008). Annual CO2 exchange between a Nutrient-Poor, Minerotrophic, Boreal Mire and the Atmosphere. J. Geophys. Res. 113, a–n. doi:10.1029/2006JG000306
Salm, J. O., Maddison, M., Tammik, S., Soosaar, K., Truu, J., and Mander, Ü. (2012). Emissions of CO2, CH4 and N2O from Undisturbed, Drained and Mined Peatlands in Estonia. Hydrobiologia 692, 41–55. doi:10.1007/s10750-011-0934-7
Schreader, C. P., Rouse, W. R., Griffis, T. J., Boudreau, L. D., and Blanken, P. D. (1998). Carbon Dioxide Fluxes in a Northern Fen during a Hot, Dry Summer. Glob. Biogeochem. Cycles 12, 729–740. doi:10.1029/98GB02738
St.-Hilaire, F., Wu, J., Roulet, N. T., Frolking, S., Lafleur, P. M., Humphreys, E. R., et al. (2010). McGill Wetland Model: Evaluation of a Peatland Carbon Simulator Developed for Global Assessments. Biogeosciences 7, 351. doi:10.5194/bg-7-3517-2010
Strack, M., Waddington, J. M., and Tuittila, E. S. (2004). Effect of Water Table Drawdown on Northern Peatland Methane Dynamics: Implications for Climate Change. Glob. Biogeochem. Cycles 8, GB4003. doi:10.1029/2003GB002209
Strack, M., and Waddinton, J. M. (2007). Response of Peatland Carbon Dioxide and Methane Fluxes to a Water Table Drawdown experiment. Glob. Biogeochem. Cycles 21, GB1007. doi:10.1029/2006GB002715.200.Strack
Strilesky, S. L., and Humphreys, E. R. (2012). A Comparison of the Net Ecosystem Exchange of Carbon Dioxide and Evapotranspiration for Treed and Open Portions of a Temperate Peatland. Agric. For. Meteorology 153, 45–53. doi:10.1016/j.agrformet.2011.06.006
Ström, L., and Christensen, T. R. (2007). Below Ground Carbon Turnover and Greenhouse Gas Exchanges in a Sub-arctic Wetland. Soil Biol. Biochem. 39, 1689–1698. doi:10.1016/j.soilbio.2007.01.019
Sushama, L., Laprise, R., and Allard, M. (2006). Modeled Current and Future Soil thermal Regime for Northeast Canada. J. Geophys. Res. 111, D18111. doi:10.1029/2005JD007027
Suyker, A. E., Verma, S. B., and Arkebauer, T. J. (1997). Season-long Measurement of Carbon Dioxide Exchange in a Boreal Fen. J. Geophys. Res. 102, 29021–29028. doi:10.1029/96jd03877
Syed, K. H., Flanagan, L. B., Carlson, P. J., Glenn, A. J., and Van Gaalen, K. E. (2006). Environmental Control of Net Ecosystem CO2 Exchange in a Treed, Moderately Rich Fen in Northern Alberta. Agric. For. Meteorology 140, 97–114. doi:10.1016/j.agrformet.2006.03.022
Thomsen, N. I., Binning, P. J., McKnight, U. S., Tuxen, N., Bjerg, P. L., and Troldborg, M. (2016). A Bayesian Belief Network Approach for Assessing Uncertainty in Conceptual Site Models at Contaminated Sites. J. Contaminant Hydrol. 188, 12–28. doi:10.1016/j.jconhyd.2016.02.003
Trudeau, N. C., Garneau, M., and Pelletier, L. (2013). Methane Fluxes from a Patterned Fen of the Northeastern Part of the La Grande River Watershed, James Bay, Canada. Biogeochemistry 113, 409–422. doi:10.1007/s10533-012-9767-3
Turetsky, M. R., Benscoter, B., Page, S., Rein, G., van der Werf, G. R., and Watts, A. (2015). Global Vulnerability of Peatlands to Fire and Carbon Loss. Nat. Geosci 8, 11–14. doi:10.1038/ngeo2325
Turetsky, M. R., Kane, E. S., Harden, J. W., Ottmar, R. D., Manies, K. L., Hoy, E., et al. (2011). Recent Acceleration of Biomass Burning and Carbon Losses in Alaskan Forests and Peatlands. Nat. Geosci 4, 27–31. doi:10.1038/ngeo1027
Turetsky, M. R., Kotowska, A., Bubier, J., Dise, N. B., Crill, P., Hornibrook, E. R. C., et al. (2014). A Synthesis of Methane Emissions from 71 Northern, Temperate, and Subtropical Wetlands. Glob. Change Biol. 20, 2183–2197. doi:10.1111/gcb.12580
Turetsky, M. R., Wieder, R. K., Vitt, D. H., Evans, R., and Scott, K. D. (2002). Boreal Peatland C Fluxes under Varying Permafrost Regimes. Soil Biol. Biochem. 34, 907–912. doi:10.1016/s0038-0717(02)00022-6
Turetsky, M. R., Wieder, R. K., Vitt, D. H., Evans, R., and Scott, K. D. (2007). The Disappearance of Relict Permafrost in Boreal North America: Effects on Peatland Carbon Storage and Fluxes. Glob. Change Biol. 13, 1922–1934. doi:10.1111/j.1365-2486.2007.01381.x
Turquety, S., Logan, J. A., Jacob, D. J., Hudman, R. C., Leung, F. Y., Heald, C. L., et al. (2007). Inventory of Boreal Fire Emissions for North America in 2004: Importance of Peat Burning and Pyroconvective Injection. J. Geophys. Res. 112, D12S03. doi:10.1029/2006JD007281
Uusiitalo, L., Lehikonen, A., Helle, I., and Myberg, K. (2015). An Overview of Methods to Evaluate Uncertainty of Deterministic Models in Decision Support. Environ. Model. Softw. 63, 24–31. doi:10.1016/j.envsoft.2014.09.017
Webster, K. L., Bhatti, J. S., Thompson, D. K., Nelson, S. A., Shaw, C. H., Bona, K. A., et al. (2018). Spatially-integrated Estimates of Net Ecosystem Exchange and Methane Fluxes from Canadian Peatlands. Carbon Balance Manage 13, 16. doi:10.1186/s13021-018-0105-5
Webster, K. L., and McLaughlin, J. W. (2014). Application of a Bayesian Belief Network for Assessing the Vulnerability of Permafrost to Thaw and Implications for Greenhouse Gas Production and Climate Feedback. Environ. Sci. Pol. 38, 28–44. doi:10.1016/j.envsci.2013.10.008
Webster, K. L., and McLaughlin, J. W. (2010). Importance of the Water Table in Controlling Dissolved Carbon along a Fen Nutrient Gradient. Soil Sci. Soc. Am. J. 74, 2254–2266. doi:10.2136/sssaj2009.0111
Webster, K. L., McLaughlin, J. W., Kim, Y., Packalen, M. S., and Li, C. S. (2013). Modelling Carbon Dynamics and Response to Environmental Change along a Boreal Fen Nutrient Gradient. Ecol. Model. 248, 148–164. doi:10.1016/j.ecolmodel.2012.10.004
Wickland, K., Striegl, R., Neff, J., and Sachs, T. (2006). Effects of permafrost melting on CO2 and CH4 exchange of a poorly drained black spruce lowland. J. Geophys. Res. 111, G02011. doi:10.1029/2005JG000099
Wilson, R. M., Fitzhugh, L., Whiting, G. J., Frolking, S., Harrison, M. D., Dimova, N., et al. (2017). Greenhouse Gas Balance over Thaw‐freeze Cycles in Discontinuous Zone Permafrost. J. Geophys. Res. Biogeosci. 122, 387–404. doi:10.1002/2016jg003600
Wu, J., and Roulet, N. T. (2014). Climate Change Reduces the Capacity of Northern Peatlands to Absorb the Atmospheric Carbon Dioxide: The Different Responses of Bogs and Fens. Glob. Biogeochem. Cycles 28, 1005–1024. doi:10.1002/2014gb004845
Keywords: hudson bay lowlands, moisture index, climate warming, peat carbon vulnerability, probabilistic modelling, land use planning
Citation: McLaughlin JW and Packalen MS (2021) Peat Carbon Vulnerability to Projected Climate Warming in the Hudson Bay Lowlands, Canada: A Decision Support Tool for Land Use Planning in Peatland Dominated Landscapes. Front. Earth Sci. 9:650662. doi: 10.3389/feart.2021.650662
Received: 07 January 2021; Accepted: 05 July 2021;
Published: 21 July 2021.
Edited by:
Line Rochefort, Laval University, CanadaReviewed by:
Julie Loisel, Texas A&M University, United StatesCopyright © 2021 McLaughlin and Packalen. This is an open-access article distributed under the terms of the Creative Commons Attribution License (CC BY). The use, distribution or reproduction in other forums is permitted, provided the original author(s) and the copyright owner(s) are credited and that the original publication in this journal is cited, in accordance with accepted academic practice. No use, distribution or reproduction is permitted which does not comply with these terms.
*Correspondence: James W. McLaughlin, amltLm1jbGF1Z2hsaW5Ab250YXJpby5jYQ==
Disclaimer: All claims expressed in this article are solely those of the authors and do not necessarily represent those of their affiliated organizations, or those of the publisher, the editors and the reviewers. Any product that may be evaluated in this article or claim that may be made by its manufacturer is not guaranteed or endorsed by the publisher.
Research integrity at Frontiers
Learn more about the work of our research integrity team to safeguard the quality of each article we publish.