
94% of researchers rate our articles as excellent or good
Learn more about the work of our research integrity team to safeguard the quality of each article we publish.
Find out more
DATA REPORT article
Front. Earth Sci. , 13 April 2021
Sec. Geohazards and Georisks
Volume 9 - 2021 | https://doi.org/10.3389/feart.2021.649938
This article is part of the Research Topic Water-Related Natural Disasters in Mountainous Area View all 39 articles
 Ryan Porter1*
 Taylor Joyal1*
 Rebecca Beers1,2
 Joseph Loverich3
 Aubrey LaPlante1John Spruell1Ann Youberg4Edward Schenk5Peter R. Robichaud6
 Abraham E. Springer1
The 2019 Museum Fire burned ~8 km2 of ponderosa pine and mixed-conifer forests in mountainous terrain ~2 km north of Flagstaff, Arizona, USA (Figure 1). The fire ignited on Sunday July 21, 2019 and became the highest priority fire in the nation due to the steep terrain and proximity to Flagstaff, northern Arizona's population center. The region has been in the Early 21st century drought since the mid-1990's (Hereford, 2007). This fire represents a common wildfire event that is becoming more likely in the western US due to climate change, a longer fire season and larger, more severe fires (Westerling, 2016; Singleton et al., 2019; Mueller et al., 2020), and increased forest density linked to the history of fire suppression (North et al., 2015; Parks et al., 2015; O'Donnell et al., 2018). While the immediate threats posed by wildfire are substantial, another concern is often the post-wildfire debris flows caused by the removal of vegetation and ground cover, and creation of water repellent soil conditions following fire (e.g., Neary et al., 2012).
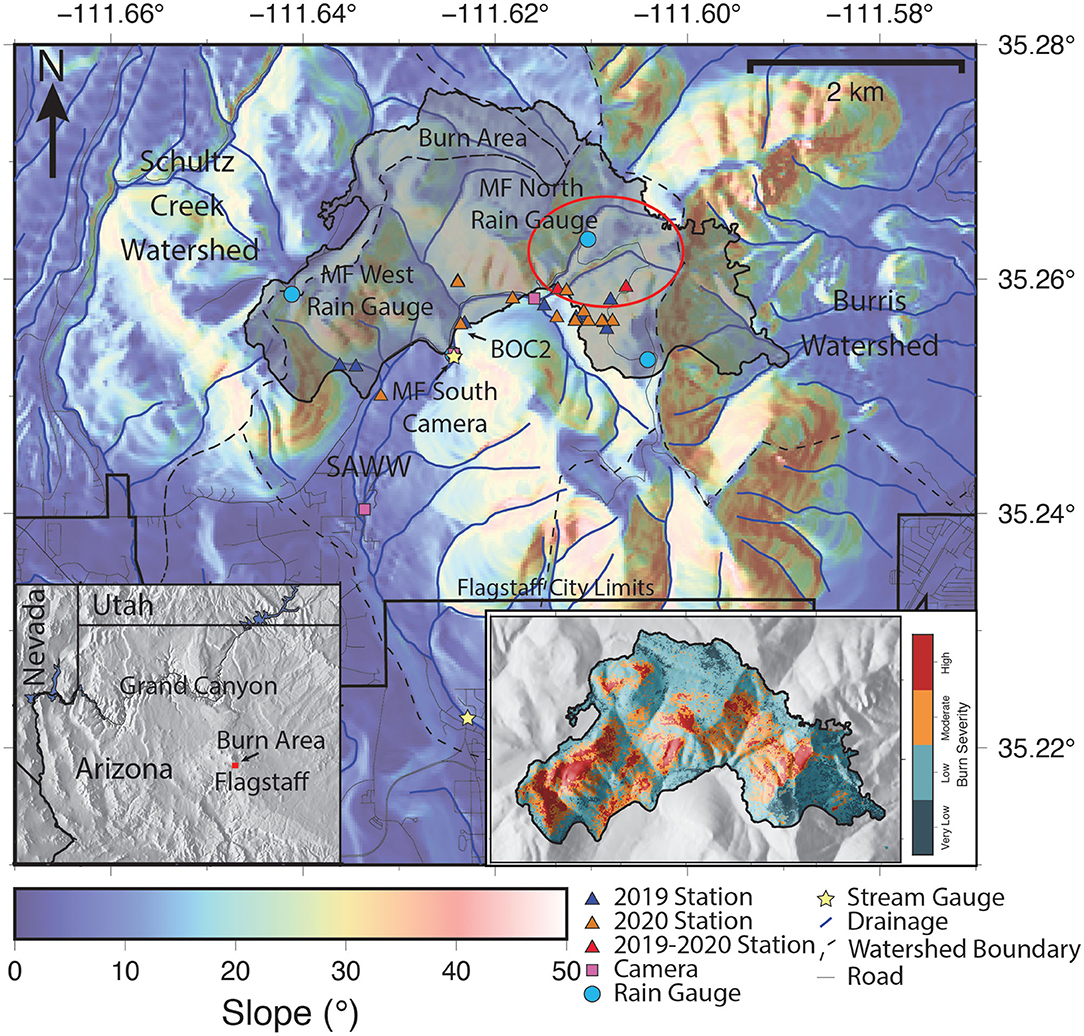
Figure 1. Hillslope map of the study area showing the burn area and the location of seismic stations, monitoring cameras, stream gauges, and rain gauges. Labels are provided for site where data are shown in Figure 2. Red circle denotes the area where debris flows initiated during the July 24, 2020 event. Inset show burn severity map modified from Museum Fire BAER Team (2019).
Following the Museum Fire, a small network of seismometers was deployed during the summers and falls of 2019 and 2020. The purpose of this network was to record seismic signals associated with debris flows that occurred within and downstream of the burn area. Here we present seismic data recorded by this network and additional rainfall and photographic data. When combined, these data provide a tool for examining post-wildfire debris flows in the southwestern US.
Advances in seismic instrumentation and processing techniques have led to a recent expansion in the use of seismic analysis for non-traditional applications. This includes using seismic data to study geomorphic processes such as sediment transport in rivers and mass wasting events (Suriñach Cornet et al., 2005; Burtin et al., 2008, 2011, 2013; Schmandt et al., 2013; Roth et al., 2016; Bessason et al., 2017; Allstadt et al., 2019; Coviello et al., 2019). As debris flows propagate downslope, seismic energy is primarily generated by very coarse grains colliding with the bed of the channel, with greater seismic energy produced in bedrock channels than channels dominated by unconsolidated bed sediments (Tsai et al., 2012; Kean et al., 2015; Lai et al., 2018). Depending on the instrumentation used, channel type, and debris-flow characteristics, previous data were interpreted to show that these events may be identified and characterized at distances up to ~3 km by seismic stations (Lai et al., 2018), though detection and characterization is more likely at the scale of 10–100 s of meters (Coviello et al., 2019). By combining seismic observation from multiple seismic stations, debris flows can be located as they move, allowing seismic recordings to be tied to specific events (Burtin et al., 2009; McGuire, 2018; Michel et al., 2019; and Tang et al., 2019). The datasets presented here were specifically designed to monitor debris flows and build on the growing body of work demonstrating the efficacy of using seismometers to monitor and characterize debris flows.
In northern Arizona, precipitation is concentrated in the winter as snowfall and late summer months as high-intensity monsoonal rain storms (July–September) (Jurwitz, 1953). These high-intensity monsoonal storms have a high probability to produce flooding and debris flows when they occur within recently burned areas in steep terrain. The Museum Fire was almost entirely confined to the steep, upper portions of the ~12.5 km2 Spruce Avenue Wash Watershed (SAWW), which flows into neighborhoods and businesses in east Flagstaff (Figure 1). Although the Museum Fire was primarily constrained to the SAWW, a small portion of the fire burned into the adjacent Schultz Creek Watershed and Burris Watershed. Alluvial chronology using C14 determined that sediments in the Schultz Creek Watershed have been accumulating for approximately 7,000 years without major fires or flooding (Stempniewicz, 2014), suggesting ample sediment availability for debris flow entrainment. It is likely that the adjacent SAWW has similar sediment availability, increasing the risk for destructive post-wildfire debris flows. Due to the direct impact flooding and debris flows could have on the community, flood models under three rainfall conditions (25, 51, and 76 mm of rainfall) over the SAWW using FLO-2D software (FLO-2D Software Inc., Nutrioso, Arizona) were produced (JE Fuller Hydrology and Geomorphology, JEF Inc., Flagstaff, AZ). The models show that under all three rainfall conditions, the burned watershed is highly responsive and is likely to produce flooding, with water depths approaching 1.5 m under the most severe modeled conditions (https://www.coconino.az.gov/2133/Museum-Fire-Flood-Area; JEF model results are available upon request). Consequently, the greatly increased watershed sensitivity has increased probability for debris flows (Museum Fire BAER Team, 2019).
The U.S. Geological Survey (USGS) post-wildfire debris-flow model predicts debris flow probability at the basin or channel-segment scale within a burned basin (Staley et al., 2016, 2017), and the potential sediment volumes (Gartner et al., 2014). Post-wildfire debris flow hazard for the SAWW was rated as moderate by the USGS, who predicted a potential debris flow volume of 10,000–100,000 m3 for a 15 min rainstorm with a peak intensity of 24 mm/h (Kean et al., 2019). A key variable in the debris-flow probability model is the proportion of upslope area burned at moderate to high soil burn severity on slopes ≥23° (Staley et al., 2016, 2017). Sixteen percent of the Museum Fire burn scar burned at moderate to high soil burn severity on slopes ≥23° (Figure 1; Supplementary Figure 1). Due to increased post-wildfire debris flow probability, seismometers were deployed within the burn area early August 2019 as soon as it was deemed safe to enter the burn area, and kept in place until November 2019. Monsoon season 2019 was the driest on record for Flagstaff at the time with the city only receiving 52.83 mm of rain (National Weather Service, 2019). Due dry monsoon season, only two significant rainfall events occurred within the burn area during the 2019 season while stations were operating. At least one earlier debris flow occurred during the fire, too soon to allow us to enter and install instrumentation in the burned area. The lack of debris flows and high-intensity rainfall during the 2019 season left significant volumes of unconsolidated sediment stored within the burned drainages (e.g., Nyman et al., 2020). Given the high likelihood of detecting additional debris flows, thirteen seismometers were deployed within the same area in June and July 2020 and were kept in place until October 2020. The 2020 monsoon season was the driest on record, overtaking the previous year with only 45.21 mm of rain (National Weather Service: Flagstaff Pulliam Airport). Small-magnitude debris flows occurred during a rainfall event on July 24th and were the only post-fire debris flows produced during the 2020 monsoon.
In addition to the seismic observations, other data types collected include precipitation measurements, downstream discharge, photo monitoring of debris flows, and hillslope infiltration measurements. These data can be used in conjunction with seismic data in order to better calibrate the seismic observations allowing for accurate determination of debris flow magnitude, velocity, and grain size distribution. Given the importance of these data for interpreting the seismic results, we also archive these data and make them publicly available through online databases where existing infrastructure exists or upon request where it does not. Below we present data from one major rainfall events and demonstrate some of the type of analyses useful for debris flow characterization.
The seismic data consist of raw continuous time series and information on instrument responses that can be used to convert instrument data to ground motion. The purpose of these data are to characterize sediment transport and triggering in post-wildfire debris flows associated with the Museum Fire. Future uses of these data include estimating the magnitude, velocity, location, and grain size of debris flows. This can be accomplished by measuring signal amplitude, frequency content, and timing of events recorded at multiple stations.
Continuous seismic data were collected while stations were installed. Data collection occurred from August 2019 to October 2020, with most station removed during winter 2019–2020 and redeployed in June 2020. Data recorded by these seismometers are publicly available from the Incorporated Research Institutions for Seismology (IRIS) Data Management Center (DMC) database (https://doi.org/10.7914/SN/1A_2019). The name of the network is “Seismic monitoring of post-fire debris flows in northern Arizona” and it has the FDSN (International Federation of Digital Seismograph Networks) code: 1A (2019–2020) (Porter, 2019).
Stations were deployed along drainages within the burn area that were deemed most likely to produce debris flows. As the goal of the experiment was to record debris flows associated with the wildfire, priority was placed on deploying instrumentation in close proximity to drainages and keeping instrumentation safe rather than selecting sites likely to have low seismic noise, good coupling to the ground, and open sky views for powering the stations via solar panels. As such, seismometers were often deployed in shallow holes along steep drainages, where digitizer boxes were wired to trees to keep them from sliding downslope. Placing them next to trees also served to protect them from sediment and rocks moving downslope and from wood mulch dropped from helicopters during heli-mulching operations for reducing erosion risk. This led to increased station noise due to wind in trees and shallow burial. The decision to deploy instrumentation next to trees also led to power issues as days got shorter later in the year. Shade from the trees limited the amount of sunlight the solar panels received, which led to power failure and downtime for individual stations during the 2019. For the 2020 deployment, larger solar panels were used, where possible, to prevent power failure.
The seismic network consisted of a combination of Sercel L-22 geophones loaned to the project by IRIS PASSCAL (Portable Array Seismic Studies of the Continental Lithosphere) and Nanometrics Meridian Post hole systems, which use Nanometrics Trillium Compact 120s seismometers. The Nanometrics instruments are owned by Northern Arizona University. The L-22 instruments were 3-channel short-period instruments with flat phase and magnitude responses at frequencies >2 Hz. The Trillium Compact sensors are broadband sensors with relatively flat phase and instrument response between 0.008 and 108 Hz. The L-22 instruments were deployed using the IRIS PASSCAL BIHO quick-deploy boxes and the Meridian Compacts use the Nanometrics quick-deploy boxes. Maps of station locations and information on instrument types are available with the archived data (https://doi.org/10.7914/SN/1A_2019, Figure 1).
In addition to studying debris flows, the data recorded by this seismic network are suitable for determining local earthquake locations and focal mechanisms and for seismic imaging studies. The network recorded a local, magnitude 3.3 event on October 13, 2020. The L-22 instruments are limited to studies that only require high-frequency (>2 Hz) seismic data while the Meridian Compact data is useful for work requiring longer periods. The stations were deployed within Northern Arizona's San Francisco Volcanic Field, specifically on Mount Elden and the Dry Lake Hills, which are lava domes (Holm, 1988). Data from these instruments may be useful for seismic analysis of the subsurface geology beneath these volcanic features using techniques such as receiver functions.
Other data that were collected include rainfall data recorded by a network of radio-telemetered rain gauges operated by the City of Flagstaff and Coconino County. These gauges are triggered with every 1 mm of rainfall and data are publicly available (https://www.flagstaff.az.gov/4111/Rainfall-and-Stream-Gauge-Data) with historical data available on request. The city also operated two stream gauges within the alluvial fan of SAWW, these gauges consist of a continuously operating pressure transducer and a radio telemetry unit operating under the National Hydrology Council ALERT 1 protocol (National Weather Service, 2012). Streamflow data is available on request to the City of Flagstaff Stormwater Section. Soil infiltration measurements were collected on bare mineral soil with moderate to severe burn severity using a mini disk tension infiltrometer (https://www.metergroup.com/environment/products/mini-disk-infiltrometer/) with a suction rate of 1 cm (Robichaud et al., 2008). Water volume (mL) infiltrated and time of infiltration were recorded. Infiltration measurements were converted to field saturated hydraulic conductivity (Kfs) using curve fitting techniques described by Vandervaere et al. (2000), and empirical coefficients for sandy loam soil from Carsel and Parrish (1988). A summary of these measurements is provided in the Supplementary Material. Motion-activated game cameras were installed on trees in many of the drainages monitored by the seismic network. These were deployed to photograph debris flows as they occurred to compare to seismic observations. Game camera photos/videos will be made available upon request.
Approximately eight debris flows during three rainfall events were recorded by this network during the 2019 and 2020 monsoon seasons. As an example of the data collected, we show preliminary data analysis for an event that occurred on July 24, 2020. This event occurred during a monsoonal storm which concentrated in the northern portion of the burn area. During this storm, the Museum Fire North rain gauge, which experienced the greatest rainfall, recorded ~18 mm of rain over an hour. This rainfall produced several (>3) small debris flows that initiated in the area denoted by the red oval in Figure 1. The peak 15 min intensity of this storm recorded at the Museum Fire North rain gauge was ~49 mm/h. Debris flow hazard analysis was modeled for intensities up to 40 mm/h for 15 min intervals for stream segments within the burn area. The calculated likelihood of debris flows for this type of event were estimated between 40 and 100% for the segments affected by the storm (Kean et al., 2019). An examination of debris flow deposits showed that, within the upper drainages, grain size ranged from boulders to cobbles, and in the lower drainage, grain size was dominated by very coarse sand to medium gravel (after Wentworth grain size classification). The upper limit to the boulder clasts was ~1 m. Figure 2 shows an example of debris flow deposits from the upper drainage. Downstream discharge peaked at 0.34 cms (12 cfs) at the first road crossing within the city. The upstream gauge, located near the seismic station and at the base of the SAWW mountain channel constraint, clogged with sediment but had high water marks indicating flow between 3 and 6 cms. Much of the transmission loss between the gauges was likely due to groundwater infiltration in the alluvial fan of SAWW and Dry Lake Hills (more geologic context in Holm, 2019).
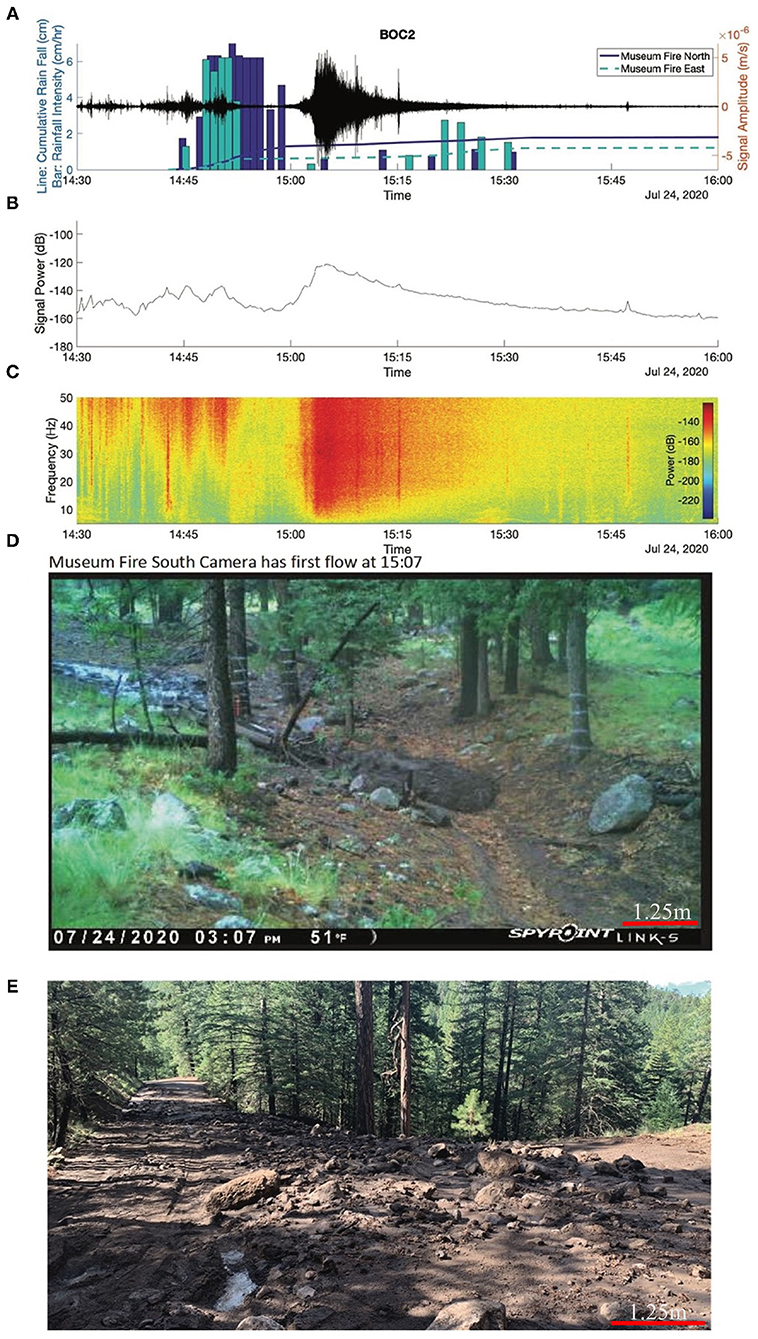
Figure 2. (A) Ground velocity from seismic station BOC2 and rain gauge data from Museum Fire North and Museum Fire East gauges for event on July 24, 2020. (B) Signal power in dB (m/s)2. (C) Power spectral density plot. Power is in dB (m/s)2/Hz. (D) Game camera image of the mudflow arriving at camera location at 15:07. All times are presented in local time (Mountain Standard Time). (E) Photo of upper-basin debris flow deposits from this event.
While this debris flow event was recorded at multiple stations, we highlight data from one station, BOC2, which was located in the lower drainage near a monitoring camera. BOC2 was located on a bedrock outcrop adjacent to the channel. It was downstream of the confluences of the small drainages, where debris flows initiated, and the main stem of the SAWW (Figure 1). To process the seismic data, we deconvolved the seismometer instrument response from the signal to convert the raw data (in voltages) to ground velocity, leaving the source-time function and Green's function. We then used the ground velocity data to calculate total signal power, and power spectral density (Figure 2). The top panel shows ground velocity (m/s), as well as, rainfall amount (mm) and intensity (mm/hr) over 10 min increments. The second panel shows signal power and the third shows the power-spectral density [dB (m/s)2/Hz] at frequencies between 1 and 50 Hz.
A seismic signal consists of the convolution of three components, the source-time function, the Green's function, and instrument's response. The source-time function, in this case, is the signal due to the debris flow's propagation through the channel, the Green's function is the seismic response to the earth's structure, and the instrument response is how the seismic instrument converts ground motion to voltages. The instrument response is removed in the initial processing leaving the source-time function and Green's function. One of the challenges in analyzing debris flows using seismic data is separating the Green's function and source time function, both of which may change as sediment is removed or deposited. Further analysis of this is a target for future work. Near BOC2, the channel bottom was covered in sediment with no bedrock exposures in the channel in the immediate vicinity of the station. Much of the coarse sediment within the flow had been deposited above the station and the signal is largely due to mudflow (Figure 2). Signals associated with debris flows excite a wide range of frequencies (Figure 2) but start abruptly and taper off gradually, consistent with those observed by Michel et al. (2019). High frequencies observed prior to the debris flows are likely due to rain and wind, while the debris flow excited a wider-range of frequencies. We also observe impulsive signals that excite a wide-range of frequencies prior to the debris flow arrival at the station, these correlate well with the timing of lightning strikes and are likely recordings of thunder. We compare our results to Michel et al. (2019) who present power spectral density plots for debris flows that occurred in the Chalk Cliffs, Colorado and Van Tassel, California. The Chalk Cliffs channel bottom consisted of bedrock, while the Van Tassel was sediment covered. At site BOC2, we see similarity in frequency content between the July 24, 2020 event and high sediment concentrated flows at both the Chalk Cliffs and Van Tassel between 10 and 40 Hz. Based on our observations and the work of Michel et al. (2019), the 10–40 Hz range appears to be the best frequency range for determining flow grain size independent of site affects, though future work is needed to confirm this.
In this submission we present several datasets collected to study post-wildfire debris flow triggering and evolution. The goal of this submission is to make these data including seismic, photographic, rainfall, and infiltration measurements publicly available to any interested party. These observations provide a comprehensive dataset to study debris flow triggering, grain size, and velocity, as well as, a tool for better assessing the efficacy of using seismic readings for post-wildfire monitoring. We encourage their use by the scientific community and general public.
The datasets generated for this study can be found in online repositories. The names of the repository/repositories and accession number(s) can be found below: https://doi.org/10.7914/SN/1A_2019, https://www.flagstaff.az.gov/4111/Rainfall-and-Stream-Gauge-Data.
RP led the project including the field data collection, archival effort, wrote the data processing codes, and prepared manuscript text and figures. TJ helped lead the project and contributed to data collection and manuscript preparation. RB led monitoring of surface changes. JL provided FLO-2D flood models from JEF and additional game camera photos. JS was responsible for the first field season. AL was responsible for the second field season and data archival. AY contributed to site selection and preliminary data interpretation. ES assisted with the initial field work and ran the City of Flagstaff rain gauge network. PR contributed to data interpretation and led additional surface monitoring efforts. AS provided project and manuscript advice and review. All authors contributed to the article and approved the submitted version.
The funding for this project was provided by a National Science Foundation Grant: RAPID: Seismic Monitoring of Post-Fire Debris Flows Associated with the Museum Fire, Northern Arizona EAR 1946321, the US Department of Agriculture, Forest Service, Coconino National Forest (20-CS-11030400-101), the City of Flagstaff, AZ and Coconino County, AZ.
JL was employed by the company JE Fuller Hydrology and Geomorphology, Inc.
The remaining authors declare that the research was conducted in the absence of any commercial or financial relationships that could be construed as a potential conflict of interest.
The reviewer JK declared a past co-authorship with several of the authors AY and PR to the handling editor.
We appreciate and acknowledge training and equipment loaned from IRIS PASSCAL and logistic and access provided by the US Department of Agriculture, Forest Service, and Coconino National Forest.
The Supplementary Material for this article can be found online at: https://www.frontiersin.org/articles/10.3389/feart.2021.649938/full#supplementary-material
Allstadt, K. E., Farin, M., Lockhart, A. B., McBride, S. K., Kean, J. W., Iverson, R. M., et al. (2019). “Overcoming barriers to progress in seismic monitoring and characterization of debris flows and lahars,” in Proceedings of the Seventh International Conference on Debris-Flow Hazards Mitigation (Golden, CO) (2019). Available online at: https://Hdl.Handle.Net/11124/173051
Bessason, B., Eiríksson, G., Thorarinsson, Ó., Thórarinsson, A., and Einarsson, S. (2017). Automatic detection of avalanches and debris flows by seismic methods. J. Glaciol. 53, 461–472. doi: 10.3189/002214307783258468
Burtin, A., Bollinger, L., Cattin, R., Vergne, J., and Nábělek, J. L. (2009). Spatiotemporal sequence of Himalayan debris flow from analysis of high-frequency seismic noise. J. Geophys. Res. Solid Earth Planets 114, 410–416. doi: 10.1029/2008JF001198
Burtin, A., Bollinger, L., Vergne, J., Cattin, R., and Nábělek, J. L. (2008). Spectral analysis of seismic noise induced by rivers: a new tool to monitor spatiotemporal changes in stream hydrodynamics. J. Geophys. Res. Solid Earth Planets 113, 911–914. doi: 10.1029/2007JB005034
Burtin, A., Cattin, R., Bollinger, L., Vergne, J., Steer, P., Robert, A., et al. (2011). Towards the hydrologic and bed load monitoring from high-frequency seismic noise in a braided river: the “torrent de St Pierre”, French Alps. J. Hydrol. 408, 43–53. doi: 10.1016/j.jhydrol.2011.07.014
Burtin, A., Hovius, N., Milodowski, D. T., Chen, Y.-G., Wu, Y.-M., Lin, C.-W., et al. (2013). Continuous catchment-scale monitoring of geomorphic processes with a 2-D seismological array. J. Geophys. Res. Earth Surf. 118, 1956–1974. doi: 10.1002/jgrf.20137
Carsel, R. F., and Parrish, R. S. (1988). Developing joint probability distributions of soil water retention characteristics. Water Resour. Res. 24, 755–769. doi: 10.1029/WR024i005p00755
Coviello, V., Arattano, M., Comiti, F., Macconi, P., and Marchi, L. (2019). Seismic characterization of debris flows: insights in to energy radiation and implications for warning. J. Geophys. Res. Earth Surf. 12, 4870–4824. doi: 10.1029/2018JF004683
Gartner, J. E., Cannon, S. H., and Santi, P. M. (2014). Empirical models for predicting volumes of sediment deposited by debris flows and sediment-laden floods in the transverse ranges of southern California. Eng. Geol. 176, 45–56. doi: 10.1016/j.enggeo.2014.04.008
Hereford, R. (2007). Climate Variation at Flagstaff, Arizona-1950 to 2007. U.S. Geological Survey Open-File Report 2007-1410, 17.
Holm, R. F. (1988). Geologic map of San Francisco Mountain, Elden Mountain, and Dry Lake, Hills, Coconino County, Arizona. USGS.
Holm, R. F. (2019). Geology of Flagstaff and Geologic History of Rio de Flag, Northern Arizona With Trail Guides to Geology along Rio de Flag. Arizona Geological Survey Scientific Report Series.
Jurwitz, L. R. (1953). Arizona's two-season rainfall pattern. Weatherwise 6, 96–99. doi: 10.1080/00431672.1953.9932951
Kean, J. W., Coe, J. A., Coviello, V., Smith, J. B., McCoy, S. W., and Arattano, M. (2015). Estimating rates of debris flow entrainment from ground vibrations. Geophys. Res. Lett. 42, 6365–6372. doi: 10.1002/2015GL064811
Kean, J. W., Staley, D. M., and Kostelnik. (2019). Emergency Assessment of Post-Fire Debris-Flow Hazards. Coconino National Forest, AZ: Museum Fire. Available online at: https://landslides.usgs.gov/hazards/postfire_debrisflow/detail.php?objectid=255 (accessed 12 March, 2021).
Lai, V. H., Tsai, V. C., Lamb, M. P., Ulizio, T. P., and Beer, A. R. (2018). The seismic signature of debris flows: flow mechanics and early warning at Montecito, California. Geophys. Res. Lett. 45, 5528–5535. doi: 10.1029/2018GL077683
McGuire, L. A, Rengers, F. K, Kean, J. W, Staley, D. M, and Mirus, B. B. (2018). Incorporating spatially heterogeneous infiltration capacity into hydrologic models with applications for simulating post-wildfire debris flow initiation. Hydrol. Process. 32, 1173–1187. doi: 10.1002/hyp.11458
Michel, A., Kean, J. W., Smith, J. B., Allstadt, K. E., Coe, J. A., et al. (2019). “Taking the pulse of debris-flows: extracting debris-flow dynamics from good vibrations in southern California and central Colorado,” in Seventh International Conference on Debris-Flow Hazards Mitigation-Proceedings (Golden, CO).
Mueller, S. E., Thode, A. E., Margolis, E. Q., Yocom, L. L., Young, J. D., and Iniguez, J. M. (2020). Climate relationships with increasing wildfire in the southwestern US from 1984 to 2015. For. Ecol. Manage. 460:117861. doi: 10.1016/j.foreco.2019.117861
Museum Fire BAER Team (2019). Museum Fire Burned Area Emergency Response (BAER) Executive Summary. https://inciweb.nwcg.gov/photos/AZCOF/2019-08-01-1143-Museum-Fire-BAER-Info/related_files/pict20190708-121416-0.pdf. (accessed March 2, 2020).
National Weather Service. (2012). Flood Warning System Manual. NOAA. Available online at: https://www.hsdl.org/?viewanddid=818329 (accessed December 22, 2020).
National Weather Service. Southwest Monsoon 2019 Review (2019). Available online at: https://www.weather.gov/psr/SouthwestMonsoon2019Review (accessed March 10, 2021).
Neary, D. G., Koestner, K. A., Youberg, A., and Koestner, P. E. (2012). Post-fire rill and gully formation, Schultz Fire 2010 Arizona, USA. Geoderma 191, 97–104. doi: 10.1016/j.geoderma.2012.01.016
North, M. P., Stephens, S. L., Agee, J. K., Aplet, G., and Franklin, J. F. (2015). ENVIRONMENTAL SCIENCE. Reform forest fire management. Science 349, 1280–1281. doi: 10.1126/science.aab2356
Nyman, P., Box, W. A. C., Stout, J. C., Sheridan, G. J., Keesstra, S. D., Lane, P. N. J., et al. (2020). Debris-flow-dominated sediment transport through a channel network after wildfire. Earth Surf. Process. Landforms 45, 1155–1167. doi: 10.1002/esp.4785
O'Donnell, F. C., Flatley, W. T., Springer, A. E., and Fulé, P. Z. (2018). Forest restoration as a strategy to mitigate climate impacts on wildfire, vegetation, and water in semiarid forests. Ecol. Appl. 28, 1459–1472. doi: 10.1002/eap.1746
Parks, S. A., Miller, C., Parisien, M.-A., Holsinger, L. M., Dobrowski, S. Z., and Abatzoglou, J. (2015). Wildland fire deficit and surplus in the western United States, 1984-2012. Ecosphere 6, 1–13. doi: 10.1890/ES15-00294.1
Porter, R. (2019). Seismic Monitoring of Post-fire Debris Flows in Northern Arizona [Data Set]. International Federation of Digital Seismograph Networks.
Robichaud, P. R., Lewis, S. A., and Ashmun, L. E. (2008). New Procedure for Sampling Infiltration to Assess Post-Fire Soil Water Repellency. Research Note. RMRS-RN-33. Fort Collins, CO: U.S. Department of Agriculture, Forest Service, Rocky Mountain Research Station, 14.
Roth, D. L., Brodsky, E. E., Finnega, N., Rickenmann, D., Turowski, J., and Badoux, A. (2016). Bed load sediment transport inferred from seismic signals near a river. J. Geophys. Res. Solid 121, 725–747. doi: 10.1002/2015JF003782
Schmandt, B., Aster, R. C., Scherler, D., Tsai, V. C., and Karlstrom, K. (2013). Multiple fluvial processes detected by riverside seismic and infrasound monitoring of a controlled flood in the Grand Canyon. Geophys. Res. Lett. 40, 4858–4863. doi: 10.1002/grl.50953
Singleton, M. P., Thode, A. E., Sánchez Meador, A. J., and Iniguez, J. M. (2019). Increasing trends in high-severity fire in the southwestern USA from 1984 to 2015. For. Ecol. Manage. 433, 709–719. doi: 10.1016/j.foreco.2018.11.039
Staley, D. M., Negri, J. A., Kean, J. W., Laber, J. L., Tillery, A. C., and Youberg, A. M. (2017). Prediction of spatially explicit rainfall intensity-duration thresholds for post-fire debris-flow generation in the western United States. Geomorphology 278, 149–162. doi: 10.1016/j.geomorph.2016.10.019
Staley, D. M., Negri, J. A., Kean, J. W., Tillery, A. C., and Youberg, A. M. (2016). Updated logistic regression equations for the calculation of post-fire debris-flow likelihood in the western United States. U.S. Geological Survey Open-File Report 2016-1106, 13. Available online at: https://pubs.usgs.gov/of/2016/1106/.
Stempniewicz, V. A. (2014). Evaluating Erosion Risk Mitigation Due to Forest Restoration Treatments Using Alluvial Chronology and Hydraulic Modeling. M.S. Thesis, Northern Arizona University, Flagstaff, AZ.
Suriñach Cornet, E., Vilajosana Guillén, I., Khazaradze, G., Biescas Górriz, B., Furdada i Bellavista, G., and Vilaplana, J. M. (2005). Seismic detection and characterization of landslides and other mass movements. Nat. Hazards Earth Syst. Sci. 5, 791–798. doi: 10.5194/nhess-5-791-2005
Tang, H., McGuire, L. A, Rengers, F. K., Kean, J. W., Staley, D. M., Smith, J. B., et al. (2019). Evolution of debris-flow initiation mechanisms and sediment sources during a sequence of postwildfire rainstorms. JGR Earth Surf. 124, 1572–1595. doi: 10.1029/2018JF004837
Tsai, V. C., Minchew, B., Lamb, M. P., and Ampuero, J.-P. (2012). A physical model for seismic noise generation from sediment transport in rivers. Geophys. Res. Lett. 39:L02404. doi: 10.1029/2011GL050255
Vandervaere, J., Vauclin, M., and Elrick, D. E. (2000). Transient flow from tension infiltrometers: I. The two-parameter equation. Soil Sci. Soc. Am. J. 64, 1263–1272. doi: 10.2136/sssaj2000.6441263x
Keywords: debris flow, wildfire, seismic monitoring, natural hazard, mass wasting, sediment transport
Citation: Porter R, Joyal T, Beers R, Loverich J, LaPlante A, Spruell J, Youberg A, Schenk E, Robichaud PR and Springer AE (2021) Seismic Monitoring of Post-wildfire Debris Flows Following the 2019 Museum Fire, Arizona. Front. Earth Sci. 9:649938. doi: 10.3389/feart.2021.649938
Received: 05 January 2021; Accepted: 22 March 2021;
Published: 13 April 2021.
Edited by:
Biswajeet Pradhan, University of Technology Sydney, AustraliaReviewed by:
Bin Yu, Chengdu University of Technology, ChinaCopyright © 2021 Porter, Joyal, Beers, Loverich, LaPlante, Spruell, Youberg, Schenk, Robichaud and Springer. This is an open-access article distributed under the terms of the Creative Commons Attribution License (CC BY). The use, distribution or reproduction in other forums is permitted, provided the original author(s) and the copyright owner(s) are credited and that the original publication in this journal is cited, in accordance with accepted academic practice. No use, distribution or reproduction is permitted which does not comply with these terms.
*Correspondence: Ryan Porter, cnlhbi5wb3J0ZXJAbmF1LmVkdQ==; Taylor Joyal, VGF5bG9yLkpveWFsQG5hdS5lZHU=
Disclaimer: All claims expressed in this article are solely those of the authors and do not necessarily represent those of their affiliated organizations, or those of the publisher, the editors and the reviewers. Any product that may be evaluated in this article or claim that may be made by its manufacturer is not guaranteed or endorsed by the publisher.
Research integrity at Frontiers
Learn more about the work of our research integrity team to safeguard the quality of each article we publish.