 Xiaobo Zou
 Daoyang Yuan
 Yanxiu Shao
 Xingwang Liu
 Weipeng Ge1
 Bo Zhang
- 1Lanzhou Institute of Seismology, China Earthquake Administration, Lanzhou, China
- 2School of Earth Sciences, Lanzhou University, Lanzhou, China
- 3Institute of Surface-Earth System Science, Tianjin University, Tianjin, China
The Minle-Yongchang fault is an active reverse fault-related fold structural belt developed in the Hexi Corridor Basin on the northeastern edge of the Tibetan Plateau. An earthquake of Ms6.1 occurred near the Minle-Yongchang fault zone in 2003. The deformation pattern of the Minle-Yongchang fault and its relationship with this strong earthquake, however, are still not well known. In this study, we used the methods of HYPOINVERSE absolute location and double-difference location with waveform cross-correlation technology to relocate the 2003 Minle earthquake sequence. In total, 383 earthquakes are precisely relocated. Based on the results of precise seismic relocation, using the method of determining fault planes by small earthquakes, the seismogenic fault is found to be a low-angle thrust with a strike of 311°, a dip of NE, and a dip angle of 14°. It does not rupture the surface, extends to 19–20 km depth, and is hidden beneath the Yonggu Anticline. We also employed the cut-and-paste (CAP) method with a broadband waveform to determine the focal mechanism of the mainshock in 2003: the strike is 311°; the dip is 34°; and the rake is 90°. The fault plane parameters obtained in these two ways are roughly consistent. We also used a digital elevation model (DEM) derived from the SPOT 6 stereo image pair and high-precision differential Global Positioning System (GPS) to measure the displacement of terraces. Topographic profiles along the terraces across the Minle-Yongchang fault show that high alluvial terrain exhibits fold deformation. The vertical offsets of the T2 and T3 terraces along the Tongziba River are approximately 2.3 and 22 m, respectively. Optically stimulated luminescence (OSL) dating indicates that the ages of T2 and T3 are 11.3 and 106 ka, respectively. We calculated an average uplift rate of 0.21 ± 0.05 mm/a by dividing the vertical offset by age. According to the spatial distribution of the relocated earthquake sequence and terrace deformation in the study area, the Ms6.1 Minle earthquake in 2003 was caused by the latest activity of a blind reverse fault-related fold in the Hexi Corridor Basin.
Introduction
The North Qilian Shan-Hexi Corridor is the active frontal zone of the northward extrusion and expansion of the Tibetan Plateau, and active structures are widely developed in this region (Institute of Geology, State Seismological Bureau, and Lanzhou Institute of Seismology, State Seismological Bureau, 1993; Chen, 2003; Hetzel et al., 2004; Yuan et al., 2004; Zhang et al., 2006; Zheng, 2009; Xu et al., 2010; Zheng et al., 2016). It is one of the main seismotectonic regions in China (Institute of Geology, State Seismological Bureau, and Lanzhou Institute of Seismology, State Seismological Bureau, 1993; Zhang et al., 2003; Zhang et al., 2005; Shao et al., 2011). Historically, many strong earthquakes have occurred in the Hexi Corridor, such as the AD 180 Biaoshi M71/2, AD 756 Zhangye-Jiuquan M7, AD 1609 Hongyapu M71/4, AD 1932 Changma M7.6, and AD 1954 Shandan M71/4 earthquakes (Institute of Geology, State Seismological Bureau, and Lanzhou Institute of Seismology, State Seismological Bureau, 1993; Cao et al., 2010; Xu et al., 2010; Liu et al., 2011; Zheng et al., 2013). In this area, the strong earthquakes mainly occur in deep active fault zones on both sides of the Hexi Corridor Basin but rarely occur in the basin (Institute of Geology, State Seismological Bureau, and Lanzhou Institute of Seismology, State Seismological Bureau, 1993; Xu et al., 2010; Figure 1A). However, the strong Ms6.1 Minle earthquake, which was followed by a smaller earthquake (Ms5.8) after 7 min, occurred in the inner part of the Hexi Corridor in the southern Dahuang Shan (shan means mountain) on October 25, 2003 (He et al., 2004; Zheng et al., 2005). This earthquake indicates that the interior of the Hexi Corridor Basin is not stable (Zheng et al., 2005; Yuan et al., 2006; Zheng, 2009). Previous studies have suggested that the earthquake occurred on the Minle-Yongchang fault, which is buried beneath the Yonggu Anticline in the middle part of the Hexi Corridor (He et al., 2004; Liu, 2004; Zheng et al., 2005; Xin et al., 2008). However, due to the unclear surface features of the active fault, we still do not know much about this active structure and earthquake mechanism.
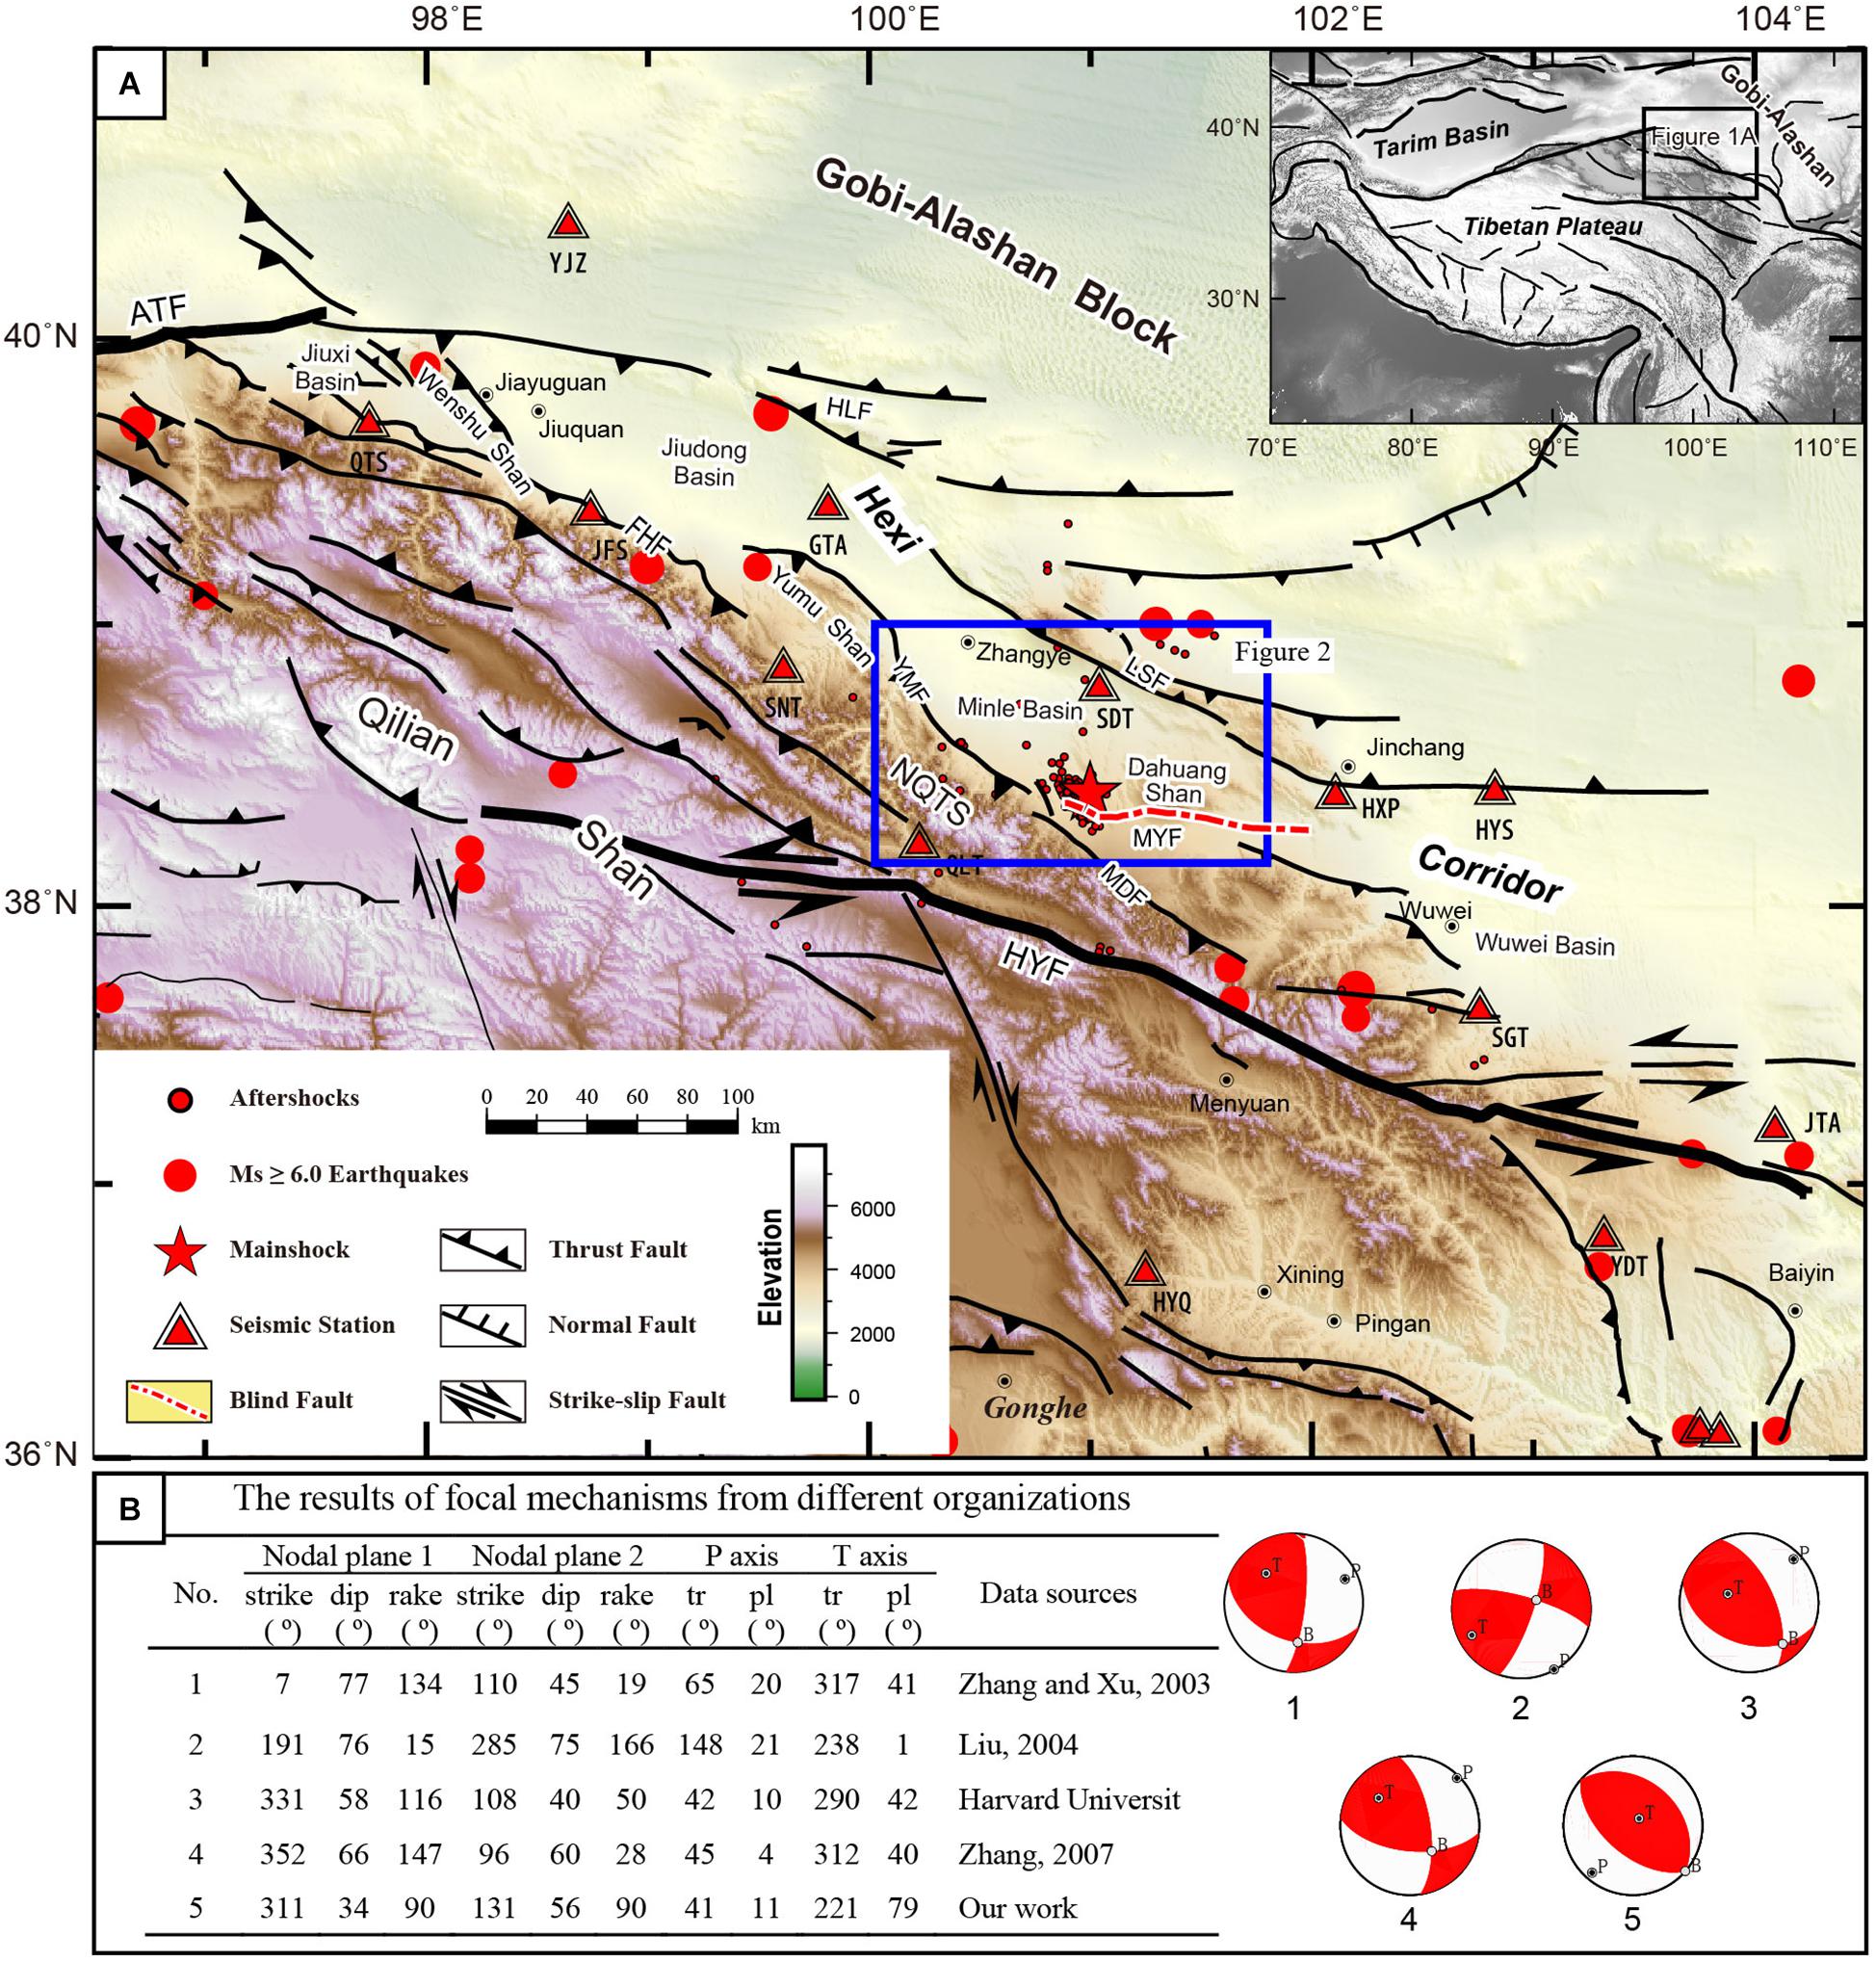
Figure 1. Map of the seismic network, aftershocks, and active tectonics. Historical earthquakes and the 2003 Ms6.1 Minle earthquake sequence are plotted as red circles, and the earthquake sequence of the 2003 Minle earthquake was relocated by us. The recording stations are plotted as red triangles, and the codes below the triangles are station names. The historical earthquake and recent earthquake data are obtained from http://www.csi.ac.cn/ and the Gansu Seismographic Network, respectively. Fault labels in (A) include: NQTS: northern Qilian Shan thrust system; ATF: Altyn-Tagh fault; HYF: Qilian-Haiyuan fault; MYF: Minle-Yongchang fault; FHF: Fudongmiao-Hongyazi fault; YMF: Yumushan fault; MDF: Minle-Damaying fault; LSF: Longshoushan fault; and HLF: Helishan fault. (B) The results for focal mechanisms from different organizations. Focal mechanism solutions are presented in the table, and the corresponding beach balls are plotted on the right. The numbers below the beach balls correspond to the sequence numbers of focal mechanism solutions in the table.
Conducting in-depth and quantitative studies on the active faults inside the foreland basins has great significance (Institute of Geology, State Seismological Bureau, and Lanzhou Institute of Seismology, State Seismological Bureau, 1993; Hetzel et al., 2004; Yuan et al., 2004; Zheng, 2009), as these studies can provide important references for research on continental dynamics, seismic risk determination, and disaster prevention. However, the geometry and kinematics of the Minle-Yongchang fault, especially the quantitative parameters, are debatable (Zhang and Xu, 2003; Liu, 2004; Zhang, 2007; Feng, 2008; Xin et al., 2008; Figure 1B) due to the limitations of previous techniques. For example, the focal mechanism solutions are inconsistent when using different methods. The focal mechanism solution given by Zhang and Xu (2003) is based on eight local Pnl broadband waveforms from the China Digital Seismograph Network (CDSN) and does not make use of the surface waves. Liu (2004) employed P-wave first motions to determine focal mechanism solutions, and the results have great uncertainty due to the uneven distribution of data points on the focal sphere. Harvard University uses only teleseismic P and SH waveforms to invert the source parameters, and the signal-to-noise ratio (SNR) of these waveforms is lower than that of the local Pnl waveforms. Zhang (2007) used the same method and procedure as Zhang and Xu (2003) to invert the focal mechanism but with seven broadband datasets from the Lanzhou Digital Seismic Network (LDSN). Feng (2008) and Xin et al. (2008) employed double-difference location method and genetic algorithm, respectively, to relocate the 2003 Minle earthquake sequence. The genetic algorithm is an absolute location technique that is sensitive to velocity model error. The double-difference location method is a relative location method (Waldhauser and Ellsworth, 2000; Waldhauser, 2001), and its accuracy depends on the accuracy of the initial locations and phase picks. Xin et al. (2008) adopted the velocity model suggested by Li et al. (1998), which is based on natural and artificial seismic data before Global Positioning System (GPS) timing, and the accuracy of the velocity model is affected by timing accuracy. Moreover, the arrival times and initial locations of these studies are obtained from manual phase picks. Therefore, the relocations of the Minle earthquake sequence are not ideal.
The 2003 Minle earthquake can be taken as a typical example for an in-depth analysis of the relationship between tectonic deformation and seismic activity in the Hexi Corridor area. This study comprehensively uses the methods of seismology and geomorphology to analyze and discuss the deep-shallow structural relationship and mechanism of the seismogenic structure of the 2003 Minle earthquake. Based on the structural deformation features of the Yonggu Anticline, the focal mechanism solutions, and the spatial distribution of the relocated earthquake sequence, we concluded that the Minle earthquake occurred in the Minle-Yongchang reverse fault-fold belt in the Hexi Corridor and is a typical blind reverse fault event.
Regional Geological Setting
The Qilian Shan-Hexi Corridor, as the transition zone between the Qilian Shan Block and the Gobi-Alashan Block, is bounded by the Altyn-Tagh fault, Haiyuan fault, and other active block boundary faults. The active faults in this area are mainly thrust faults trending NW and WNW (Yuan et al., 2004; Zheng et al., 2016). The central part of the Hexi Corridor Basin is bounded by the North Qilian thrust belt (composed of the Fodongmiao-Hongyazi fault, the Yumu Shan fault, and the Minle-Damaying fault) in the south and by the southern Heli Shan fault and the Longshou Shan fault in the north. The boundary faults together constitute a ramp structure on the northeastern margin of the Tibetan Plateau (Institute of Geology, State Seismological Bureau, and Lanzhou Institute of Seismology, State Seismological Bureau, 1993; Chen, 2003; Zheng et al., 2016; Figure 1A).
The Hexi Corridor Basin is divided into four subbasins by several NW- and NNW-striking secondary faults that control their uplifts. The subbasins are the Jiuxi Basin, Jiudong Basin, Minle Basin, and Wuwei Basin, which are separated by the Wenshu Shan, Yumu Shan, and Dahuang Shan from west to east. Among them, the Dahuang Shan has the largest uplift area (Institute of Geology, State Seismological Bureau, and Lanzhou Institute of Seismology, State Seismological Bureau, 1993; Zheng, 2009).
The Minle-Yongchang fault is an active reverse fault-fold structural belt located on the southern margin of the Dahuang Shan, and its trend is nearly E-W (Figure 2). This fault can be divided into three segments based on the fault geometry (He et al., 2004; Zheng et al., 2005; Figure 2). The eastern segment (➀ in Figure 2) extends along the front of Yongchang Beishan, and Permian strata has been thrust above middle Pleistocene strata. The middle segment (➁ in Figure 2) has a distinct linear trace along the Dahuang Shan front, and fault scarps occur along the piedmont alluvial–pluvial fans. The western segment (➂ in Figure 2) is the section from Minle to Damaying. In this section, the fault is blind, and the surface deformation is dominated by the folding of the Yonggu Anticline. There is no clear fault trace at the surface except for the linear distribution of ascending springs (He et al., 2004; Zheng et al., 2005). The Ms6.1 and Ms5.8 Minle earthquakes in 2003 and the Quantou Cun (cun means village in Chinese) Ms5.0 earthquake in 1978 were rare strong earthquakes in the interior of the basin (Figure 2), and they all occurred in this section near the Yonggu Anticline. Their occurrences indicate that the western segment of the Minle-Yongchang fault is active and has potential seismic risks.
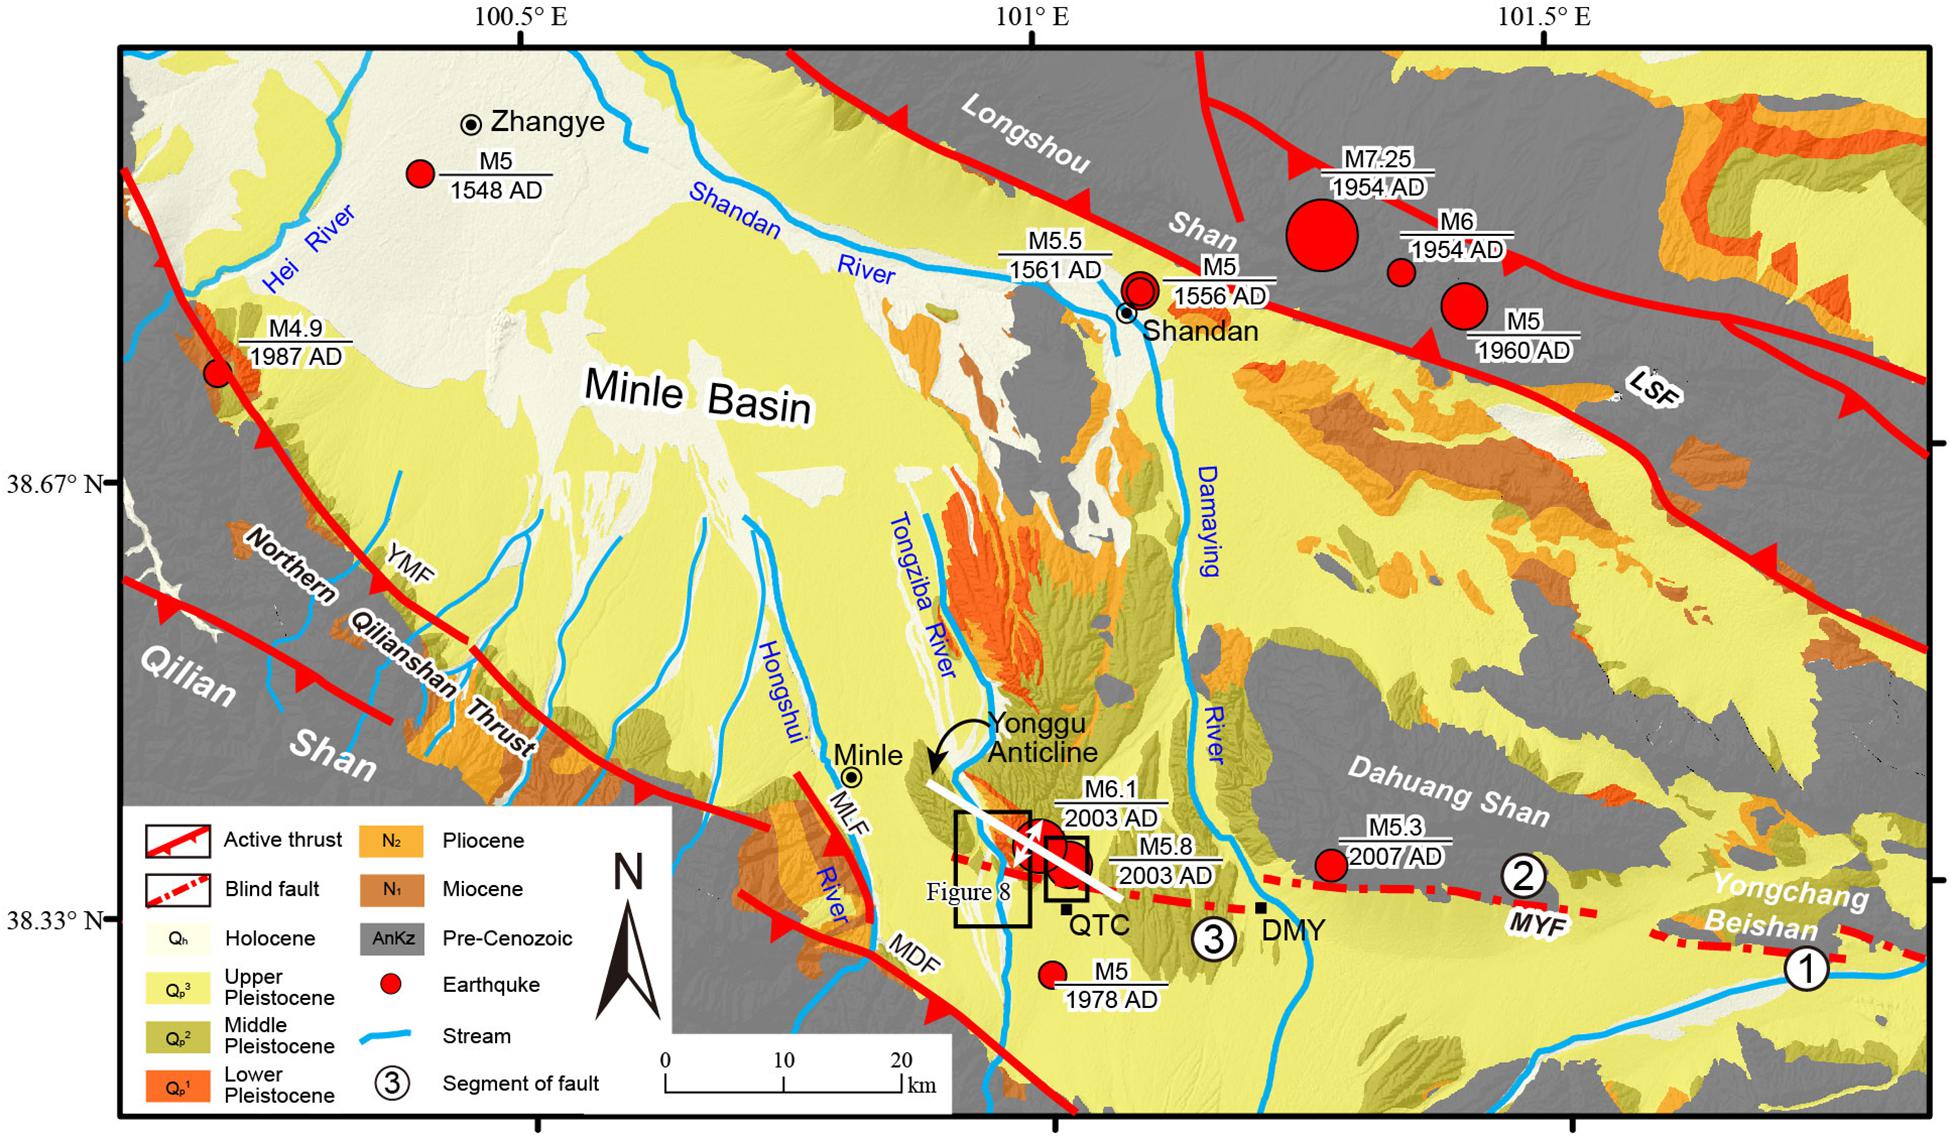
Figure 2. Geological map of the Minle Basin. The strong historical earthquakes are shown as red circles. The data are obtained from http://www.csi.ac.cn/. MYF: Minle-Yongchang fault; YMF: Yumushan fault; MDF: Minle-Damaying fault; MLF: Minle fault; and LSF: Longshoushan fault. Place names: DMY: Damaying; and QTC: Quantou Cun. The segments of the Minle-Yongchang fault:, the eastern segment;, the middle segment; and, the western segment.
Previous studies have shown that there may be blind thrusts under active folds (King and Vita-Finzi, 1981; Stein and King, 1984; Zhang et al., 1994; Xu et al., 2013). The development of folds is mainly controlled by the deep blind thrusts in the compressional structural environments (Stein and King, 1984; Stein and Yeats, 1989; Xu et al., 2013). The nucleation of small earthquakes near hidden faults under folds is a significant sign of folding. This kind of reverse fault-fold belt structure can cause not only moderate earthquakes but also strong earthquakes. However, when earthquakes occur, the surface is deformed by folding, and no surface rupture is formed. This type of earthquake is called a “fold earthquake” (King and Vita-Finzi, 1981; Stein and King, 1984; Stein and Yeats, 1989). The 1980 Mw7.3 El Asnam earthquake in Algeria, the 1983 M6.5 Coalinga earthquake in the United States, the 1906 Manas earthquake in Xinjiang, China, the 2013 Ms7.0 Lushan earthquake in Sichuan, China, and the 2015 Ms6.5 Pishan earthquake in Xinjiang, China are well-known fold earthquakes (King and Vita-Finzi, 1981; Stein and King, 1984; Zhang et al., 1994; Xu et al., 2013; Zhang and Lei, 2013; Yi et al., 2016; Lu et al., 2017; Wu et al., 2017).
The Ms6.1 Minle earthquake in 2003 marked the latest activity of the Minle-Yongchang fault. Its epicenter was located in the Yonggu Anticline area. There were ground fissures of different scales in some parts of the meizoseismal area, and no surface fracture zone was formed (He et al., 2004; Zheng et al., 2005). All these results indicate that this earthquake was likely a blind reverse fault earthquake.
There are not sufficient constraints from quantitative parameters for the Minle-Yongchang fault because most previous studies provide only qualitative descriptions (Institute of Geology, State Seismological Bureau, and Lanzhou Institute of Seismology, State Seismological Bureau, 1993; He et al., 2004; Zheng et al., 2005). Geomorphic parameters and field investigations reveal that terraces across the fault are deformed by folds (Zou et al., 2017; Zhong et al., 2017, 2020). Therefore, we explored the tectonic activity and deformation patterns of typical thrust fault-fold belts in the Hexi Corridor by comprehensive utilization of the geomorphological and seismological methods. These quantitative parameters can play an important role in understanding the role and position of the Minle-Yongchang fault in the structural evolution of the Qilian Shan-Hexi Corridor.
Relocation and Inversion of the Source Parameters
Relocation of the Minle Earthquake Sequence
Two principal sources of error for the location problem are velocity model error and arrival time measurement error. It is established that the double-difference location method together with waveform cross-correlation can greatly reduce both these error sources. The use of travel time differences removes much of the errors from the location problem occurred due to the accuracy of the velocity model and the lateral inhomogeneity of the crustal structure. The waveform cross-correlation can be used to improve the accuracy of travel time differences (Waldhauser and Ellsworth, 2000; Waldhauser, 2001; Schaff et al., 2004).
In this study, a stepwise approach (Long et al., 2015), using the combined strengths of HYPOINVERSE (Klein, 1978), the minimum one-dimensional (1D) model (Kissling et al., 1994, 1995), waveform cross-correlation (Schaff et al., 2004), and the double-difference method (Waldhauser and Ellsworth, 2000; Waldhauser, 2001), is applied to reduce both error sources. With the employment of these methods and multistep relocation, the accuracy is improved step by step. In this flow, the absolute location method HYPOINVERSE and the “minimum 1D” model program VELEST (Kissling et al., 1995) are first used to obtain the initial relocation, and the double-difference method combined with waveform cross-correlation is then adopted for precise relocation. The earthquake observation reports and waveforms from the Gansu Seismographic Network from October 2003 to October 2004 are used in relocation, and approximately 941 events occurred in the study region. We plotted the travel time curves of the P- and S-waves. After eliminating the data deviating obviously from the theoretical travel time curve, we found that the theoretical P-wave to S-wave velocity ratio (VP/VS) is 1.719 (Figure 3A).
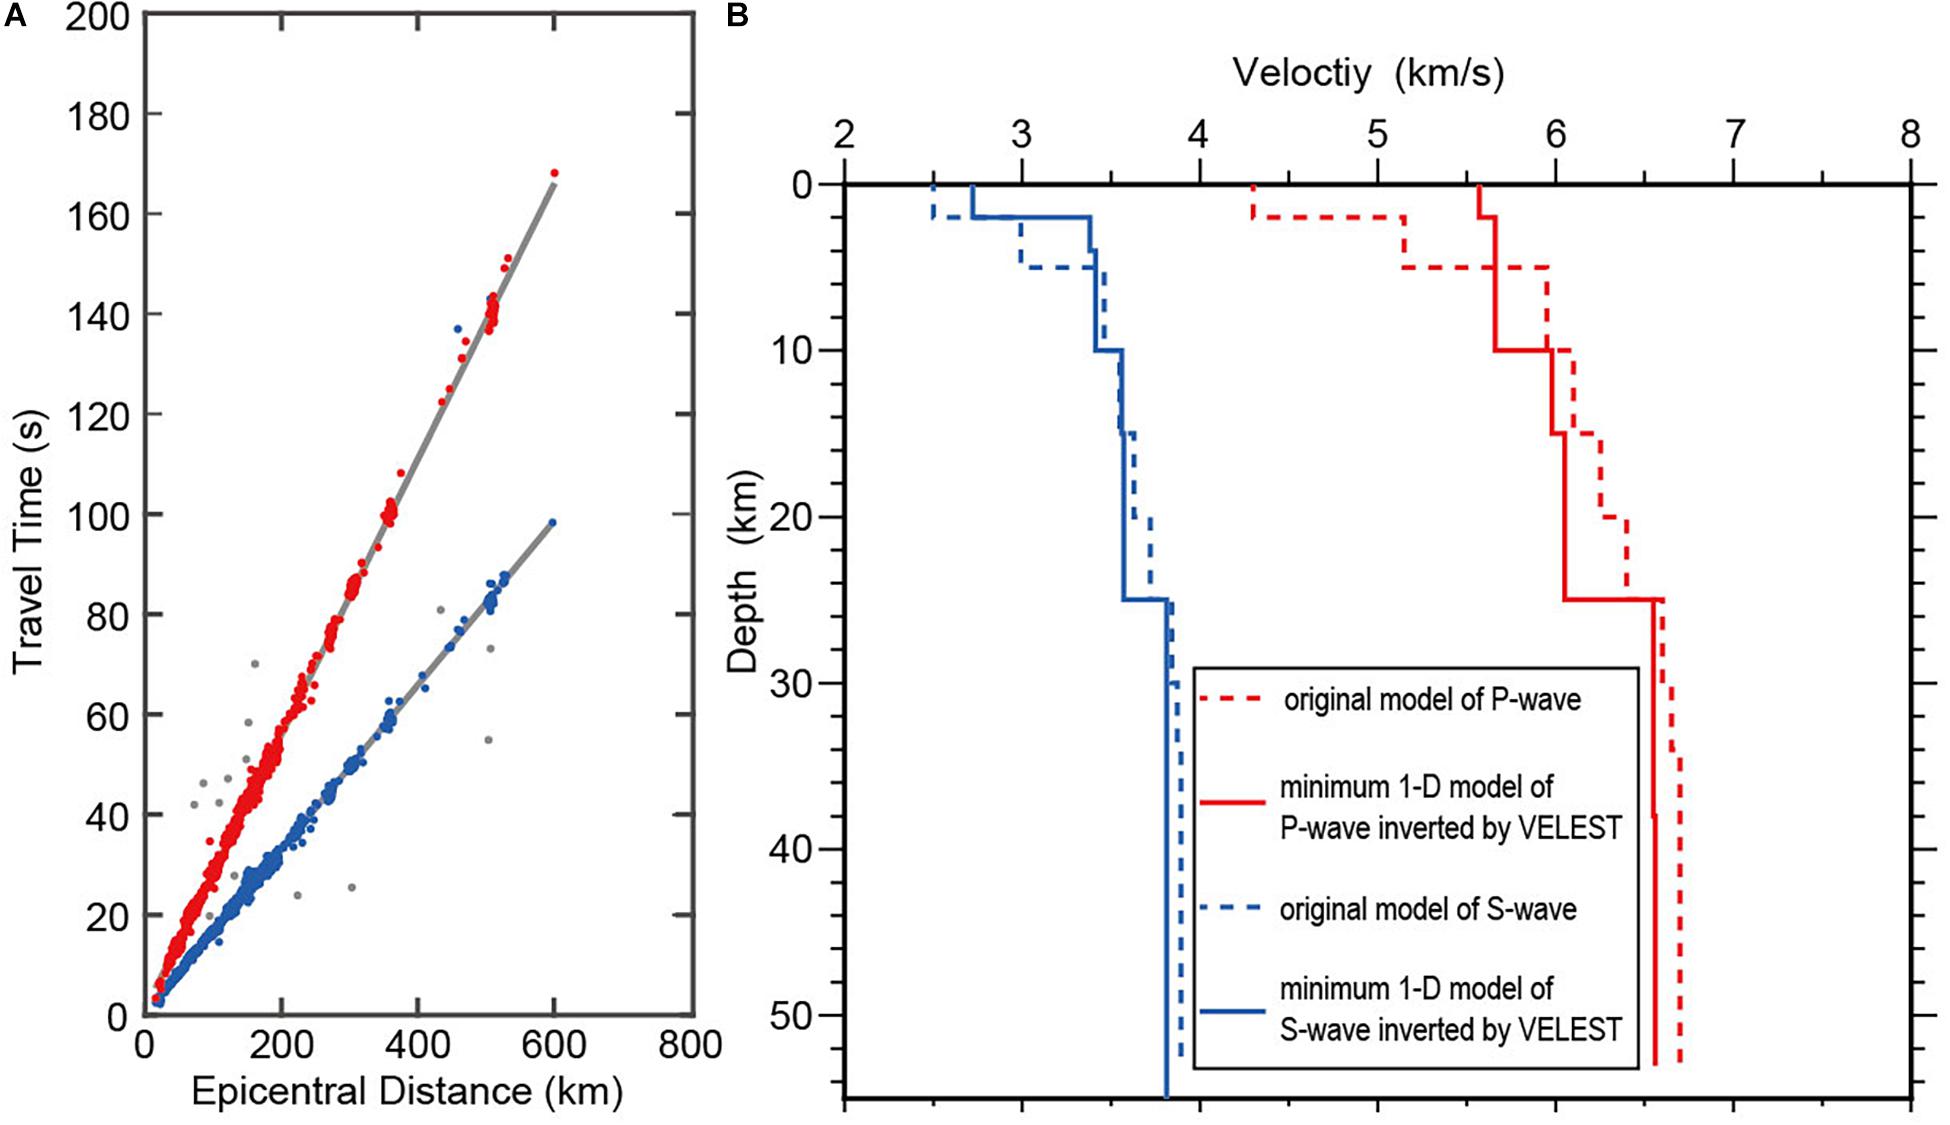
Figure 3. (A) The travel time curves from the catalog. Gray lines are the theoretical travel time curves, and the blue and red dots represent P- and S-waves, respectively. The gray dots obviously deviate from the theoretical travel time curve and are eliminated in fitting the theoretical P-wave to S-wave velocity ratio (VP/VS). (B) The minimum 1D model inverted from Li et al. (1998) model by VELEST in this study. The dashed blue and red lines indicate the a priori models of the P- and S-waves, respectively. The minimum 1D model is shown with solid lines.
The multistep location technique is applied to the Ms6.1 Minle earthquake sequence. First, we obtained the minimum 1D model and initial absolute location. The absolute location program hypo1.411 is used to relocate the earthquakes through the models of the study area (Li et al., 1998; Dong and Zhang, 2007; Yin et al., 2017). According to the travel time residuals of each model, we chose the model suggested by Li et al. (1998) as the priori model. The seismic events with no fewer than five recording stations and an initial error of less than 2 km are selected for inversion, and the minimum 1D model of the P-wave, S-wave, and station correction values is then obtained by the VELEST program (Kissling et al., 1995; Figure 3B). This reference velocity model (including station correction values) is used by HYPOINVERSE (Klein, 1978) for absolute relocation, and this relocation result is the initial location for the HYPODD program (Waldhauser, 2001) to precisely relocate the earthquake sequence.
The travel time differences for pairs of earthquakes at common stations can be obtained from earthquake catalogs (hereafter referred to as catalog data) and/or waveform cross-correlation (cross-correlation data) (Waldhauser, 2001; Schaff et al., 2004; Jiang et al., 2016). The catalog phase data are transformed into input files for HYPODD by Ph2dt. Ph2dt builds links from each event to neighboring events within a search radius defined by MAXSEP (maximum separation between event pairs), and only neighbors linked by more than MINLNK (minimum number of links) phase pairs are considered. In addition to the parameters above, the quality of the phase pairs and connectedness between events are optimized by setting MAXDIST (maximum distance between event and station) and MINOBS (minimum number of observations per event pair). We obtained 25,517 catalog data for 402 earthquakes, including 13,267 P-waves and 12,250 S-waves, with the following parameter settings: MAXSEP = 10 km, MINLNK = 8, MINOBS = 8, and MAXDIST = 300 km.
The cross-correlation data are obtained by waveform cross-correlation in the time domain. When the maximum cross-correlation coefficient is greater than the threshold value (in this study, it is 0.7), the sum of the delay and the travel time difference for pairs yields the cross-correlation data. We used the program SAC to remove the mean and trend, to taper the waveforms, and to filter the waveforms from 1 to 10 Hz. Adopting a P-wave window length of 1.1 s (P-wave front at 0.3 s and P-wave after 0.8 s) and an S-wave window length of 2.0 s (S-wave front at 0.5 s and S-wave after 1.5 s), the waveform cross-correlation of the P- and S-waves in the time domain is carried out to obtain the relative time delay. The travel time differences of event pairs with maximum cross-correlation coefficients greater than 0.7 and three or more stations are used for relocation.
Finally, we obtained 32,197 cross-correlation travel time difference data, which include 17,588 P-waves and 14,609 S-waves. Figures 4A–E shows an example of the waveform cross-correlation results at station SDT. The event pairs generated by cross-correlation have highly similar waveforms, but the phases are not fully aligned, indicating that there are mispicked seismograms in the observation reports (Figure 4B). Figures 4C,D indicates that most of the seismograms are mispicked each by 0.15 s, and the maximum delay is up to 0.8 s. Moreover, S-waves have a greater time delay than P-waves, and compared with the catalog data there are more S-waves than P-waves in cross-correlation data. Figure 4E shows that the distances between event pairs obtained by cross-correlation are relatively close (basically within 5 km) and that the earthquake distribution is more concentrated after relocation.
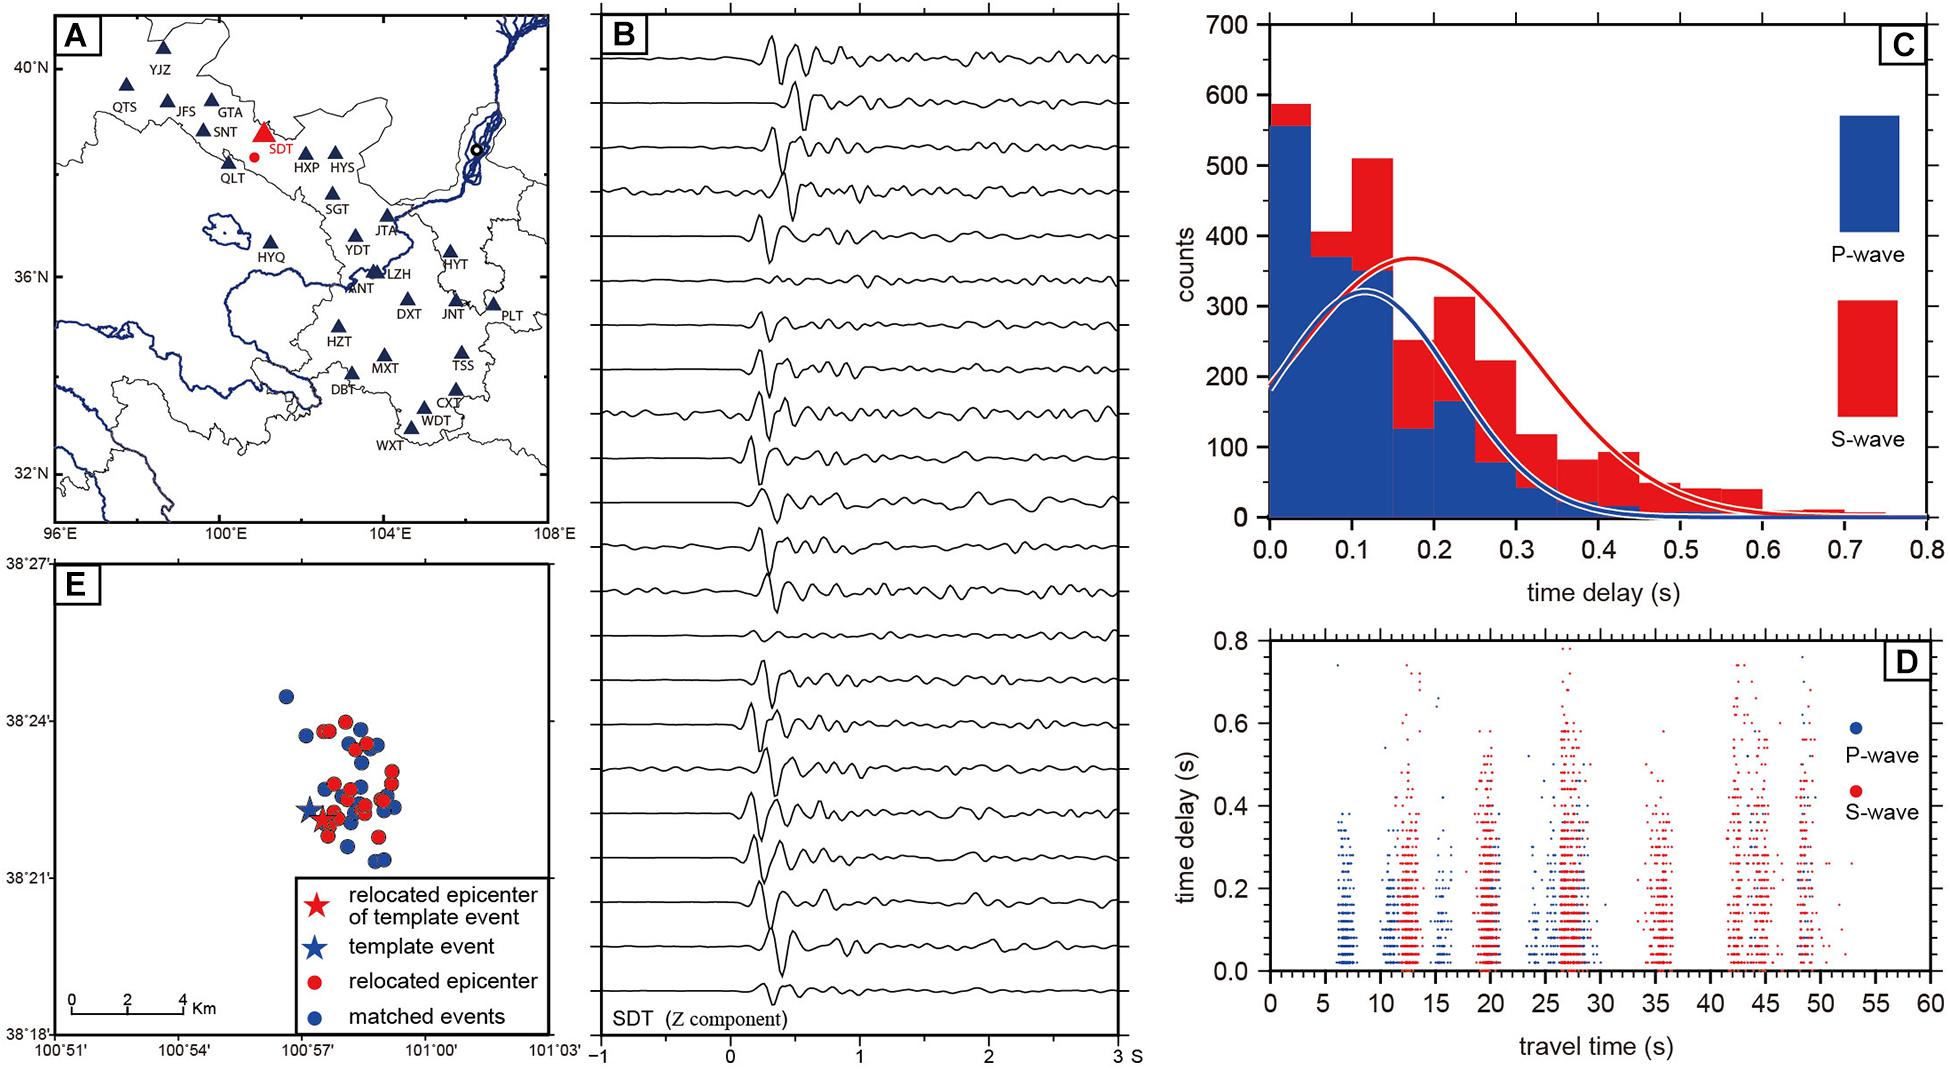
Figure 4. The results of waveform cross-correlation at station SDT. (A) The seismic stations are shown with triangles and labeled with the station codes; the reference station is shown in red. The reference station for this study is SDT, and the template event is shown with a red circle. (B) The waveforms of event pairs from the Minle earthquake sequence recorded at SDT. Note the high similarity of all waveforms, which are sorted by cross-correlation with the template event. Each event waveform serves as a template for cross-correlation analysis to select event pairs in this study. (C) Histogram of time delays. The blue and red bins represent the time delay of P- and S-waves, respectively, and the blue and red lines represent the equivalent normal distributions of P- and S-waves, respectively. (D) Distribution of P- and S-waves time delays as a function of travel time. The blue and red dots represent P- and S-waves, respectively. (E) Relocation of cross-correlation data; the star is the template event, and circles indicate the events matched by waveform cross-correlation. The initial locations are shown in blue, and the relocated positions are shown in red.
The velocity model used in the double-difference location is the minimum 1D velocity model obtained by VELEST (Figure 3B), and the inversion method is the conjugate gradients method (LSQR). We combined the catalog data and cross-correlation data in HYPODD by giving strong weights to catalog data with large separation distances (WDCT) and to cross-correlation data with small separation distances (WDCC). Through the above processes, a total of 57,686 travel time difference data for 402 events (13,267 P-wave and 12,250 S-wave catalog data; 17,573 P-wave and 14,596 S-wave cross-correlation data) are obtained for relocation, and 383 events are relocated, which accounts for 95% of the total. The root-mean-square (RMS) residual for catalog data (RMSCT) decreases from 0.233 to 0.176 s, and that of cross-correlation data (RMSCC) decreases from 0.268 to 0.009 s. The distribution of relocated events is shown in Figure 5. The horizontal distribution of the hypocenters reveals that the location of the mainshock is consistent with the macro-epicenter, and the distribution of aftershocks is consistent with that of the meizoseismal area, showing an NW-trending linear distribution (Figure 5A). The depth profile illustrates that the mainshock and most of the aftershocks are mainly distributed at depths of 19.2–20.6 km, while the distribution of earthquakes with depths above 18 km is relatively dispersed (Figures 5B,C).
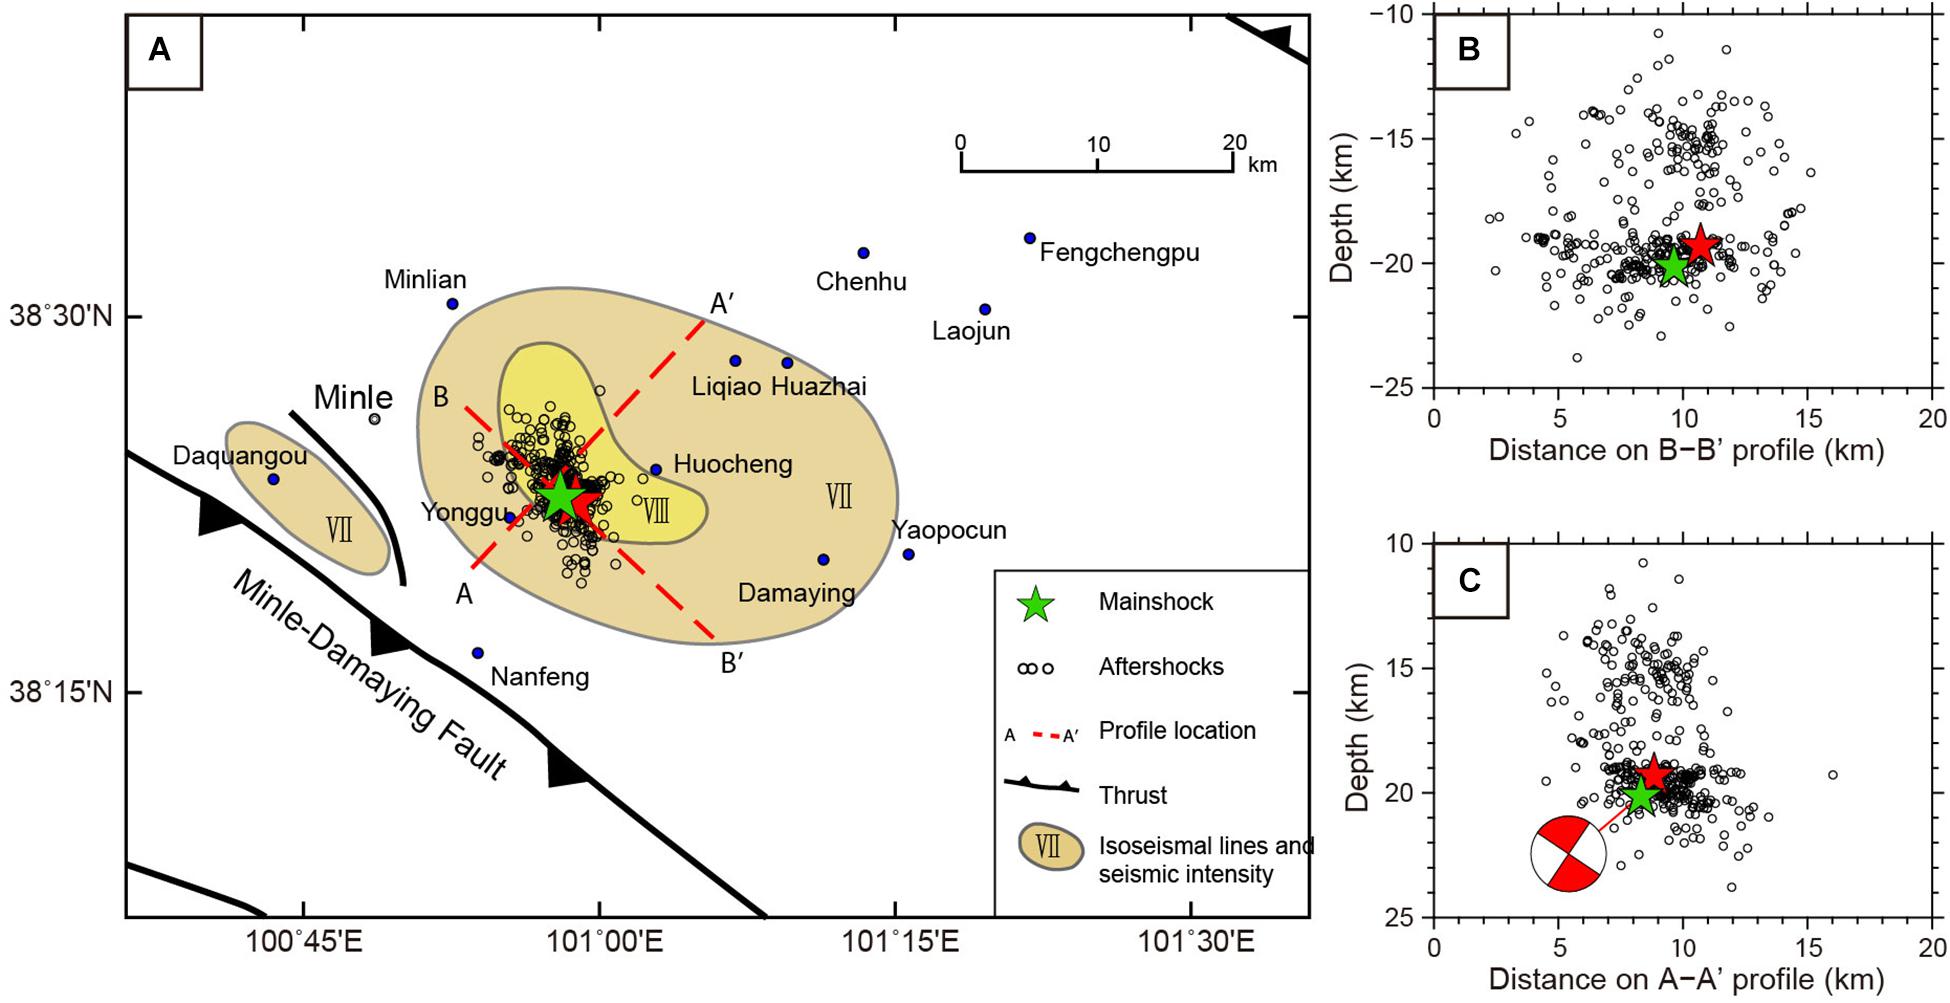
Figure 5. Relocation of the 2003 Minle earthquake sequence by combining the catalog data with waveform cross-correlation data. (A) Map of the relocated epicenter distribution of the Minle earthquake sequence. The colored shapes mark the meizoseismal area of this earthquake, and the seismic intensity is expressed by Roman numerals. The dashed red lines give the surface positions of profiles shown in (B,C). (B) The depth profile along B–B′. (C) The depth profile along A–A′. The hypocenters and the beach balls are projected to profiles; aftershocks are shown by circles; the Ms6.1 mainshock is indicated by a green star; and the Ms5.8 mainshock is indicated by a red star.
Inversion of Focal Mechanism Solution
The classic method employs P-wave first motions to determine focal mechanism solutions. The uneven distribution of the data points on the focal sphere leads to excessive increases or decreases in the weights of uneven data points, and the results have great uncertainty. The cut-and-paste (CAP) method employs full waveform fitting to determine the focal mechanism solution (Zhao and Helmberger, 1994; Zhu and Helmberger, 1996), which makes full use of the advantages of body waves and surface waves and provides rich source information. This method also uses a time shift in waveform fitting, and the uncertainty in the velocity model and the lateral change in crustal structure have minimal influence on the inversion. Therefore, the CAP method has lower requirements for station distribution and the number of stations recorded than the P-wave first motion method. In the CAP method (Zhao and Helmberger, 1994; Zhu and Helmberger, 1996), the waveforms are divided into Pnl waves and surface waves with different weights. The globally optimal solution of fitting the theoretical waveform with the observed waveform is obtained by a grid search algorithm to determine the focal mechanism solution and optimal focal depth.
The observed seismic displacement is represented as u(t), and the synthetic seismogram s(t) of a double-couple source can be expressed as
In this formula, the values of i = 1, 2, and 3 correspond to three fundamental faults: vertical strike slip, vertical dip slip, and 45° dip slip; M_0 is the scalar moment; A_i is the radiation coefficient, and each component is a function of the fault dip angle and relative slip angle: ϕ is the station azimuth angle; θδ and λ represent the strike, dip, and rake of the focal mechanism, respectively, and G_i is Green’s function.
The CAP method finds the minimal residual between observations and synthetic data by using the cross-correlation technique. Due to the time shift, this approach can also reduce the influence of velocity model error. The fitting error function between the observed waveform u(t) and synthetic seismogram s(t) is as follows:
Where r is the epicentral distance and r0is the reference epicentral distance. Generally, we choose r0 = 100 km. p is the weight factor (for a general body wave, p = 1.0; for a surface wave, p = 0.5). The fitting error function adopts the absolute amplitude, introduces the distance influence factor, and gives different weights to different waveforms; it can thus avoid the dominant role of near-station and surface waves, retain abundant source information in the waveforms, and eventually reduce the requirements of velocity models and recording quantity in inversion (Zhu and Helmberger, 1996).
The data used in this study are broadband waveforms with a high SNR within an epicentral distance of 400 km. After eliminating stations with large azimuth deviations of seismometers (Niu and Li, 2011) and then removing the mean, trend, and instrument responses, the waveforms are rotated into R-T-Z components and divided into Pnl waves and surface waves. The Pnl wave is filtered from 0.05 to 0.2 Hz, and the surface wave is filtered from 0.05 to 0.1 Hz. The synthetic seismograms are generated by the frequency-wavenumber (FK) code (Zhu and Rivera, 2002) with the CRUST1.0 model. Finally, the focal mechanism solutions of the mainshock are obtained, as shown in Figure 6A.
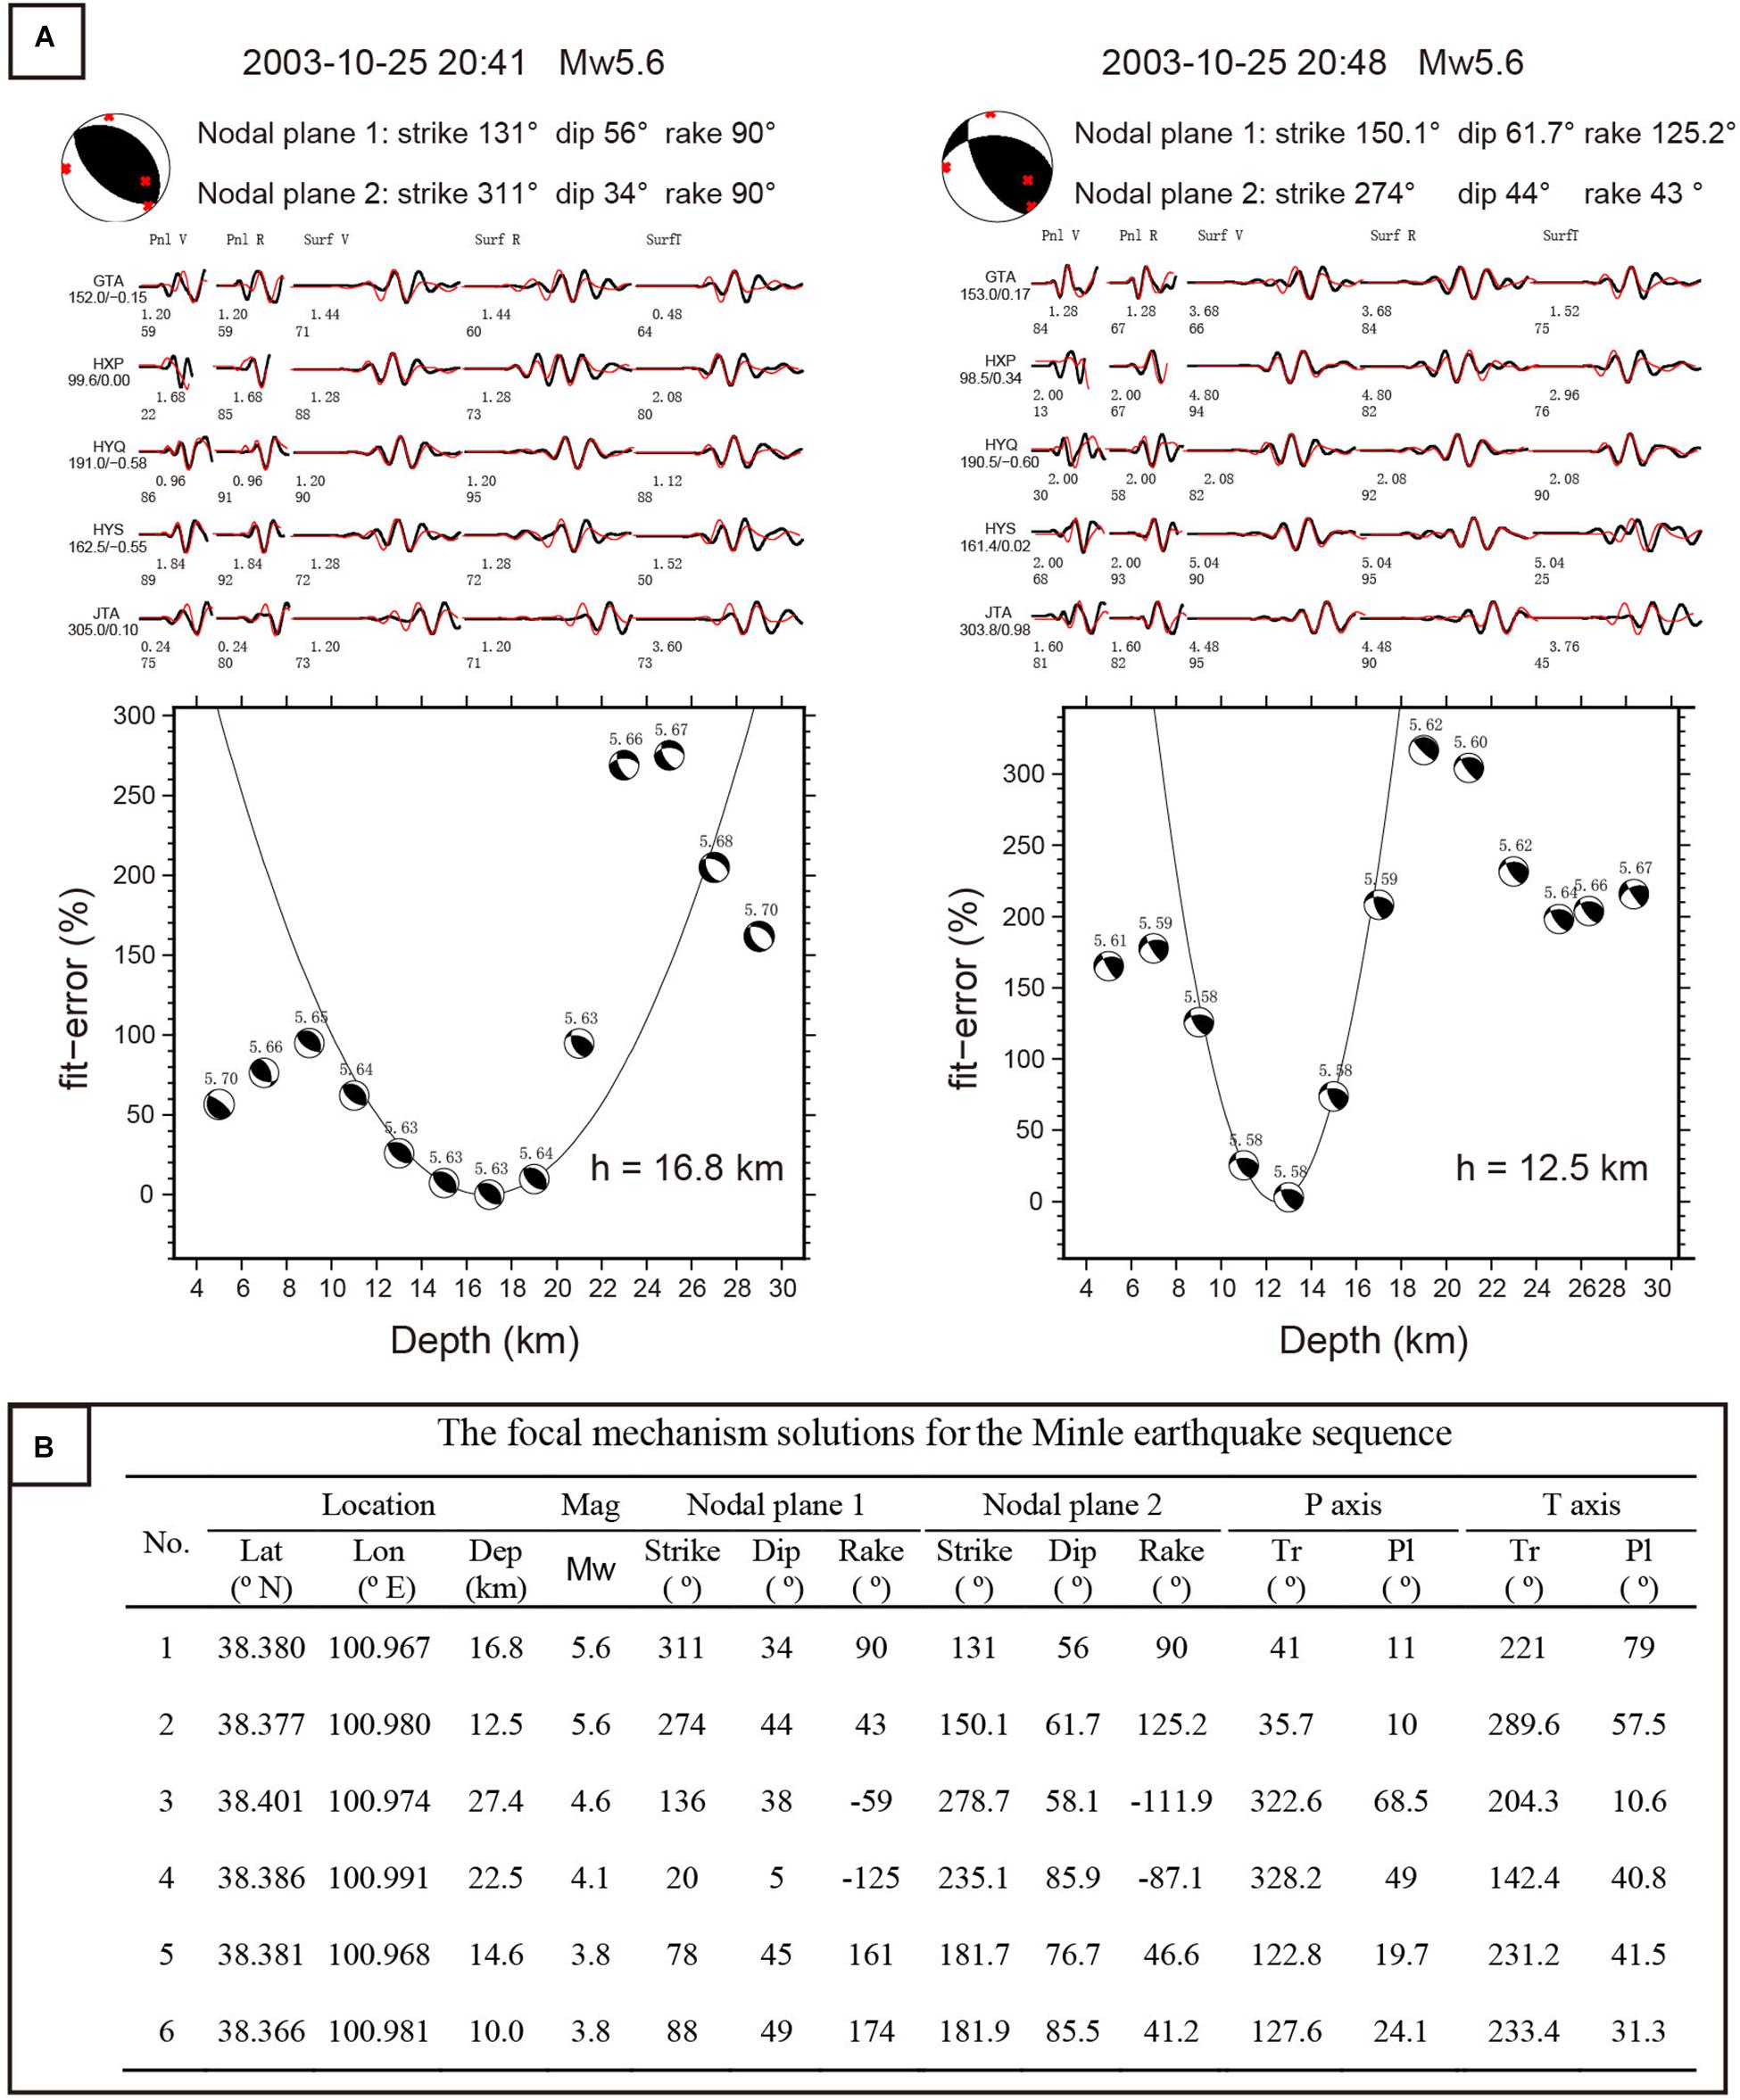
Figure 6. (A) Waveform fitting and focal mechanism solutions of the 2003 Minle earthquake. The upper figure is the comparison between synthetic seismograms and observations. The origin time and moment magnitude are on the top, and the focal mechanism solutions and beach balls are presented in the next line. PnlV, Pnl R, and so on are the components of body waves and surface waves that can be used in waveform fitting. Red lines are synthetic data, and black lines are observed waveforms. The station codes are on the left, and the numbers below the codes split by “/” are epicentral distance (in km) and azimuth (in degrees). The numbers below the waveform lines are the time shifts (in seconds) between synthetic data and observations and the corresponding maximum cross-correlation coefficients (in percentage). The lower figure is the optimal depth inversion by the CAP method, and the fitting error and moment magnitude vary with depth. The best focal depth is the depth with the minimum fitting error. (B) Focal mechanism solutions of the Minle earthquake sequence.
The fault plane parameters revealed by the focal mechanism solutions for the mainshock are basically consistent with the distribution of aftershocks. The correlation coefficient of waveform fitting is 0.75. The optimal depths of Ms6.1 and Ms5.8 earthquakes are 16.8 and 12.5 km, respectively, and the corresponding moment magnitudes are all Mw5.6. The focal mechanism solutions for the mainshock and several aftershocks of this earthquake sequence are listed in Figure 6B. The results show that the fault plane of the mainshock strikes NE and dips 34° and that the seismogenic fault is a thrust fault. Importantly, the focal mechanism solutions for the aftershocks vary greatly and are different from those of mainshock. This may be related to the complex underground structure. The epicenter is located in the Yonggu Anticline, which is the boundary between the Dahuang Shan uplift and Minle Basin. The different focal mechanisms reflect the geometric and kinematic differences in the secondary faults hidden beneath the Yonggu Anticline. However, the influence of the low SNR cannot be ruled out because the magnitude of these aftershocks did not exceed Mw5.0.
Parameter Determination for the Minle-Yongchang Fault
Small earthquakes after the mainshock often occur along the fault plane, and the orientation of the fault plane can be determined through the distribution of small earthquakes. Wan et al. (2008) provided a method and program for inversion to determine the fault parameters. This method establishes a mathematical model for identifying the fault plane by finding the plane with the smallest square sum of the distances from the small earthquakes to the fault plane. The initial value of inversion can be obtained by a simulated annealing algorithm and then iterated by the Gauss–Newton algorithm, which yields the optimal solution for fault plane parameters. Therefore, without relying on the initial solution, this method can obtain the globally optimal solution.
In this study, the fault plane parameters are inversed by using accurate relocation results, and the results are shown in Figures 7A–E. The aftershocks are mainly concentrated within 2 km of the fault plane and are distributed uniformly along the fault plane (Figure 7D). According to the resulting fault plane parameters (strike of 311.2° and dip angle of 14.2°), which are shown in Figure 7E, combined with the structural stress field parameters (Bu et al., 2013), the slip angle and its error can be obtained as 81.7° and 23.8°, respectively. These results are basically consistent with the focal mechanism solution for the mainshock. However, the difference in the dip angle reflected by the small earthquakes and the mainshock is approximately 20°. The depth range of the fault is 19.2–20.6 km, which is slightly deeper than the focal depth of 16.8 km obtained from focal mechanism inversion.
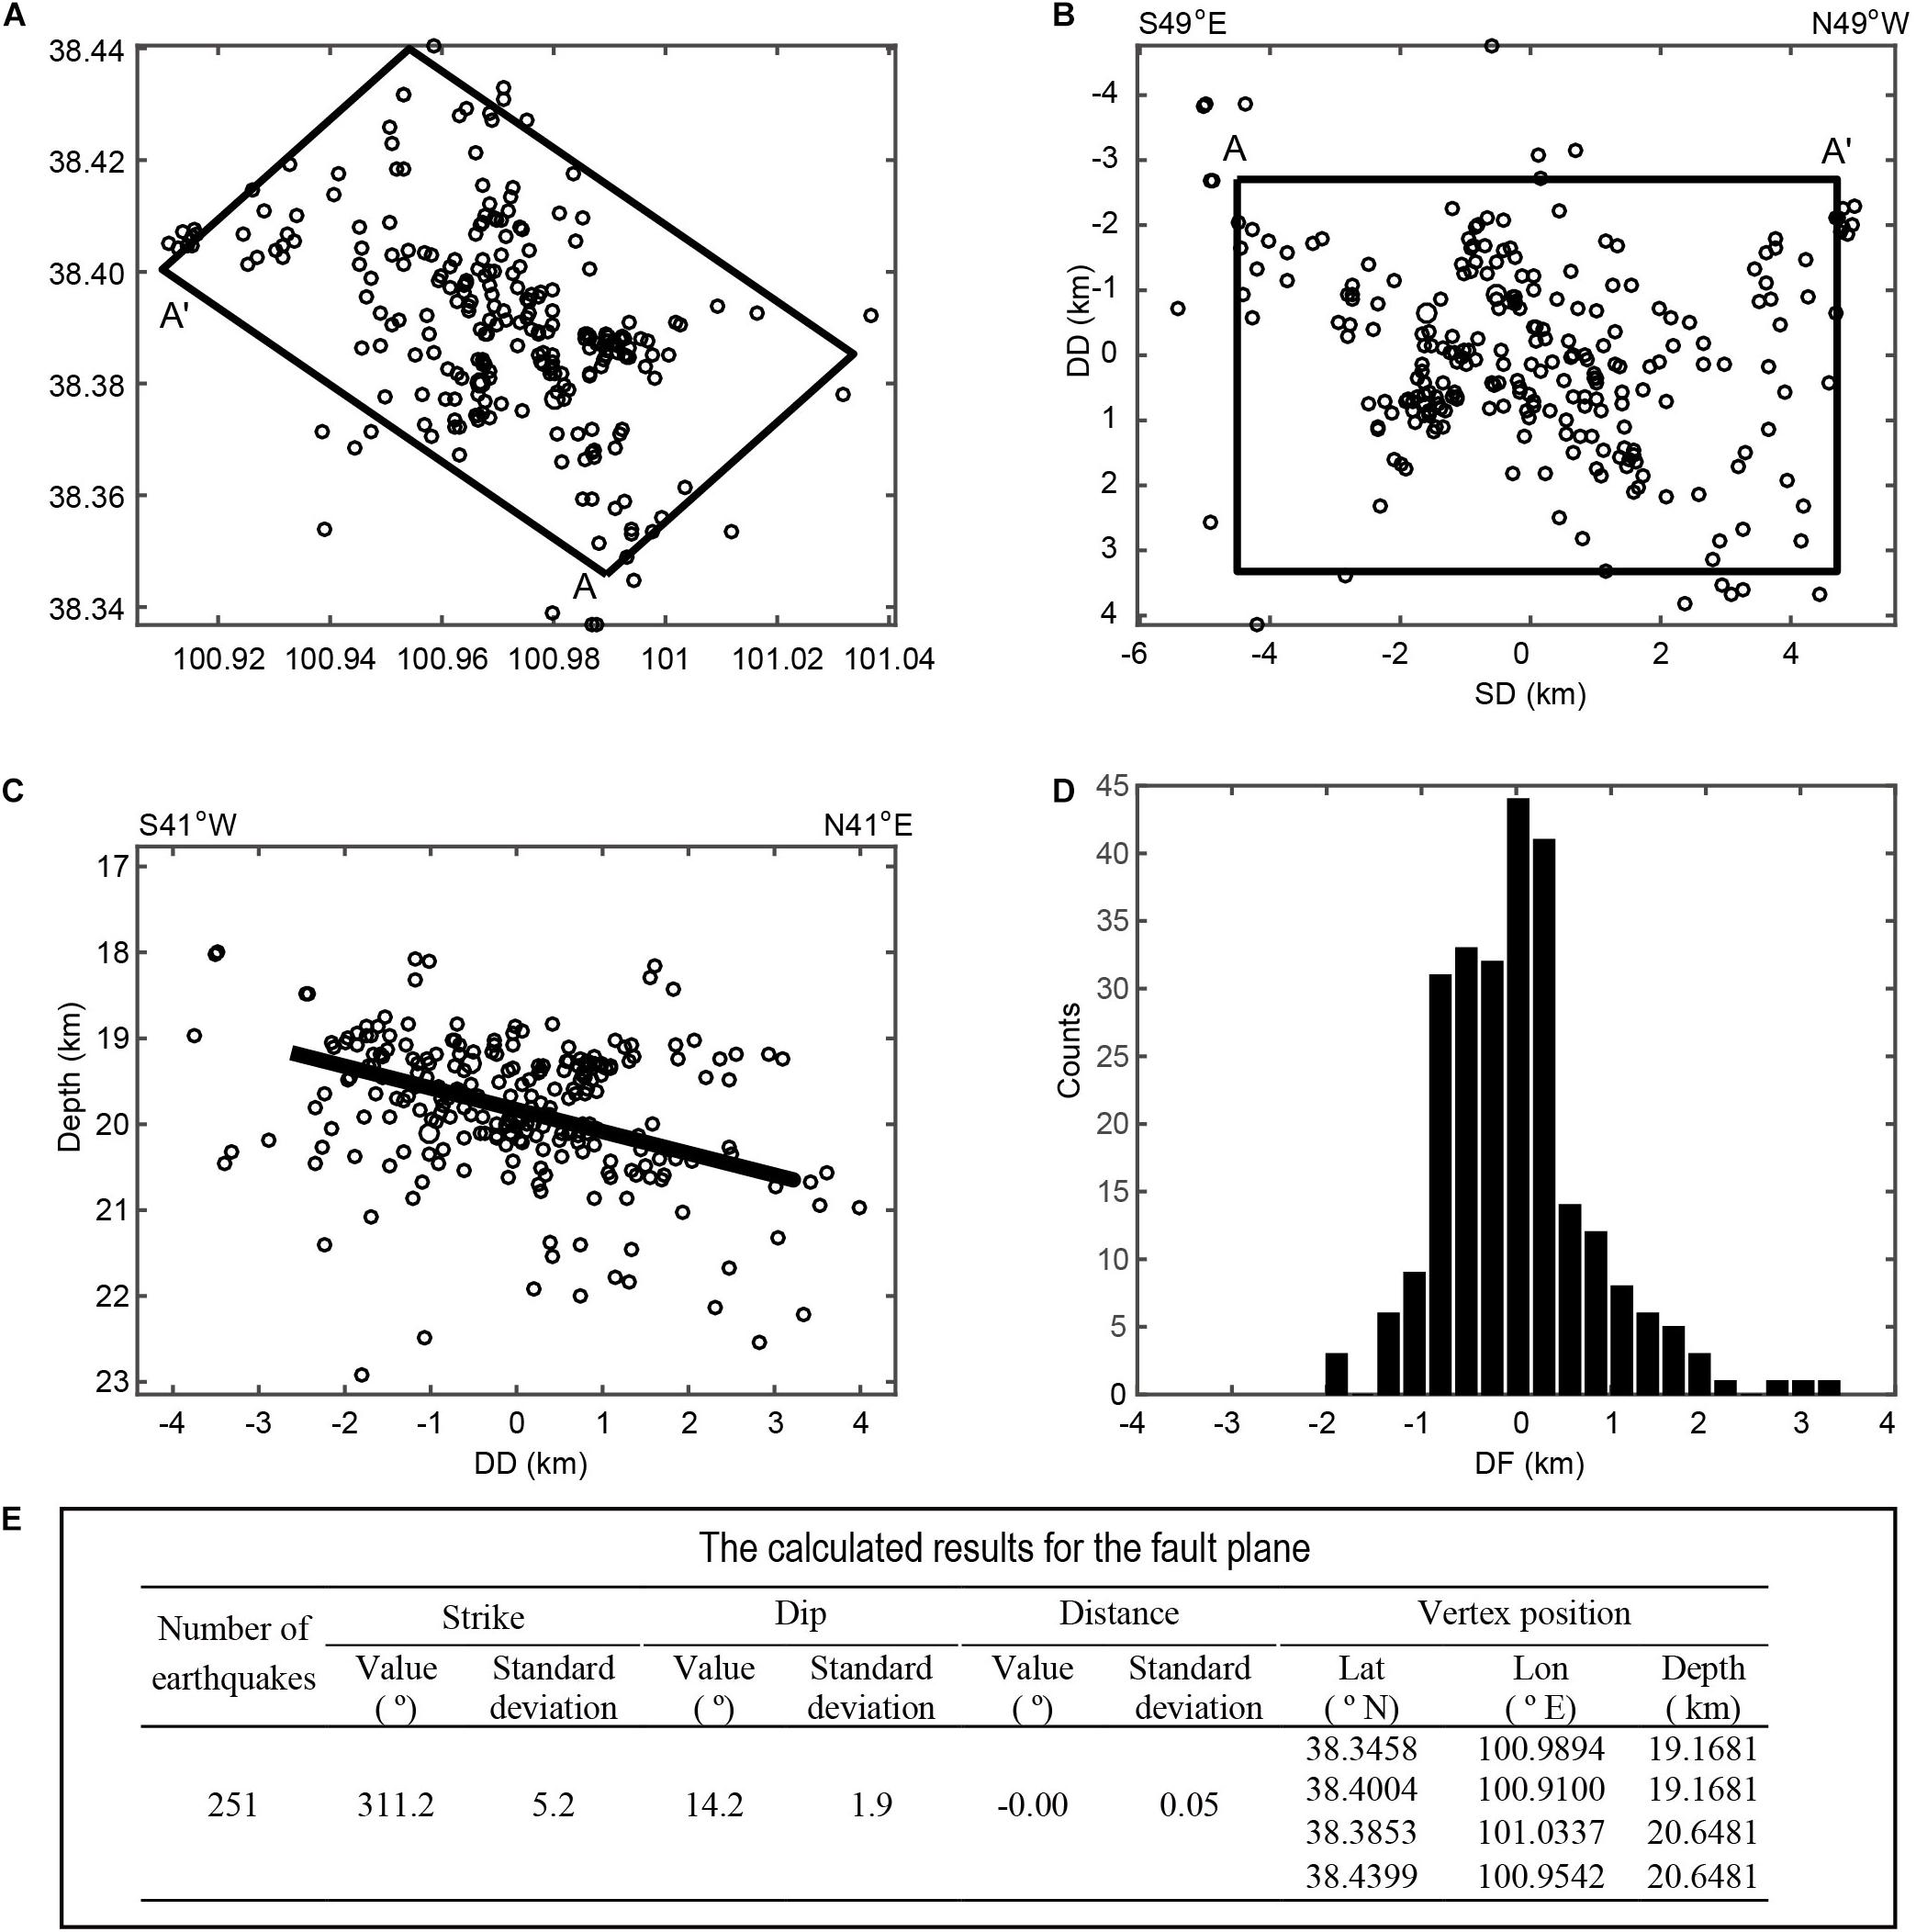
Figure 7. The projection of aftershocks on the horizontal (A), fault surface (B), and cross section vertical to the fault (C), and the distribution of distances from small earthquakes to the fault plane (D). Circles indicate earthquakes; the box is the boundary of the fault plane; A–A′ is the upper boundary of the fault. The thick black line in (C) indicates the fault. (E) The calculated results for the fault plane.
Geomorphic Deformation Characteristics of the Fault
The slip rate of a fault is an important parameter in the quantitative study of active tectonics. This rate is determined from offsets of geomorphic features whose ages can be measured; therefore, the measurement of deformation and dating of terraces are necessary steps to determine the slip rate and age of fault activity. In recent years, with the application of differential GPS, stereo image pairs, structure from motion (SfM) photogrammetry, and light detection and ranging (LiDAR) in active tectonics, it has become increasingly convenient to measure the deformation of structures (Wang et al., 2016; Ren et al., 2018).
In this study, ERDAS software is used to process the SPOT 6 stereo image pair. By adding two ground control points (the accuracy is better than 5 cm), 30 tie points are automatically generated. The RMS error (RMSE) of the final aerial triangulation is 0.09 pixels, and the linear error at 90% probability (LE90) of the digital elevation model (DEM) reaches 1 m. Finally, a DEM with 2 m resolution is generated by interpolation and filtering. The accuracy of the DEM is tested by comparing the elevation from the DEM with that from differential GPS (error less than 5 cm) measurement results, and the mean square error of elevation is 0.98 m, which is similar to the result given by ERDAS. This high-precision DEM is used in terrace division and detailed geomorphic mapping. Topographic profiles of the Tongziba River terrace across the Minle-Yongchang fault are measured by using high-precision differential GPS. All samples for terrace dating were collected from the bottom of the loess and dated by the optically stimulated luminescence (OSL) method at Zhejiang Zhongke Institute of Luminescence Testing Technology.
Vertical Offsets of Terraces
By detailed geomorphic mapping based on the high-precision DEM, four main geomorphic surfaces are found in this area according to their heights above the river level (Figures 8A,B). Terraces T1 and T2 are fill terraces, and their maximum heights above the river level are 4 and 7 m, respectively. Terrace T3 is the strath terrace, and the maximum height above the river level reaches 24 m. Among them, terrace T2 is the most fully preserved and the most widely distributed (Figures 8A,B) and is mainly composed of upper Pleistocene loess and gravel (Figures 9A–E). Terrace T3 is mainly distributed on the western bank of the Tongziba River and near Quantou Cun and is composed of middle Pleistocene loess and gravel layers (Figures 9F,G). The dominant dip direction of the largest flat surface of the gravel on the outcrops of geomorphic surfaces is toward the south (Figures 9C,H), indicating that the paleocurrent came from the Qilian Shan and flowed toward the north, which is consistent with the current flow direction. This shows that the deformation of all geomorphic surfaces in this region occurred after the uplift of the Qilian Shan.
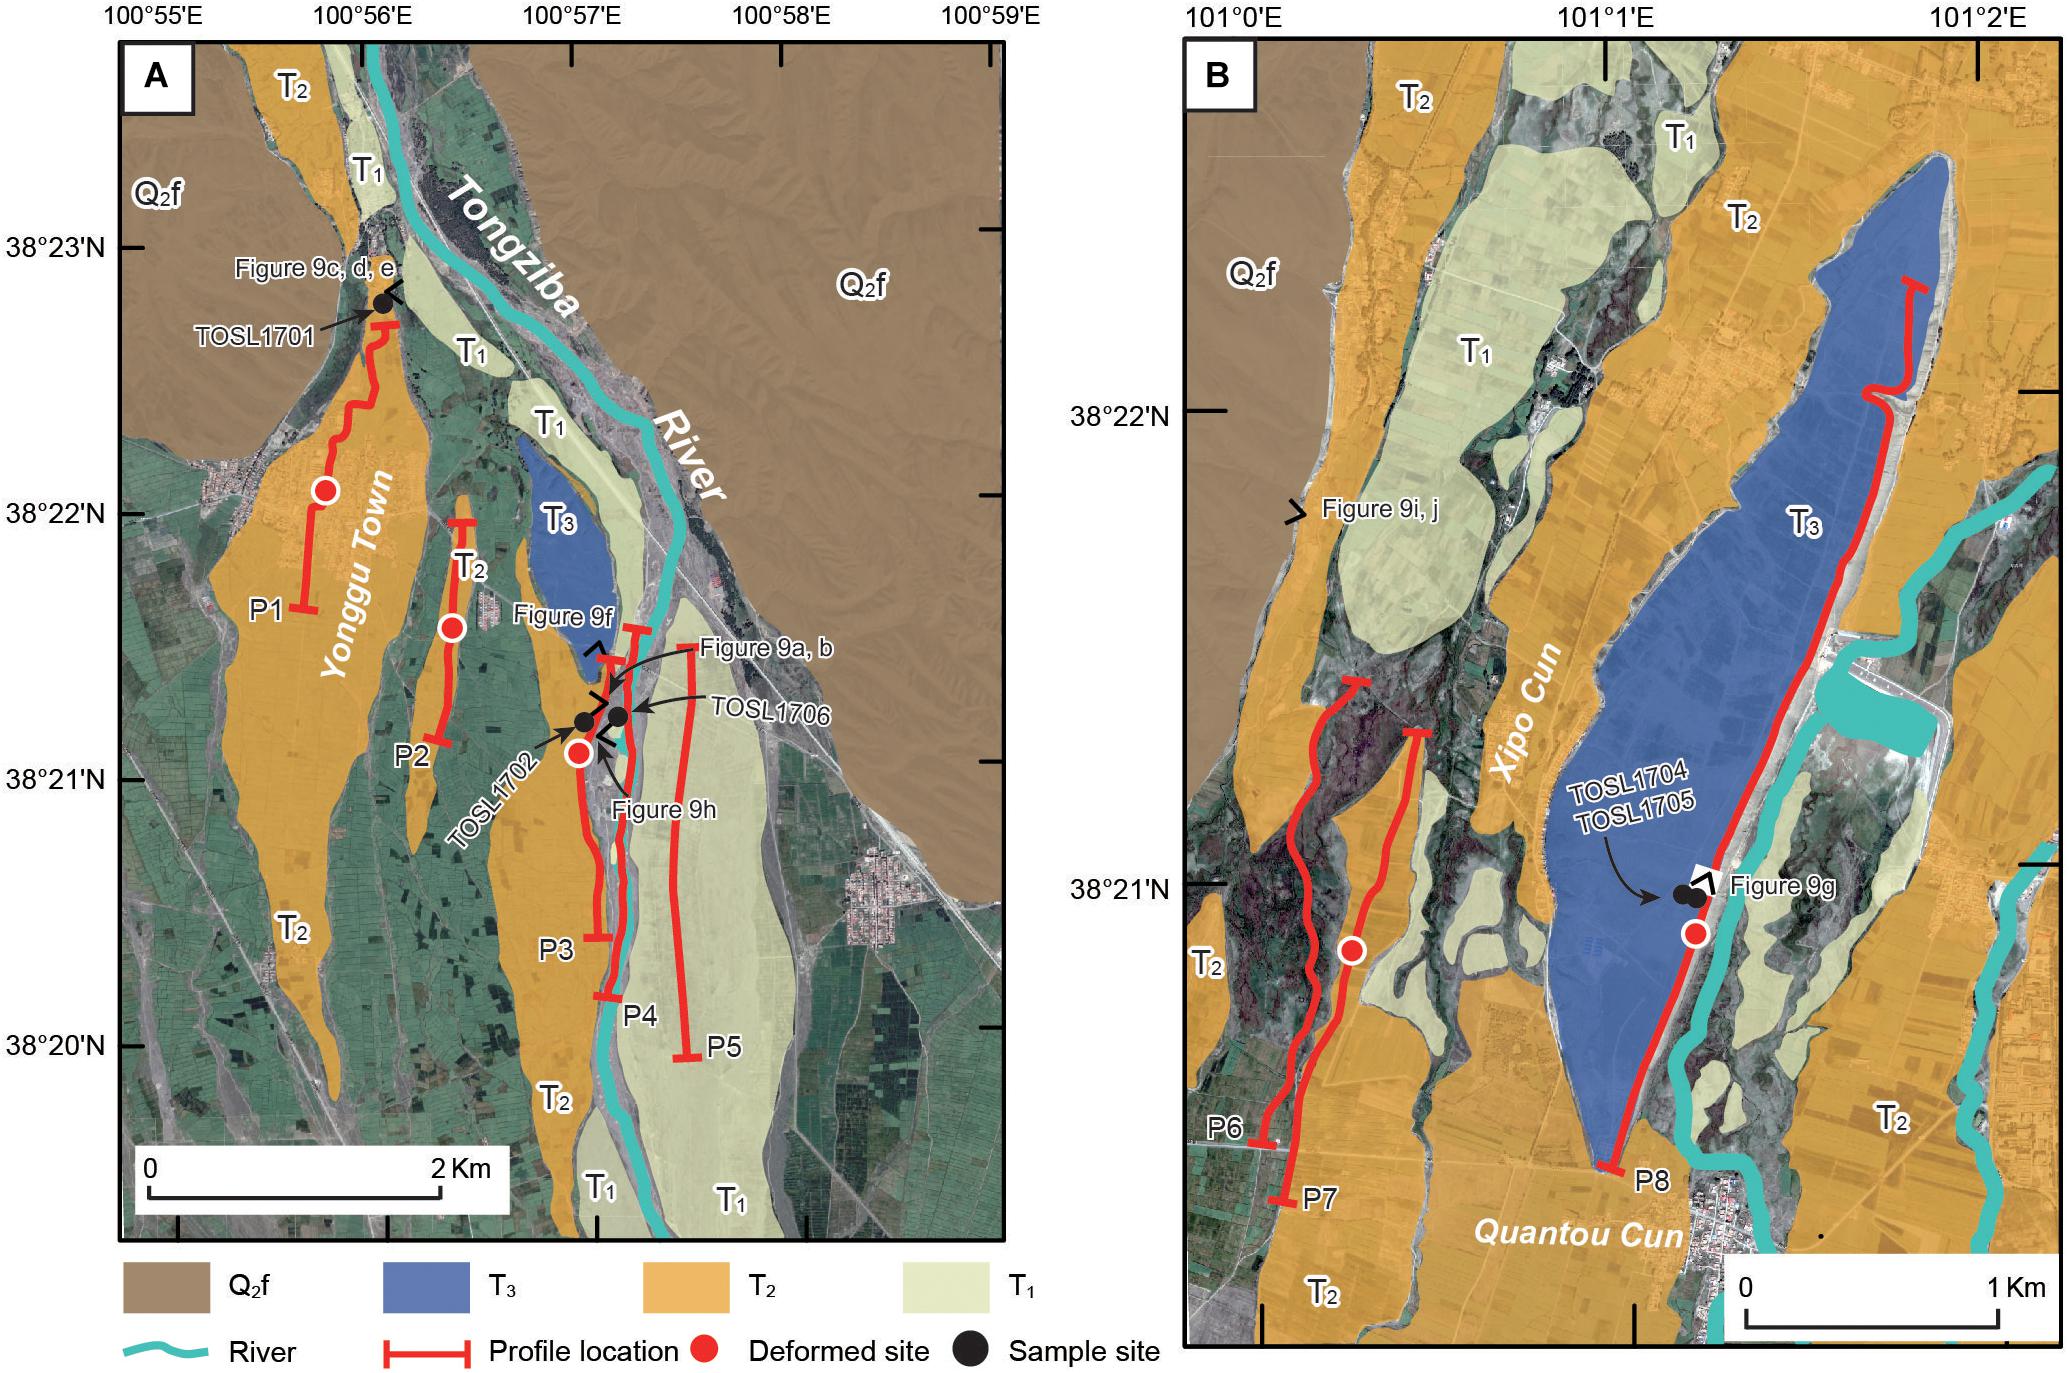
Figure 8. The distribution of terraces along the Tongziba River and the location of the survey profile. (A) Terrace classification and field investigation on the western bank of the river. (B) Terrace classification and field investigation on the eastern bank of the river. The red lines are the traces of elevation profiles, and the red circles are the sites of deformed terraces revealed through profiles.
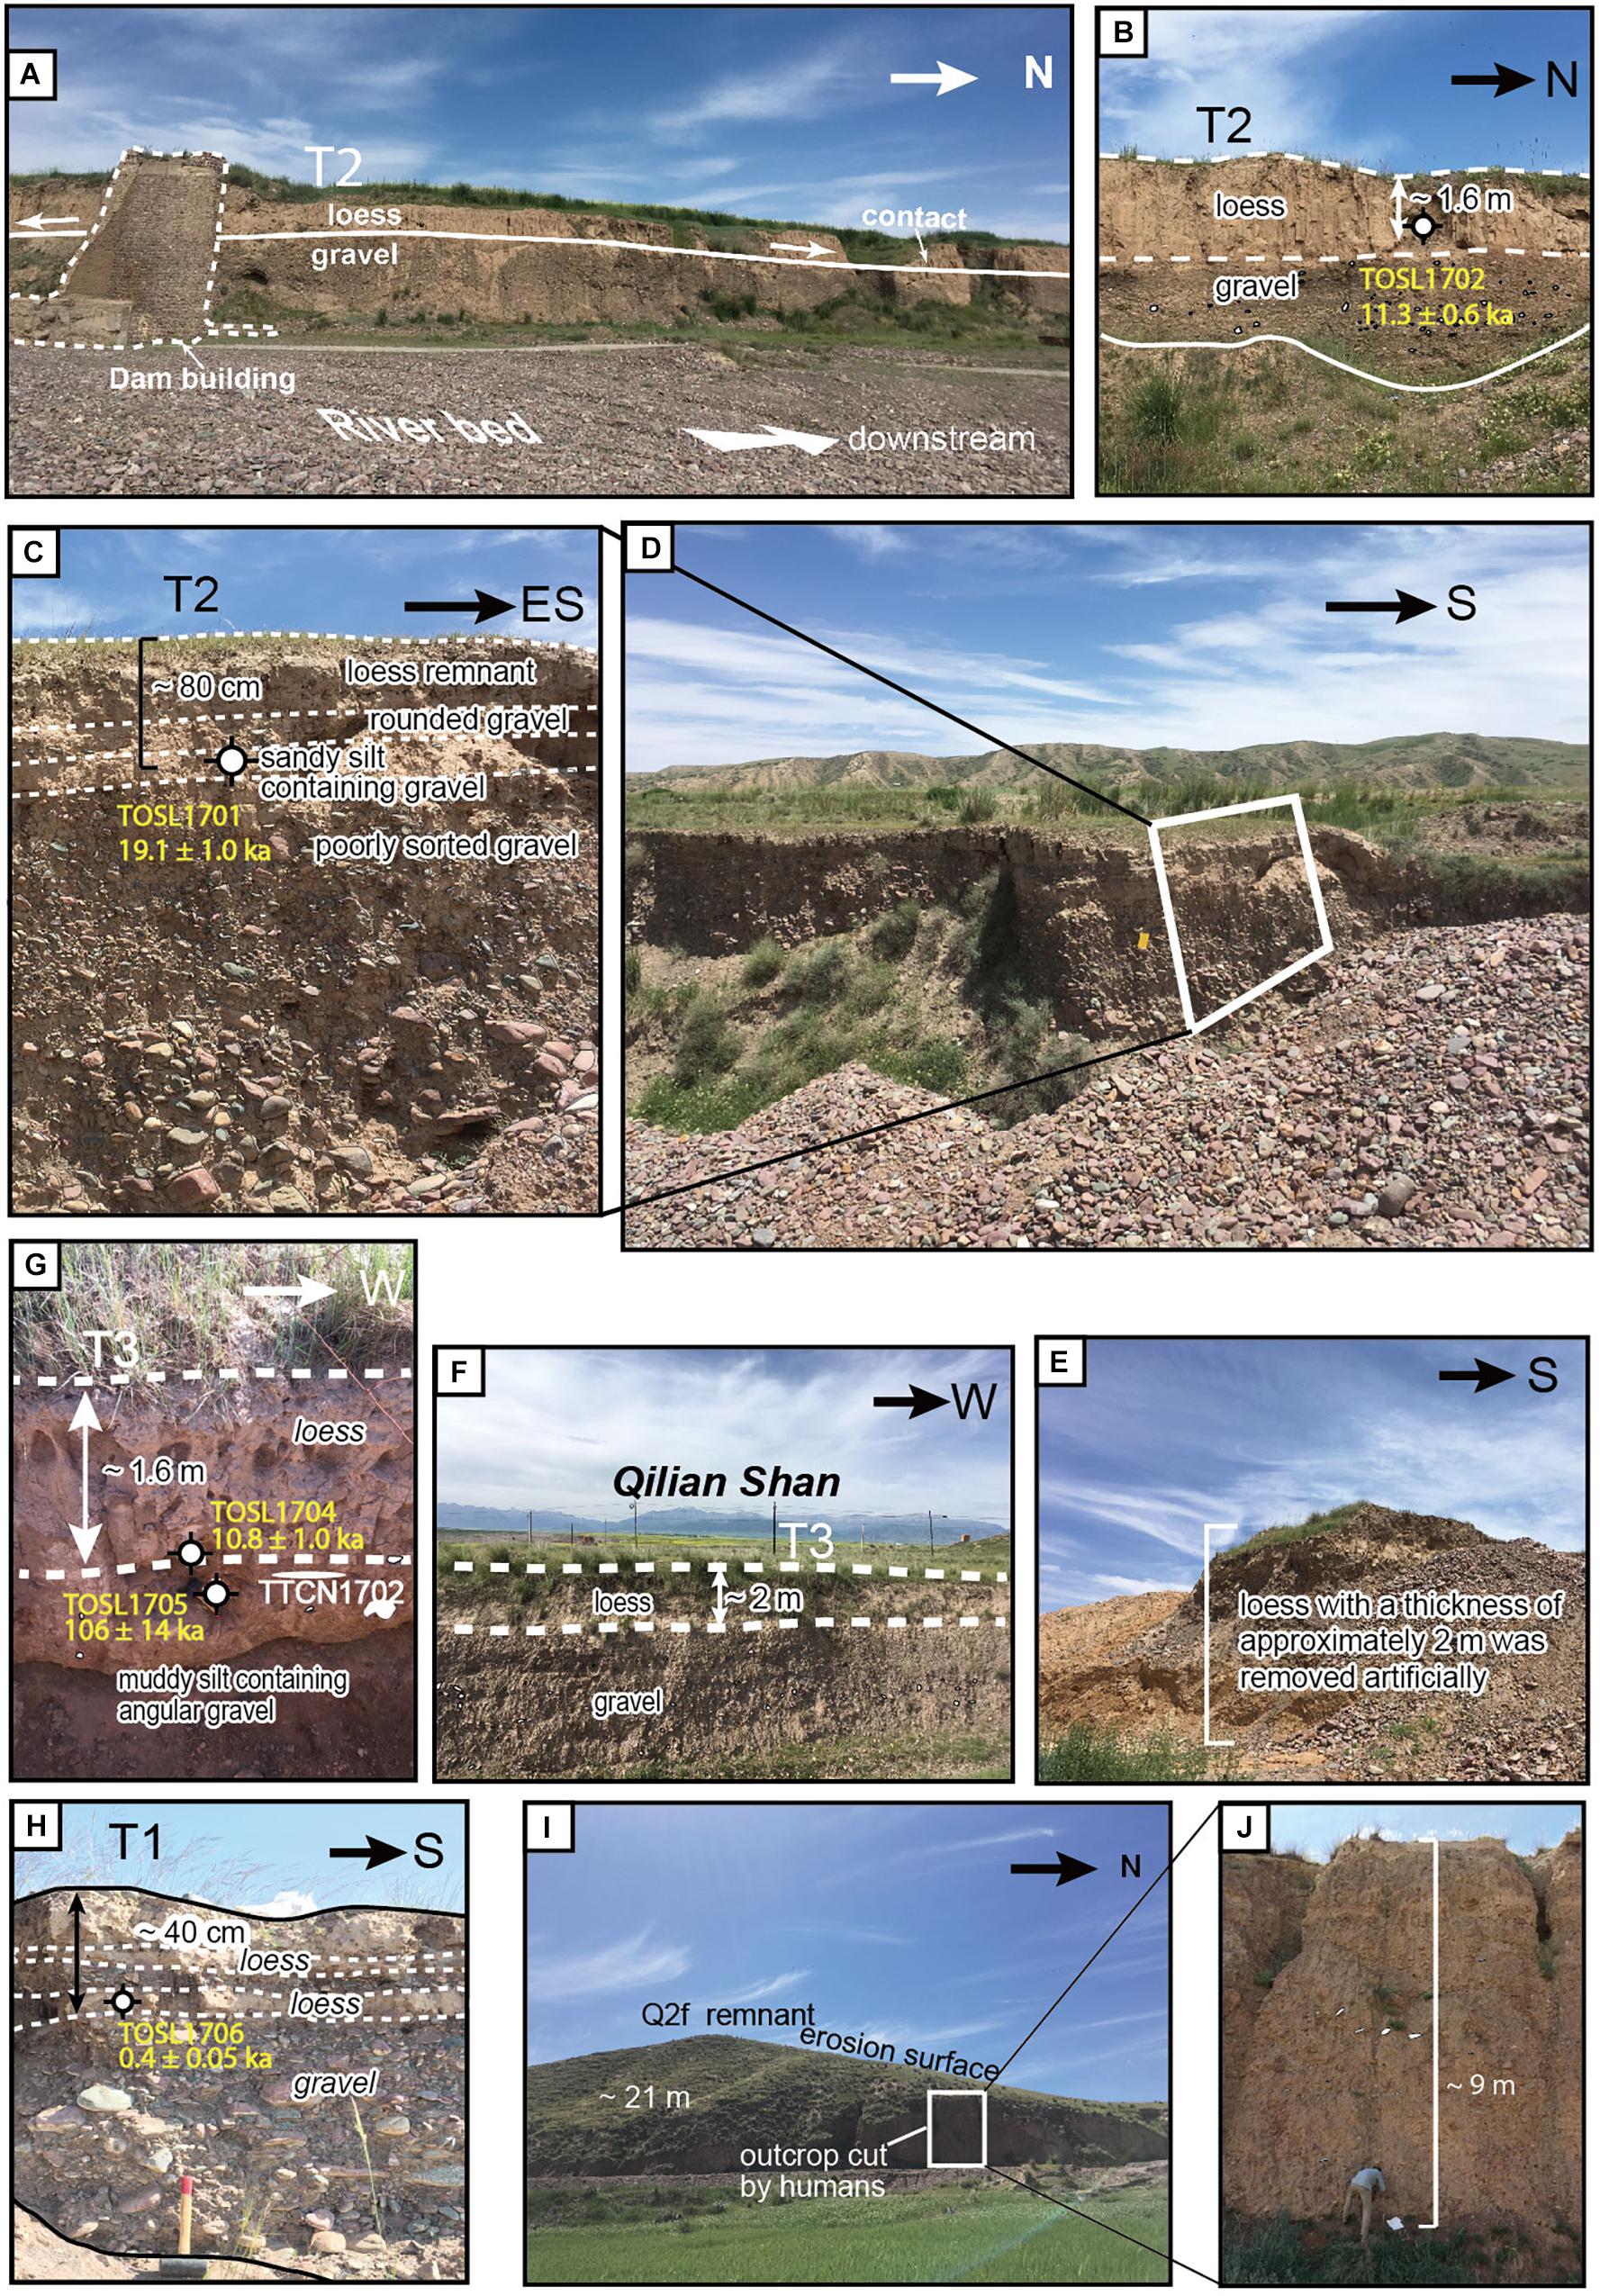
Figure 9. Sampling photographs of terraces. (A,B) Sampling site of OSL sample TOSL1702 on terrace T2 on the western bank of the Tongziba River. The terrace T2 is mainly composed of loess and gravel. (C) Sampling site of OSL sample TOSL1701 on terrace T2. TOSL1701 was collected from silty sand in the gravel layer approximately 0.8 m below the top of the T2 terrace in the northern part of the Yonggu town. (D,E) The loess with a thickness of approximately 2 m was removed artificially at the sampling site of TOSL1701. (F,G) The terrace T3 is composed of middle Pleistocene loess and gravel layers, OSL samples TOSL1704 and TOSL1705 were collected from the bottom of loess on the T3 terraces. (H) OSL sample TOSL1706 was collected from the residual T1 terrace of the Tongziba River. (I,J) The Q2f remnant and erosion surface of the Yonggu Anticline. Gravels are outcropped on Q2f. The locations of photographs and sampling sites are marked in Figure 8, and the locations of sampling sites are marked in the photographs.
Based on the high-precision DEM extracted from the SPOT6 stereo image pair, three swath profiles on high-level surfaces of Q2f (Figures 9I,J) and T3 are obtained, and the swath widths are 3, 0.26, and 3 km (Figure 10). The swath profiles show that there is a significant fold on the high-level geomorphic surfaces (Figure 11A). Detailed geomorphological mapping was performed in the study area based on the DEM, and high-precision differential GPS (measurement error < 5 cm) was used to measure the absolute elevation of the terraces of the Tongziba River. The profiles of river terraces were extracted (see Figure 8 for the profile positions) and show that there is no obvious surface deformation of the T0 and T1 terraces (Figure 11B), while the vertical offset of the T2 terrace is approximately 2.0 m; the relief between the T3 terrace and the T2 terrace is approximately 22.3 m (Figure 11A). The deformation of the T2 and T3 terraces shows that the northern part of the terraces is clearly uplifted relative to the southern part (Figure 11B), and three swath profiles also show obvious crustal uplift (Figure 11A), which is consistent with the geological structural background of NE-SW compressional deformation and shortening in the Hexi Corridor. The profiles of T2 terraces in the Yonggu town reveal that the overall strike of the deformation is approximately 311°, while the strike of deformation revealed by the profiles of T2 and T3 terraces in Xipo Cun is generally E-W (Figure 8). The kidney-shaped meizoseismal area of the Minle earthquake may be related to the deformation characteristics revealed by the terraces.
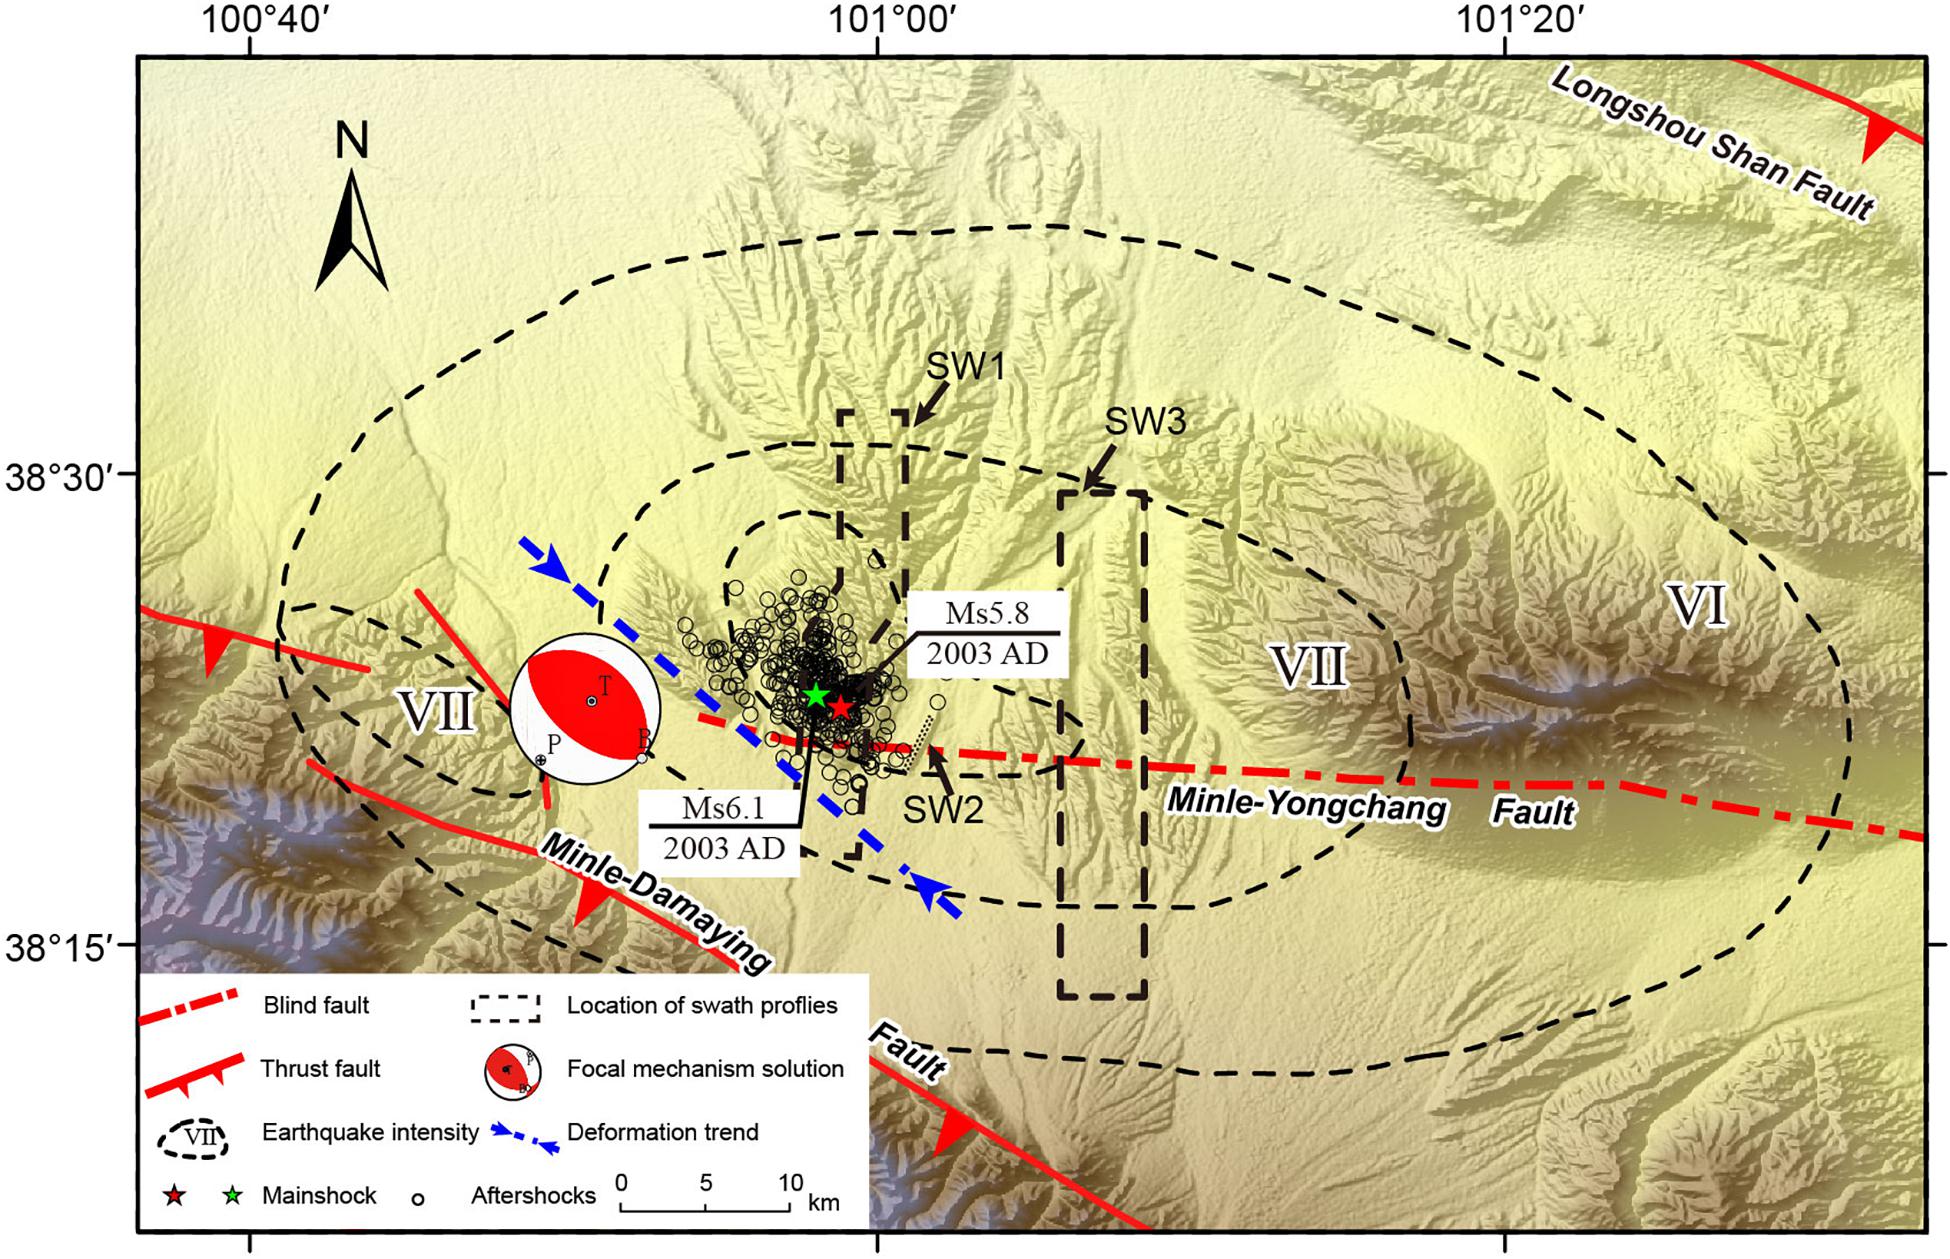
Figure 10. Aftershock distribution and locations of tectonic deformation in the study area. The dashed blue line is the trend of the deformed river terrace sites near the Yonggu town. The green star indicates the Ms6.1 mainshock, and the red star indicates the Ms5.8 mainshock.
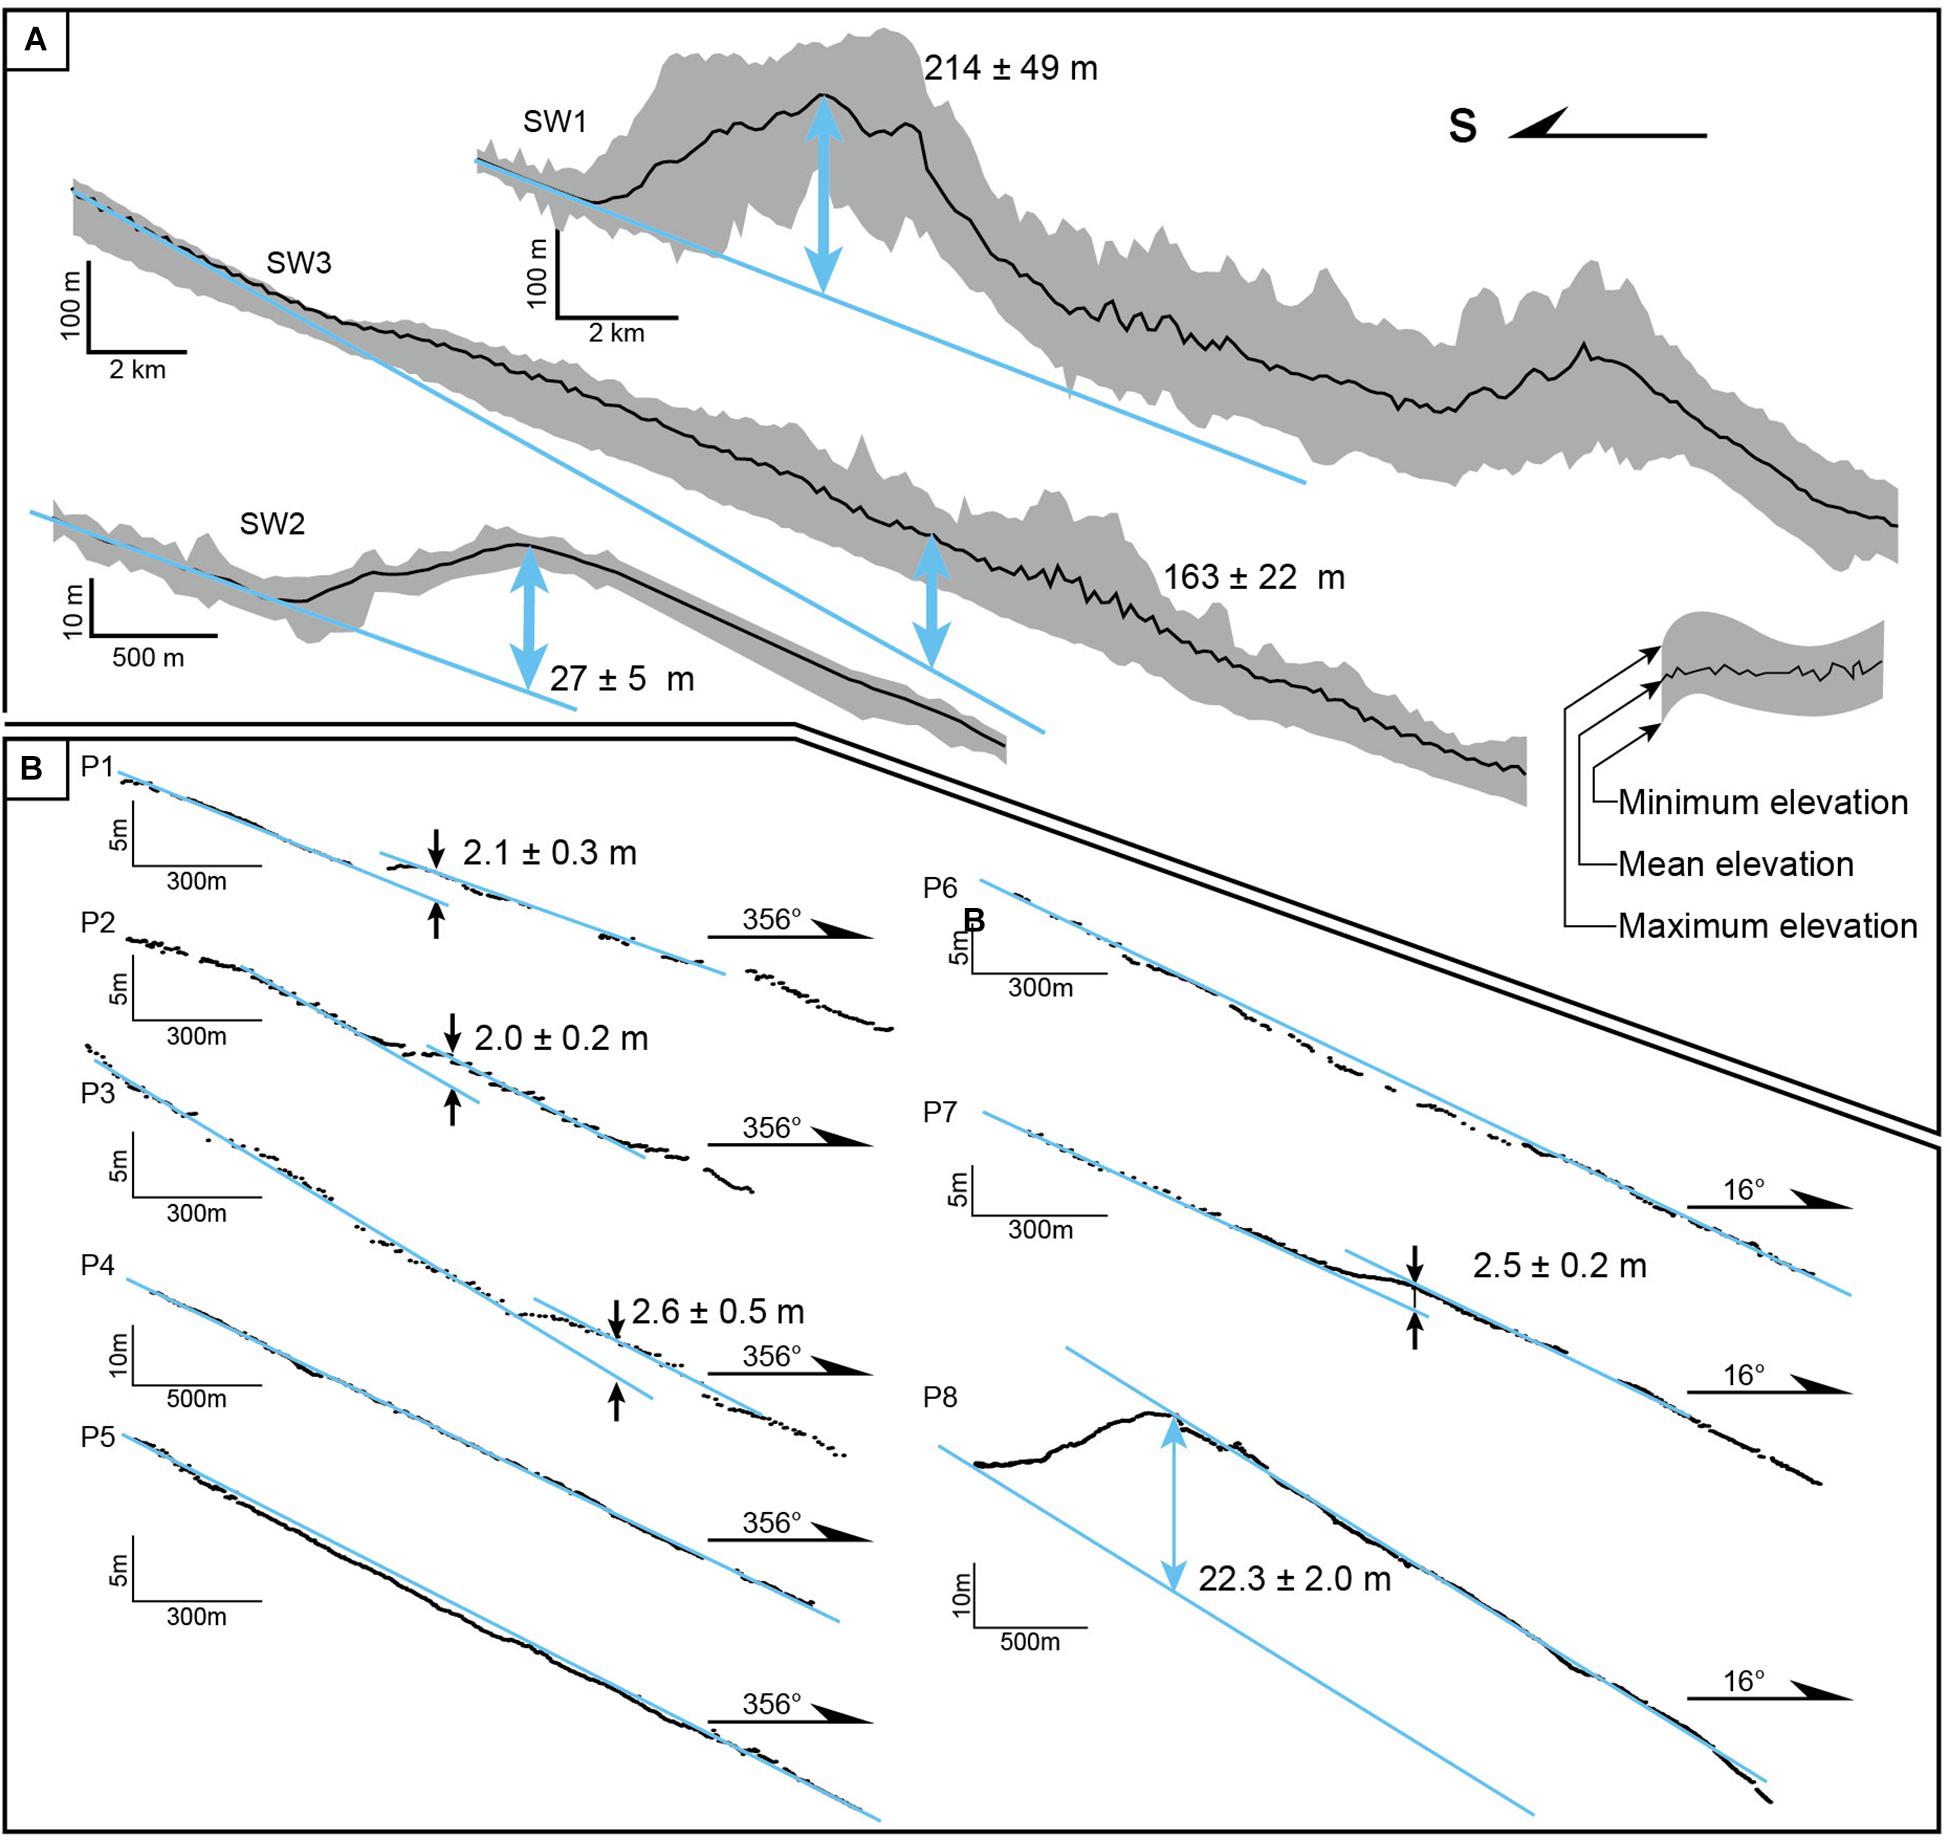
Figure 11. The swath profiles of high-level surfaces and longitudinal profiles of terraces. (A) The swath profiles extracted from the high-precision DEM generated through the SPOT 6 stereo image pair. (B) the longitudinal profiles measured by differential GPS. The locations of the profiles are shown in Figures 8, 10.
Terrace Ages and Slip Rate Constraint
OSL sample TOSL1701 was collected from silty sand in the gravel layer approximately 0.8 m below the top of the T2 terrace in the northern part of the Yonggu town (Figures 8A, 9C), and its age is 19.1 ± 1.0 ka. Considering that loess with a thickness of approximately 2 m was removed artificially (Figures 9D,E), this age may be too old. On the western bank of the Tongziba River, the age of sample TOSL1702 from the bottom of the loess on the T2 terrace is 11.3 ± 0.6 ka (Figures 8A, 9B), and this age is close to the age of the T2 terraces in this area (Zhong et al., 2017). OSL samples TOSL1704 and TOSL1705 were collected from the bottom of loess on the T3 terraces to the north of Quantou Cun (Figure 8B). The burial depth of this layer is approximately 1.6 m (Figure 9G), and the ages of TOSL1704 and TOSL1705 are 10.8 ± 1.0 ka and 106 ± 14 ka, respectively. Among these samples, TOSL1704 was collected from the overlying loess (Figure 9G), and its age is significantly younger than the age of TOSL1705, so we took the older age of 106 ± 14 ka as the age of the T3 terraces. Sample TOSL1706 was taken from the fine sand layer approximately 0.4 m from the top of the residual T1 terrace of the Tongziba River and has an age of 0.4 ± 0.05 ka (Figures 8A, 9H). The ages of the T1 and T2 terraces on the western bank of the Tongziba River are similar to the ages of 14C samples collected by Zhong et al. (2017) in the upper reaches of the Tongziba River; the 14C ages of T1 and T2 are 282.5 ± 17.5 cal a BP and 10,092.5 ± 27.5 cal a BP, respectively.
By combining the terrace ages and offsets of geomorphic indicators, the slip rate of the active structure can be obtained. A vertical offset of 2.1 ± 0.3 m was measured for the profile on the T2 terrace located in the Yonggu town (Figures 8A, 11B). Considering that loess with a thickness of approximately 2 m has been removed from the original geomorphic surface at the sampling location (Figures 9D,E), the age of 19.1 ± 1.0 ka is considered too old, according to the 14C age from Zhong et al. (2017) and our OSL age for the T2 terrace on the western bank of the Tongziba River. The OSL age of 11.3 ± 0.6 ka from sample TOSL1702 collected on the western bank of the river is suggested to represent the age of the T2 terraces. The vertical slip rate is 0.19 ± 0.04 mm/a at the Yonggu town site. The vertical offset of the T2 terrace on the western bank of the Tongziba River is 2.6 ± 0.5 m; the age of this terrace is 11.3 ± 0.6 ka; and the vertical slip rate is 0.23 ± 0.05 mm/a, obtained in the same way. The vertical offset of the T3 terrace is 22.3 ± 2.0 m; the age of the T3 terrace is 106 ± 14 ka; and the vertical slip rate is calculated as 0.22 ± 0.05 mm/a. Therefore, the average vertical slip rate is 0.21 ± 0.05 mm/a. All of the above data show that the Minle-Yongchang fault has been continuously active since the late Pleistocene.
Discussion
The Relation Between Terrace Deformation and Earthquakes
Topographic profiles along the terraces across the fault show that high alluvial terrains exhibit fold deformation (Figures 11A,B), and the overall strike of the structural deformation is 311°. The uplift displacements of the T2 and T3 terraces are approximately 2 and 22 m, respectively, and the corresponding terrace ages are 10 and 106 ka. This indicates that the Minle-Yongchang fault has been active since the late Pleistocene, and its average vertical slip rate is 0.21 ± 0.05 mm/a.
Previous studies have shown that a “fold earthquake” has the following characteristics: (1) it occurs under a young anticline structure; (2) there is no coseismic surface rupture; and (3) structural deformation is mainly manifested as fold uplift (King and Vita-Finzi, 1981; Stein and King, 1984; Zhang et al., 1994; Xu et al., 2013). The distribution of the relocated mainshock and aftershocks shows that the earthquakes occurred in the Yonggu Anticline (Figure 12A; He et al., 2004; Zheng et al., 2005). The field investigation indicated that there was no earthquake surface rupture in the meizoseismal area, but some WNW-striking compressional and nearly E-W-striking tensional ground fissures were found (He et al., 2004; Zheng et al., 2005). These observations, together with the fold deformation exhibited by the topographic profiles (Figures 11A,B), imply that this earthquake can thus be classified as a fold earthquake. The meizoseismal area, ground fissures, and aftershocks of the Minle earthquake are all located to the north of the tectonic deformation zone. The northern part of the terraces is uplifted correspondingly. Due to the hanging wall effect (Zhang et al., 2009; Huang and Li, 2009), we can determine that the northern section of the fault is the hanging wall, and the fault is a south-vergent thrust. This reverse fault-related fold model is supported by the distribution of the mainshock and aftershocks of the 2003 Minle earthquake sequence (Figures 6, 7).
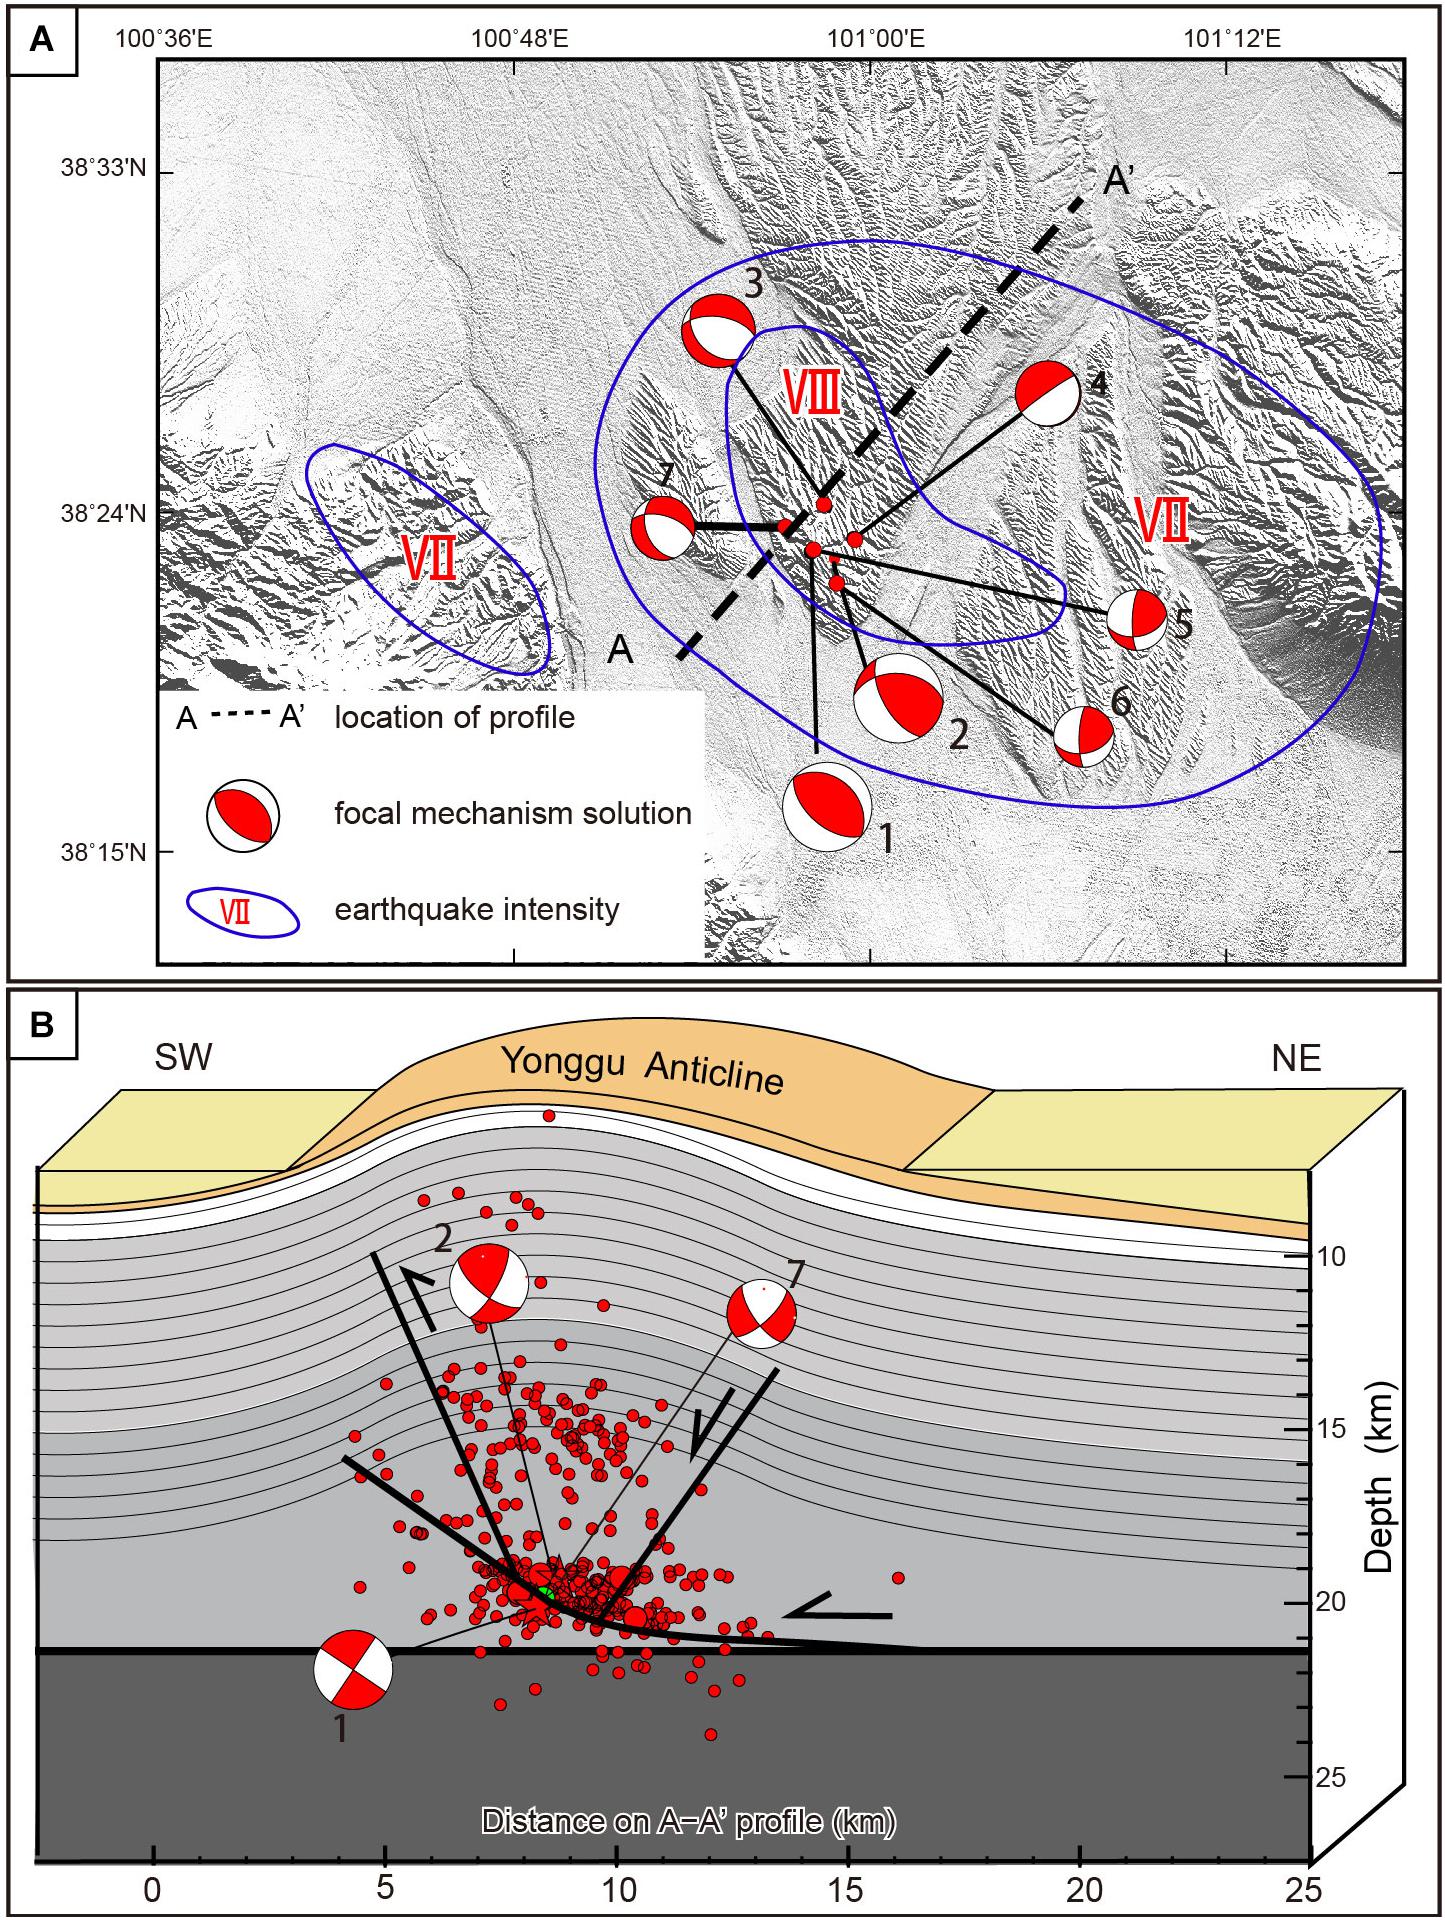
Figure 12. The focal mechanism solutions and the seismogenic model of the Minle-Yongchang fault. (A) Map of focal mechanism solution distribution. Focal mechanism solutions are determined for seven events, which are presented as beach balls, and the beach balls are projected to the horizontal plane. (B) Profile highlighting the relationship among the Yonggu Anticline, earthquake sequence, and focal mechanism solutions. They are projected to the A–A′ profile. The green star indicates the Ms6.1 mainshock. Black lines indicate the main faults in the study region, modified after Wu et al. (2017).
Hypocenter Distribution and Seismogenic Model
The relocated mainshock and aftershocks are distributed in the NW direction along the Yonggu Anticline, which indicates that the 2003 Ms6.1 Minle earthquake is closely related to the Minle-Yongchang fault hidden beneath the Yonggu Anticline. Through the study of the profiles of river terraces and other structures, it is concluded that the strike of the Minle-Yongchang blind fault is NW and that the fault is part of a reverse fault-fold belt. The deformation position and fault strike are basically consistent with the seismological results (Figure 10).
In the depth profile, the earthquakes are mostly distributed near the main fault plane with depths of 19.2–20.6 km below the Yonggu Anticline. However, due to the existence of many small faults in the core of the anticline, the distribution of earthquakes above 18 km is relatively discrete (Figures 5B,C; Stein and Yeats, 1989). The fault parameters determined by the precise hypocenter location are 311° strike, NE dip, and 81° slip angle. The fault is a low-angle reverse fault, and its depth range is approximately 19.2–20.6 km (Figure 7E). The focal mechanism solution for the mainshock obtained by the CAP method yields a strike of 311°, dip angle of 34°, rake of 90°, and depth of 16.8 km (Figure 6A), which is in agreement with the strike of the deformation position revealed by the terrace profiles (311°, dip of NE).
The fault parameters determined by the CAP method are roughly consistent with the fault parameters fitted by small earthquakes, except for a 20° difference in dip angle. The dip derived from fitting small earthquakes represents the mean dip of the fault. The other dip angle of the main earthquake focal mechanism obtained by the CAP method represents the local dip of the fault, and reflects the rupture direction of earthquake. These two dip angles cannot be the same.
We built a seismogenic model according to the spatial distribution of the relocated earthquake sequence, the deep-shallow structural relationship reflected by the inversion of hypocenter parameters, and the focal mechanism solutions of aftershocks (Figure 12B). The overall structure of the fault is constructed according to the spatial distribution of earthquakes. The secondary fault configuration is outlined based on the focal mechanisms and topography of the Yonggu Anticline. The depth and shape of the basement detachment fault that controls the Yonggu Anticline are based on magnetotelluric sounding. The magnetotelluric sounding reveals an anomalous low-resistivity layer at depths of 16.2–17.5 km in the Yonggu Anticline (Lin et al., 1984), which coincides with the fault parameters reflected by the small earthquakes and mainshock. Based on the deformation characteristics of terraces, aftershocks, and earthquake damage distribution, as well as the results of source parameter inversion, the comprehensive analysis indicates that the Minle earthquake in 2003 was a typical blind reverse fault-fold earthquake in the Hexi Corridor.
The North Qilian Shan and the Hexi Corridor are the northeastern margin of the Tibetan Plateau extrusion (Tapponnier et al., 2001). The northeast thrusting system dominates tectonic deformation in this area. However, our model suggests that Minle-Yongchang fault is southwest thrusting in the corridor, which is similar to the Longshou Shan southern fault. This indicates the instability of the corridor and the continuous deformation on the northeastern margin of the Tibetan Plateau. Meanwhile, the deformation extends from the Qilian Shan to the Longshou Shan, is widespread, and is not confined to a few main boundary zones (Zheng et al., 2013). The Yonggu Anticline is influenced by the NE extrusion and expansion of the Tibetan Plateau and is in response to the uplift and expansion of the Tibetan Plateau. Previous studies of active tectonics and seismology also support this continuous deformation model rather than a continental escape structure (Molnar et al., 1993; Molnar, 2004; Yuan et al., 2004; Zhang et al., 2006; Zheng, 2009; Zheng et al., 2013; Zheng et al., 2016).
Conclusion
In this study, multiple methods were comprehensively used to quantify the geometry and kinematics of the Minle-Yongchang fault and then to discuss the seismogenic structure model of the Ms6.1 Minle earthquake in 2003. A multistep location method was used to relocate the 2003 Minle earthquake sequence. With the stepwise use of HYPOINVERSE, double-difference location with waveform cross-correlation technology, and VELEST, the location precision was effectively improved. The fault parameters were determined by the distribution of the relocated aftershocks and the CAP method. The topographic profiles and OSL dating were used to constrain the offsets and ages of terraces, respectively.
The spatial distribution of the relocated aftershocks indicates that the seismogenic fault is a low-angle thrust with a strike of 311°, a dip of NE, and a dip angle of 14°. This fault does not rupture the surface, extends to 19.2–20.6 km depth, and is hidden beneath the Yonggu Anticline. The focal mechanism solutions are roughly consistent with these results except for indicating a dip angle of 34°. The high alluvial terrains exhibit fold deformation, and the vertical offsets of T2 and T3 along the Tongziba River are 2.3 ± 0.3 m and 22.3 ± 2.0 m, respectively. The ages of T2 and T3 determined by OSL are 10 and 106 ka, respectively, indicating that the Minle-Yongchang fault has been active since the late Pleistocene, and its average uplift rate is approximately 0.21 ± 0.05 mm/a.
The spatial distribution of the relocated earthquake sequence, the field investigation, and the deep-shallow structural relationship reflected by the inversion of hypocenter parameters all indicate that the Minle earthquake in 2003 was a typical blind reverse fault-fold event. The Minle-Yongchang blind reverse fault, located beneath the Yonggu Anticline, is the seismogenic structure of this earthquake. It strikes 311° and dips to the NE with a dip angle of 34° and a rake of 90°. The seismic risk to the interior of the Hexi Corridor should be considered.
Data Availability Statement
The original contributions presented in the study are included in the article/supplementary materials, further inquiries can be directed to the corresponding author/s.
Author Contributions
XZ performed research, analyzed data, drew the figures, and wrote and edited the manuscript. DY designed research, analyzed data, and edited the manuscript. YS designed research, and performed research, and edited the manuscript. XL, WG, and BZ performed research. All authors contributed to the article and approved the submitted version.
Funding
The research funds that supported this study were from the Second Tibetan Plateau Scientific Expedition and Research Program (STEP) (2019QZKK0901), the National Natural Science Foundation of China (41572197 and 41802228), and the Earthquake Science and Technology Development Fund, Gansu Earthquake Agency (KY2019005).
Conflict of Interest
The authors declare that the research was conducted in the absence of any commercial or financial relationships that could be construed as a potential conflict of interest.
Acknowledgments
We are grateful to Wengui He, Wenjun Zheng, Aiguo Wang, and Jinzhong Jiang for their advice on our preliminary results. We are also indebted to F. Waldhauser, Prof. Lupei Zhu from St. Louis University in the United States, and Prof. Yongge Wan from the Institute of Disaster Prevention for their program code. We greatly thank the reviewers and editors for their constructive and detailed comments to improve the manuscript.
Footnotes
References
Bu, Y., Wan, Y., and Zhang, Y. (2013). Tectonic stress analysis in Gansu and its adjacent areas. Seismol. Geol. 35, 833–841.
Cao, N., Lei, Z., Yuan, D., and Liu, X. (2010). Textual criticism on the Biaoshi, Gansu, earthquake in 180 A D. Acta Seismol. Sin. 32, 744–753.
Chen, W. (2003). Principal Features of Tectonic Deformation and Their Generation mechanism in the Hexi Corridor and its Adjacent Regions since Late Quaternary. Thesis. Beijing: Institute of Geology, China Earthquake Administration, 36–91.
Dong, Z., and Zhang, Y. (2007). A study of the 3-D velocity structure in central Hexi Corridor. Acta Seismol. Sin. 28, 270–276.
Feng, J. (2008). Relocating for the seismic sequence of Minle-Shandan Ms6.1 earthquake using the dual-difference earthquake location method. N. W. Seismol. J. 30, 62–65.
He, W., Zheng, W., Zhao, G., and Ma, E. (2004). Characteristics of intensity and seismogenic structure of Minle-Shandan Ms6.1 and Ms5.8 Earthquake on oct.25, 2003. N. W. Seismol. J. 26, 240–245.
Hetzel, R., Tao, M., Stokes, S., Niedermann, S., Ivy-Ochs, S., Gao, B., et al. (2004). Late Pleistocene/Holocene slip rate of the Zhangye thrust (Qilian Shan, China) and implications for the active growth of the northeastern Tibetan Plateau. Tectonics 23, TC6006.1–TC6006.17. doi: 10.1029/2004TC001653
Huang, R., and Li, W. (2009). Fault effect analysis of Geo-hazard triggered by Wenchuan Earthquake. J. Eng. Geol. 17, 19–28.
Institute of Geology, State Seismological Bureau, and Lanzhou Institute of Seismology, State Seismological Bureau (1993). The Qilian Shan-Hexi Corridor Active Fault System. Beijing: Seismological Press, 1–210.
Jiang, J., Fu, H., and Chen, F. (2016). Characteristics of seismicity of the Xiaowan reservoir in an area of active tectonics from double-difference relocation analysis. Chin. J. Geophys. 59, 2468–2485. doi: 10.1002/cjg2.30011
King, G., and Vita-Finzi, C. (1981). Active folding in the Algerian earthquake of 10 October 1980. Nature 292, 22–26. doi: 10.1038/292022a0
Kissling, E., Ellsworth, W. L., Eberhart-Phillips, D., and Kradolfer, U. (1994). Initial reference models in local earthquake tomography. J. Geophys. Res. Solid Earth 99, 19635–19646. doi: 10.1029/93jb03138
Kissling, E., Kradolfer, U., and Maurer, H. (1995). Program VELEST user’s Guide-Short Introduction. Zürich: Institute of Geophysics, ETH Zurich.
Klein, F. W. (1978). Hypocenter Location Program HYPOINVERSE: Part I. Users Guide to Versions 1, 2, 3, and 4. Part II. Source Listings and notes (No. 78-694). Reston, VA: US Geological Survey. doi: 10.3133/ofr78694
Li, Q., Zhang, Y., Tu, Y., and Fan, B. (1998). The combined interpretation of crustal velocity and electrical resistivity in Qilianshan Mountain-HeXi Corridor region. Acta Geophys. Sin. 41, 197–210.
Lin, C., Zhang, Y., Si, Y., Jiang, M., and Li, Z. (1984). On the magnetotelluric research in the eastern region of the He-Xi Corridor. Acta Geophys. Sin. 27, 131–143.
Liu, X. (2004). Focal mechanisms for some recent moderate-strong earthquakes in Gansu Province. N. W. Seismol. J. 26, 94–95.
Liu, X., Lei, Z., Yuan, D., and Cao, N. (2011). Textural research on Hongyapu M71/4 earthquake in 1609. N. W. Seismol. J. 33, 143–148.
Long, F., Wen, X., Ruan, X., Zhao, M., and Yi, G. (2015). A more accurate relocation of the 2013 Ms7.0 Lushan, Sichuan, China, earthquake sequence, and the seismogenic structure analysis. J. Seismol. 19, 653–665. doi: 10.1007/s10950-015-9485-0
Lu, R., Xu, X., He, D., Liu, B., Tan, X., Zhang, X., et al. (2017). Shallow sedimentation and tectonic deformation in the southern Longmen Shan: constraints on the seismotectonics of the 2013 Lushan Mw 6.7 earthquake. Chin. J. Geophys. 60, 2924–2934.
Molnar, P. (2004). Late Cenozoic increase in accumulation rates of terrestrial sediment: how might climate change have affected erosion rates? Annu. Rev. Earth Planet. Sci. 32, 67–89. doi: 10.1146/annurev.earth.32.091003.143456
Molnar, P., England, P., and Martinod, J. (1993). Mantle dynamics, uplift of the Tibetan Plateau, and the Indian monsoon. Rev. Geophys. 31, 357–396. doi: 10.1029/93rg02030
Niu, F., and Li, J. (2011). Component azimuths of the CEA Array stations estimated from P-wave particle motion. Earthq. Sci. 24, 3–13. doi: 10.1007/s11589-011-0764-8
Ren, Z., Zielke, O., and Yu, J. (2018). Active tectonics in 4-D high-resolution. J. Struct. Geol. 117, 264–271. doi: 10.1016/j.jsg.2018.09.015
Schaff, D. P., Bokelmann, G. H., Ellsworth, W. L., Zanzerkia, E., Waldhauser, F., and Beroza, G. C. (2004). Optimizing correlation techniques for improved earthquake location. Bull. Seismol. Soc. Am. 94, 705–721. doi: 10.1785/0120020238
Shao, Y., Yuan, D., Cao, N., and Liang, M. (2011). Seismic risk analysis for northern Qilianshan-Hexi Corridor. Seismol. Geol. 33, 865–876.
Stein, R. S., and King, G. C. (1984). Seismic potential revealed by surface folding: 1983 Coalinga, California, earthquake. Science 224, 869–872. doi: 10.1126/science.224.4651.869
Stein, R. S., and Yeats, R. S. (1989). Hidden earthquakes. Sci. Am. 260, 48–57. doi: 10.1038/scientificamerican0689-48
Tapponnier, P., Xu, Z., Roger, F., Meyer, B., Arnaud, N., Wittlinger, G., et al. (2001). Oblique stepwise rise and growth of the Tibet Plateau. Science 294, 1671–1677. doi: 10.1126/science.105978
Waldhauser, F. (2001). HypoDD-A program to compute double-difference hypocenter locations (hypoDD version 1.0-03/2001). U.S. Geol. Surv. Open File Rep. 1:113. doi: 10.3133/ofr01113
Waldhauser, F., and Ellsworth, W. L. (2000). A double-difference earthquake location algorithm: Method and application to the northern Hayward fault, California. Bull. Seismol. Soc. Am. 90, 1353–1368. doi: 10.1785/0120000006
Wan, Y., Shen, Z., Diao, G., Wang, F., Hu, X., and Sheng, Z. (2008). An algorithm of fault parameter determination using distribution of small earthquakes and parameters of regional stress field and its application to Tangshan earthquake sequence. Chin. J. Geophys. 51, 793–804. doi: 10.1002/cjg2.1247
Wang, P., Shao, Y., Zhang, H., Liu, H., and Wu, Z. (2016). The application of sUAV photogrammetry in active tectonics: shanmagou site of Haiyuan Fault, for example. Q. Sci. 36, 433–442.
Wu, C., Li, J., Liu, J., Hu, W., Wu, G., Chang, X., et al. (2017). Pishan Ms6.5 earthquake of Xinjiang: a fold earthquake event in the west Kunlun piedmont. Seismol. Geol. 39, 342–355.
Xin, H., Zhang, Y., Guo, X., and Li, W. (2008). Accurate location of the 2003 Minle-Shandan M6.1, M5.8 earthquake sequence. J. Seismol. Res. 31, 129–133.
Xu, X., Wen, X., Han, Z., Chen, G., Li, C., Zheng, W., et al. (2013). Lushan Ms 7.0 earthquake: a blind reserve-fault event. Chin. Sci. Bull. 58, 1887–1893. doi: 10.1007/s11434-013-5999-4
Xu, X., Yeats, R. S., and Yu, G. (2010). Five short historical earthquake surface ruptures near the Silk Road, Gansu Province, China. Bull. Seismol. Soc. Am. 100, 541–561. doi: 10.1785/0120080282
Yi, G., Long, F., Amaury, V., Yann, K., Liang, M., and Wang, S. (2016). Focal mechanism and tectonic deformation in the seismogenic area of the 2013 Lushan earthquake sequence, southwestern China. Chin. J. Geophys. 59, 3711–3731.
Yin, X., Yang, L., Chen, J., Wang, Z., and Gao, Y. (2017). Study on the one-dimensional velocity model in Gansu area. China Earthq. Eng. J. 39, 154–159.
Yuan, D., He, W., Liu, X., Zheng, W., Ge, W., and Liu, X. (2006). The characteristic of seismogenic structure of middle strong earthquakes in recent 10 years, Gansu Province. N. W. Seismol. J. 28, 235–241.
Yuan, D., Zhang, P., Liu, B., Gan, W., Mao, F., Wang, Z., et al. (2004). Geometrical imagery and tectonic transformation of late quaternary active tectonics in northeastern margin of Qinghai-Xizang Plateau. Acta Geol. Sin. 78, 270–278.
Zhang, D., Zhou, Z., and Tao, X. (2009). Influence of seismic source mechanism and fault property on near-field strong ground motion. N. W. Seismol. J. 31, 311–318.
Zhang, G., and Lei, J. (2013). Relocations of Lushan, Sichuan strong earthquake (Ms7.0) and its aftershocks. Chin. J. Geophys. 56, 1764–1771.
Zhang, G., Ma, H., Wang, H., and Wang, X. (2005). Boundaries between active-tectonic blocks and strong earthquakes in the China mainland. Chin. J. Geophys. 48, 602–610. doi: 10.1002/cjg2.699
Zhang, H. (2007). Study on Characteristics of Regional Stress Field in Northeastern Margin of the Qinghai-Tibet Plateau Based on the Focal Mechanism Solutions of Small Earthquakes. Thesis. Lanzhou: Lanzhou Institute of Seismology, China Earthquake Administration, 19–58.
Zhang, H., and Xu, L. (2003). On Oct 25, 2003, Ms6.1 and Ms5.8 earthquake occurred in western of Gansu province. Recent Dev. World Seismol. 11, 39–39.
Zhang, P., Deng, Q., Xu, X., Feng, X., Peng, S., Yang, X., et al. (1994). Blind thrust, folding earthquake, and the 1906 Manas earthquake, Xinjiang. Seismol. Geol. 16, 193–204.
Zhang, P., Deng, Q., Zhang, G., Ma, J., Gan, W., Min, W., et al. (2003). Active tectonic blocks and strong earthquakes in the continent of China. Sci. China 33, 12–20.
Zhang, P., Zheng, D., Yin, G., Yuan, D., Zhang, G., Li, C., et al. (2006). Discussion on late Cenozoic growth and rise of north eastern margin of the Tibetan Plateau. Q. Sci. 26, 5–13.
Zhao, L. S., and Helmberger, D. V. (1994). Source estimation from broadband regional seismograms. Bull. Seismol. Soc. Am. 84, 91–104.
Zheng, W. (2009). Geometric Pattern and Active Tectonics of the Hexi Corridor and Its Adjacent Regions. Thesis. Beijing: Institute of Geology, China Earthquake Administration, 84–149.
Zheng, W., He, W., Zhao, G., and Ma, E. (2005). Discussion on the causative structure and mechanism of the 2003 Minle-Shandan, Gansu, M6.1, 5.8 earthquakes. J. Seismol. Res. 28, 133–140.
Zheng, W., Yuan, D., Zhang, P., Yu, J., Lei, Q., Wang, W., et al. (2016). Tectonic geometry and kinematic dissipation of the active faults in the northeastern Tibetan Plateau and their implications for understanding northeastward growth of the plateau. Q. Sci. 36, 775–788.
Zheng, W., Zhang, Z., Zhang, P., Liu, X., Guo, X., Pang, J., et al. (2013). Seismogenic structure and mechanism of the 1954 M71/4 Shandan earthquake, Gansu Province, Western China. Chin. J. Geophys. 56, 916–928.
Zhong, Y., Li, Y., Xiong, J., Lei, J., Xin, W., Hu, X., et al. (2017). Terraces of Tongziba River, eastern Qilian Mountain and their responses to neotectonic movement and climate change. J. Palaeogeogr. 19, 1075–1086.
Zhong, Y., Xiong, J., Li, Y., Zheng, W., Zhang, P., Lu, H., et al. (2020). Constraining late Quaternary crustal shortening in the eastern Qilian Shan from deformed river terraces. J. Geophys. Res. Solid Earth 125:e2020JB020631. doi: 10.1029/2020JB020631
Zhu, L., and Helmberger, D. V. (1996). Advancement in source estimation techniques using broadband regional seismograms. Bull. Seismol. Soc. Am. 86, 1634–1641.
Zhu, L., and Rivera, L. A. (2002). A note on the dynamic and static displacements from a point source in multilayered media. Geophys. J. Intern. 148, 619–627. doi: 10.1046/j.1365-246x.2002.01610.x
Keywords: Hexi Corridor, Minle-Yongchang fault, fold earthquake, stereo image pair, earthquake source parameters
Citation: Zou X, Yuan D, Shao Y, Liu X, Ge W and Zhang B (2021) The 2003 Ms6.1 Minle Earthquake: An Earthquake in the Minle-Yongchang Reverse Fault-Related Fold Belt in the Hexi Corridor, NW China. Front. Earth Sci. 9:649268. doi: 10.3389/feart.2021.649268
Received: 04 January 2021; Accepted: 29 March 2021;
Published: 22 April 2021.
Edited by:
Gang Rao, Zhejiang University, ChinaReviewed by:
Yujiang Li, National Institute of Natural Hazards, Ministry of Emergency Management (China), ChinaQi Ou, University of Oxford, United Kingdom
Copyright © 2021 Zou, Yuan, Shao, Liu, Ge and Zhang. This is an open-access article distributed under the terms of the Creative Commons Attribution License (CC BY). The use, distribution or reproduction in other forums is permitted, provided the original author(s) and the copyright owner(s) are credited and that the original publication in this journal is cited, in accordance with accepted academic practice. No use, distribution or reproduction is permitted which does not comply with these terms.
*Correspondence: Daoyang Yuan, eXVhbmR5QGx6dS5lZHUuY24=