 Yan Zhu1,2,3
 Ming Peng
94% of researchers rate our articles as excellent or good
Learn more about the work of our research integrity team to safeguard the quality of each article we publish.
Find out more
ORIGINAL RESEARCH article
Front. Earth Sci. , 03 May 2021
Sec. Geohazards and Georisks
Volume 9 - 2021 | https://doi.org/10.3389/feart.2021.648919
This article is part of the Research Topic Water-Related Natural Disasters in Mountainous Area View all 39 articles
Mega earthquakes or serious rainfall storms often cause crowded landslides in mountainous areas. A large part of these landslides are very likely blocking rivers and forming landslide dams in series along rivers. The risks of cascading failure of landslide dams are significantly different from that of a single dam. This paper presented the work on risk-based warning decision making on cascading breaching of the 2008 Tangjiashan landslide dam and two small downstream landslide dams in a series along Tongkou River. The optimal decision was made by achieving minimal expected total loss. Cascade breaching of a series of landslide dams is more likely to produce a multi-peak flood. When the coming of the breaching flood from the upstream dam perfectly overlaps with the dam breaching flood of the downstream dam, a higher overlapped peak flood would occur. When overlapped peak flood occurs, the flood risk would be larger and evacuation warning needs to be issued earlier to avoid serious life loss and flood damages. When multi-peak flood occurs, people may be misled by the warning of the previous peak flood and suddenly attacked by the peak flood thereafter, incurring catastrophic loss. Systematical decision making needs to be conducted to sufficiently concern the risk caused by each peak of the breaching flood. The dam failure probability Pf linearly influences the expected life loss and flood damage but does not influence the evacuation cost. The expected total loss significantly decreases with Pf when the warning time was insufficient. However, it would not change much with Pf when warning time is sufficient.
Mega earthquakes or serious rainfall storms often cause crowded landslides in mountainous areas. A large part of these landslides are very likely blocking rivers and forming landslide dams in series along rivers. For instance, a heavy storm in 1889 triggered at least 28 landslide dams in Totsukawa, Japan (Tong, 2008); the 2004 Ms 6.8 Mid Niigata Prefecture Earthquake in Japan formed 45 landslide dams; the Typhoon Morakot in 2009 induced 19 landslide dams in Taiwan (Dong et al., 2011; Wang et al., 2016); and the 2008 Ms 7.9 Wenchuan earthquake triggered as large as 257 landslide dams (Cui et al., 2009). Many of these landslide dams were formed in series along rivers, including the Tangjiashan landslide dam, the largest one caused by the 2008 Wenchuan earthquake, and two relatively small landslide dams downstream along the Tongkou River (Cui et al., 2010; Liu et al., 2010; Shi et al., 2015). A dam failure upstream could cause outburst of water flow, leading to dam failures downstream one after another, an enormous flash flood, and serious damage downstream. Such a failure of a series of dams is called cascading failure.
Despite of many studies on breaching of a single man-made earthen embankment dam (ASCE/EWRI Task Committee on Dam/Levee Breaching, 2012) and a single landslide dam (Peng and Zhang, 2012a; Shen et al., 2020), the corresponding studies cascading dam breaching are much less. Cui et al. (2013); Zhu et al. (2012), and Zhou et al. (2013) investigated the Zhouqu debris flow in 2010 in China and conducted field tests on cascading dam breaching involving several model dams. Cao et al. (2011) compared the breaches of a single dam and two dams in a series through experimental study and numerical analysis. Niu et al. (2012) conducted an experimental investigation of the failure of a single dam and cascade landslide dams with different inflow rates. Shi et al. (2015) improved the DABA model (Chang and Zhang, 2010; Peng et al., 2014) to simulate the Tangjiashan landslide dam and two small landslide dams downstream. Since the DABA 2.0 model is validated with well-recorded cases, it is applied for cascade breaching of landslide dams in this study.
Risk assessment of landslide dam breaching is of great significance for decision making of emergency measures (Dong et al., 2011; Chen et al., 2017; Nibigira et al., 2018). The existing studies on risk assessment can be divided into two types: qualitative and quantitative risk assessment.
In qualitative risk assessment, Cui et al. (2009); Xu et al. (2009), and Yang et al. (2013) ranked the risk of a landslide dam based on some easily accessible parameters. Wang and Liu (2013); Xu et al. (2017), and Liao et al. (2018) ranked the landslide dam risk according to the subjective scours via fuzzy comprehensive methods. Qualitative risk assessment methods are efficient to get a general understanding of a landslide dam. However, they are not sufficient for scientific decision making to balance the costs and gains under different mitigation measures (Peng et al., 2014; Juang et al., 2019).
In quantitative risk assessment, Peng and Zhang (2012b, c) presented a human risk assessment method (HURAM) by using Bayesian networks. It was able to take into account a large number of important parameters and their interrelationships in a systematic structure including their uncertainties. On the basis of HURAM, Shi et al. (2017) developed an efficient method for rapid and quantitative risk assessment of landslide dams via GIS technique. The method was applied to the Hongshiyan landslide dam triggered by the 2014 Ludian earthquake.
With quantitative risk assessment, optimal decision making could be achieved by minimizing the expected total loss. The decision tree is an effective tool for risk-based decision making. Frieser (2004) presented a multistep decision tree to achieve the optimal time for warning decision making on levee failure, with which the decision could be delayed for gaining more precise information to reduce the uncertainty. Smith et al. (2006) proposed a probabilistic approach to evacuation decision-making using a distributed rainfall–runoff model based on the decision tree. Wu et al. (2010) presented a risk analysis model to evaluate the risk of underestimating the predicted peak discharge during the flooding prevention and warning operation. Su et al. (2011) developed an early warning system of dam health with systems engineering (integration control module, intelligent inference engine, support base cluster, etc.) and artificial intelligent methods. Peng and Zhang (2013a, b) built a dynamic risk decision-making model, DYDEM, using the time-series analysis method to predict the dynamic probability of dam breaching and the Bayesian network method to estimate the flood losses. Fan et al. (2018) conducted early warning of flood-affected areas when a dam break occurred in a mountain river via the fuzzy analytic hierarchy process (FAHP).
Despite that some efforts have been made for risk assessment and decision making on dam breaching floods, the corresponding studies on cascading breaching of landslide dams are seldom found. In cascading dam breaching, multi-peak floods are very likely to occur. The influence of the former peak flood on the decision for the latter peak flood is not sufficiently investigated. Moreover, the problems on risk-based warning decision making for the overlapped peak flood with amplification effects remain unsolved.
This paper conducted risk-based warning decision making on cascading breaching of the Tangjiashan landslide dam and two small downstream landslide dams (the Kuzhuba and Xinjiecun landslide dams) in a series along Tongkou River. Four scenarios were considered: the real case with the constructed spillway, a virtual case without the spillway, and two more virtual cases with amplified floods by considering the overlapping effect on the basis of the first two scenarios (Shi et al., 2015). First, cascading breaching of the three landslide dams was simulated with a dam breaching model of DABA 2.0. Second, flood routing of dam breaching was conducted by HEC-RAS software. Third, a quantitative risk assessment on the dam breaching flood in Beichuan County and Mianyang City, which were 4.5 and 85 km downstream of the Tangjiashan landslide dams, respectively, was made by using the HURAM model. Finally, optimal decision making on warning and evacuation of the population at risk was made to minimize the expected total loss, which consists of evacuation costs, monetized life loss, and economic loss. Note that despite of the ethical considerations, a human life has to be measured for evacuation decision making. A method with macroeconomic considerations is chosen in this study (Jonkman, 2007).
The method of risk-based warning decision making on cascade breaching of landslide dams consists of four components: (1) cascade breaching modeling of landslide dams with the modified DABA model (Shi et al., 2015); (2) flood routing simulation after cascade dam breaching using HEC-RAS (Hydraulic Engineering Center, 2008); (3) quantitative risk assessment considering multi-peak floods with the HURAM model (Peng and Zhang, 2012b, c); and (4) warning decision making to minimize the expected total loss.
The cascading dam breaches can be divided into three components: dam breaching upstream, flood routing, and dam breaching downstream. The procedure repeats when there are more landslide dams downstream. Normally, the outburst of inflow caused by a dam failure upstream would result in full-section overflow of the downstream dam, leading to erosion both inside the breach and in the crest of the dam. The DABA model (Chang and Zhang, 2010) was modified by Shi et al. (2015) as DABA 2.0 to simulate the cascading breaching of landslide dams and validated with recorded data. In DABA 2.0, the inflow rates are set as a time-related variable instead of some piecewise constant values; the cross section was divided into three parts: left crest, breach, and right crest to simulate the overflow and erosion. The outflow rate was calculated as the sum of the outflow rate across the breach and two parts of dam crests:
where Al, Ab, and Ar are the cross-section areas of the water above the left dam crest, breach, and right dam crest, respectively; H is the water elevation; and Zl, Zb, and Zr are the elevation of the left dam crest, breach bottom, and right dam crest, respectively.
The erosion rate E (eroded depth in a unit time) was calculated as (Chang and Zhang, 2010):
where τ is the shear stress at the soil/water interface, which denotes the erosion ability; Kd is the coefficient of erodibility; τc is the critical shear stress at initiation of soil erosion; and Kd and τc represent the erosion resistance of soils, which can be estimated using empirical equations (Chang and Zhang, 2010).
HEC-RAS is a typical model for flood routing which is developed by the United States Army Corps of Engineers (Hydraulic Engineering Center, 2008). The flood routing path is divided into river channel and floodplains with different Manning’s n values. Digital elevation models of the landslide dams and the Tongkou and Fujiang Rivers were input into the HEC-RAS to form a numerical model. The breaching outflow rate of the upstream dam was input as the boundary condition in HEC-RAS. The Manning’s n values of the river are obtained according to Chow (1959).
Dam breaching flood routing was simulated as unsteady flow via HEC-RAS. The physical laws that govern the unsteady flow are the principle of conservation of mass and momentum. The governing equation for the principle of conservation of mass is expressed as (Hydraulic Engineering Center, 2008).
where AT is the total flow area, Q is the flow rate, x is the length of the channel, and ql is the lateral inflow per unit length.
The governing equation for the principle of conservation of mass is expressed as (Hydraulic Engineering Center, 2008).
where v is the flow velocity, A is the flow area, and z is the water surface. These laws are expressed mathematically in the form of partial differential equations in HEC-RAS (Hydraulic Engineering Center, 2008).
Based on the definition of risk (Ang and Tang, 2007), the human risk (Rhuman) of dam-break floods is calculated as:
where PARi and Pi are the population at risk and the probability of loss of life for subarea i, respectively. HURAM is applied to obtain Pi in this study.
Human risk assessment method is a dam-break risk assessment model by using the Bayesian network analysis method. The Bayesian network in HURAM consists of 15 nodes (parameters) and 23 arcs (interrelationships between parameters) as shown in Figure 1. The prior (conditional) probability matrix was quantified with statistical data, existing physical models, empirical models, and judgment. HURAM works by updating the prior probabilities with evidence from a specific case using Bayes’ theory (Peng and Zhang, 2012a, b). With the hydraulic parameters obtained by DABA and HEC-RAS, the probability of evacuation and fatality can be achieved by Bayesian updating.
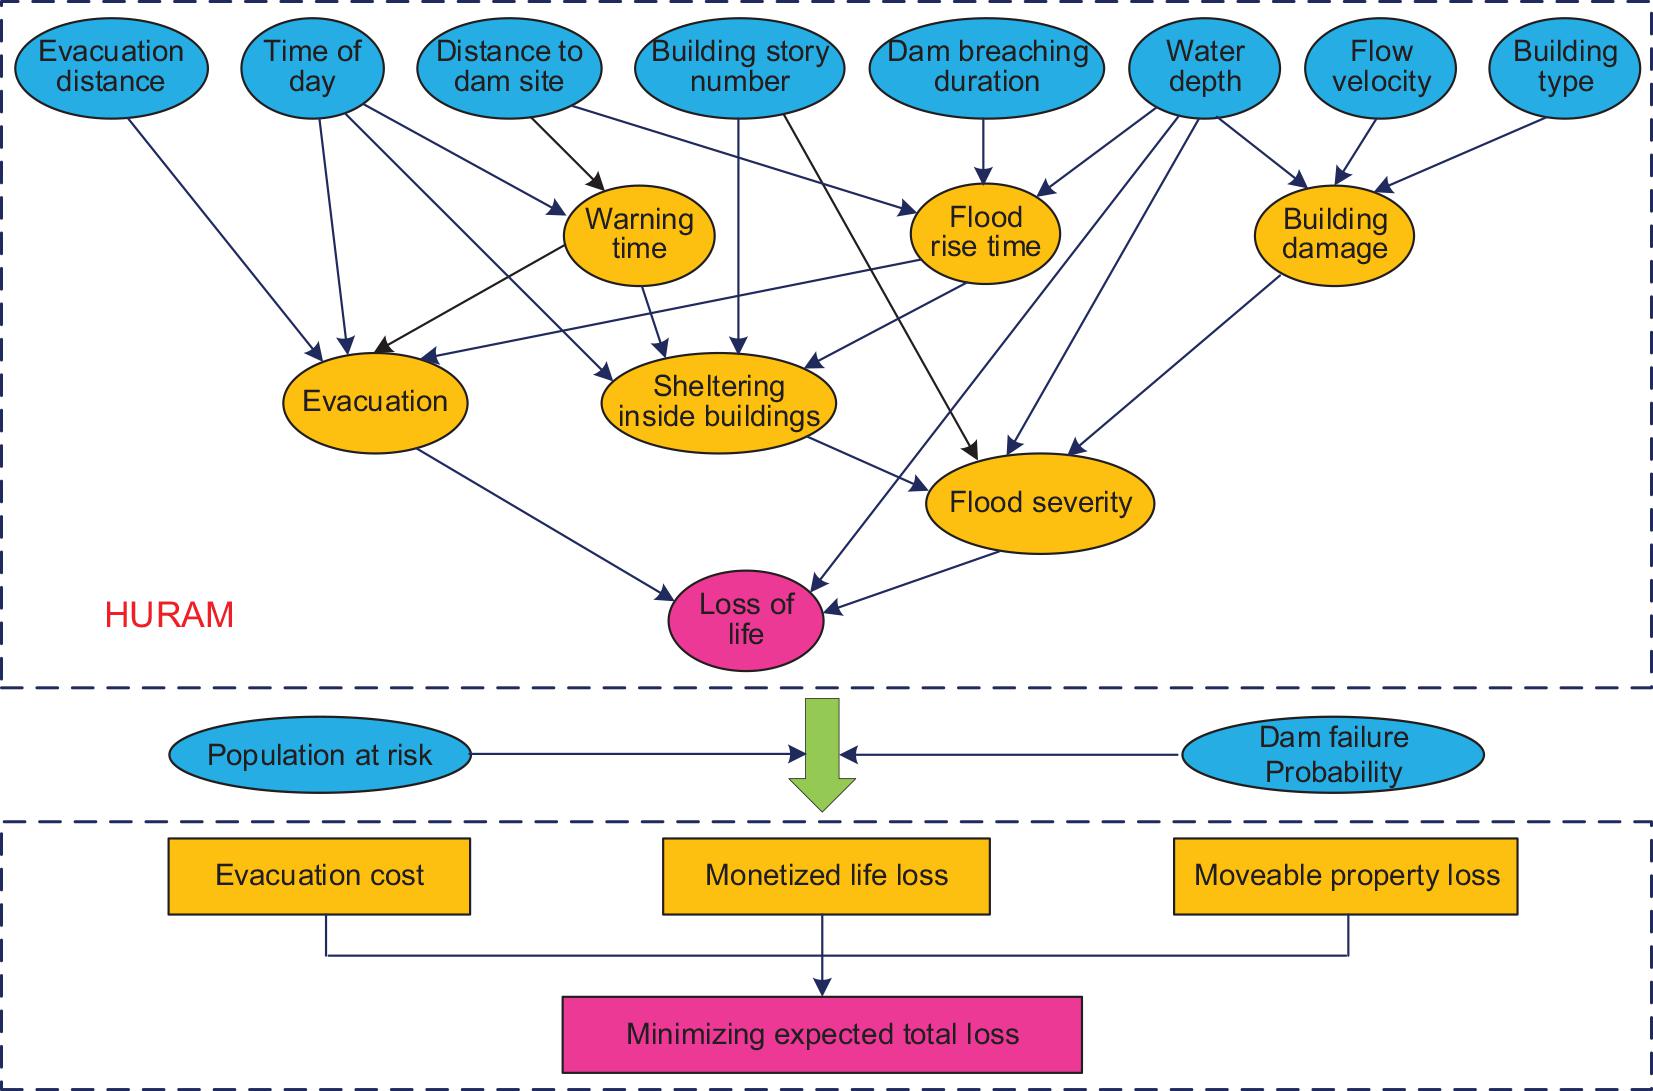
Figure 1. The logic structure of the DYDEM model modified from Peng and Zhang (2012a, 2013a). HURAM provides the evacuation rate and fatality ratio to calculate the evacuation cost, monetized life loss, and moveable properties loss. Note that the unmovable property loss that cannot be rescued by warning and evacuation is not considered in this study.
According to the Bayesian network, the joint probability P(X1,X2,…,Xn) can be expressed as the products of the conditional probability of each node given to its parents (Jensen, 2001):
where π(Xi) is the set of all the parents of Xi, or the nodes that directly affect Xi. For the discrete state Bayesian network, the basic parameters of a Bayesian network are expressed as (Zhang and Guo, 2006):
where k and j are the state number of the node Xi and its parents. According to the Bayesian theory, the posterior probability of the parameter vector is given by Zhang and Guo (2006):
Two major components in HURAM are to calculate the evacuation rate and fatality rate. The evacuation rate is defined as the probability of the successful evacuation when the available time (At) is larger than the demand time (Dt):
where the available time consists of warning time (Wt) and flood rise time (Rt):
The demand time consists of warning transmitting time (Tt), response time (Rt), and evacuation time (Et):
The distributions of the random variables in Equations (9)–(11) are suggested based on statistical data according to Peng and Zhang (2012b).
The fatality rate was suggested as a lognormal distribution as a function of water depth (Peng and Zhang, 2012b):
where μN = 1.649 and σN = 0.562 for medium flood severity, and μN = 3.376 and σN = 1.188 for low flood severity. Fr(h) was set as a constant value of 0.918 for high flood severity.
The optimal warning decision is achieved by minimizing the expected total loss LT, which is calculated as Zhang et al. (2016):
where C denotes the evacuation cost; Pf denotes the failure probability of the landslide dam; DM denotes the movable flood damage since the unmovable damage cannot be mitigated by warning and evacuation; and ML denotes monetized life loss.
The evacuation cost C is the sum of the initial costs (Ci) and GDP interruption (CGDP) (Peng and Zhang, 2013a). The initial costs (Ci) are the expenses for the evacuated people, such as temporary resettlement fee (e.g., accommodation, food, and compensation) and public maintenance fee (e.g., security and medical care). Ci is assumed proportional to the number of evacuated people and the interrupted time (Peng and Zhang, 2013a):
where c is the expense per person per day (i.e., RMB60 in 2008 in Mianyang City according to Peng and Zhang, 2013a); Peva is the proportion of the evacuated people, which is estimated using the modified HURAM; and Wt is the warning time in days. The 3-day time is the addition time for preparing the return of the residents (Frieser, 2004). CGDP proportional to the number of the evacuated people, the GDP per capita, and the interrupted time is shown as follows (Peng and Zhang, 2013a):
where GDPp is the GDP per capita in the flooded area (i.e., RMB 13,745 in 2008 in Mianyang City according to Mianyang Bureau of Statistics, 2008). A duration of 4 days is added into the interrupted time for one more day to restart their business after the residents returning.
The moveable flood damage DM is assumed proportional to the number of the people who neither evacuated nor sheltered in safe zones (in the building story beyond the inundation height) (Peng and Zhang, 2013a):
where Psafe is the probability of the people taking shelter in safe zones, which is obtained via HURAM; α is the average proportion of the moveable property per person (0.1 is assumed); and Ip is the property per person (i.e., RMB 44,800 in 2008 in Mianyang City according to Mianyang Bureau of Statistics, 2008).
Despite ethical considerations, a life is measured for rational decision making. Jonkman (2007) reviewed the methods of evaluating the human life and suggested a method with macroeconomic considerations. In this method, the value of a human life (VL) is calculated as the product of the GDP per person (GDPp) and the average longevity (L):
For instance, the GDPp and L in Mianyang City in 2008 were RMB 13,745 and 75 years, respectively (Mianyang Bureau of Statistics, 2008). Thus, the VL is RMB 1.03 million.
The monetized life loss (ML) is calculated as:
where PLOL is the probability of life loss, which can be achieved via HURAM as shown in Figures 2, 3. If political or societal influences are involved, which puts saving a life as the highest priority, new criteria should be used. In this case, the human risk should be first reduced to a certain degree before considering economic issues.
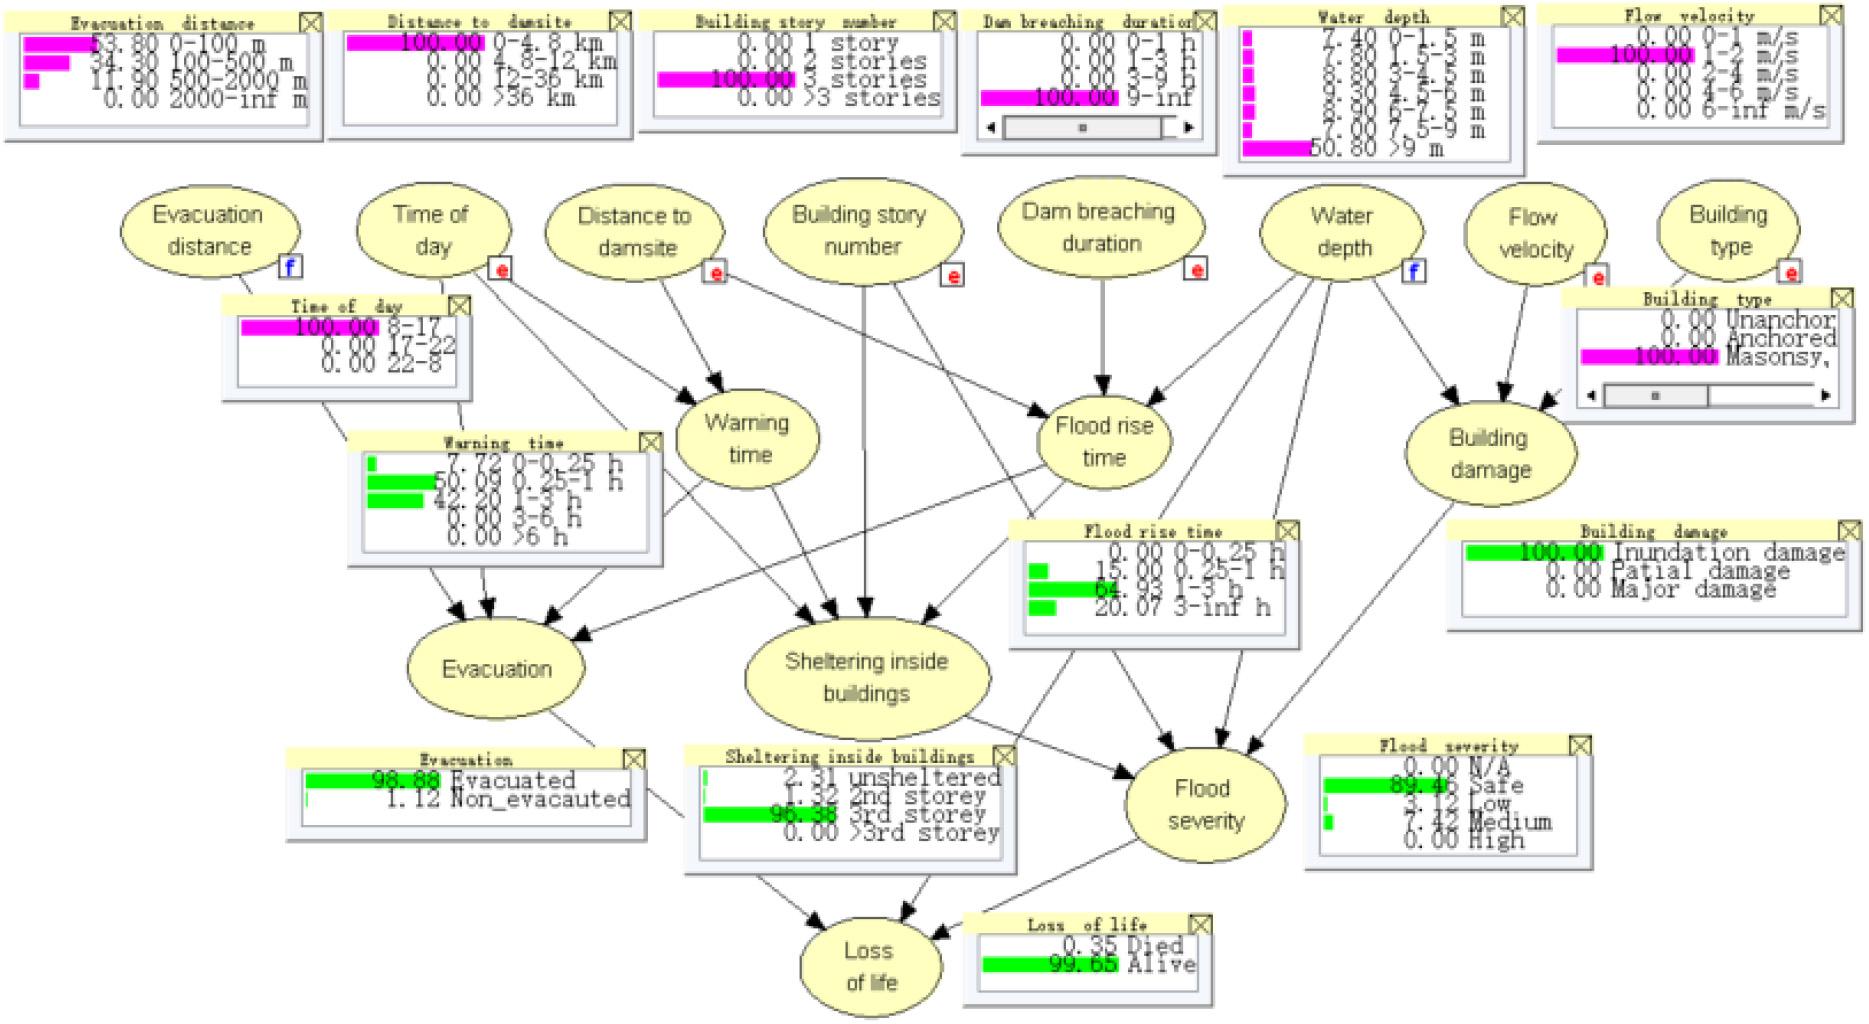
Figure 2. Risk assessment of Scenario 4 in Beichuan County.
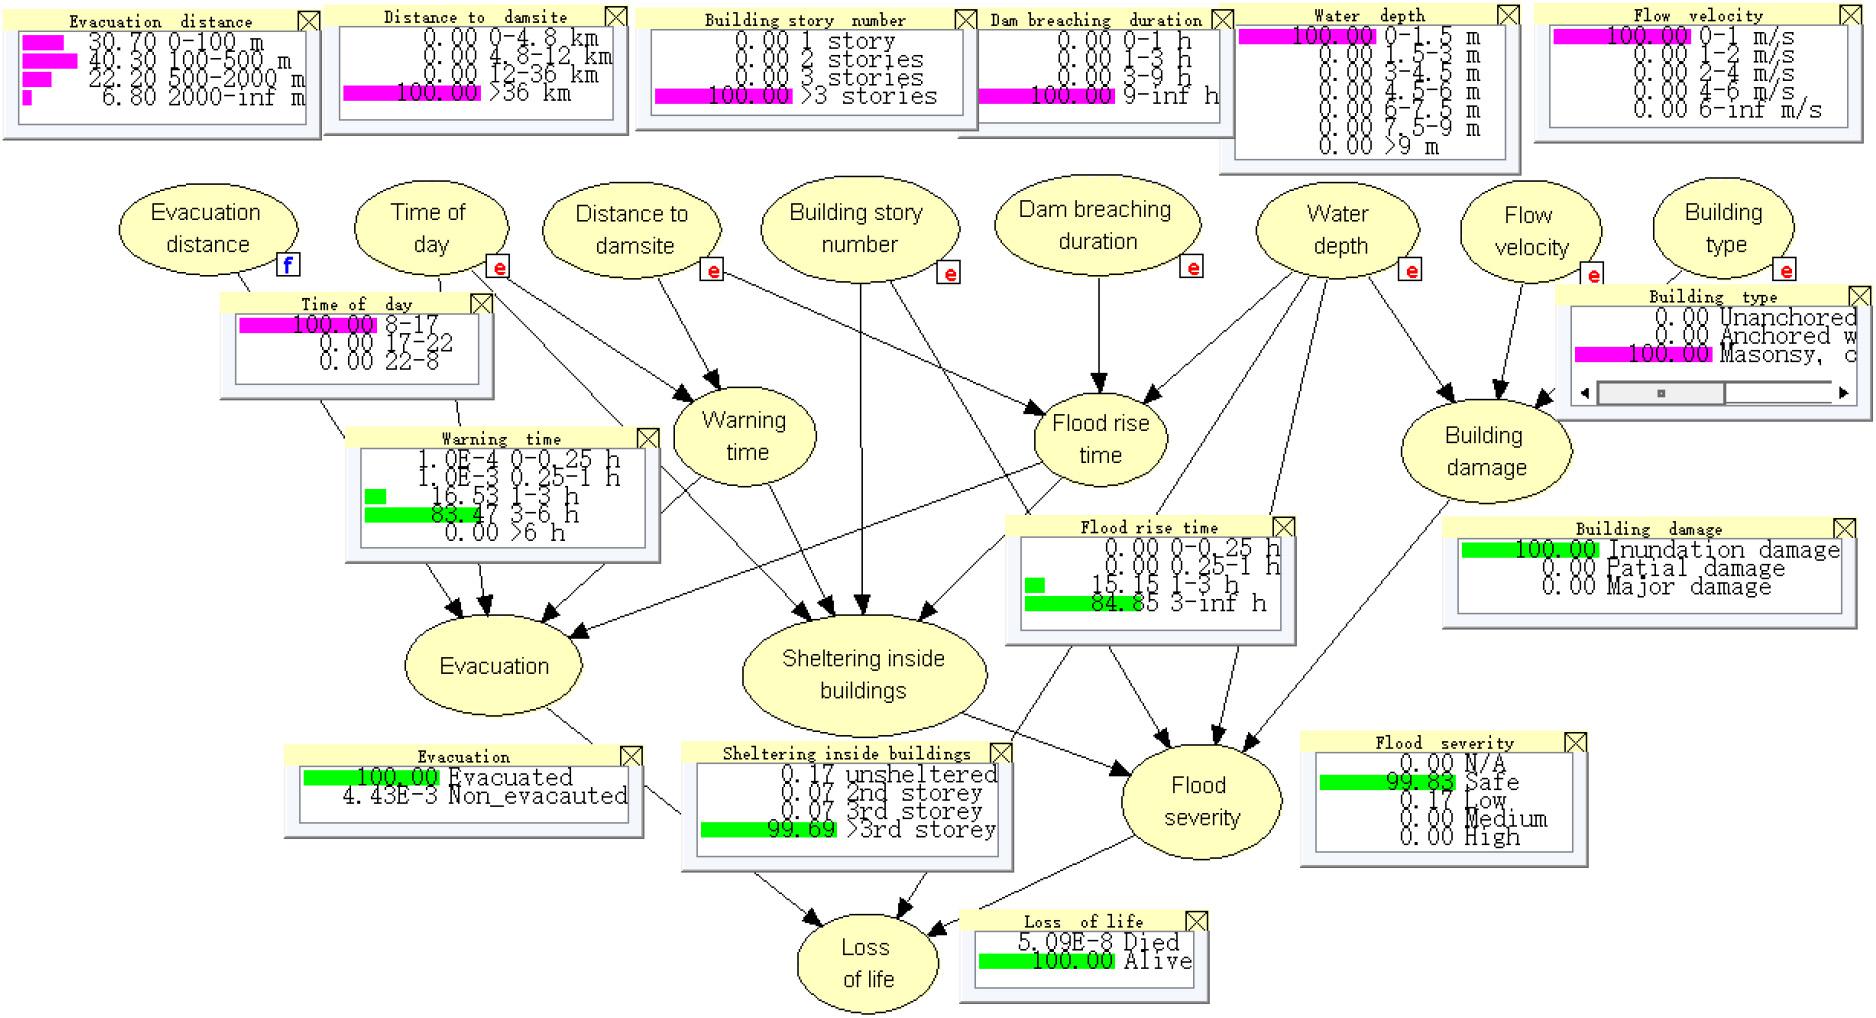
Figure 3. Risk assessment of Scenario 4 in Mianyang City.
The 2008 Ms 8.0 Wenchuan earthquake triggered as many as 257 landslide dams in Sichuan Province, China, most of which formed in series along rivers. The Tangjiashan landslide dam and two smaller downstream landslide dams (Kuzhuba and Xinjiecun landslide dams) were typical cases of this type (Figure 4). The Tangjiashan landslide dam, which was of the highest risk and concern at that time, had a height of 82 m and a lake capacity of 316 × 106 m3 as shown in Figure 4; Hu et al., 2009; Cui et al., 2009; Chang and Zhang, 2010). The Kuzhuba and Xinjiecun landslide dams, which were formed 2.0 and 3.5 km downstream of the Tangjiashan dam, had heights of 60 and 20 m, and lake volumes of 18 and 2 million m3, respectively (Zhang, 2009; Liu et al., 2010; Shi et al., 2015). The detailed information of these three dams is shown in Table 1.
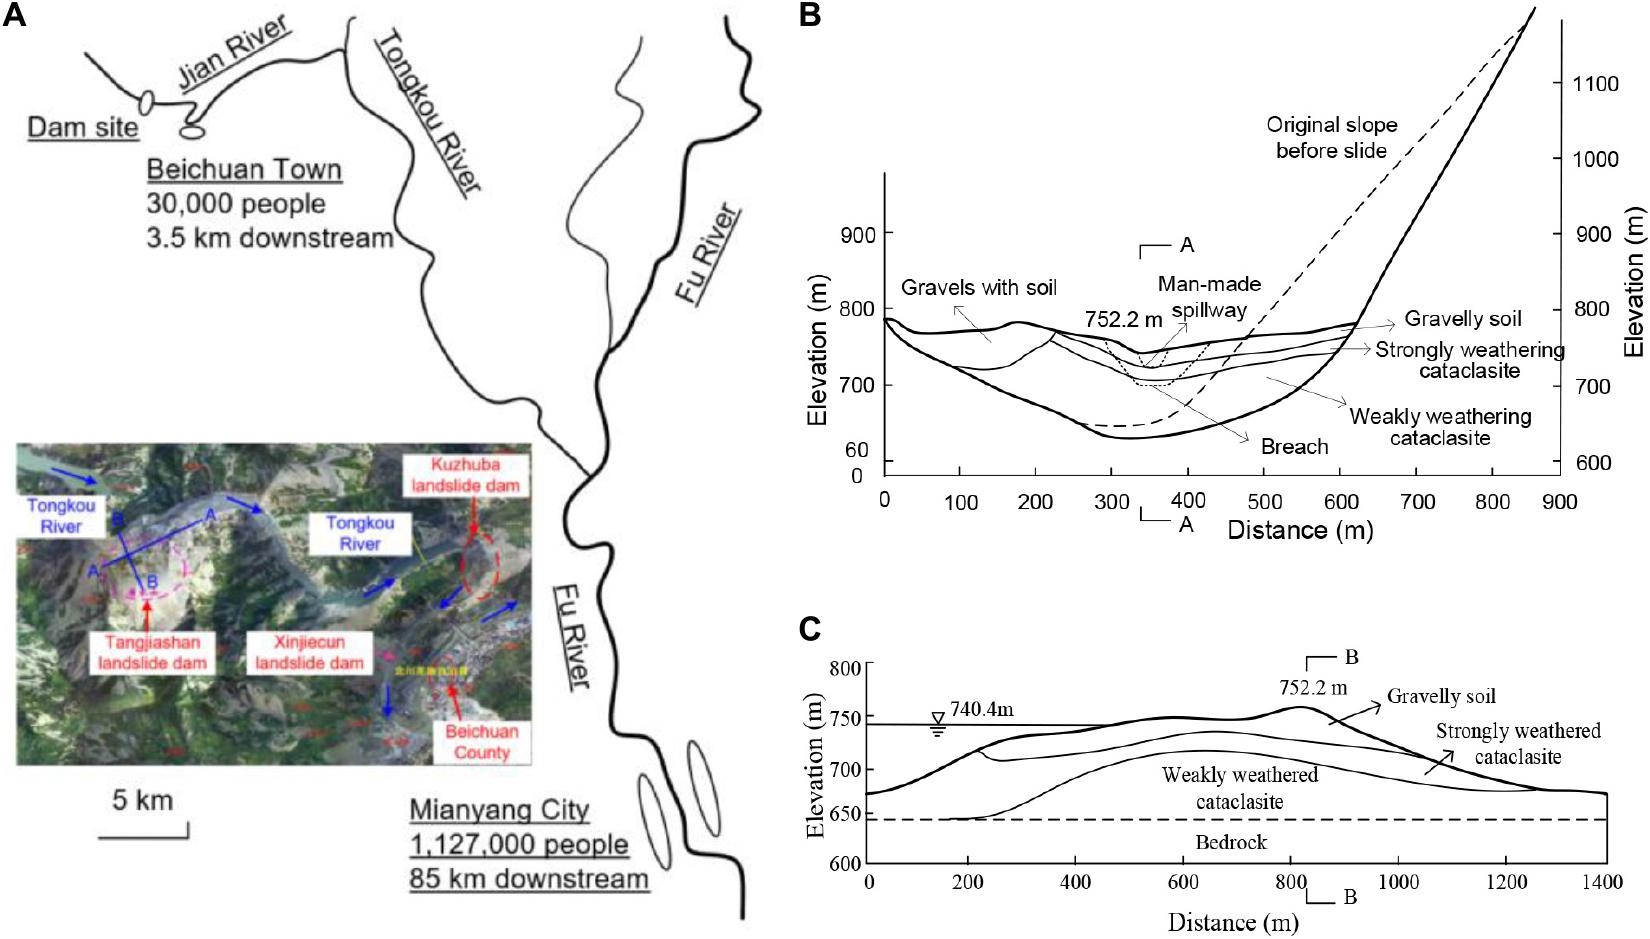
Figure 4. The location and cross section of the Tangjiashan landslide dam: (A) the location of the dam and the Beichuan Town; (B) the cross section across the river; and (C) the cross section along the river.
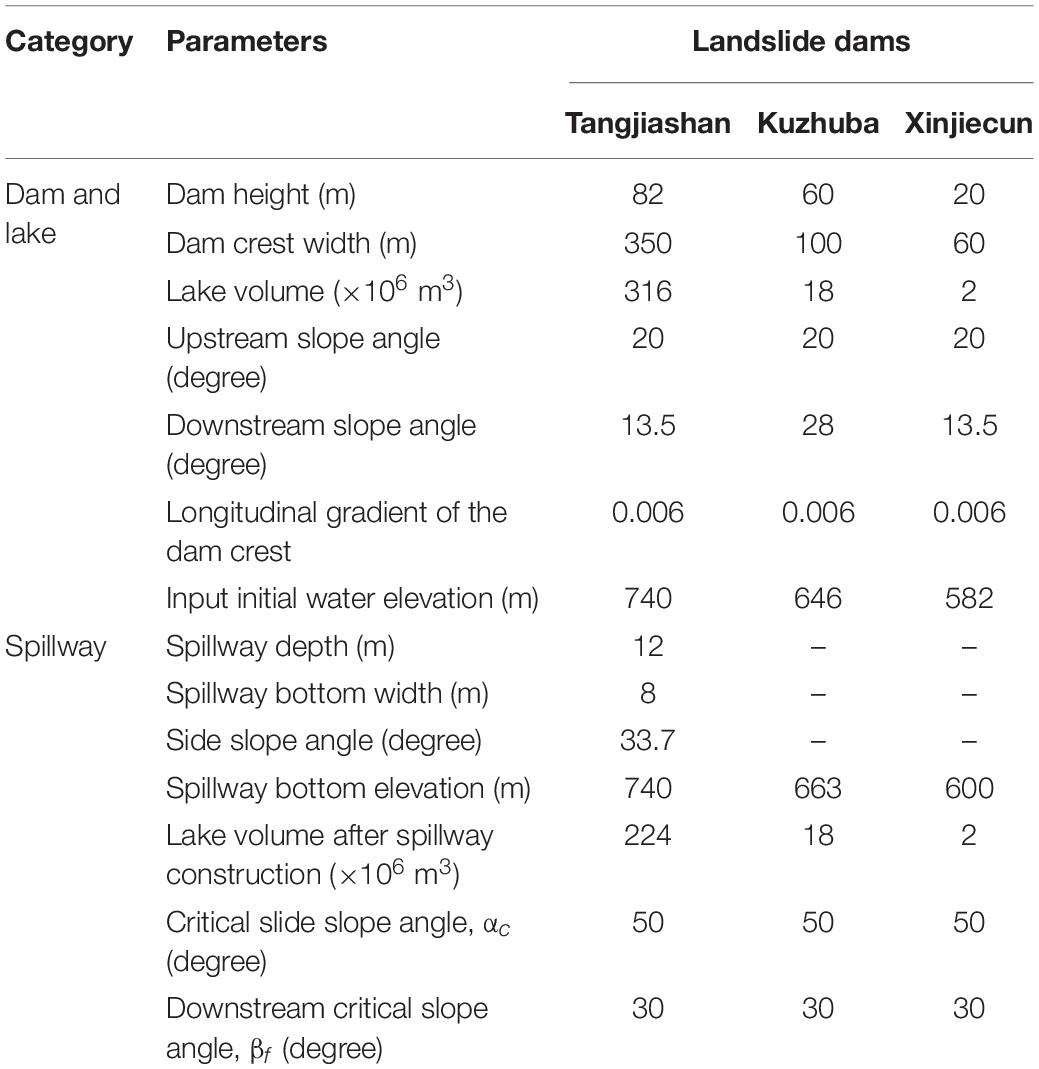
Table 1. Parameters of the three landslide dams (based on Shi et al., 2015).
The coefficient of erodibility of the Tangjiashan landslide dam varied from 120 mm3/N-s for the top layer to 10 mm3/N-s for the bottom layer (Chang and Zhang, 2010; Shi et al., 2015). The soil properties at several depths of the three dams refer to Chang and Zhang (2010). No geologic investigation was conducted on the two smaller dams. The two dams were assumed of the identical soil properties of the Tangjiashan landslide dam, and the soil properties were assumed to distribute proportionally to the dam height (Shi et al., 2015).
A spillway with a depth of 12 m, a bottom width of 8 m, and a top width of 44 m was constructed across the Tangjiashan landslide dam. The lake capacity was lowered from 316 to 247 × 106 m3 (Figure 4 and Table 1). No spillways had been constructed across the two dams downstream.
Figure 5 shows the simulated outflow rates after the cascading dam breaching of the three landslide dams as well as the records at the Tangjiashan hydrologic station and the Beichuan hydrologic station (Zhang, 2009; Shi et al., 2015). Note that the Tangjiashan station (just downstream of the Tangjiashan landslide dam) recorded the breaching outflow rate from the Tangjiashan landslide dam and the Beichuan Station (0.5 km downstream of the Xinjiecun landslide dam) approximately recorded the breaching outflow rate from the Xinjiecun landslide dam. The recorded peak discharge in Tangjiashan Station was 6500 m3/s. The recorded discharge at Beichuan Station also had two peaks of 915 and 6540 m3/s (Table 2), which were mainly caused by the breaching of the Kuzhuba and Tangjiashan landslide dams, respectively (Shi et al., 2015).
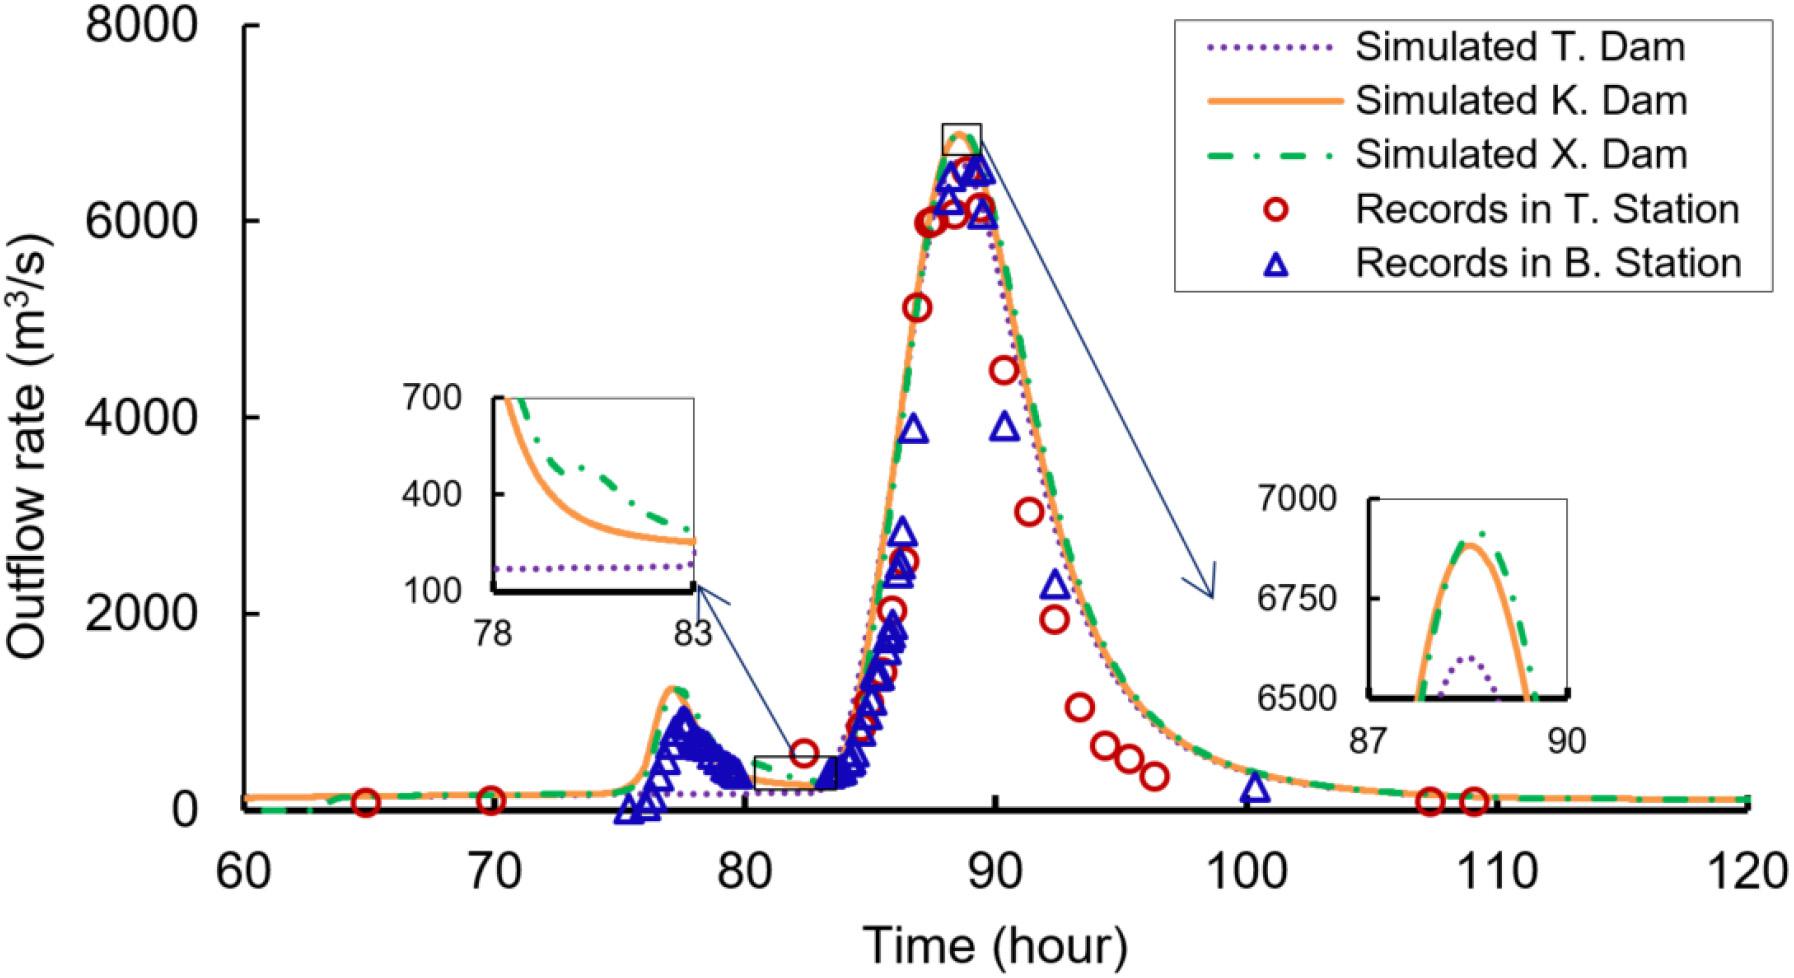
Figure 5. Simulated and recorded outflow rate of the cascading breaching of the three landslide dams (T. = Tangjiashan; K. = Kuzhuba; X. = Xinjiecun) [based on Zhang (2009) and Shi et al. (2015)].
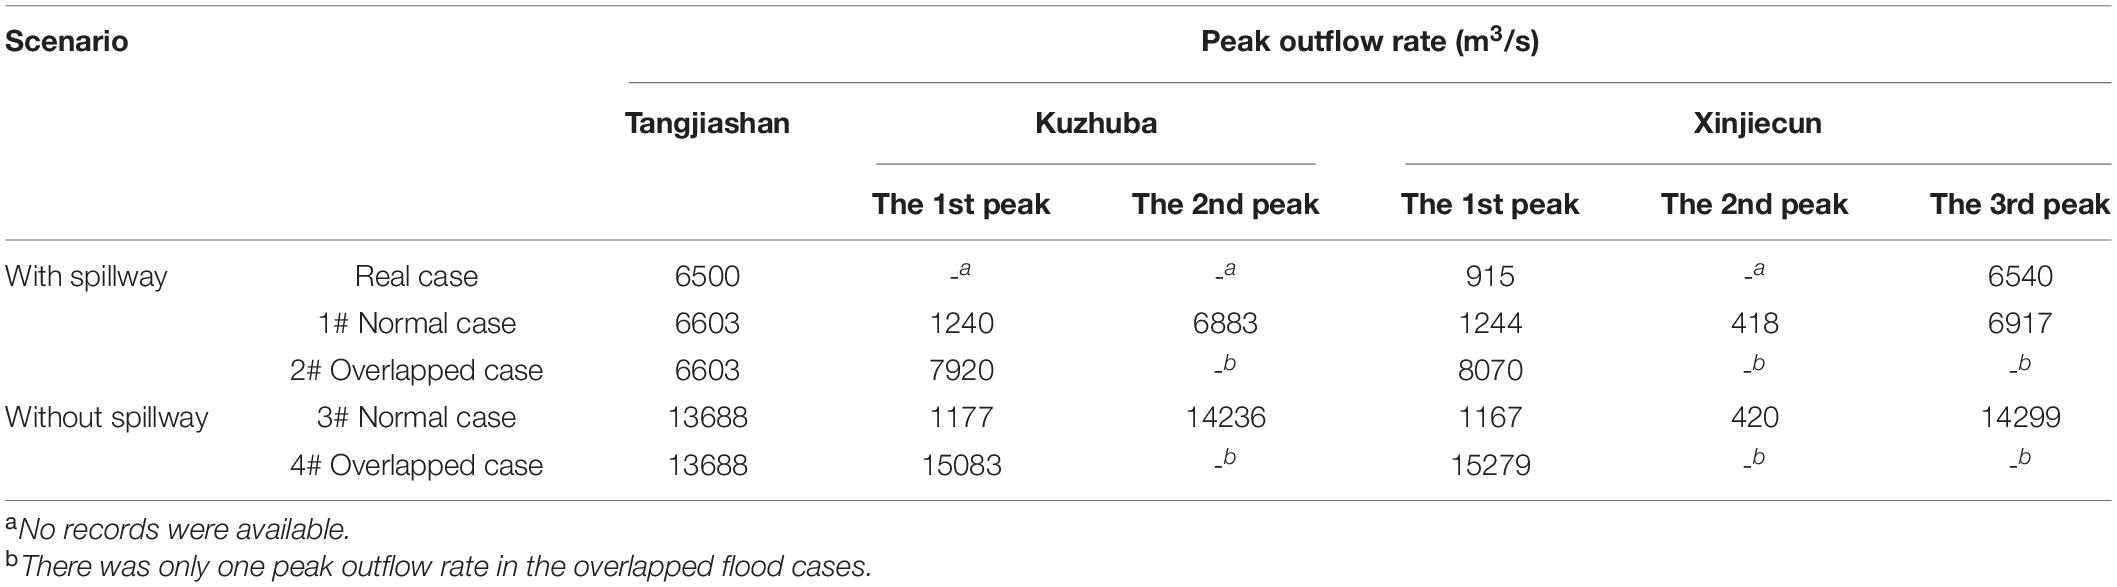
Table 2. Peak outflow rates of the cascading breaching in four scenarios by considering the constructed spillway and the flood overlapping effect.
The inputs for the modified DABA model are shown in Table 1. The Kd and τc values for the soils between any two depths (Chang and Zhang, 2010) were interpolated linearly. Figure 5 shows outflow rates during the cascading breaching of the three dams. The detailed breaching parameters are shown in Table 2. The simulated peak outflow rate of the Tangjiashan landslide dam was 6603 m3/s, which was close to the recorded value of 6500 m3/s. The simulated peak outflow rate of the Xinjiecun landslide dam had three peaks of 1244, 418, and 6917 m3/s, which were caused by the dam breaching of the Kuzhuba, Xinjiecun, and Tangjiashan landslide dams, respectively. It was pity that there were no records in the range around the simulated second peak outflow rate which was caused by the Xinjiecun landslide dam. Generally, the DABA model successfully captured the multi-peak outflow rate after cascading breaching of landslide dams in a series with relatively good simulated results.
Shi et al. (2015) found the initial water level in a landslide lake did not influence the breaching process of a single dam but might significantly affect the cascading breaching outflow rate through overlapping effects. In this study, a virtual scenario was assumed with proper initial water levels to achieve the perfect overlapping flood (with maximal peak outflow rate). Besides, two more virtual scenarios were assumed without the constructed spillway to find out the influence of the constructed spillway: without and with the overlapping effect of cascading dam breaching. In summary, four scenarios were considered as shown in Table 2.
In Scenario 1, the initial water levels in Tangjiashan, Kuzhuba, and Xinjiecun landslide dam lakes were set as the elevation of 740, 646, and 606 m, respectively, according to Shi et al. (2015). At that time, the water depths of the three landslide lakes were 70, 42, and 2 m, respectively. The Kuzhuba landslide dam first breached with a peak outflow rate of 1240 m3/s. The breaching flood from the Kuzhuba landslide dam overtopped the Xinjiecun landslide dam but did not cause immediate failure of that dam. The latter breached 3 h after the Kuzhuba dam and formed the second peak of 418 m3/s. The Tangjiashan landslide dam breached 8 h later (with the peak outflow rate of 6603 m3/s) because of its long breach initial phase due to the large dam width of 350 m (Shi et al., 2015). In short, the three landslide dams were basically breached, respectively. The simulated breaching floods of the three landslide dams from upstream to downstream had one, two, and three peaks, respectively, as shown in Table 2.
In Scenario 2, when we simply set the initial water level of the Kuzhuba landslide lake from 646 to 606 m, the breaching start time was significantly delayed and perfectly met the coming of the Tangjiashan landslide dam breaching flood. The breaching flood of the Kuzhuba landslide dam was enlarged from 6,883 to 7,920 m3/s (Table 2). It seemed that the breaching floods of the two landslide dams overlapped. In this case, the peak outflow rate of the Xinjiecun landslide dam increased from 6,917 to 8,070 m3/s.
In Scenario 3 without the constructed spillway, the lake capacity of the Tangjiashan landslide dam would become 316 million m3 instead of 224 million m3 (Table 1). The breaching of the three dams would be delayed 38 h since more time was needed to fulfill the larger lake capacity. The breaching sequence of the three dams would not be changed. In this case, the peak outflow rate of the Tangjiashan landslide dam would become 13,688 m3/s. The peaks caused by the breaching of the Kuzhuba and Xinjiecun landslide dams would not be changed much since both of them breached before the coming of the peak discharge of the breaching flood upstream. Just like Scenario 1, the three landslide dams basically breached, respectively, forming two peaks downstream of the Kuzhuba landslide dam and three peaks downstream of the Xinjiecun landslide dam (Table 2).
In scenario 4, a larger overlapped peak outflow rate was achieved when we changed the initial water level of the Kuzhuba landslide lake from 646 to 629.2 m. In the case, the breaching start time of the Kuzhuba landslide dam would be perfectly delayed and only one overlapped peak outflow rate of 15,279 m3/s occurred.
HEC-RAS 4.1 was applied to simulate the flood routing within the range of 90 km downstream, including the Beichuan County (4.5 km downstream of the Tangjiashan dam site) and Mianyang city (85 km downstream of the Tangjiashan dam site). The geometry model of the Tangjiashan landslide dam and the river downstream based on HEC-RAS is shown in Figure 6. Thirty typical cross sections were captured from Google Map, and 5475 cross sections were interpolated between typical cross sections. The cross section of the landslide dam is shown at the upper right corner in Figure 6. A 12-m-depth spillway was set initially with the elevation of 740 m. The final breach (red trapezoid), breach formation time, and breach progression were set according to the simulated results with DABA model. The Manning’s n values of the channel and the floodplains were set as 0.04 and 0.05, respectively, according to Chow (1959).
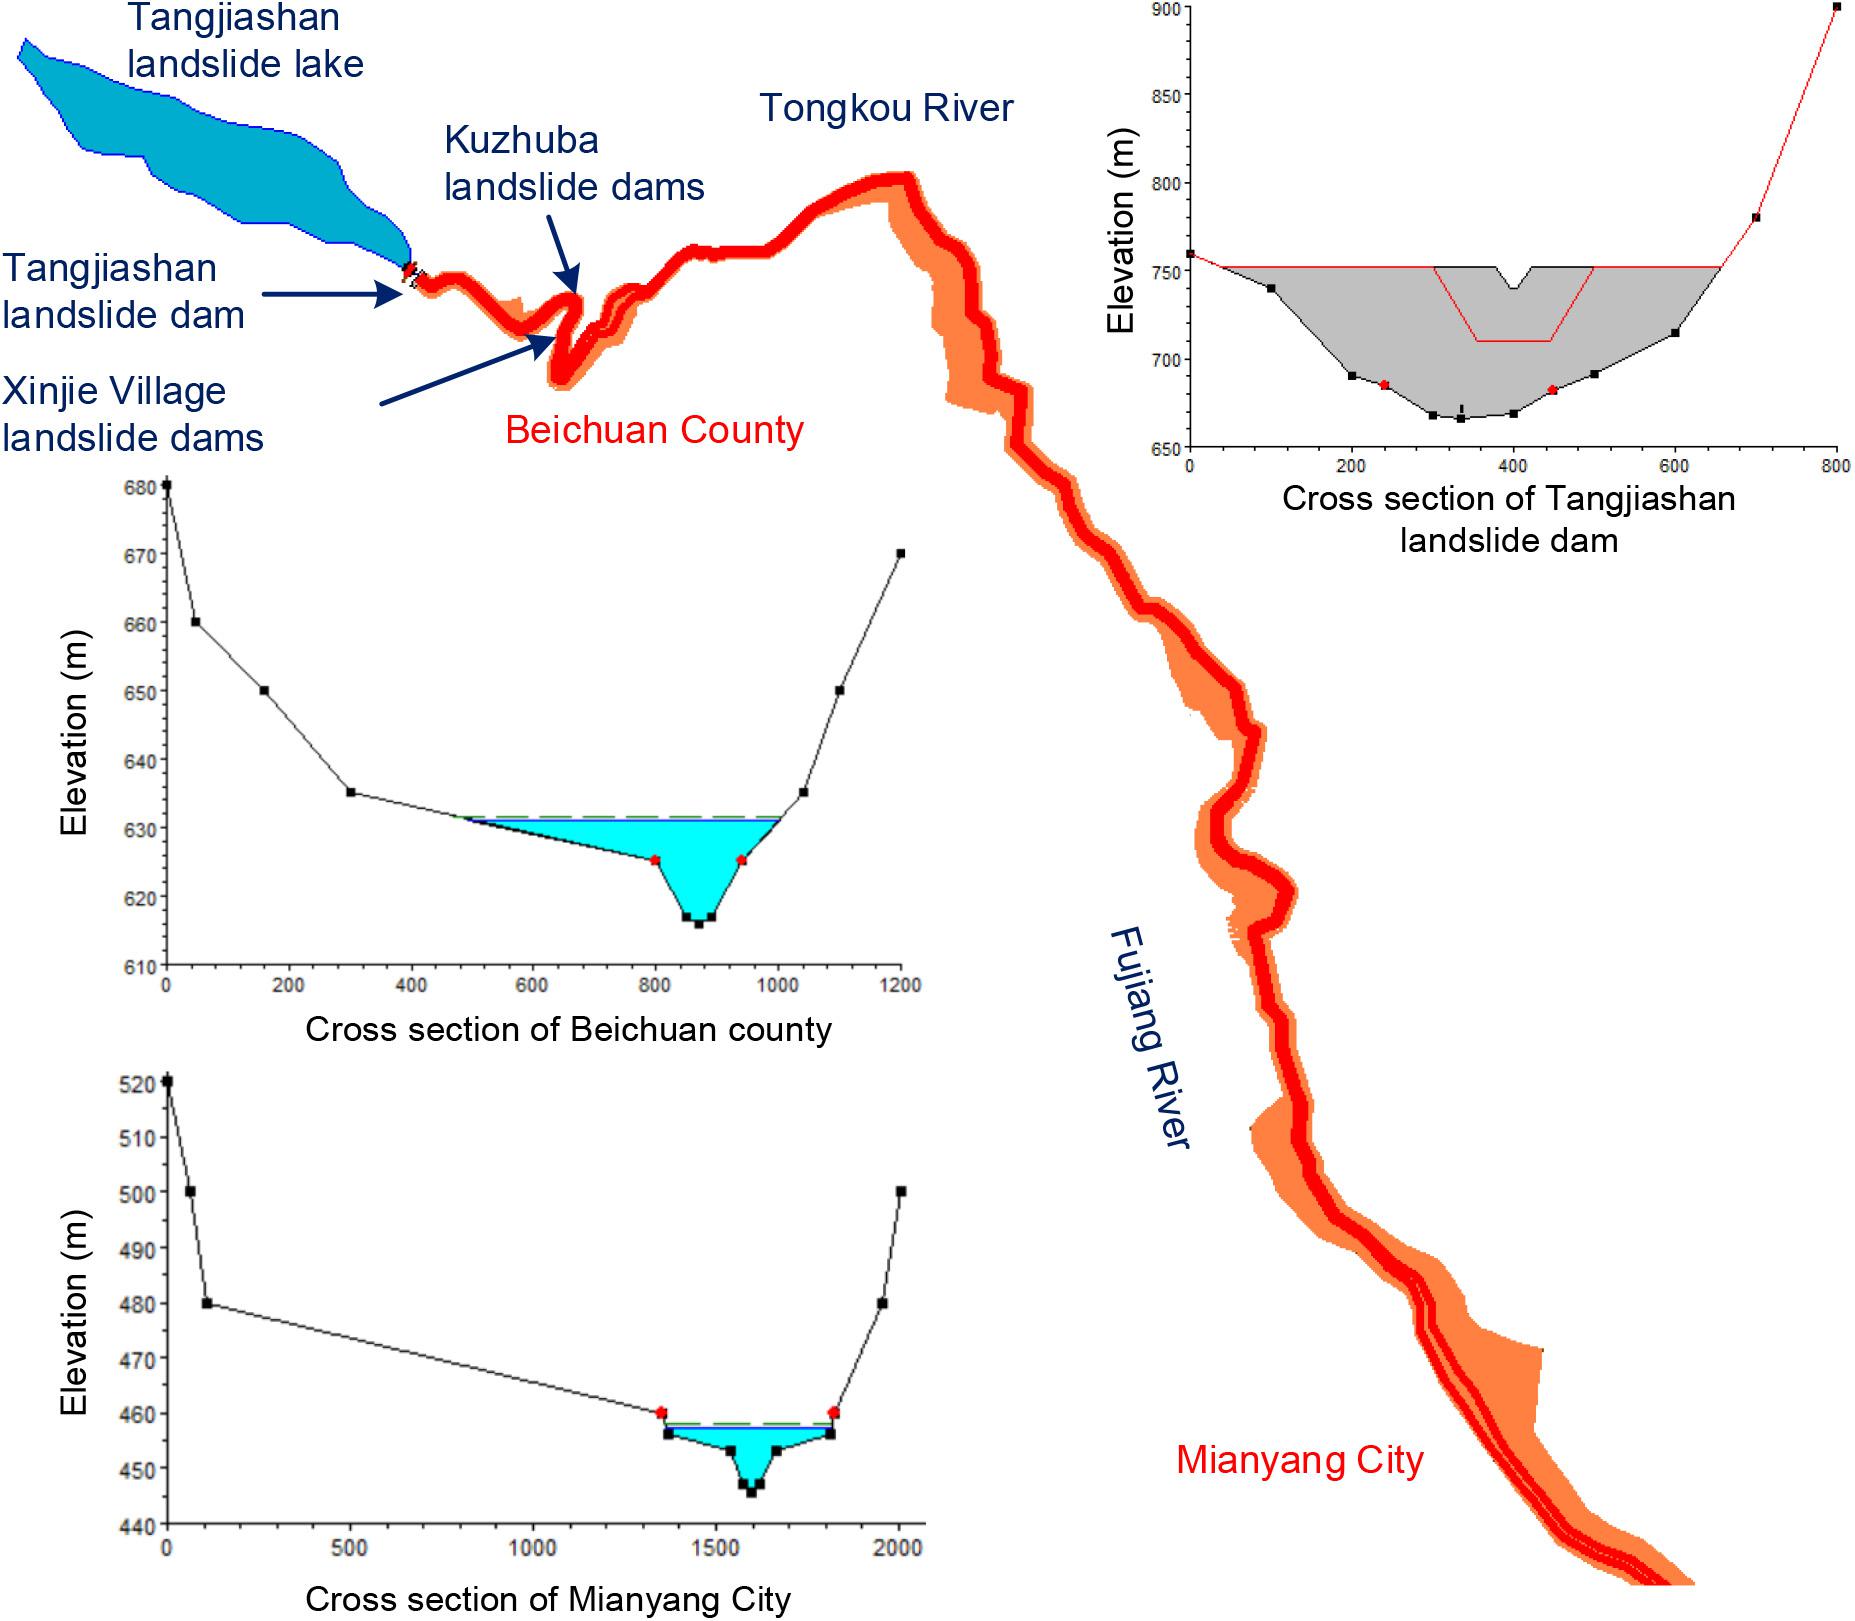
Figure 6. The geometry model of the Tangjiashan landslide dam and the river downstream based on HEC-RAS (Hydraulic Engineering Center, 2008).
The hydraulic parameter after the cascading dam breaching in Beichuan County is shown in Table 3 and Figure 7. In Scenario 1, the 1st peak flood (1244 m3/s) would flood Beichuan with the maximal water depth of 1.34 m and flow velocity of 0.24 m/s. The flooded area was 0.138 km2, accounting for 15.1% of the whole residential area. The 2nd peak flood (418 m3/s) is too small to result any flood in the county. However, the 3rd peak flood (6917 m3/s) would incur much larger inundation with the maximal water level of 6.56 m and flow velocity of 1.40 m/s. The flooded area in this case would be 0.302 km2, which accounted for 33.0% of the Beichuan County.
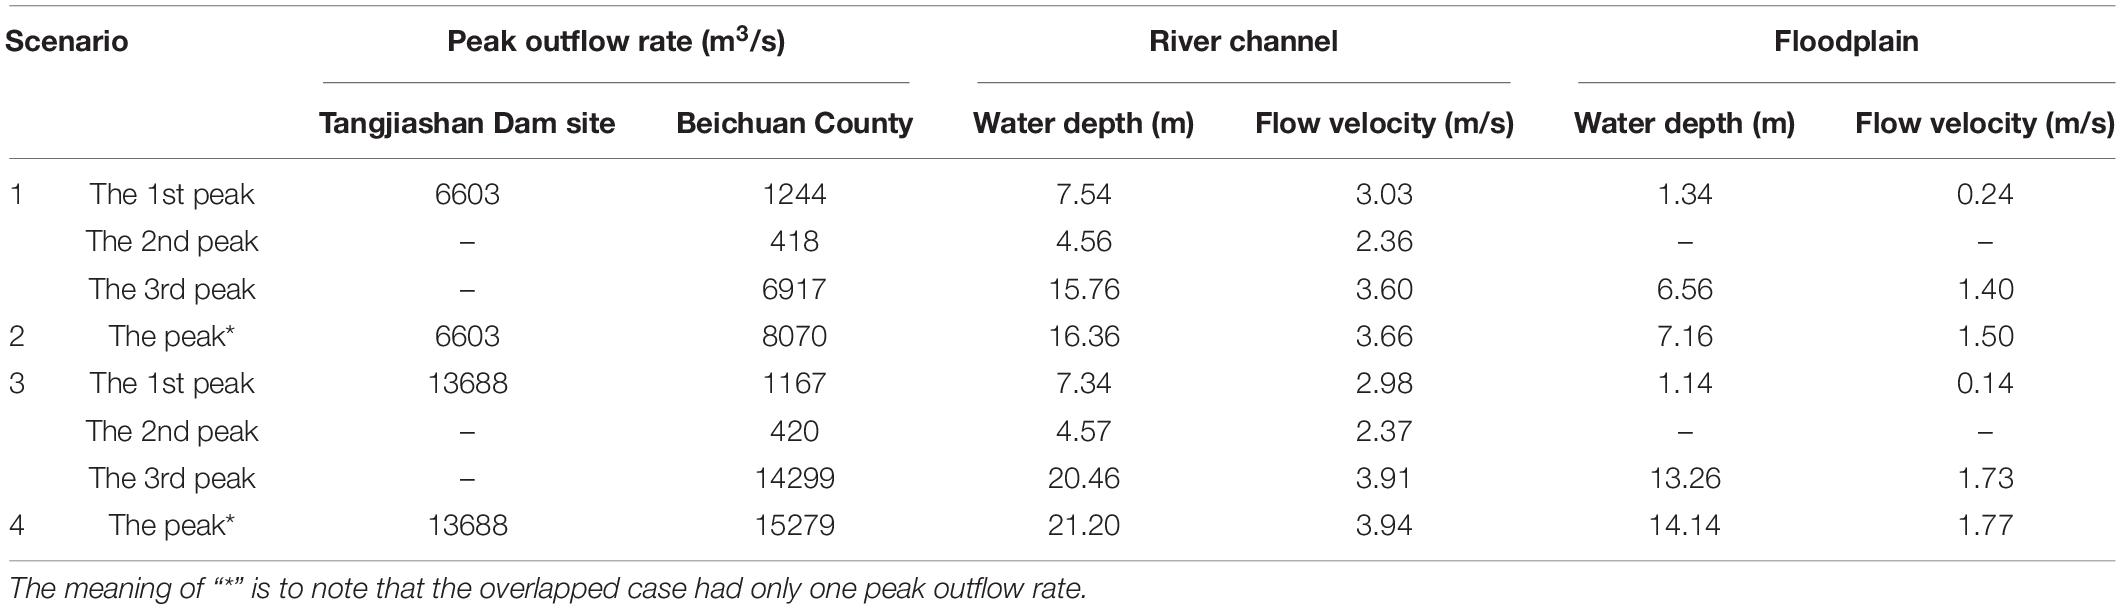
Table 3. Hydraulic parameters of cascading breach in the four scenarios in Beichuan County.
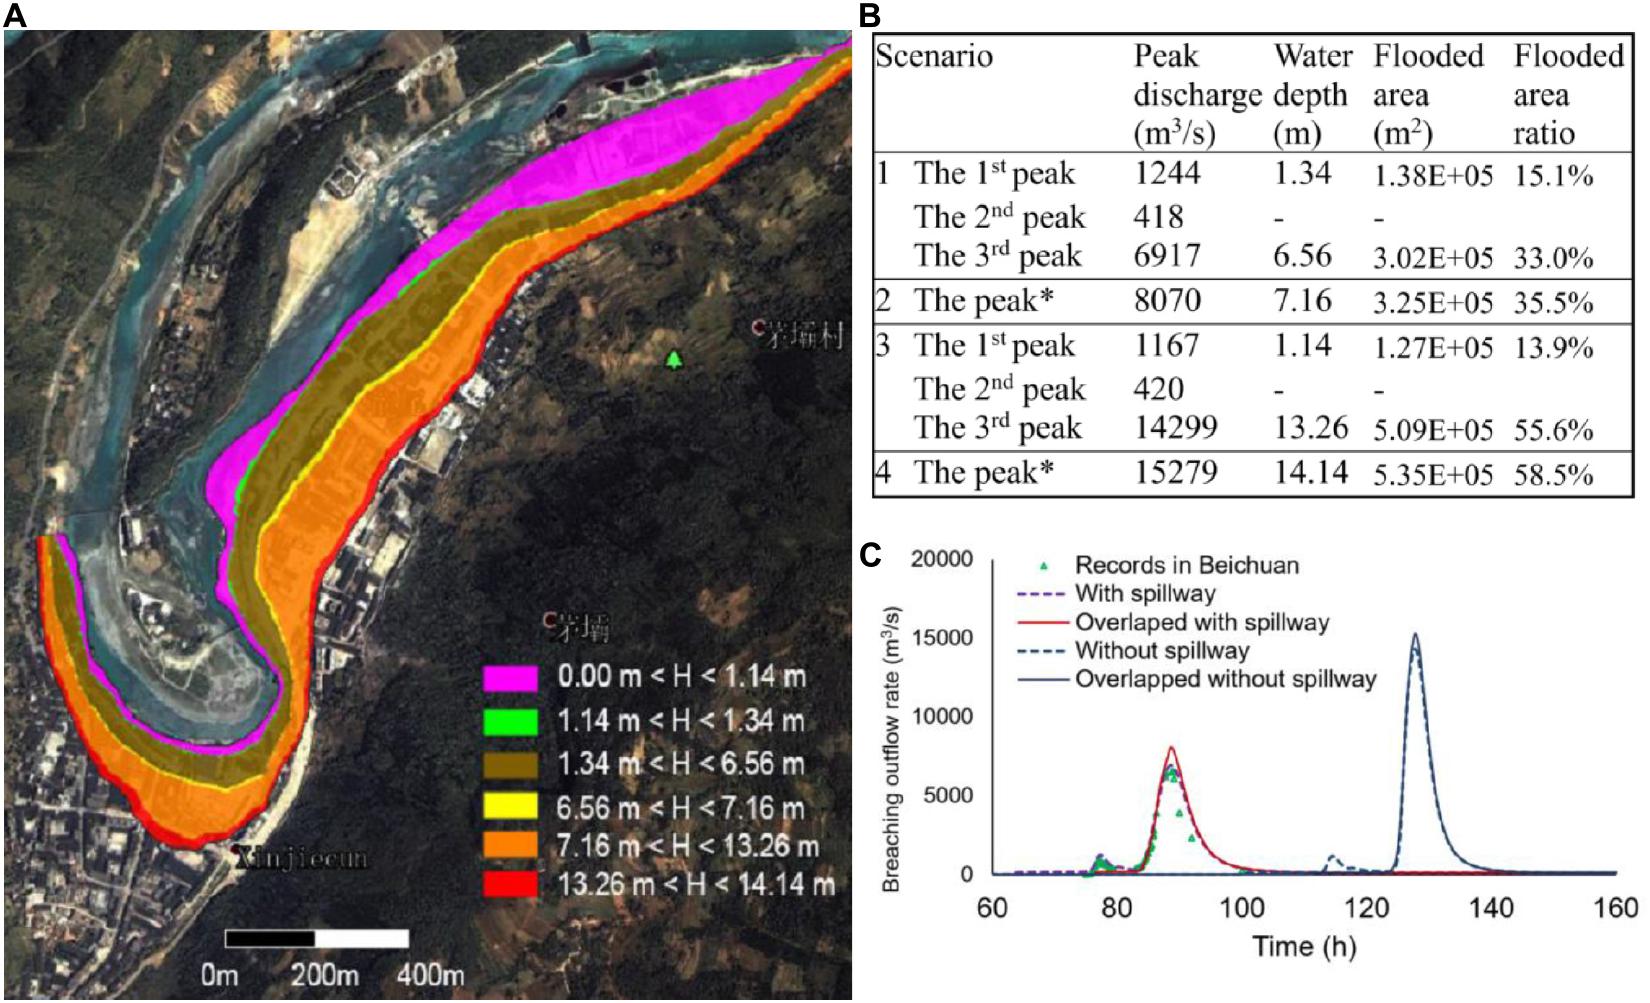
Figure 7. The hydraulic parameters of different scenarios in Beichuan County: (A) the flood inundation map; (B) the peak discharge and the maximal water depth; and (C) the discharge curves along time.
In Scenario 2, the overlapped flood with the peak outflow rate of 8070 m3/s would flood the Beichuan County with the maximal water depth of 7.16 m and flow velocity of 1.50 m/s. The flooded area would increase to 0.325 km2, which accounted for 35.5% of the Beichuan County.
In Scenario 3, the situations of the 1st and 2nd peaks were very similar to those of Scenario 1, since they were caused by the breaching of the Kuzhuba and Xinjiecun landslide dams, respectively. However, the 3rd peak flood (14299 m3/s) inundated the Beichuan County with the maximal water depth as large as 13.26 m. The corresponding flooded area would be 0.509 km2, accounting for 55.6% of the Beichuan County.
In Scenario 4, the overlapped flood with the peak outflow rate of 15,279 m3/s flooded the Beichuan city with the maximal water depth of 14.14 m and flow velocity of 1.77 m/s. The inundated area would be 0.535 km2, accounting for 58.5% of the Beichuan County.
The hydraulic parameter after the cascading dam breaching in Mianyang City is shown in Table 4 and Figure 8. Note, Mianyang is located on the bank of the Fujiang River, and Tongkou River is one of tributaries of the Fu River as shown in Figure 4. The peak discharges in the first two Scenarios were larger than those in Beichuan County due to the original discharge in Fujiang River. The peak discharge in Scenarios 1 and 2 (with spillway) were less than the designed flood of the Mianyang City with 12,000 m3/s. The city would not be inundated in these two scenarios.
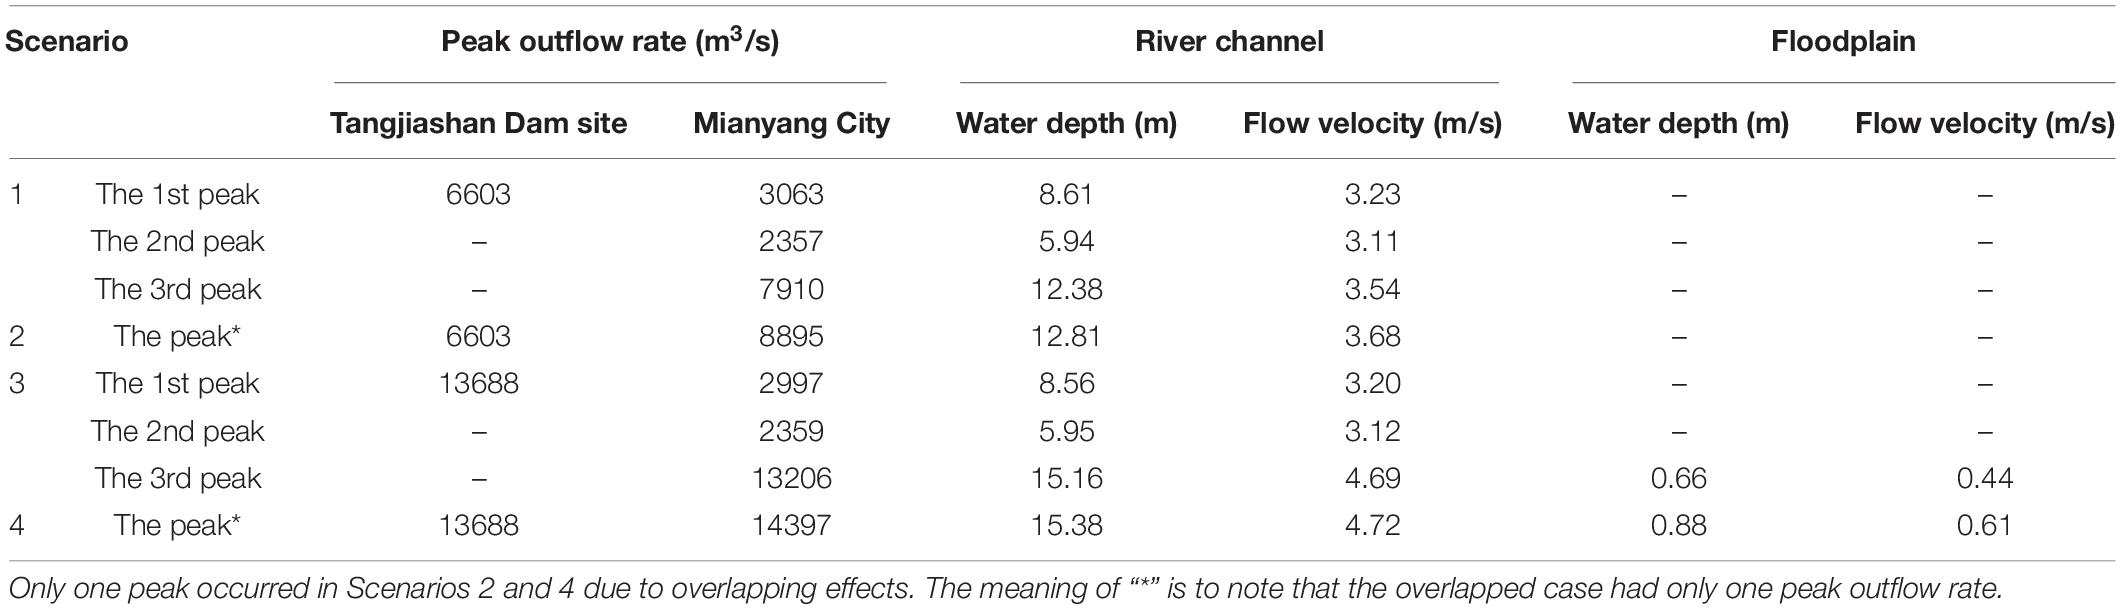
Table 4. Hydraulic parameters of cascading breach in the four scenarios in Mianyang City.
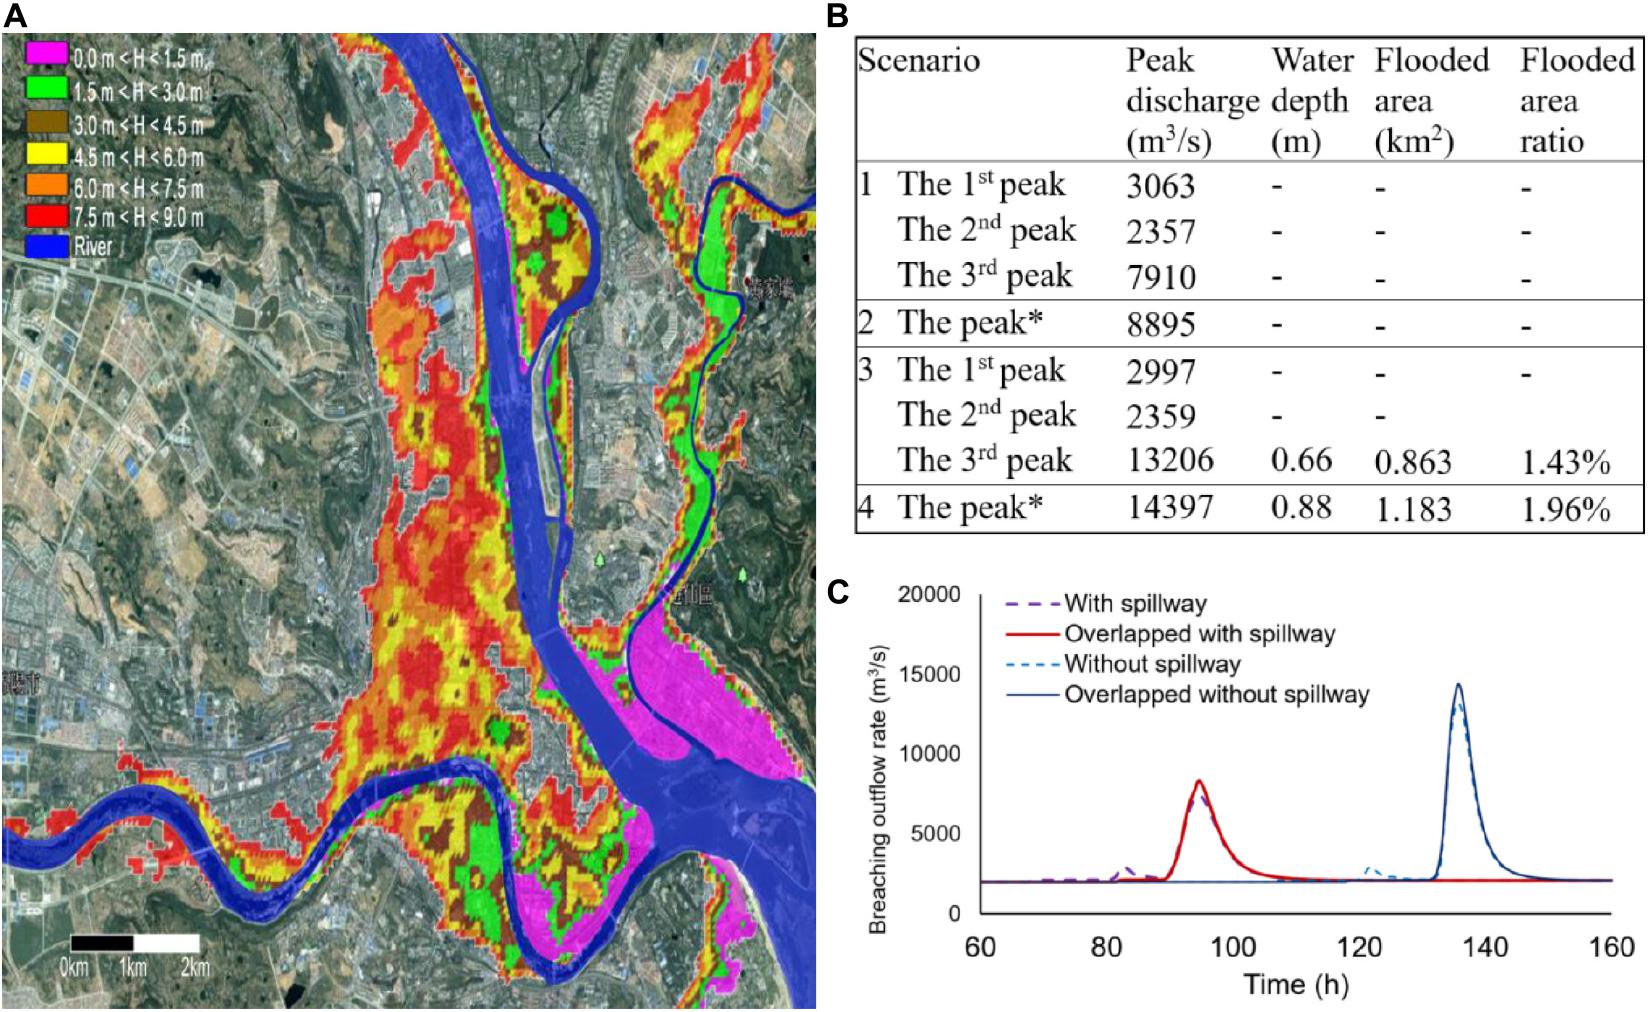
Figure 8. The hydraulic parameters of different scenarios in Mianyang City: (A) the flood inundation map with different water depth ranges; (B) the peak discharge and the maximal water depth; and (C) the discharge curves along time.
In Scenarios 3 without the spillway in the Tangjiashan landslide dam, the peak discharge with 13,688 m3/s would inundate the Mianyang City with the maximal water depth of 0.66 m and the flow rate of 0.44 m/s. The flooded area would be 0.836 km2, accounting for 1.43% of the whole city area. The maximal inundated water depth and flow rate in Scenario 4 were 0.88 m and 0.61 m/s, respectively. The corresponding flooded area would be 1.183 km2, accounting for 1.96% of the whole-city area.
The populations in the urban area of both Beichuan County and Mianyang City were assumed uniformly distributed. The population at risk (PAR) is defined as the number of the people in the inundated area without evacuation. PAR can be calculated as:
where PT is the total population in the studied area, AF is the flooded area (in km2), and AT is the total area in the studied area (in km2).
Scenario 4 is taken as an example to illustrate the risk assessment. Beichuan County was inundated of 58.5% area with PAR of 17,552. As shown in Figure 9, the values of the upper eight root nodes (without parent nodes) in the Bayesian network are inputs based on the records and previously simulated results. The values of six root nodes were deterministic in the Beichuan: “Time of day” of the dam breaching was 7:00 am (in the range of 8–17), “Distance to the dam site” was 4.5 km (in the range of 0–4.8 km), “Building story number” was assumed as 3 stories on average, “Dam breaching duration” was 14 h (in the range of >9 h), the flow velocity was 1.77 m/s (in the range 1–2 m/s), and “Building type” was Masonry, assuming that the people are uniformly distributed. The probabilities of the values of the other two root nodes, namely, “Evacuation distance” (Ped) and “Water depth” (Pwd), were determined based on the proportions of the corresponding area:
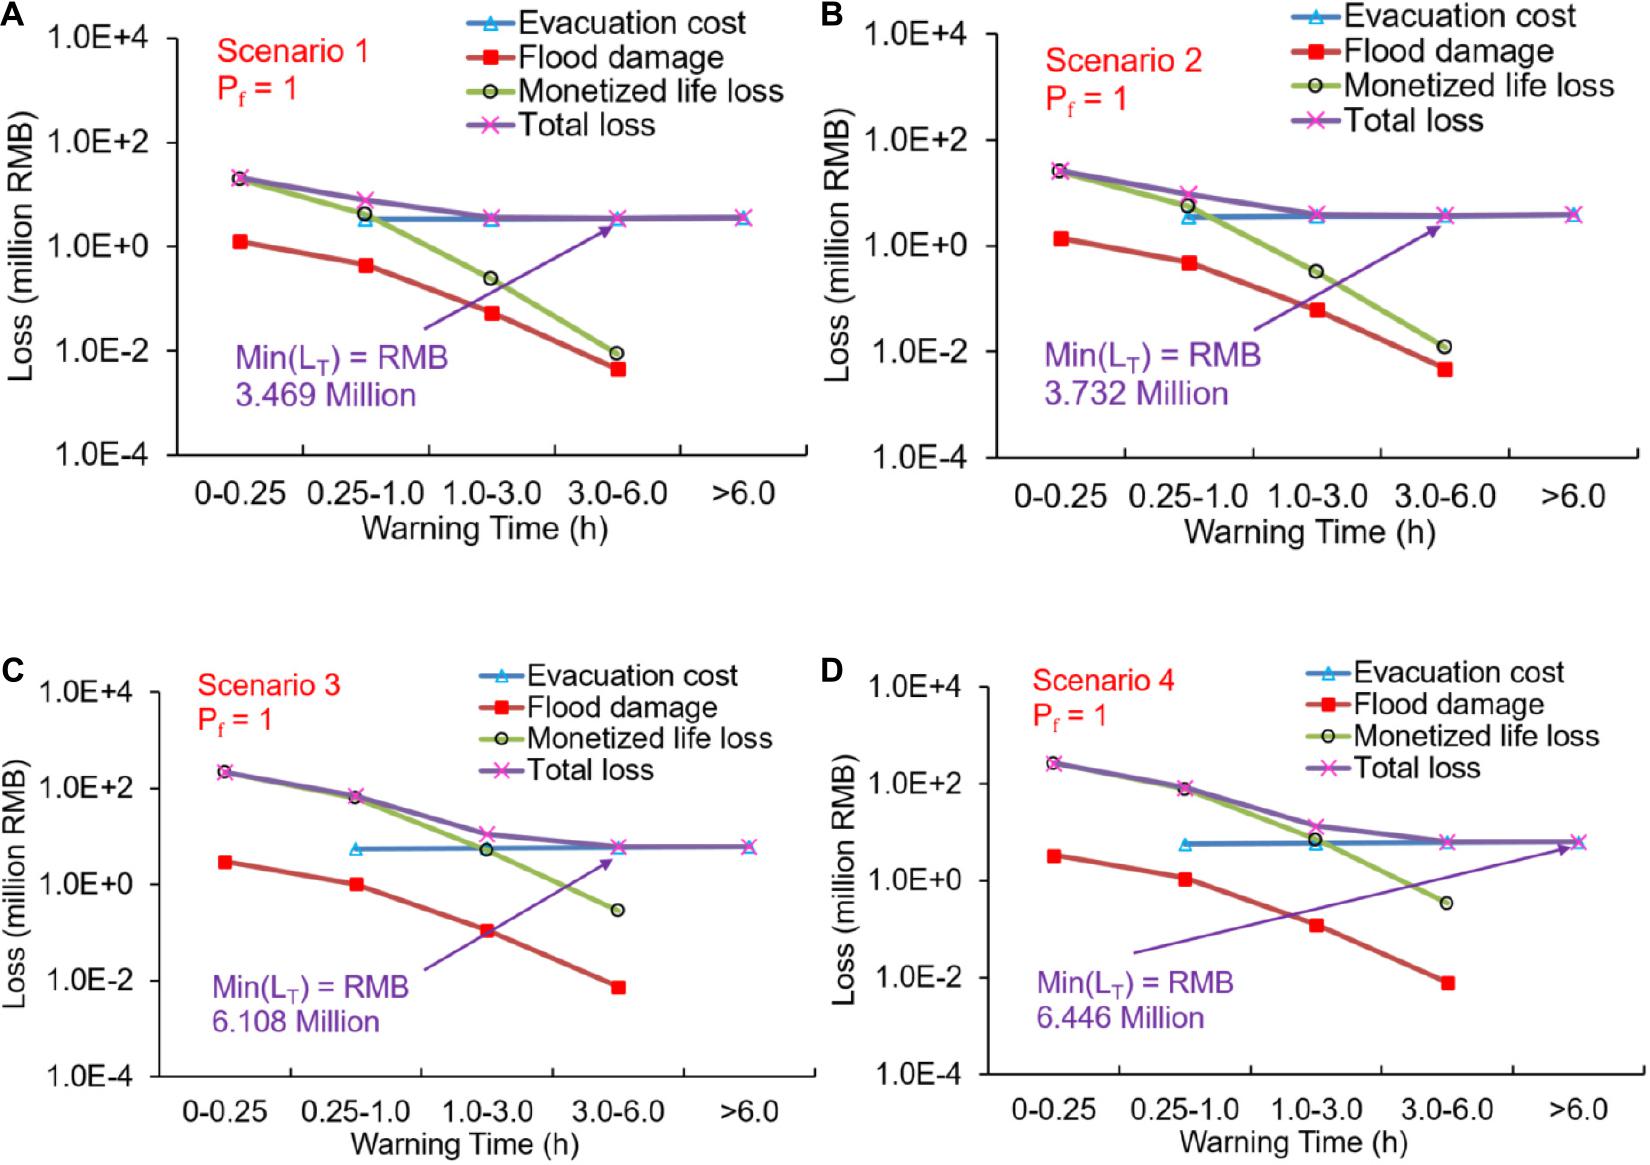
Figure 9. Three types of losses and the expected total loss (LT) vary with warning time in the four scenarios when the dam failure probability (Pf) is 1.0: (A) Scenario 1, (B) Scenario 2, (C) Scenario 3, and (D) Scenario 4.
where Aed is the area value (km2) with the studied evacuation distance range (e.g., 0–100, 100–500, 500–2000, and >2000 m), and Awd was the area value (km2) with the studied water depth range (e.g., 0–1.5, 1.5–3.0, 3.0–4.5 m…). Both Aed and Awd were obtained based on flood routing simulation as shown in Figure 7.
According to Equation (20), the probabilities of people located in the areas with “Evacuation distances” of 0–100, 100–500, 500–2000, and >2000 m are 53.8, 34.3, 11.9%, and 0, respectively. Similarly, according to Equation (21), the probabilities of the people located in the areas with “Water depth” of 0–1.5, 1.5–3, 3–4.5, 4.5–6, 6–7.5, 7.5–9, and >9 m are 7.4, 7.8, 8.8, 9.3, 8.9, 7.0, and 50.8%, respectively.
The probabilities of evacuation and life loss can be achieved by updating the Bayesian network with these input values, according to Equations (6)–(8), as shown in Figure 9. The effective warning time concentrated in the range of 0.25–3 h, with the probabilities of 50.1 and 42.2% in the ranges of 0.25–1 h and 1–3 h, respectively. The evacuation rate was large (98.88%) because of the short evacuation distance (0–500 m) and relatively sufficient warning time. The probability of life loss was not very large (0.35%) due to the large evacuation rate.
The risk assessment results in all the four scenarios in Beichuan County were shown in Table 5. In Scenario 1, the first peak outflow rate of 1,244 m3/s inundated 15.1% area of the Beichuan County with maximal water depth of 1.34 m and the population at risk of 4522. As many as 99.76% of the people managed to evacuate from the flooded area due to low flood severity, short evacuation distance, and long warning time, making the fatality rate rather small (1.2E-7). The expected fatality number was 5.3E-4. The second peak outflow rate of 418 m3/s did not incur any inundation in Beichuan. The third peak outflow rate of 6917 m3/s inundated 33.0% area of the Beichuan County with maximal water depth of 6.56 m and population at risk of 9905. Risk assessment of the 3rd peak flood was a little bit complex. Three cases were considered according to different warning strategies, as shown in Table 5:
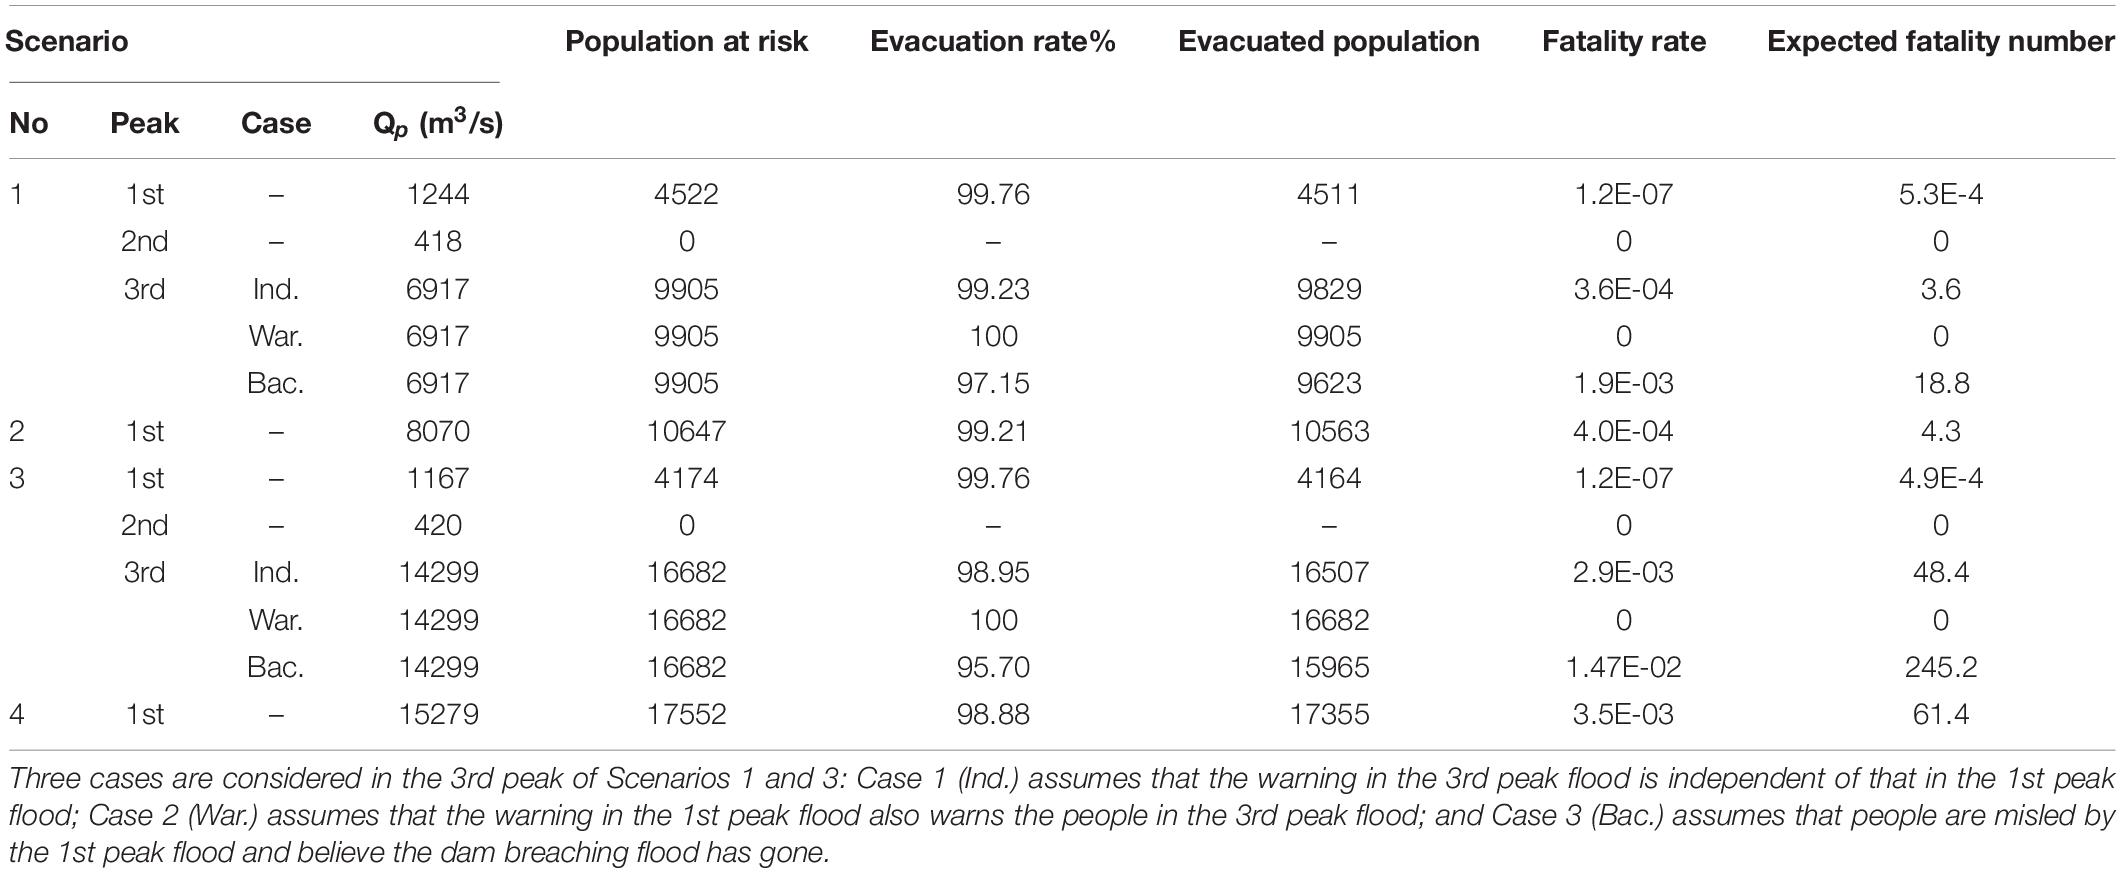
Table 5. Risk assessment results in Beichuan County.
(1) Case 1 (Ind. case in Table 5) assumed that the warning in the 3rd peak flood was independent of that in the 1st peak flood, which means the warning in the 1st peak flood did not influence the warning in the 3rd peak flood. The evacuation rate (99.23%) was a little bit less than that of the 1st peak flood because of the larger flood area and longer evacuation distance. The fatality rate (3.6E-4) was much larger than that of the 1st peak flood due to the higher water depth. The expected fatality number is 3.6.
(2) Case 2 (War. case in Table 5) assumed that the warning in the 1st peak flood sufficiently warned the people in the 3rd peak flood. Since the 1st peak occurred 11 h earlier than the 3rd peak, all the people at risk managed to evacuate from the flooded area. No people were exposed and killed by the flood in this case.
(3) Case 3 (Bac. case in Table 5) assumed that people were misled by the 1st peak flood and believed that the dam breaching flood has gone. In this case, all the people went back home before the coming of the 3rd peak flood. The coming of the 3rd peak flood would make a sudden attack to the people in Beichuan County. The warning time was assumed as the least in the model of 0–0.25 h. The evacuation rate was 97.15%, and the fatality rate was 1.9E-3. The expected fatality number was as larger as 18.8.
In Scenario 2, the overlap effect made the unique peak outflow rate (8,070 m3/s) larger than that in Scenario 1 (6,917 m3/s). The larger inundation area ratio increased to 35.5%, and the population at risk increased to 10,647. Thanks to the large evacuation rate like that in Scenario 1, most people managed to evacuate. The fatality rate was 4.0E-4, and the expected fatality number was 4.3.
In Scenario 3, the risks of the 1st and 2nd peaks were quite similar to Scenario 1. The two peak outflow rates were caused by the breaching of the two downstream dams, which was not obviously influenced by the excavated division channel. The risk assessment in the 3rd peak was also divided into three cases. In Case 1, the larger peak outflow rate (14,299 m3/s) incurred more people at risk (16,682), larger fatality rate (2.9E-3), and more expected fatality number (48.4). In Case 2, no people were killed due to the longer warning time just like Scenario 1. In Case 3, the warning time was assumed as the least of 0–0.25 h, just like Scenario 1. In this case, the evacuation rate was 95.7%, the fatality rate was 1.47E-2, and the expected fatality number was as large as 245.2.
In Scenario 4, the overlap effect with large peak outflow rate (15,279 m3/s) would impact more people (17,552) and incur more fatality number (61.4) than those in Case 1 of Scenario 3. Despite of larger breaching flood, the expected fatality number of Scenario 4 was smaller than that of Case 3 in Scenario 3. The results show that the multi-peak flood could be more dangerous than the perfect overlapping-peak flood if no distinct warning order is issued to avoid misleading.
Despite of the large number of residents (1.2 million), the breaching flood risk in Mianyang City was very low due to the long distance to dam site and low flood severity (low water depth and flow velocity). Taking Scenario 4 as an example (Figure 10), the long distance to the dam site (85 km) made the warning time much longer than that of the Beichuan County. The non-evacuation rate was as low as 4.43E-5. The low water depth (0.88 m) and the flow velocity (0.61 m/s) did not impact the buildings and people much, leading to low probability of life loss of 5.09E-8. The risk assessment results of all the four scenarios are shown in Table 6. The risks in Scenarios 1 and 2 are ignored since Mianyang City was not flooded. In Scenario 3, three cases are considered which are similar to those in Beichuan County. In Cases 1 and 2 (Ind. and War.), all people managed to evacuate from the flooded areas, leading to very low non-evacuation rates and fatality rates. In Case 3, the warning time was assumed as 0–0.25 h similar to Beichuan County. However, 99.68% people can be evacuated from the flooded area because of long flood rise time (the period between the arriving of the flood to the moment of the peak discharge, referring to Peng and Zhang, 2012b). The people were sufficiently warned by the flood itself. Among the 55 exposed people, all were able to take shelter on the top story of their buildings, which was much higher than the maximal water depth of 0.66 m. The fatality rate was very low with 1.42E-7. The risk to people can be basically ignored. In Scenario 4, despite of the more inundated area of 1.183 km2 (Figure 8) and more people of 23521 (Table 6), the human risks were also very low due to long distance to dam site and low flood severity.
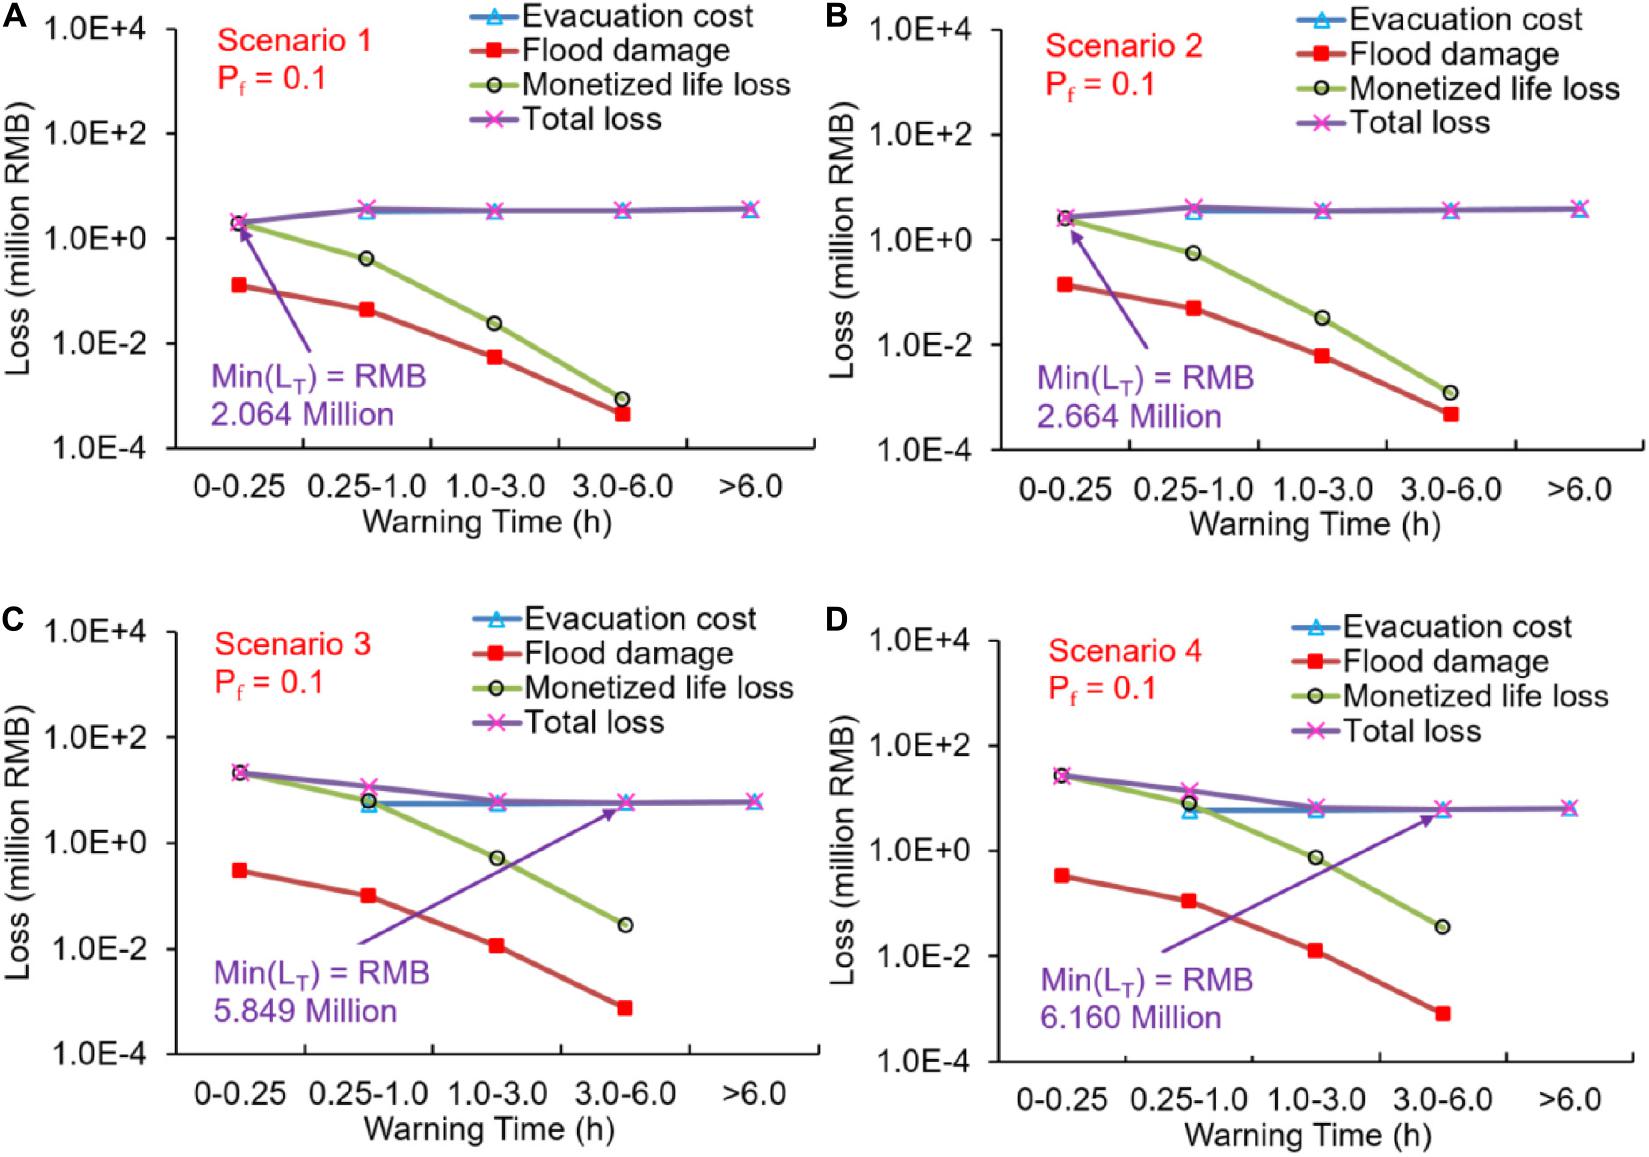
Figure 10. Three types of losses and the expected total loss (LT) vary with warning time in the four scenarios when the dam failure probability (Pf) is 0.1: (A) Scenario 1, (B) Scenario 2, (C) Scenario 3, and (D) Scenario 4.
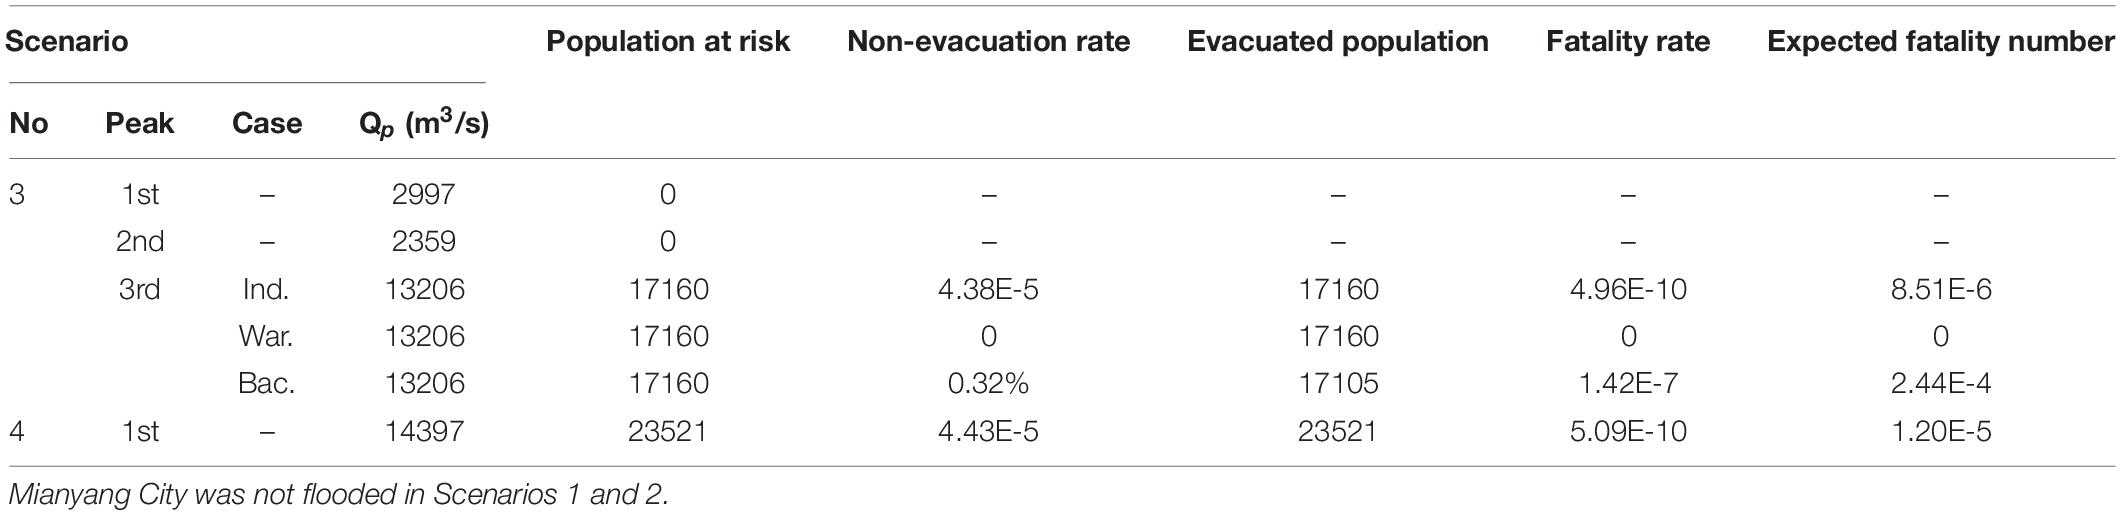
Table 6. Risk assessment results in Mianyang City.
The time of dam failure was often assumed as the deterministic value for emergent decision making within a relatively short prediction lead time (e.g., several days before dam failure). In this case, the failure probability of the landslide dam is assumed as 1.0. The three types of losses in all the four scenarios are calculated and shown in Table 7.
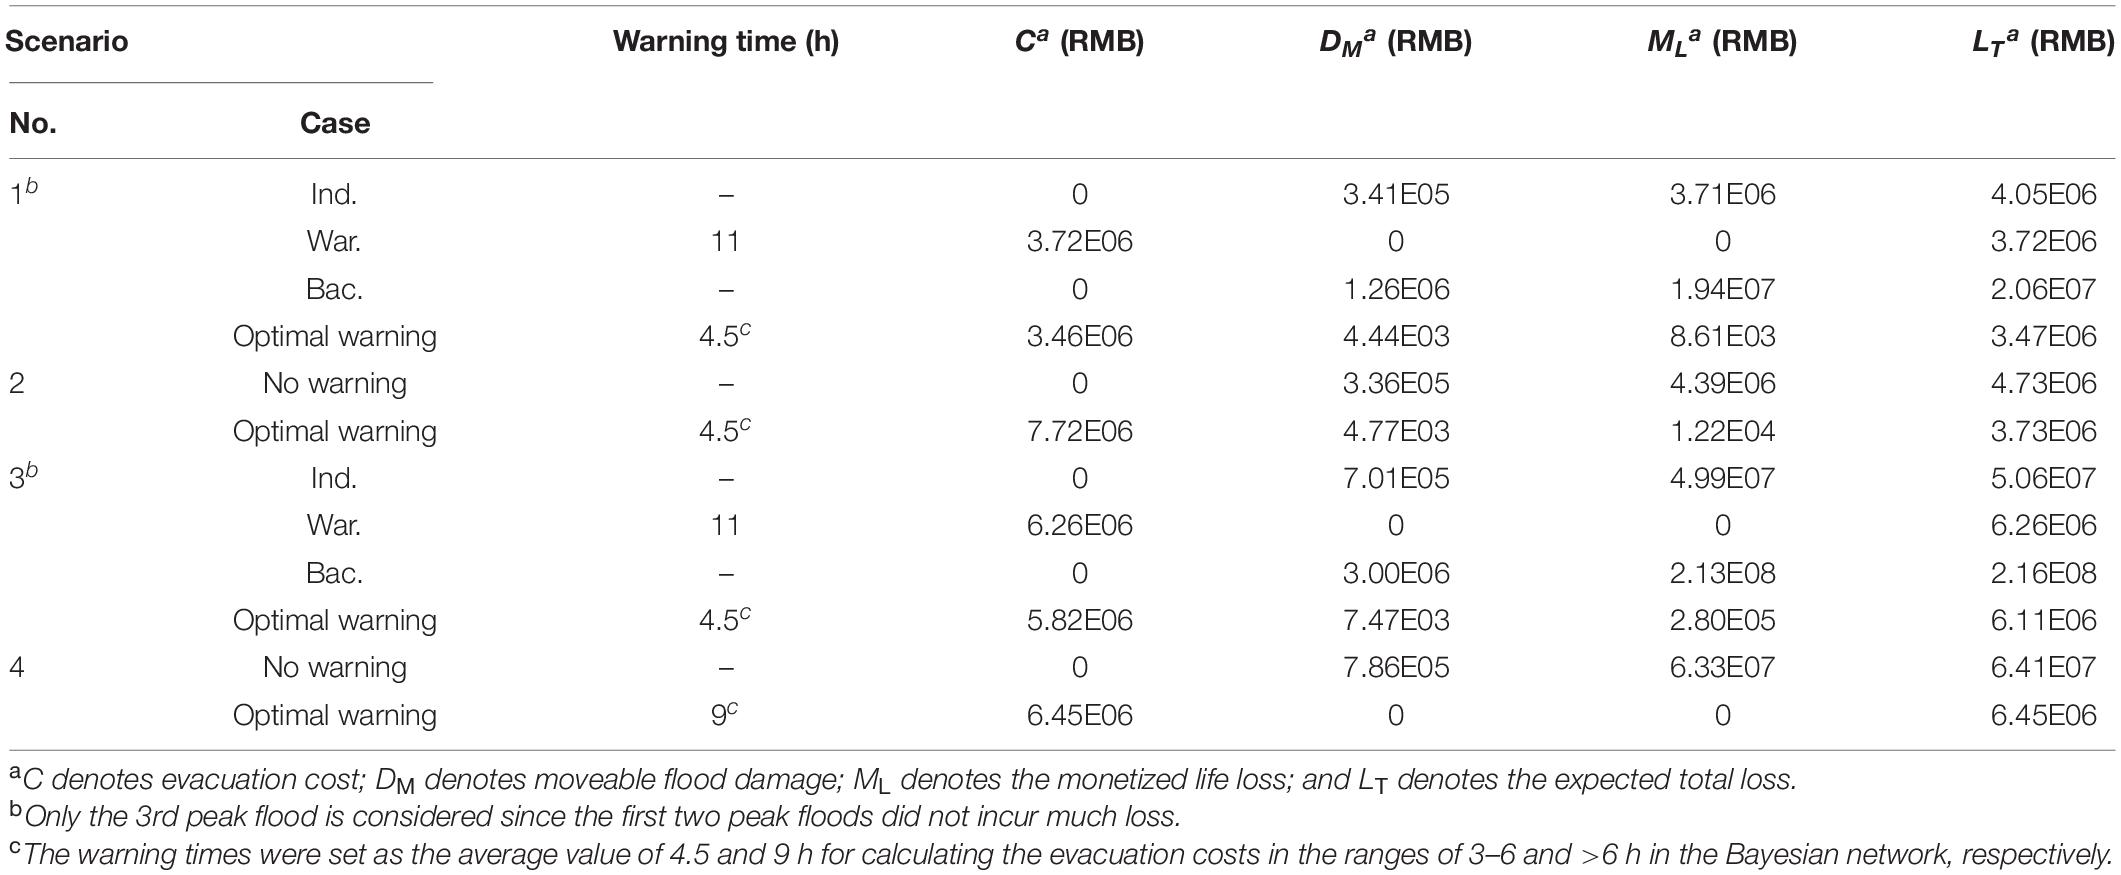
Table 7. Risk-based warning decision making in Beichuan County under deterministic dam breaching time.
In Scenario 1, only the 3rd peak flood was discussed here since the other two peak floods did not incur obvious human risk as discussed in Section 4. In Case 1 (Ind.), there is no evacuation cost since no warning was issued by governor and people were warned by the flood itself. DM was 0.34 million RMB, and the ML was 3.71 million RMB. The expected total loss was 4.05 million RMB, which was dominated by ML due to insufficient warning. In Case 2 (War.), people are warned 11 h before the dam breaching. DM and ML were avoided, but C was larger with 3.72 million RMB. In Case 3 (Bac.), the misleading by the first discharge would cause high DM (1.26 million RMB), ML (19.4 million RMB), and LT (20.6 million RMB). However, neither of the three cases was the optimal choice. The optimal warning decision would be achieved when issuing the warning 4.5 h before the dam breaching. In this case, a perfect balance was obtained between the evacuation cost and flood-cased loss, with LT of 3.47 million RMB.
In Scenario 2, the optimal warning decision was also achieved with warning time of 4.5 h. LT was RMB 3.73 million, which was only 65% of the loss when no warning was issued (RMB 5.73 million). LT was slightly higher than that in Scenario 1 (RMB 3.47 million) due to higher peak discharge.
In Scenario 3, similar to Scenario 1, the expected total losses in the first two peak floods were ignored. In the 3rd peak floods, the LTs in the first three cases (i.e., the Ind. War. and Bac. cases) were RMB 50.6 million, 6.26 million, and 256 million, respectively. The larger breaching flood made more serious impact to human lives and properties. The optimal decision was to warn the people 4.5 h before the dam breaching, with the LT of RMB 6.11 million.
In Scenario 4, the optimal warning decision can also be achieved with warning time of 9 h. LT was RMB 6.45 million which accounted for only 10.1% of LT when no warning was issued (RMB 64.1 million). LT was slightly higher than that in Scenario 3 (RMB 6.11 million) due to relatively higher peak discharge.
No warning was needed in all the four scenarios in Mianyang City for the relatively low flood severity and long distance to the dam site.
When the prediction lead time is relatively long (e.g., weeks to months), the time of dam failure is full of uncertainty. For instance, an unexpected heavy rainfall would highly increase the inflow rate of the landslide lake, substantially putting forward the dam failure. The dam failure probability is actually a time series with variation along time. In this section, the dam failure probability (Pf) is assumed as 1.0, 0.1, and 0.01 to investigate the influence of the failure probability on the optimal warning decision.
Figure 11 shows the three types of losses and the expected total loss (LT) varying with warning time with a dam failure probability (Pf) of 1.0 in the four scenarios. The optimal decision of Scenario 1 was to warn the people 3.0–6.0 h before the predicted dam failure time, with the minimal LT of RMB 3.469 million. In Scenario 2 with slight larger breaching flood, the optimal decision strategy did not change with a slight larger minimal LT of RMB 3.732 million. In Scenario 3, the optimal warning was also 3.0–6.0 h with the minimal LT of RMB 6.108 for much larger flood severity. In Scenario 4, the increase of the flood risk should be properly reduced by more warning time of >6.0 h, with slightly larger minimal LT of RMB 6.446.
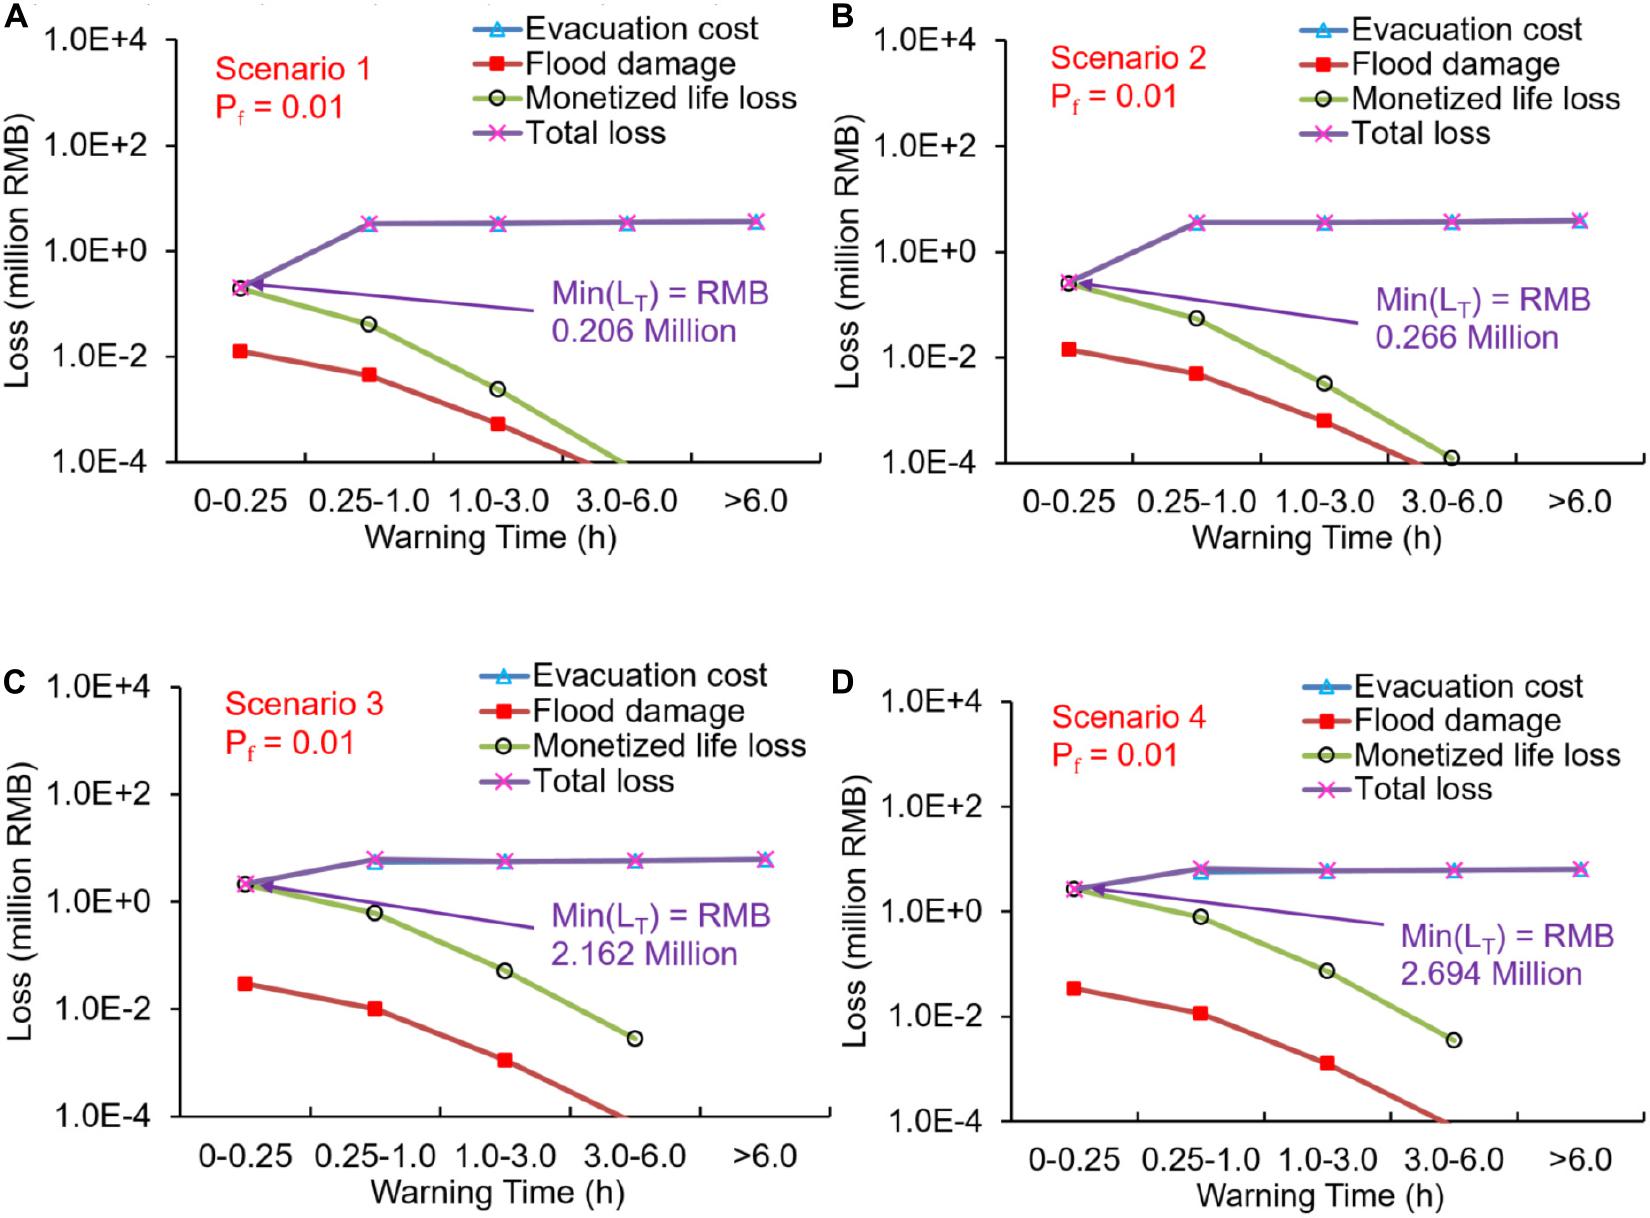
Figure 11. Three types of losses and the expected total loss (LT) vary with warning time in the four scenarios when the dam failure probability (Pf) is 0.01: (A) Scenario 1, (B) Scenario 2, (C) Scenario 3, and (D) Scenario 4.
When the dam failure probability became 0.1, the expected flood damage and the monetized life loss decreased by an order of magnitude. In Scenarios 1, the minimal LT was achieved as RMB 2.064 million, when warning time was the least (0–0.25 h). Note that the evacuation cost was assumed as 0 when warning time was 0–0.25 h. LT increased steadily with warning time as it was gradually dominated by evacuation cost. The influence of the flood damage and monetized life loss can be ignored when warning time was larger than 1 h. The decision strategy in Scenario 2 was similar to that in Scenario 1. No warning was needed for low dam failure probability with min(LT) of RMB 2.664 million. However, in Scenario 3 with larger flood severity, the warning time of 3.0–6.0 h was recommended with min(LT) of RMB 5.849 million, which indicated that a small probability could also be dangerous if the potential loss is extremely large. min(LT) increased to RMB 5.849 million in Scenario 4 with slightly larger flood severity.
When the dam failure probability decreased to 0.01, no warning was preferred in all the four scenarios since LT monotonically increased with warning time. The minimal LT in the Scenarios 1 to 4 were RMB 0.206, 0.266, 2.162, and 2.694 million, respectively.
Generally, Pf proportionally influences the life loss and flood damage but does not influence the evacuation cost. LT significantly decrease with Pf when the warning time was insufficient. However, LT would not change much when warning time is sufficient, since the life loss and flood damage do not matter any more.
The cascading breaching of landslide dams strongly depends on the time-related hydraulics in both upstream and downstream landslide dams. When the upstream dam is much smaller than the downstream dam, the dam breaching of the upstream dam would not obviously influence the breaching of the downstream dam, as the larger lake capacity downstream would be able to keep inside all the breaching flood of the upstream dam. This case will not be discussed later on.
When the upstream landslide dam is much larger, the downstream dam is likely to breach firstly (e.g., the Tangjiashan and Kuzhuba dams in this study). The reason is that the breaching initiation phase (i.e., the phase between the start of the overflow and the moment when the erosion achieves the upstream slope, referring to Peng et al., 2014) is often very long due to the large dam crest and flat downstream slope. The lasting overflow through the upstream dam and the confluence flows from tributaries between the two dams are very like to fulfill the downstream lake and trigger the dam breach. In this case, the cascade dam breach forms a multi-peak flood.
When the two landslide dams are in similar sizes (e.g., the 2008 Xiaogangjian and Yibadao landslide dams triggered by the Ms 7.9 Wenchuan earthquake, referring to Peng et al., 2014), the breaching flood of the upstream dam is very likely to pass across the crest of the downstream dam before the dam development phase (Peng et al., 2014), forming multi-peak flood. In short, cascading breaching of a series of landslide dams is more likely to form a multi-peak flood downstream other than an overlapped-peak flood.
In some extremely cases when the coming of the breaching flood from the upstream dam overlaps with the dam breaching flood of the downstream dam, a higher overlapped-peak flood may occur. However, the overlapped-peak outflow rate would not be much larger than the sum of the peak outflow rates of the single dam breaching of the two landslide dams. For instance, the perfectly overlapped-peak outflow rate (the maximal overlapped-peak outflow rate with perfect match) of the Tangjiashan and Kuzhuba landslide dam was 7920 m3/s, which was only slightly larger than the sum of the peak outflow rates of the single dam breaching of two landslide dams (6603 + 1240 = 7843 m3/s). The reason is that the large inflow rate from the upstream dam breaching would not incur collapse of the downstream dam because of the rather flat slopes. Both of the upstream and downstream slopes of a landslide dam are flat due to the rapid and dynamic deposition of landslides during the formation of the landslide dam. Besides, the amount of the erosion during the short period around the moment of the peak discharge of the inflow is limited. Thus, a sharp amplification of the peak discharge is not possible for cascade breaching of landslide dams.
The cascading breaching of landslide dams, which incurs overlapped-peak flood or multi-peak flood, bring different risks to the downstream area to those of single dam breach.
When overlapped-peak flood occurs, the flood risk would be larger than the dam breaching of a single dam. A larger area with more people and properties would be impacted. The life loss and flood damage would be much higher under larger flood severity. In this case, evacuation warning needs to be issued earlier to avoid serious life loss and flood damages but would pay more evacuation costs at the same time. The Min(LT) under optimal decision would be larger than that of the dam breaching a single dam. For instance, in Beichuan County as shown in Table 7, the Min(LT) was RMB 3.73 million in Scenario 2, which was larger than that in Scenario 1 (RMB 3.47 million). Similarly, the Min(LT) was RMB 6.45 million in Scenario 4, which was larger than that in Scenario 3 (RMB 6.41 million).
When multi-peak flood occurs, the former peak flood (normally with smaller peak discharge) would highly influence the risks of the peak flood thereafter (normally with larger peak discharge). If the duration between the two peaks is short, people who have been warned by the former peak flood would avoid the impact from the peak flood thereafter. However, if the duration between the two peaks is relatively long, people may believe that the dam-breaching flood has gone after the previous peak flood. They may go back home in a hurry to check the flood damage and rescue properties. The surprise attack of the peak flood thereafter may incur catastrophic loss to the returned people, which may be even higher than that of the overlapped-peak flood situation. Case 3 (Bac. case) in Scenarios 1 and 3 belongs to this case. The expected fatality number (Table 5) was 18.8 in Case 3 of Scenario 1, which is much larger than the single dam breaching case (3.0 in Case 1 of Scenario 1) and even larger than the overlapped-peak flood (4.3 in Scenario 2). Similarly, the expected fatality number (Table 5) was 245.2 in Case 3 of Scenario 4, which is much larger than the single dam breaching case (48.4 in Case 1 of Scenario 3) and even larger than the overlapped-peak flood 61.4 in Scenario 4).
In the multi-peak flood case, systematical decision making should be conducted to sufficiently concern the risk caused by each peak of the breaching flood. Emphasis should be put on the influence of the former warning on the warning effect of the warning thereafter. The people to-be-evacuated should be clearly noticed with the information of multi-peak flood to strictly avoid misleading by the previous peak flood.
The paper conducted quantitatively risk-based decision making for the Tangjiashan landslide dams and two small downstream dams in four scenarios: the real case with the constructed spillway, a virtual case without the spillway, and two more virtual cases with amplified floods by considering the overlapping effect on the basis of the first two scenarios. The following conclusions can be drawn:
(1) Cascade breaching of a series of landslide dams which is properly simulated with the DABA model is more likely to produce a multi-peak flood. A higher overlapped peak flood would occur when the coming of the breaching flood from the upstream dam perfectly overlaps with the dam breaching flood of the downstream dam. The overlapped-peak outflow rate would not be much larger than the sum of the peak outflow rates of the single dam breaching of the two landslide dams.
(2) When overlapped-peak flood occurs, the flood risk of cascading dam breaching would be larger than the dam breaching of any of the landslide dams. When multi-peak flood occurs, the warning for the former peak flood would also warn the peak flood thereafter if the duration between the two peaks is relatively short. However, people may be misled by the warning of the previous peak flood which is relatively long and suffer catastrophic flood impact.
(3) The optimal warning decision of cascading dam breaching can be achieved by minimizing the expected total loss. In the overlapped-peak flood case, evacuation warning needs to be issued earlier to avoid serious life loss and flood damages. In the multi-peak flood case, systematical decision making should be conducted to sufficiently concern the risk caused by each peak of the breaching flood. Emphasis should be put on the influence of the former peak flood on the risks of the peak flood thereafter.
(4) The dam failure probability Pf linearly influences the expected life loss and flood damage and does not influence the evacuation cost. The expected total loss significantly decreases with Pf when the warning time was insufficient. However, it would not change much with Pf when warning time is sufficient.
The original contributions presented in the study are included in the manuscript/supplementary material, further inquiries can be directed to the corresponding author/s.
YZ performed writing original draft, calculation, and analysis. MP performed conceptualization, supervision, methodology, and funding acquisition. SC performed writing original draft and funding acquisition. LZ performed conceptualization, resources, writing, review and editing. All authors contributed to the article and approved the submitted version.
The research reported in this manuscript was substantially supported by the Shanghai Rising-Star Program (20QB1406000), the National Natural Science Foundation of China (Nos. 41877234, 42071010, and 42061160480), the Shanghai Natural Science Foundation (20ZR1461300), and the Hunan Water Conservancy Science and Technology Project (XSKJ2019081-47).
YZ was employed by the company China Shipbuilding NDRI Engineering Co., Ltd.
The remaining authors declare that the research was conducted in the absence of any commercial or financial relationships that could be construed as a potential conflict of interest.
The handling editor declared a past co-authorship with one of the authors [LZ].
Ang, A. H. S., and Tang, W. H. (2007). Probability Concepts in Engineering, Emphasis on Applications in Civil & Environmental Engineering, 2nd Edn. New York, NY: Wiley
ASCE/EWRI Task Committee on Dam/Levee Breaching (2012). Earthen embankment breaching. J. Hydraulic Eng. 137, 1549–1564. doi: 10.1061/(asce)hy.1943-7900.0000498
Cao, Z. X., Yue, Z. Y., and Pender, G. (2011). Flood hydraulics due to cascade landslide dam failure. J. Flood Risk Manag. 4, 104–114. doi: 10.1111/j.1753-318x.2011.01098.x
Chang, D. S., and Zhang, L. M. (2010). Simulation of the erosion process of landslide dams due to overtopping considering variations in soil erodibility along depth. Nat. Hazards Earth Syst. Sci. 10, 933–946. doi: 10.5194/nhess-10-933-2010
Chen, X. Q., Cui, P., You, Y., Cheng, Z. L., Khan, A., Ye, C. Y., et al. (2017). Dam-break risk analysis of the Attabad landslide dam in Pakistan and emergency countermeasures. Landslides 14, 675–683. doi: 10.1007/s10346-016-0721-7
Cui, P., Dang, C., Zhuang, J., You, Y., Chen, X., and Kevin, M. S. (2010). Landslide-dammed lake at Tangjiashan, Sichuan province, China (triggered by the Wenchuan Earthquake, May 12, 2008): risk assessment, mitigation strategy, and lessons learned. Environ. Earth Sci. 65, 1055–1065. doi: 10.1007/s12665-010-0749-2
Cui, P., Zhou, G. G. D., Zhu, X. H., and Zhang, J. Q. (2013). Scale amplification of natural debris flows caused by cascading landslide dam failures. Geomorphology 182, 173–189. doi: 10.1016/j.geomorph.2012.11.009
Cui, P., Zhu, Y. Y., Han, Y. S., Chen, X. Q., and Zhuang, J. Q. (2009). The 12 May Wenchuan earthquake-induced landslide lakes: distribution and preliminary risk evaluation. Landslides 6, 209–223. doi: 10.1007/s10346-009-0160-9
Dong, J. J., Tung, Y. H., Chen, C. C., Liao, J. J., and Pan, Y. W. (2011). Logistic regression model for predicting the failure probability of a landslide dam. Eng. Geol. 117, 52–61. doi: 10.1016/j.enggeo.2010.10.004
Fan, Q., Tian, Z., and Wang, W. (2018). Study on risk assessment and early warning of flood-affected areas when a dam break occurs in a mountain river. Water 10:1369. doi: 10.3390/w10101369
Frieser, B. (2004). Probabilistic Evacuation Decision Model for River Floods in the Netherlands, Final Report. Delft: Delft University of Technology, 138.
Hu, X. W., Huang, R. Q., Shi, Y. B., Lu, X. P., Zhu, H. Y., and Wang, X. R. (2009). Analysis of blocking river mechanism of the Tangjiashan landslide and dam-breaking mode of its barrier dam. Chin. J. Rock Mech. Eng. 28, 181–189.
Jonkman, S. N. (2007). Loss of Life Estimation in Flood Risk Assessment: Theory and Applications. Ph. D. Thesis, Delft University of Technology, Delft.
Juang, C. H., Zhang, J., Shen, M. F., and Hu, J. Z. (2019). Probabilistic methods for unified treatment of geotechnical and geological uncertainties in a geotechnical analysis. Eng. Geol. 249, 148–161. doi: 10.1016/j.enggeo.2018.12.010
Liao, H. M., Yang, X. G., Xu, F. G., Xu, H., and Zhou, J. W. (2018). A fuzzy comprehensive method for the risk assessment of a landslide-dammed lake. Environ. Earth Sci. 77:750.
Liu, N., Chen, Z. Y., Zhang, J. X., Lin, W., Chen, W. Y., and Xu, W. J. (2010). Draining the Tangjiashan barrier lake. J. Hydraul. Eng. 136, 914–923. doi: 10.1061/(asce)hy.1943-7900.0000241
Mianyang Bureau of Statistics (2008). Report on the National Economy and Society Development on Miangyang City in 2008. Sichuan Province: Mianyang Bureau of Statistics. Available online at: http://my.gov.cn/bmwz/942947769050464256/20090325/391646.html. (in Chinese).
Nibigira, L., Havenith, H. B., Archambeau, P., and Dewals, B. (2018). Formation, breaching and flood consequences of a landslide dam near Bujumbura, Burundi. Nat. Hazards Earth Syst. Sci. 18, 1867–1890. doi: 10.5194/nhess-18-1867-2018
Niu, Z. P., Xu, W. L., Li, N. W., and Xue, Y. (2012). Experimental investigation of the failure of cascade landslide dams. J. Hydrodyn. 24, 430–441. doi: 10.1016/s1001-6058(11)60264-3
Peng, M., and Zhang, L. M. (2012a). Breaching parameters of landslide dams. Landslides 9, 13–31. doi: 10.1007/s10346-011-0271-y
Peng, M., and Zhang, L. M. (2012b). Analysis of human risks due to dam break floods – part 1: a new model based on Bayesian networks. Nat. Hazards 64, 903–933. doi: 10.1007/s11069-012-0275-5
Peng, M., and Zhang, L. M. (2012c). Analysis of human risks due to dam break floods – part 2: application to Tangjiashan Landslide Dam failure. Nat. Hazards 64, 1899–1923. doi: 10.1007/s11069-012-0336-9
Peng, M., and Zhang, L. M. (2013a). Dynamic decision making for dam-break emergency management – Part 1: theoretical framework. Nat. Hazards Earth Syst. Sci. 13, 425–437. doi: 10.5194/nhess-13-425-2013
Peng, M., and Zhang, L. M. (2013b). Dynamic decision making for dam-break emergency management – Part 2: application to Tangjiashan Landslide Dam failure. Nat. Hazards Earth Syst. Sci. 13, 439–454. doi: 10.5194/nhess-13-439-2013
Peng, M., Zhang, L. M., Chang, D. S., and Shi, Z. M. (2014). Engineering risk mitigation measures for the landslide dams induced by the 2008 Wenchuan earthquake. Eng. Geol. 180, 68–84. doi: 10.1016/j.enggeo.2014.03.016
Shen, D. Y., Shi, Z. M., Peng, M., Zhang, L. M., and Jiang, M. Z. (2020). Longevity analysis of landslide dams. Landslides 17, 1–25.
Shi, Z. M., Guan, S. G., Peng, M., Zhang, L. M., Zhu, Y., and Cai, Q. P. (2015). Cascading breaching of the Tangjiashan landslide dam and two smaller downstream landslide dams. Eng. Geol. 193, 445–458. doi: 10.1016/j.enggeo.2015.05.021
Shi, Z. M., Xiong, X., Peng, M., Zhang, L. M., Xiong, Y. F., Chen, H. X., et al. (2017). Risk assessment and mitigation for the Hongshiyan landslide dam triggered by the 2014 Ludian earthquake in Yunnan, China. Landslides 14, 1–17.
Smith, P. J., Kojiri, T., and Sekii, K. (2006). “Risk-based flood evacuation decision using a distributed rainfall-runoff model,” in Annuals of Disas. Prev. Res. Inst., Kyoto Univ., No. 49B (Kyoto).
Su, H. Z., Wen, Z. P., and Wu, Z. R. (2011). Study on an intelligent inference engine in early-warning system of dam health. Water Resour. Manag. 25, 1545–1563. doi: 10.1007/s11269-010-9760-3
Tong, Y. X. (2008). Quantitative Analysis for Stability of Landslide Dams. Ph. D. Thesis, National Central University, Taiwan.
Wang, G. H., Furuya, G., Zhang, F. Y., Doi, I., Watanabe, N., and Wakai, A. (2016). Marui H. Layered internal structure and breaching risk assessment of the Higashi-Takezawa landslide dam in Niigata, Japan. Geomorphology 267, 48–58. doi: 10.1016/j.geomorph.2016.05.021
Wang, S. Y., and Liu, J. (2013). Modeling the risk assessment of landslide-dammed lakes based on the emergency response measures in Wenchuan earthquake, 2008, China. Nat. hazards 67, 523–547. doi: 10.1007/s11069-013-0584-3
Wu, S. J., Lien, H. C., and Chang, C. H. (2010). Modeling risk analysis for forecasting peak discharge during flooding prevention and warning operation. Stochast. Environ. Res. Risk Assess. 24, 1175–1191. doi: 10.1007/s00477-010-0436-6
Xu, F. G., Yang, X. G., and Zhou, J. W. (2017). Dam-break flood risk assessment and mitigation measures for the Hongshiyan landslide-dammed lake triggered by the 2014 Ludian earthquake. Geomat. Nat. Hazards Risk 8, 803–821. doi: 10.1080/19475705.2016.1269839
Xu, Q., Fan, X. M., Huang, R. Q., and Westen, C. V. (2009). Landslide dams triggered by the Wenchuan Earthquake, Sichuan Province, south west China. Bull. Eng. Geol. Envion. 68, 373–386. doi: 10.1007/s10064-009-0214-1
Yang, S. H., Pan, Y. W., Dong, J. J., Yeh, K. C., and Liao, J. J. (2013). A systematic approach for the assessment of flooding hazard and risk associated with a landslide dam. Nat. Hazards 65, 41–62. doi: 10.1007/s11069-012-0344-9
Zhang, J. X. (2009). Hydrologic Analysis and Emergency Application of Barrier Lake Breaking. Ph. D. Thesis in Tsinghua University, Beijing.
Zhang, L. W., and Guo, H. P. (2006). Introduction to Bayesian Networks. Beijing: China Science Publishing & Media Ltd. (CSPM). (in Chinese).
Zhang, L. M., Peng, M., Chang, D. X., and Xu, Y. (2016). Dam Failure Mechanisms and Risk Assessment. Hoboken, NJ: John Wiley & Sons, Ltd.
Zhou, G. D., Cui, P., Chen, H. Y., Zhu, X. H., Tang, J. B., and Sun, Q. C. (2013). Experimental study on cascading landslide dam failures by upstream flows. Landslides 10, 633–643. doi: 10.1007/s10346-012-0352-6
Keywords: landslide dam, cascade dam breaching, risk assessment, warning, decision making
Citation: Zhu Y, Peng M, Cai S and Zhang L (2021) Risk-Based Warning Decision Making of Cascade Breaching of the Tangjiashan Landslide Dam and Two Smaller Downstream Landslide Dams. Front. Earth Sci. 9:648919. doi: 10.3389/feart.2021.648919
Received: 02 January 2021; Accepted: 24 February 2021;
Published: 03 May 2021.
Edited by:
Jia-wen Zhou, Sichuan University, ChinaReviewed by:
Qiming Zhong, Nanjing Hydraulic Research Institute, ChinaCopyright © 2021 Zhu, Peng, Cai and Zhang. This is an open-access article distributed under the terms of the Creative Commons Attribution License (CC BY). The use, distribution or reproduction in other forums is permitted, provided the original author(s) and the copyright owner(s) are credited and that the original publication in this journal is cited, in accordance with accepted academic practice. No use, distribution or reproduction is permitted which does not comply with these terms.
*Correspondence: Ming Peng, cGVuZ21pbmdAdG9uZ2ppLmVkdS5jbg==; Shuo Cai, Y2Fpc2h1b0Bjc3VzdC5lZHUuY24=
Disclaimer: All claims expressed in this article are solely those of the authors and do not necessarily represent those of their affiliated organizations, or those of the publisher, the editors and the reviewers. Any product that may be evaluated in this article or claim that may be made by its manufacturer is not guaranteed or endorsed by the publisher.
Research integrity at Frontiers
Learn more about the work of our research integrity team to safeguard the quality of each article we publish.