 Qi Yao1,2
 Wen Yang2Xianghua Jiang2
 Yanshuang Guo3*Jie Liu2Yongxian Zhang1Hui Wang1Jing Ren2Cheng Yu2Chong Yue2
 Jing Zhao2
- 1Institute of Earthquake Forecasting, China Earthquake Administration, Beijing, China
- 2China Earthquake Networks Center, Beijing, China
- 3State Key Laboratory of Earthquake Dynamics, Institute of Geology, China Earthquake Administration, Beijing, China
The 2020 Jiashi M6.4 earthquake occurred in the Kaping fold-and-thrust belt, a major south-verging active thin-skin system in the southwestern Chinese Tien Shan Mountain, north of the Tarim Basin. Within 50 km from the epicentral area, seismic hazard is high, as suggested by the occurrence of the 1902 Mw 7.7 Artux (Kashgar) earthquake and 1997 Jiashi strong earthquake swarm. The seismogenic structure responsible for the 2020 event is not well constrained and is a subject of debate. We relocated the 2020 Jiashi earthquake sequence and assessed the relocation uncertainties, using eight seismic velocity models and based on detailed local and regional subcrustal structures from seismic profiles. Then we compared the temporal variation in the Gutenberg–Richter b-values of the 2020 sequence with those of the 1997, 1998, and 2003 earthquake sequences. Our results show that most events cluster at depths greater than 10 km, suggesting that the events most likely occurred beneath the décollement and inside the Tarim Craton. The spatiotemporal evolution of the sequence suggests that two groups of structures at depth were involved in the 2020 sequences: NW–SE-trending lateral strike-slip faults and E–W-trending reverse faults. The b-values of the 2020 sequence exhibits relatively stable temporal evolution, unlike those of the multi-shock sequence that occurred inside the Tarim Craton. It indicates that the 2020 sequence perhaps was influenced by the stress interaction with the 10 km thick overlying strata. Our study provides a new perspective on the seismogenic structure of the earthquakes that occurred because of reactivation of ancient structures developed in a stable craton.
Introduction
Seismic hazard is high in some major active intracontinental fold-thrust systems, such as those along the Pamir, Tien Shan, and Longmenshan, Andes, New Guinea, etc., Although the seismogenic structures appear to belong to the same type of active fold-and-thrust belts, the deforming structural systems are complex and involve various elements capable of rupturing during earthquakes. These can include major thrusts, décollements, and some other structures either older than can be reactivated or new one that can nucleate. Regarding the spatial relationship between earthquakes and décollement, some earthquakes occur on the thrust fault above the décollement, such as the 1999 Chi-chi M7.6 earthquake (Dominguez et al., 2003), whereas others originated on the décollement, such as the 2015 Gorkha M7.8 earthquake (Elliott et al., 2016; Hubbard et al., 2016). And some other events initiate under imbricated thrust sheets, such as the moderate-sized earthquakes that affect the Tajik fold-thrust belt of the western foreland of the Pamir (Kufner et al., 2018; Gągała et al., 2020).
On January 19, 2020, the M6.4 Jiashi earthquake occurred along the Kaping fold-and-thrust belt (also called the “Kepingtage” or “Keping”), a well-known thrust fault zone in the southwestern Tien Shan Mountains, China (Yin et al., 1998; Allen et al., 1999; Turner et al., 2011). This south-verging (north-dipping) fold-thrust belt propagates toward the northwestern margin of the Tarim Basin (or Tarim Craton), where the Paleozoic sedimentary cover is being actively deformed by some emergent thin-skinned thrusts (Jia et al., 1998; Lu et al., 1998; Allen et al., 1999; Zhang et al., 2019). For understanding the seismotectonics, more attention was paid to the actively deforming thrust faults and folds. Little is known about the role of old/ancient structures beneath the décollement of the fold-thrust zone. However, this fold-thrust zone belongs to the so-called thin-skinned fold-and-thrust belt. Because the décollement is merely ∼10 km blow the Earth’s surface. Under such a tectonic environment, the ancient structures cannot be ignored when studying the seismotectonics. Therefore, the 2020 Jiashi earthquake presents a unique case for investigating the possible seismogenic structure for a tectonically fold-and-thrust belt with both old and new structures. It is highly important both for regional seismic hazard assessment and interaction between the old and new tectonic structures.
In addition to the structural analysis from seismic profiles, analyzing the precise seismic relocation results is also an important approach. However, the relocation results are sensitive to the material heterogeneity and structural complexities. Here, we explored the uncertainties of the relocation results by considering eight seismic velocity models. We also examined the temporal evolution of b value of the regional earthquake sequences, including the 2020 Jiashi earthquake and some instrumental earthquakes within 50 km of the 2020 event. We found that the 2020 Jiashi earthquake occurred on a deep reactivated structure beneath the Kaping fold-and-thrust structure. Our results support a new type of seismogenic structure in a region with active fold-thrust system developed above a nominally stable craton: besides the shallower active faults and folds above and along the décollement of the Kaping fold-and-thrust structure, the deeper ancient structures beneath the décollement, which was developed in the craton, can be reactivated and hence are also seismogenic. Therefore, both active and stable regions are of concern in seismic hazard assessment for thin-skinned tectonic zone.
Geological Setting
Tectonic rejuvenation across the Tien Shan orogeny has occurred during the Cenozoic because of the far-field effect of the ongoing Cenozoic Indo-Eurasian collision, and the associated deformations have progressed from south to north across the Tien Shan range (Tapponnier and Molnar, 1979; Charreau et al., 2009; Glorie et al., 2011). Multiple thrust systems, mixed with a large number of strike-slip structures, have developed from early tectonic structures through intense compressional transformation that is actively deforming the thick Phanerozoic sedimentary succession within the Tarim Basin (Turner et al., 2011).
The Kaping fold-and-thrust belt, located between the northwestern margin of the Tarim Basin and the southern Tien Shan Mountain, grew and propagated southward from the central segment of the Kashi–Aksu fold-thrust system in the Chinese southwestern Tien Shan Orogenic belt. The Kashi–Aksu fold-thrust system is thought to be a thick-skinned thrust on the whole (Li et al., 2012; Li et al., 2016; Borderie et al., 2018). In contrast, the Kaping fold-and-thrust belt, which is convex toward the south and overlaps the Tarim craton (Zhang et al., 2019; Li et al., 2020), is regarded as a fold-and-thrust belt. It can propagate deformation along a décollement made of a nearly 200–400 m-thick gypsiferous mudstone (Allen et al., 1999; Turner et al., 2011). Also, synthetic seismic sections of the Jiashi region (Figure 1 Section A–A′, and B–B′) reveal significant vertical differences between the thrust wedge and the crystalline basement in terms of the structural features and material parameters (stacks of ∼2 KM-thick strata vs. a single and relatively intact thick strata). Within the basement in Tarim craton, old complex structures are observed at the southern edge of the Kaping fold-and-thrust belt, such as negative flower faults of Bashen–Tuopu fault (Figure 1 Section C–C′ and D–D′), which is consistent with the FMS of 1997 Jiashi earthquake swarm (Figure 2). The relative negative flower structure faults of the Bashen–Tuopu fault are perhaps responsible for the occurrence of the 1997 Jiashi earthquake swarm (Figure 2). There are also some NW–SE-trending structures developed inside Tarim craton, but partly covered by the thrust sheet, such as Yijianfang fault (Figure 2 Section F–F′). Below the thrust sheet, some blind structures trending NW–SE, such as the Yijianfang fault (Figure 1, Section F–F′), extends south of the Kaping fold-and-thrust belt.
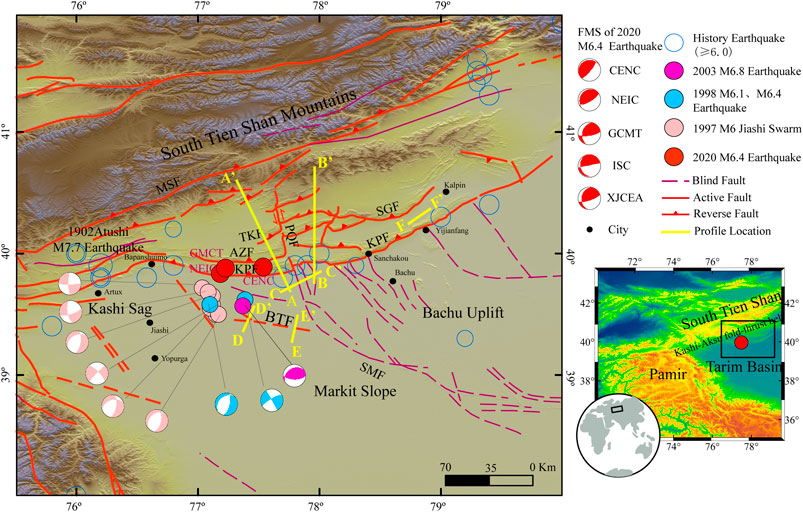
FIGURE 1. Regional geological settings of the 2020 Jiashi earthquake. The red circles represent the epicenters of the 2020 Jiashi earthquake determined by different institutions. The blue circles, the purple circles, and the pink circles represent the relocated epicenters of the 1998 M6.1 and M6.4 Jiashi earthquakes (Guo et al., 2002), the 2003 M6.8 earthquake (Huang et al., 2006), and the 1997 Jiashi earthquake swarm respectively (data from the GCMT catalog, https://www.globalcmt.org/) (MS6.0). The thin blue circles indicate the locations of historical earthquakes (MS6.0) (data from the CENC). The small black dots indicate geographical locations. The thick yellow lines indicate the locations of the sections in Figure 2. The acronyms used for the faults and organizations are explained as follows: KPF: Kepingtage fault; PQF Piqiang fault; BTF Bashen‐Tuopu fault; SMF Selibuya‐Mazartagh fault; MSF Maidan‐Shayilamu fault; SGF: Saergantage fault; TKF: Tuokesan fault; AZF: Aozitage fault; CENC: China Earthquake Networks Center; NEIC: National Earthquake Information Center; GCMT: Global Centroid‐Moment‐Tensor; ISC: International Seismological Center; XJCEA: Xinjiang Earthquake Agency, China Earthquake Administration.
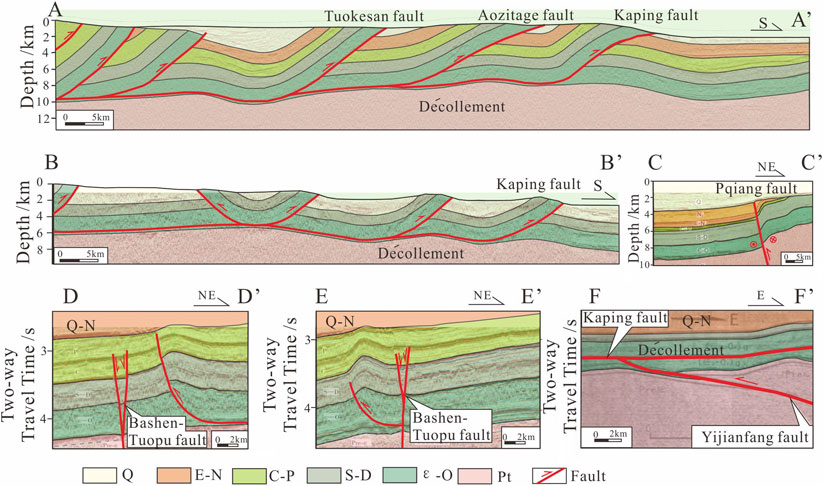
FIGURE 2. Interpretation of the synthetic seismic sections of the Jiashi region (Xiao et al., 2002; Li et al., 2019; Zhang et al., 2019; Yao et al., 2019). The locations of the sections and the acronyms for the names of the faults are shown in Figure 1. Structural sections across and in front of the Kaping fold‐and‐thrust zone show the deformation architectures and décollement.
In map view, the Kaping fold-and-thrust is 300 and 75 km long in the east-west (EW) and south-north (SN) directions respectively, and transversely consists of multiple nearly parallel east-northeast (ENE)-trending fold belts (Figure 2). The ENE–WSW fold ridges are separated by about 10–20 km (Figure 1 Section A–A′, and B–B′) (Allen et al., 1999; Tian et al., 2016). The Kaping fold-and-thrust belt is segmented into eastern and western sections by the Piqiang fault that is a NNE–SSW- and NNW–SSE-striking oblique-slip deep-cutting fault (Yang et al., 2008a; Turner et al., 2011; Yao et al., 2019). In the western section, five major thrust-folds root into a décollement at ∼9 km depth (section A–A′ in Figure 2A) (Xiao et al., 2002; 2005). In the eastern section, six thrust-folds root into a décollement at ∼5 km depth (Figure 1 Section B–B′) (Yang et al., 2006; Yang et al., 2008b). Furthermore, the late Pleistocene shortening rate differs significantly for the two sections: ∼0.3 mm/year for the eastern section and ∼2.5–2.7 mm/year for the western section (Li et al., 2020). Therefore, interactions between the structures are quite clear: the NW–SE-trending inherited basement structures, such as the Piqiang fault, modulate the Cenozoic deformation along and across the Kaping fold-and-thrust belt. These interspersed NW–SE-trending basement-cutting faults connects with the obvious ancient structures inside the Tarim Basin, such as the famous Selibuya–Mazartagh fault which is known as an important boundary between the Markit slope and Bachu uplift (Figure 2).
The 1902 Atushi (Artux) M 7.7 earthquake (some records show that this earthquake reached M8.25) struck the southwest Tien Shan Mountain (Figure 2), in the western Kaping fold-and-thrust belt (Kulikova and Krüger, 2017). Little is known about this disastrous earthquake. The damages were described as cracking, fissuring, and slumping of the ground, but no evidence of obvious surface rupture has been found (Gu, 1994; Molnar and Ghose, 2000). Instrumental earthquake records show that the Kaping fold-and-thrust experienced a seismic quiet period from 1977 to 1995, with only a M6.2 event in 1977 and a M6.5 event in 1991. However, after the M.6.9 earthquake in 1996, the Kaping region became seismically active. In the southern Kaping fold-and-thrust belt, an earthquake swarm in 1997 (including 4 earthquakes of M ≧ 6), a double earthquake in 1998 (including 2 earthquakes of M ≧ 6), and an earthquake in 2003 (which obviously involved double branching faults) (Figure 2) had happened before the Jiashi M6.4 earthquake in 2020 (Figure 2).
However, the hypocentral depths of these moderate earthquakes in and around the Kaping fold-and-thrust belts have not been well determined in previous studies. Most of the focal depths from the International Seismologist Center (ISC) and Global Centroid Moment Tensor (GCMT) are >10 km, but surface deformation from geodetic data (Yao et al., 2020), field surveys on the folded Neogene and Quaternary strata in the footwall of the Kepingtage Fault (Li et al., 2020), and some individual studies (Romanowicz, 1981; Ekström and Englanb, 1989; Fan et al., 1994) indicated that these instrumental earthquakes occurred at shallower depths on the thin-skinned thrust. Consequently, the basement has been hypothesized to deform aseismically and separately from the thin-skinned thrusts which reach the surface (Allen et al., 1999). The focus of these disputes is whether this flat, long-range (thrusting ∼75 km from the southern Tien Shan Mountains), large-scale, thin-skinned (depth ≦ 10 km) thrust structure can host a disastrous event as the 1902 MW 7.7 earthquake (Allen et al., 1999; Turner et al., 2011; Xu et al., 2019; Li et al., 2020; Yao et al., 2020), or merely moderate-sized shallow earthquakes.
Likewise, the geometry of the seismogenic structure hosting the 2020 Jiashi M6.4 earthquake is still a subject of debate. Most FMS results published online (such as CENC,NEIC,GCMT) show that the 2020 Jiashi earthquake was a thrust event (Figure 2). The nodal planes show strike of NE-SW or E-W, dip angles of 20–38°, and rake angles of 31–72°. However, the fault dip angle inverted from geodetic data was ∼15° (Yao et al., 2020). In addition, the 2020 Jiashi earthquake constituted a mainshock-aftershock sequence, which is quite different from the other instrumental earthquakes that occurred in the adjacent region within 50 km.
Earthquake Sequence
Determination of the Earthquake Sequence Using the Double-Difference Location Algorithm
Considering the difficulty in determining the absolute location of earthquakes in an inhomogeneous crust, we estimated the relative hypocenters of the 2020 Jiashi aftershock sequence. The double-difference (DD) location method (Waldhauser and Ellsworth, 2000) was employed. This method is proven to be efficient in determining high-resolution hypocenter locations, and the determined positions can illuminate the seismogenic structure (such as the fault geometry), as has been used in relocating aftershock sequences in Xinjiang and unraveling the seismogeneic structure (Huang et al., 2006; Zhao et al., 2008; Fang et al., 2015).
The DD location method is based on the assumption that two earthquakes produce similar waveforms at a common station, if their source mechanisms are virtually identical and their sources are co-located (such that signal scattering due to velocity heterogeneities along the ray paths is small). In this method,
where k, r, tobs and tcal represent a seismic station, the travel-time residuals, observed and calculated travel times, respectively. The assumption of a constant slowness vector is valid for events that are sufficiently close together, but breaks down in the case where the events are further apart. The partial derivatives of the travel times t for events i and j with respect to their locations (x, y, z) and origin times(τ) are calculated for the current hypocenters and the location of the station where the kth phase was recorded.
in which
where G defines a matrix of size M×4N (where M, denotes the number of DD observations and N is the number of events) for the partial derivatives, d is the data vector for the DD observations, m is a vector of length 4N, describing the changes in the hypocentral parameters, and W is a diagonal matrix to weight each equation. The mean shift of all earthquakes during the relocation may be constrained to zero by extending Eq. 3 by four equations so that
for each coordinate direction and origin time.
In this study, the M6.4 Jiashi earthquake was relocated based on seismic-phase observations provided by the China Earthquake Networks Center (CENC) from January 18 to February 29, 2020. The Pg- and Sg-wave seismic-phase data were recorded at 26 seismic stations (Figure 3A within 300 km of the mainshock. The arrival times for seismic events with local magnitudes (ML) were set as ≧1. Overall, 6,909 and 6,134 data points for Pg and Sg waves were selected, respectively. In general, the P-wave is the head wave, the record of which provides a more accurate arrival time than the S-wave. Thus, P- and S-wave arrivals were assigned weights of 1.0 and 0.5, respectively, in the inversion. One broadband seismic station is located 12 km from the initial epicenter of the 2020 Jiashi earthquake, but the other seismic stations are further away and are sparsely distributed.
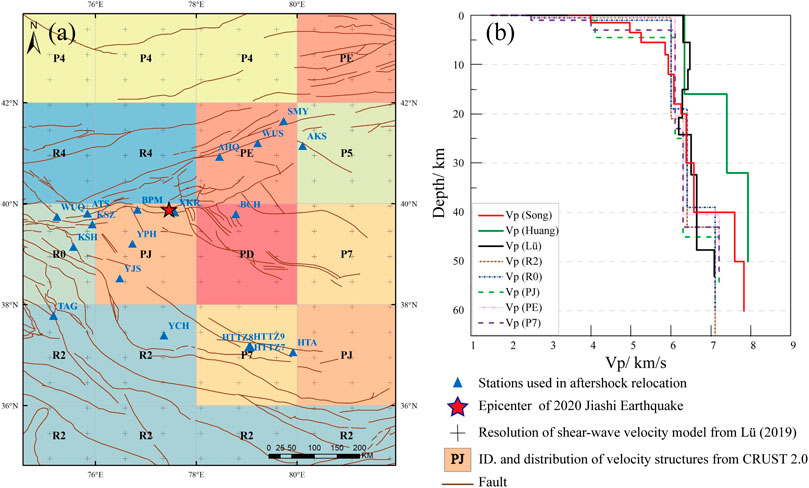
FIGURE 3. (A) The blue triangles show the distribution of the seismic stations whose data were used for the relocations. The large squares of different colors show the numbers and spatial locations of the different velocity models extracted from the CRUST2.0 model. The cross signs represent the datapoints for the tomographic velocity models. (B) Comparison of the P-wave velocity models used for relocations. Vp (Song), Vp (Huang), Vp (Lü), and Vp (R2)-Vp (P7) were obtained from Song et al. (2019), Huang et al. (2006), Lü et al. (2019), and the CRUST2.0 model (http://igppweb.ucsd.edu/∼gabi/rem.html), respectively.
In this study, eight velocity models for the region in and around the Kaping fold-and-thrust belt were used as initial velocity models (Figure 3B). (1) The seismic tomography result of Lü et al. (2019) was selected as the local velocity model. With a resolution of 50 km and the nearest distance of 12 km between the data and the epicenter of the mainshock, the velocity model of Lü et al. (2019) has relatively typical characteristics of a dual structure (Figure 4B). In addition, in this model, the P-wave velocity (Vp) is relatively high at a depth of 10 km, gradually decreases at depths of 10–20 km, and gradually increases at depths greater than 22 km. (2) The velocity models used in the literature to determine the 2018 M5.5 Jiashi earthquake sequence, which occurred 45 km north of the 2020 Jiashi event (Song et al., 2019), was used. This velocity model is relatively refined and was obtained by inverting the data of earthquakes that occurred around from approximately 2009–2018. (3) The velocity model, which has been used to determine the 2003 Bachu-Jiashi (Xinjiang) earthquake sequence (33 km away from the 2020 event), was considered (Huang et al., 2006). This velocity model has relatively low resolution in depth-dependent variation (only showing ∼15 km-scale variations). (4)–(8): The CRUST2.0 velocity-structure model (http://igppweb.ucsd.edu/∼gabi/rem.html) for the southwestern Tien Shan Mountains and Tarim Basin was also considered in this study; the low resolution of those velocity structures provided by this model mutes the effects of local structures in hypocenter relocation. While there are multiple velocity models from CRUST-2.0 available for the region where the seismic stations are distributed, five velocity models beneath the seismic stations were selected based on the locations of the seismic stations (Figures 3A,B).
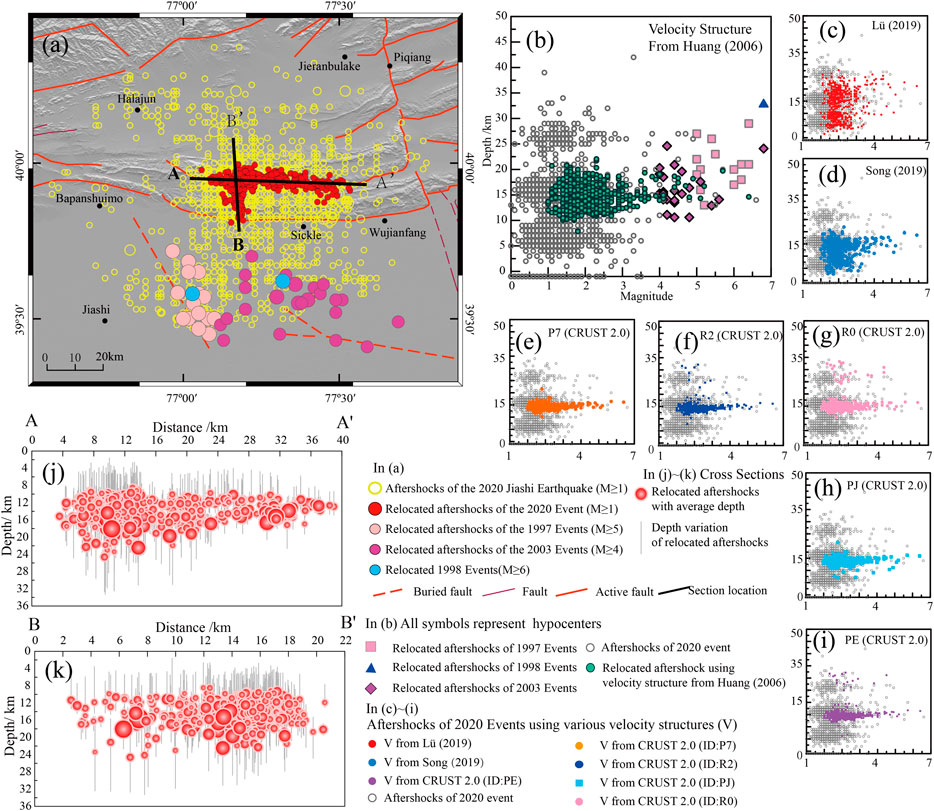
FIGURE 4. (A) Comparison of the relocated sequences of the 1997, 1998, 2003 and 2020 earthquake that occurred in and around the Kaping fold-and-thrust belt. The pink circles, the purple circles, and the blue circles respectively show the relocated aftershocks and main events of the 1997 earthquake swarm (M ≧5) (Zhou and Xu, 2000), the 2003 Bachu-Jiashi earthquake (Huang et al., 2006), and the 1998 earthquake (Guo et al., 2002), respectively. (B)–(I) Distribution patterns of the depths determined with eight different velocity models of the 2020 Jiashi earthquake and a comparison with the relocated depths of the 1997, 1998, and 2003 events (J), (K) Cross sections of the relocated aftershocks of the 2020 Jiashi sequence. The profile positions are presented as thick black lines in (A).
As the nearest seismic station is only 12 km from the mainshock, the maximum distance between the two shocks of each pair in the inversion was set to ≤10 km. Shock pairs with DD positioning values ≥8 were selected to form a system of equations. The equations were solved via the conjugate gradient method. A damped least-squares solution was obtained by two sets of iterations (a total of 10 iterations). The selected damping value, which affects the condition number (CND), should allow a CND between 40 and 80. The DD location algorithm was used to determine the locations of 524 shocks. The relocations of 449 shocks were determined using the different velocity models. A comprehensive analysis of all locations determined by the velocity models showed that the standard deviations (SDs) for the relocations in the longitudinal, latitudinal, and vertical directions were 0.176–0.567 (the SD of Vp_R2 was the minimum, and the SD of Vp_Song was the maximum), 0.200–0.627 (the SD of Vp_R2 was the minimum, and the SD of Vp_Song was the maximum), and 0.174–0.776 km (the SD of Vp_P7 was the minimum, and the SD of Vp_Song was the maximum), respectively.
The location estimation results show that the eight velocity models can be used to obtain satisfactory determination of the horizontal distribution of the aftershock sequence (Figure 4). However, the estimated depths vary significantly, depending on which velocity model is used. The depths of the aftershock sequence are poorly constrained by the detailed local velocity model from Lü et al. (2019). Many M ≤ 3 shocks are located shallower than 10 km. In contrast, under the control of the relatively low resolution velocity models from CRUST2.0, the depths of the aftershock sequence are found to cluster at 15 ± 3 km depth (Figure 4E–I). Using the especially low resolution velocity model (Huang et al., 2006), the depths of the aftershocks are found to be relatively concentrated at 10–20 km. These results are consistent with the relocated depths determined by previous researchers (Huang et al. (2006), Zhou and Xu, 2000) for the 1997 Jiashi strong-earthquake sequence and the 2003 Bachu-Jiashi earthquake sequence (Figure 4B). In the following Discussion, how the relocation results depend on the velocity models will be discussed in detail.
Spatiotemporal Evolution of the Earthquake Sequence
The relocation results of the horizontal locations for the aftershock sequence do not exhibit a significant dependence on the choice of velocity models, because the average variations are only 1.4 km (0.08–10.65 km) (Figure 4). The horizontal spatial distributions of the relocated aftershocks are also similar. For simplicity, well-positioned events (obtained using the velocity model of Huang et al., 2006) are used to investigate the spatiotemporal evolutionary of the 2020 Jiashi M6.4 earthquake sequence.
An M5.4 shock occurred approximately 2.5 km south of the Kaping fold-and-thrust belt 45 h before the mainshock of the 2020 Jiashi earthquake. This shock was thought to be a foreshock. Hypocenters of this foreshock and other small earthquakes delineate a lineament trending NNW–SSE and cutting through the southernmost surface fault trace of the Kaping fold-and-thrust belt (Figure 5A). On January 19, the thrust-type main-shock event, with a nearly ENE–WSW-trending nodal plane, occurred close to the foreshock (Figure 5B). The small aftershocks nearly concentrate along the surface trace of an E–W-trending fault. In addition, a cluster of small shocks occurred at the junction of this E–W-trending fault and the NW–SE-trending fault on the north side. The main-shock struck approximately 7 km from this cluster of small shocks. Over the next 2–6 days, the aftershocks converged along E–W-trending and NNW–SSE-trending distribution patterns at the same time (Figure 5C). In the 7–30 days after the mainshock, the aftershock sequence continued to propagate along the E–W and NNW–SSE directions (Figure 5D). After 30 days, the aftershocks became sparse. Thirty-two days after the main-shock, M5.1 event occurred at the east end of the EW branch of the aftershock sequence, 24 km from the main-shock epicenter (Figure 5E).
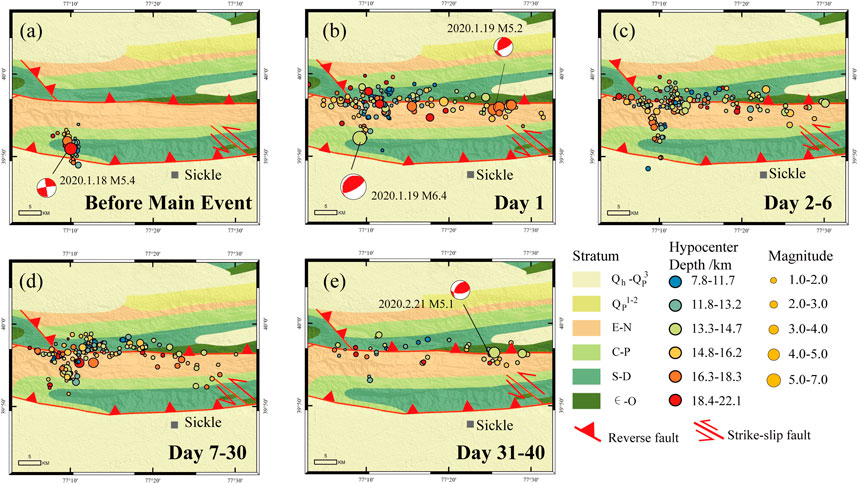
FIGURE 5. Spatiotemporal evolution of the 2020 Jiashi earthquake sequence. The size and color of circles represent the magnitude and hypocentral depth, respectively. The thick red lines indicate the surface traces of faults. The FMSs were obtained from the CENC.
The spatiotemporal distribution of the aftershock sequence distinctly demonstrates that at least two structures participated in the occurrence and aftermath of the 2020 Jiashi earthquake: one along the E–W direction and the other along the NNW–SSE direction.
B-Value of the Earthquake Sequence
Following the Gutenberg–Richter law (Gutenberg and Richter, 1944), logN = a–bM (where a and b are both constant values), the regional seismicity (a-value) and the relative ratio of large and small earthquakes (b-value) can be characterized by cumulative frequency (N) of earthquakes above a certain magnitude (M). Temporal variations in b-value can reflect the changes in the overall crustal stress state (Schorlemmer et al., 2005; Narteau et al., 2009; Nanjo et al., 2012; Mousavi et al., 2017). For example, a recent study on 58 earthquake sequences found that the evolution of the b-value can be used to effectively differentiate between aftershocks and foreshocks (Gulia and Wiemer, 2019).
In this study, the b-value, calculated using the maximum likelihood method (Aki, 1965), is used to characterize how the sequence and stress level differ between the 2020 Jiashi earthquake and other M6 earthquakes that have occurred since 1996. The earthquakes above the magnitude of completeness (MC) were selected to calculate the b-values. The MC were found to be ML2.4, ML2.4, and ML1.3, respectively, for the 1997 Jiashi strong-earthquake swarm sequence, the 1998 Jiashi double-earthquake sequence, and the 2020 M6.4 Jiashi earthquake sequence. Because the catalog of the 2003 M6.8 Jiashi earthquake sequence had a low MC of 2.9, these data were not included in the b-value calculations. The temporal variation in the b-value (Figure 6) was determined using a sliding window of 200 events and a step size of 10 events (considering the temporal shock density, a sliding window of 100 shocks and a step size of 10 shocks were used for the 1998 sequence).
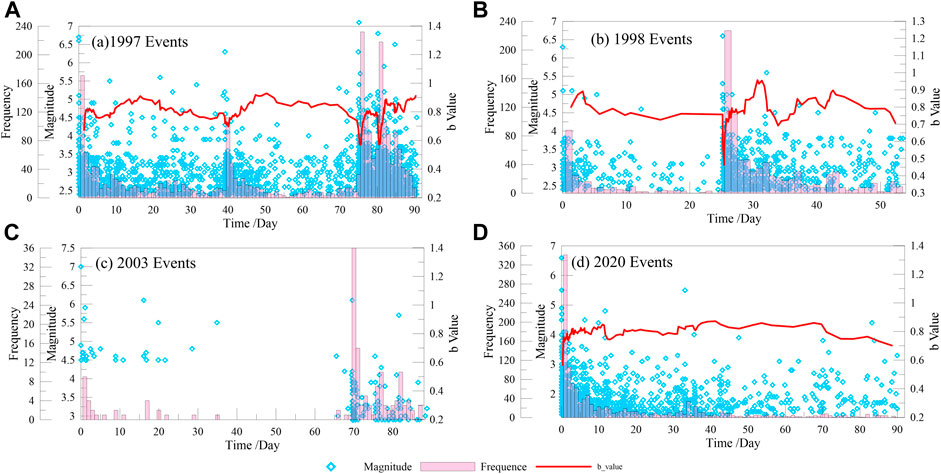
FIGURE 6. Magnitude–time (M–T), frequency, and b-value evolution diagrams of the sequences of the 1997 Jiashi strong-earthquake swarm, the 1998 Jiashi double earthquake, the 2003 Bachu-Jiashi earthquake, and the 2020 M6.4 Jiashi earthquake. The blue dots represent shocks. The red histogram shows the daily frequency of MC. The red solid line shows the b-value of the sequence.
From January 21st to april 16th in 1997, the Jiashi swarm with seven successive earthquakes (M ≧6) occurred south of the Kaping fold-and-thrust belt. As the seismic occurrence frequency changed through time, the b-value fluctuated three times (Figure 6). During each fluctuation, the b-value first increased rapidly within a short period (∼10 days), then decreased slightly (∼10% in ∼10 days), and subsequently continued to rise. The b-value ranged from 0.74 (preshock) to 0.93 (post-shock) (Figure 6A). For the 1998 Jiashi double-earthquake sequence, the b-value increased relatively rapidly after the first M6.0 main-shock and reached a high value (0.89) in the next 3 days, then the b-value showed a decreasing trend and a M6.6 shock occurred 25 days after the first shock (the preshock b-value was 0.76) (Figure 6B). Due to the lack of small events, the time-series variation in the b-value of the 2003 earthquake sequence could not be calculated. However, the b-values of the 2020 M6.4 Jiashi earthquake were different from those estimated for the earthquakes that occurred at the front end of the Kaping fold-and-thrust. After the 2020 M6.4 Jiashi earthquake, the b-value rose rapidly within 3 days (45%), subsequently fluctuated in a relatively stable manner, and remained at approximately 0.85. The b-value began to show a decreasing trend only after a relatively long time after the whole sequence ended (on day 76) (Figure 6D). These temporal evolutions of b-value demonstrate that the stress perturbation induced by the 2020 Jiashi earthquake may be attenuated after the main shock.
Discussion
Currently, how precise the seismic relocation results are for the earthquakes that occurred in the transition zone between orogenic belt and sedimentary basin is a subject of debate, mainly because the relocation algorithms cannot fully incorporate the effects of the subcrustal material heterogeneities and structural complexities. For example, even 12 years after the 2008 MW 7.9 Wenchuan earthquake, we still do not know the exact position of the hypocenter: the inferred depths vary considerably (8.4–19 km) (Gong et al., 2019). More specifically, initial rupture was found at ≧15 km depth based on a high-angle listric-reverse fault model of the Longmenshan fault system (Zhang et al., 2009, Zhang et al., 2012), whereas a much shallower depth of ≦10 km was also proposed based on a steep reverse fault model (Xu et al., 2009; Hubbard and Shaw, 2009; Gong et al., 2019). Usually, strong motion data (Zhang et al., 2012) and geodetic measurements (Shen et al., 2009; Feng et al., 2010) are used to get a precise estimate of the earthquake locations and to infer seismogenic structure, but the results are still biased because the models still miss enough details of the material and structural complexities. In this study, we explored the uncertainties of the inferred seismogenic structures by using almost all the seismic velocity models available for the seismic relocation and by comparing the results with the nearby instrumental moderate-large earthquakes. Our method is not perfect, but relies on almost all the data constraints accessible to us.
The relocation results of the aftershock sequence of the 2020 M6.4 Jiashi earthquake depend on quality of eight seismic velocity models. Most relocation results showed shocks distributed at a depth of ∼15 km (Figures 4B–I). In particular, similar depth distributions were obtained with the low resolution velocity models from the CRUST2.0 model. A small number of shocks were found at greater depths (Figures 4E–I) based on the R0 and PE velocity models (Figure 3). Based on the velocity model of Huang et al. (2006), most aftershocks were distributed at depths of 10–20 km, consistent with the depths determined by previous studies on the 1997 M6 Jiashi earthquake swarm (Zhou and Xu, 2000) and the 2003 Bachu-Jiashi earthquake (Huang et al., 2006). While the velocity model of Lü et al. (2019) consists of multiple layers, the relocated depths of small earthquakes (ML1–3) obtained using this velocity model also show notable delamination, but most shocks are at depths greater than 10 km (Figure 4C). The Magnitude-depth distribution reveals a ∼2 km-thick region, centered at ∼12 km depth, scarce of events, which might delineate the décollement of the thrust. Below this region, approximately half of the shocks are at depths greater than 10 km; while above this region, the ML1–3 shocks are at depths of 11–30 km. The hypocentral depths obtained using the DD relocation algorithm with the velocity model of Song et al. (2019) are relatively shallow overall (basically less than 20 km) (Figure 4D), perhaps because this velocity model reflects influences from some localized structures. Specifically, the majority of the ML1–3 shocks are relocated at depths shallower than 17 km. The ML2–3 shocks are found to be distributed at depths of 8–12 km. However, almost all the ML≥3 shocks are relocated at depths greater than 14 km (Figure 4D). The resolution of the velocity models from CRUST 2.0 database are too low to illustrate the details of the sequence, and the event depths of the whole sequence approach 15 km. Overall, regardless of the velocity model used, the depths determined by the DD location algorithm exceed 10 km for all relatively large shocks (ML≥3.0) that can be detected by many seismic stations recording more shock-pairs. Note that the data of the nearest seismic station, ∼12 km away from the epicenter, provide the most important constraint on all the relocations.
A statistics on magnitude vs. horizontal and vertical dispersions of the relocated results reveals that the relocated depths are more sensitive to the choice of seismic velocity model than the horizontal positions (Figure 7A). This pattern is particularly pronounced for small (M < 3) shocks, whose depths can vary by up to 23.28 km, whereas that of the horizontal positions vary a few kilometers. Similar patterns apply to the relocated results for the M > 4 events (Figure 7A). Hence, for each event, we average the relocated hypocentral depths determined on the basis of those eight velocity models. The averaged hypocentral depths of most shocks range from 8 to 20 km. The averaged hypocentral depths of the M > 4 shocks are greater than 12 km. Figure 7B also shows the upper and lower averaged depth limits for each shock. Except for the mainshock, the relocated hypocentral depths for the M > 4 shocks are at least greater than 10 km. Depending on the choice of seismic velocity model, the hypocentral depth of the M6.4 mainshock varies by 16 km (from 4.914 to 21.2 km), and the average is 15.62 km.
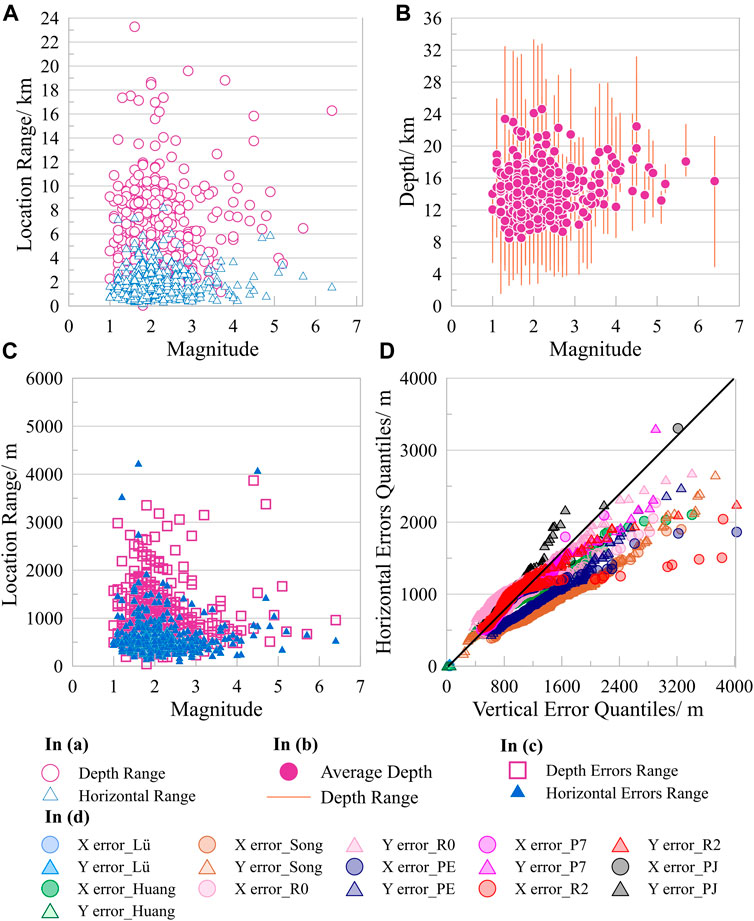
FIGURE 7. Comparison of the DD locations determined using the eight velocity models. (A) Variation in the horizontal and vertical relocations caused by the different velocity models. The red circles show the variation ranges of the epicentral depths. The blue triangles show the variation in the horizontal epicentral locations. (B) Averages and ranges of the aftershock depths determined using different velocity models. (C) Comparison of the variation ranges of the depth and horizontal errors produced by the 8 velocity models. (D) Quantile–quantile plot of the location errors generated by the different velocity models in the horizontal longitudinal (X) and latitudinal (Y) directions relative to the vertical location errors.
Whether a velocity model is suitable for seismic relocations was examined based on the location errors. The horizontal errors are relatively similar regardless of whether low resolution or high resolution velocity model were used. The vertical relocation errors of the small shocks (M ≦4) varied more considerably with the velocity model than those for the larger shocks. Furthermore, compared with the horizontal relocation errors, the vertical relocation errors varied more considerably with the velocity model. For the M > 4 shocks, most of the vertical relocation errors were in magnitude similar to the horizontal relocation errors (Figure 7C). In addition, a quantile-quantile plot of the horizontal relocation errors relative to the vertical relocation errors was generated for comparative analysis (Figure 7D). Notably, all the horizontal errors in the longitude- and latitude-directions were smaller than the vertical relocation errors, except for the relocation errors in the latitude-direction generated by the PJ velocity model. In particular, the horizontal relocation errors in the longitude-direction generated by the R2 velocity model were far smaller than the vertical relocation errors. The relocation errors generated by the velocity models from Lü et al. (2019), Song et al. (2019), Huang et al. (2006), and PE in CRUST2.0 were similar.
Shown in Figure 8 is summary of the spatial distributions of aftershocks (the epicenters are the averages from the eight relocation results), with the relocation results color-coded by maximum and minimum depths (Figures 8A,B) and horizontal and vertical ranges (Figures 8C,D). To the east, the shocks are relatively shallow, while at the junction of the foreshocks and the aftershocks (longitude 77°10′), the shocks appear to be at greater depth. Interestingly, the shocks which are found to have relatively large uncertainties in the horizontal relocation results are localized on the east side of the sequence (Figure 8C), while the vertical relocation results do not exhibit any spatial correlation (Figure 8D).
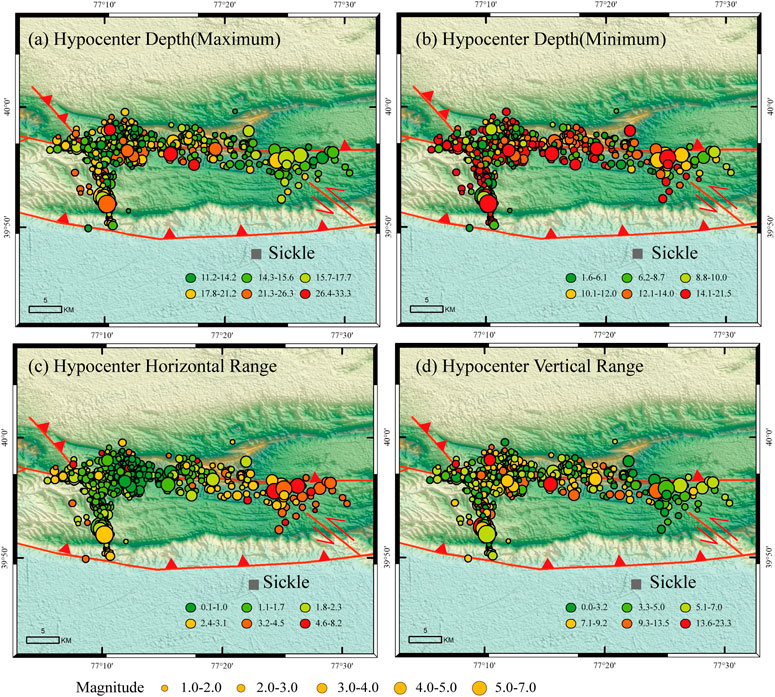
FIGURE 8. Distribution of the relocated aftershock epicenters using the eight velocity models. The sizes of the circles represent the magnitude, and the color shows the variations in the depth and ranges. (A) Maximum depths. (B) Minimum depths. (C) Horizontal ranges. (D) Vertical ranges.
The distribution of relocated depths of the 2020 Jiashi earthquake sequence has similar patterns as others earthquakes that occurred inside the Tarim Craton, such as the 1997 Jiashi earthquake swarm, the 1998 Jiashi double earthquake, and the 2003 Bachu-Jiashi earthquake (Figure 4B). All these earthquakes occurred beneath the décollement of the Kaping fold-and-thrust fault. Synthetic seismic sections show the presence of the deep Bashen–Tuopu fault near the epicenters of these earthquakes that occurred in the piedmont zone. The Bashen–Tuopu fault is a nearly vertical strike-slip fault with shallow branches, including not only positive flower structures but also small scale compressional structures (sections D–D′ and E–E′ in Figure 1), which agrees with the various nodal planes of earthquake focal mechanism solutions (Figure 2A).
The temporal variation in the b-value of the 2020 Jiashi earthquake sequence was relatively gentle (Figure 6). However, the b-values of the 1997 Jiashi earthquake swarm and the 1998 Jiashi double earthquake varied notably with time. The spatiotemporal evolution of the 2020 Jiashi earthquake sequences shows that two structures, one in the E–W direction and one in the NNW–SSE direction, participated in the initiation and development of this event (Figure 5). However, there were relatively few moderate-sized strong shocks in the sequence, and the seismicity frequency of the sequence underwent rapid attenuation. This finding shows that the 2020 Jiashi earthquake is different from some typical thrust earthquakes, such as the 2008 M8 Wenchuan earthquake (Xu et al., 2009) and the 2013 M7 Lushan earthquake (Lu et al., 2017), as well as earthquake sequences involving multiple structures, such as the 2014 M6.5 Ludian earthquake (Zhang et al., 2015).
By interpreting the synthetic seismic sections, Xiao et al. (2002) noted that the present deep structures inside the basement under the Kaping fold-and-thrust structure are a part of the Tarim Basin. In the Tarim craton, some NW-NNW-trending blind structures were formed at the same time as the structures with the same strikes in the Kaping region. There is a spatial correlation between the faults, such as the Piqiang and Selibuya-Mazartagh Faults (section C–C′ in Figure 1) (Turner et al., 2011), the Bashen-Tuopu Fault (Figure 2A) and the secondary structures within the nappe (Figure 6) (Li et al., 2019), the deep NW–NNW-trending structures covered by the Kaping fold-and-thrust structure, and the Yijianfang fault (Section 2F–F′ in Figure 1) (Xiao et al., 2002). This finding indicates the existence of complex fault system with multiple possible fault structures in the basement, which is partly covered by the Kaping fold-and-thrust sheet.
Thus, based on the tectonic settings and historical earthquakes in the Jiashi region, the relocations determined in this study suggest that the 2020 M6.4 Jiashi earthquake was a moderate-sized strong earthquake that occurred beneath the Kaping fold-and-thrust structure and was spatially delimited by several secondary deep NW–NNW-trending faults. Moreover, the 2020 Jiashi earthquake occurred at a relatively deep region. During this earthquake, stress propagation and deformation were modulated and suppressed by the overlying 10 km-thick nappe, which not only caused the surface deformation exhibiting the typical surface-deformation characteristics of a thrust event (Yao et al., 2020) but also produced a temporally stable b-value time-series.
The Kaping fold-and-thrust belt is considered to be an active structure (Yin et al., 1998; Allen et al., 1999; Li et al., 2020). However, the 1997 earthquake swarm, the 1998 double earthquake, and the 2003 Bachu-Jiashi earthquake all occurred in the piedmont zone, suggesting that the piedmont zone is also prone to seismic hazard induced by strong events.
Typically, the thin-skinned structure of the Kaping fold-and-thrust is thought to have the potential of hosting moderate-size events, rather than large events, because stress accumulation and release on the long and shallow thrust sheets have difficulty in generating large earthquakes. The 2020 Jiashi earthquake was once considered to be a moderate-sized strong earthquake occurred in the thin-skinned structure (Yao et al., 2020). However, by carefully relocating the 2020 Jiashi earthquake and calculating of its b-value, this study found that this earthquake likely occurred 10–18 km beneath the Kaping fold-and-thrust structure, which suggests that some of the structure in the basement beneath the décollements is also capable of generating moderate-sized strong earthquakes. Thus, special attention should be paid on the seismic hazard of the Kaping fold-and-thrust structure, rather than merely the seismic hazard along the active faults in the piedmont zone.
Overall, the 2020 Jiashi earthquake occurred on the deep, ancient structures inside the basement. These structures are actually not fully decoupled from the above thrusts. Specifically, the 2020 Jiashi M6.4 earthquake occurred inside the Tarim Craton, similar to the earthquake swarm in 1997 and the double earthquake in 1998. The stress release, rupture process, and aftershock triggering were all influenced by both the thick cover overlying the décollement and the structures beneath the décollement. Similar earthquakes have occurred in the Tajik fold-thrust belt in the Pamir (Kufner et al., 2018; Gągała et al., 2020). Accordingly, the earthquakes that occurred along the peripheral regions of thin-skinned thrusts must be analyzed with greater care.
Conclusion
We relocated the 2020 Jiashi M6.4 earthquake by the double-difference location algorithm and considered the influences of eight velocity models on the relocation results. Our results showed that most of the moderately strong shocks occurred at depths below the décollement of the fold-thrust belt (at ∼10 km depth). This finding is consistent with the depths of nearby swarm-type earthquakes, such as the 1997 Jiashi M6 swarm inside the Tarim Craton (distance ≦50 km).
We compare the temporal evolution of b-value for the 1997 M6 earthquake swarm, 1998 double-earthquake sequence, 2003 M6.8 earthquake sequence, and 2020 M6.4 Jiashi earthquake. The temporal evolution of b-value was relatively stable, implying that the sequence of the 2020 event underwent rapid stress attenuation.
Based on our analysis, we proposed that the 2020 M6.4 Jiashi earthquake occurred beneath the thrust sheet inside the Tarim Craton, rather than within the fold-thrust belt. This finding suggests that the deep structures (≧10 km) beneath the thin-skinned belt can be seismogenic and can affect the surface trace of the nappe structure in the border region of Orogenic belts and Cratons. This insight presents new challenges to seismic hazard assessment for the peripheral regions of the thin-skinned tectonic zone.
Data Availability Statement
The raw data supporting the conclusions of this article will be made available by the authors, without undue reservation.
Author Contributions
QY performed the data analyses and wrote the manuscript and made all figures. WY contributed to the relocation of the sequence. XJ contributed to the b-values of the sequence. YG, HW funding acquisition and validation. JL, YZ helped in reviewing and discussion. JR, CY, CY, JZ helped perform the analysis with constructive discussions.
Funding
The State Key Laboratory of Earthquake Dynamics (Grant No. LED 2019B08), the special fund of the Institute of earthquake forecasting, China Earthquake Administration (Grant No. 2020LNEF03), and the National Key R&D Program of China (Grant No. 2018YFC1503305).
Conflict of Interest
The authors declare that the research was conducted in the absence of any commercial or financial relationships that could be construed as a potential conflict of interest.
Acknowledgments
We appreciate the constructive reviews from Pro. Paul Tapponnier and Jia Cheng at the National Institute of Natural Hazards, Ministry of Emergency Management of China. We thank Zhigao Yang and Ms. Chunlan Miao at the China Earthquake Networks Center (CENC), for providing the initial catalog. The manuscript benefitted from useful comments by two anonymous reviewers and guest editors Fabien Graveleau and Derek Keir. The authors thank Shaozhuo Liu at King Saud University for improving the English in this paper. This study was jointly sponsored by the State Key Laboratory of Earthquake Dynamics (Grant No. LED 2019B08), the special fund of the Institute of earthquake forecasting, China Earthquake Administration (Grant No. 2020LNEF03), and the National Key R&D Program of China (Grant No. 2018YFC1503305). We acknowledge support from National Natural Science Foundation of China (Grant No. 41774111 and 41974111) and the National Key Research and Development Program of China (Grant No. 2018YFE0109700).
Supplementary Material
The Supplementary Material for this article can be found online at: https://www.frontiersin.org/articles/10.3389/feart.2021.647577/full#supplementary-material
References
Aki, K. (1965). Maximum Likelihood Estimate of B in the Formula logN=a-bM and its Confidence Limits. Bull. Earthq. Res. Inst. Tokyo Univ. 43, 237–239. doi:10.1111/j.1558-5646.1989.tb04264.x
Allen, M. B., Vincent, S. J., and Wheeler, P. J. (1999). Late Cenozoic Tectonics of the Kepingtage Thrust Zone: Interactions of the Tien Shan and Tarim Basin, Northwest China. Tectonics 18 (4), 639–654. doi:10.1029/1999tc900019
Borderie, S., Graveleau, F., Witt, C., and Vendeville, B. C. (2018). Impact of an Interbedded Viscous Décollement on the Structural and Kinematic Coupling in Fold-And-Thrust Belts: Insights from Analogue Modeling. Tectonophysics 722, 118–137. doi:10.1016/j.tecto.2017.10.019
Charreau, J., Chen, Y., Gilder, S., Barrier, L., Dominguez, S., Augier, R., et al. (2009). Neogene Uplift of the Tian Shan Mountains Observed in the Magnetic Record of the Jingou River Section (Northwest China). Tectonics 28, 121. doi:10.1029/2007tc002137
Dominguez, S., Avouac, J. P., and Michel, R. (2003). Horizontal Coseismic Deformation of the 1999 Chi‐Chi Earthquake Measured from SPOT Satellite Images: Implications for the Seismic Cycle along the Western Foothills of Central Taiwan. J. Geophys. Res. 108, 2083. doi:10.1029/2001jb000951
Ekström, G., and England, P. (1989). Seismic Strain Rates in Regions of Distributed Continental Deformation. J. Geophys. Res. 94 (B8), 10231–10257. doi:10.1029/jb094ib08p10231
Elliott, J. R., Jolivet, R., González, P. J., Avouac, J.-P., Hollingsworth, J., Searle, M. P., et al. (2016). Himalayan Megathrust Geometry and Relation to Topography Revealed by the Gorkha Earthquake. Nat. Geosci. 9, 174–180. doi:10.1038/ngeo2623
Fan, G., Ni, J. F., and Wallace, T. C. (1994). Active Tectonics of the Pamirs and Karakorum. J. Geophys. Res. 99 (B4), 7131. doi:10.1029/93jb02970
Fang, L. H., Wu, J. P., Wang, W. L., Yang, T., and Wang, C. Z. (2015). Relocation of the 2014 MS7.3 Earthquake Sequence in Yutian, Xinjiang. Chin. J. Geophys. 58 (3), 802–808. [in Chinese with English abstract]. doi:10.6038/cjg20150310
Feng, G., Hetland, E. A., Ding, X., Li, Z., and Zhang, L. (2010). Coseismic Fault Slip of the 2008 Mw7.9 Wenchuan Earthquake Estimated from InSAR and GPS Measurements. Geophys. Res. Lett. 37, 127. doi:10.1029/2009gl041213
Gągała, Ł., Ratschbacher, L., Ringenbach, J. C., Kufner, S. K., Schurr, B., and Dedow, R. (2020). Tajik Basin and Southwestern Tian Shan, Northwestern india‐asia Collision Zone: 1. Structure, Kinematics, and Salt Tectonics in the Tajik Fold‐and‐thrust Belt of the Western Foreland of the Pamir. Tectonics 39, e2019TC005871. doi:10.1029/2019TC005871
Glorie, S., De Grave, J., Buslov, M. M., Zhimulev, F. I., Stockli, D. F., Batalev, V. Y., et al. (2011). Tectonic History of the Kyrgyz South Tien Shan (Atbashi-Inylchek) Suture Zone: The Role of Inherited Structures during Deformation-Propagation. Tectonics 30, 137. doi:10.1029/2011tc002949
Gong, M., Xu, X. W., Shen, Y., Huang, B. S., and Li, K. (2019). Initial Rupture Processes of the 2008 Mw7.9 Wenchuan, China Earthquake: From Near-Source Seismic Records. J. Asian Earth Sci. 173 (397–403), 1367–9120. doi:10.1016/j.jseaes.2019.01.040
Gu, J. Y. (1994). Sedimentary Facies and Petroleum Accumulations: Petroleum Exploration in the Tarim Basin, 310. Beijing: Pet. Ind. Press.
Gulia, L., and Wiemer, S. (2019). Real-time Discrimination of Earthquake Foreshocks and Aftershocks. Nature 574 (7777), 193–199. doi:10.1038/s41586-019-1606-4
Guo, B., Liu, Q. Y., Chen, J. H., and Li, S. C. (2002). Relocation of Earthquake Swquences Using Joint Hypocenter Determination Method: Portable Seismic Array Study in Jiashi Region, Xinjiang. Seismol. Geol. 24 (2), 199–207. [in Chinese with English abstract]. doi:10.1063/1.4915031
Gutenberg, B., and Richter, C. (1944). Frequency of Earthquake in California. Bull. Seismol. Soc. Am. 34, 185–188.
Huang, Y., Yang, J. S., and Zhang, T. Z. (2006). Relocation of the Bachu Jiashi, Xinjiang Earthquake Sequence in 2003 Using the Double Difference Location Algorithm. Chin. J. Geophys. 49 (1), 162–169. [in Chinese with English abstract]. doi:10.1002/cjg2.822
Hubbard, J., and Shaw, J. H. (2009). Uplift of the Longmen Shan and Tibetan Plateau, and the 2008 Wenchuan (M = 7.9) Earthquake. Nature 458 (7235), 194–197. doi:10.1038/nature07837
Hubbard, J., Almeida, R., Foster, A., Sapkota, S. N., Bürgi, P., and Tapponnier, P. (2016). Structural Segmentation Controlled the 2015 Mw7.8 Gorkha Earthquake Rupture in Nepal. Geology 44, 639–642. doi:10.1130/g38077.1
Jia, D., Lu, J., Cai, D. S., Wu, S. M., and ShiChen, Y. C. M. (1998). Structural Features of Northern Tarim Basin : Implications for Regional Tectonics and Petroleum Traps. Aapg Bull. 82 (1), 147–159. doi:10.1306/1D9BC3B3-172D-11D7-8645000102C1865D
Kufner, S.-K., Schurr, B., Ratschbacher, L., Murodkulov, S., Abdulhameed, S., Ischuk, A., et al. (2018). Seismotectonics of the Tajik Basin and Surrounding Mountain Ranges. Tectonics 37 (8), 2404–2424. doi:10.1029/2017tc004812
Kulikova, G., and Krüger, F. (2017). Historical Seismogram Reproductions for the Source Parameters Determination of the 1902, Atushi (Kashgar) Earthquake. J. Seismol 21, 1577–1597. doi:10.1007/s10950-017-9683-z
Li, S., Wang, X., and Suppe, J. (2012). Compressional Salt Tectonics and Synkinematic Strata of the Western Kuqa Foreland Basin, Southern Tian Shan, China. Basin Res. 24, 475–497. doi:10.1111/j.1365-2117.2011.00531.x
Li, Y.-J., Wen, L., Zhang, H.-A., Huang, T.-Z., Li, H.-L., Shi, Y.-Y., et al. (2016). The Kuqa Late Cenozoic Fold-Thrust Belt on the Southern Flank of the Tian Shan Mountains. Int. J. Earth Sci. (Geol Rundsch) 105, 1417–1430. doi:10.1007/s00531-015-1262-3
Li, H. H., Dong, H. K., Du, D. D., Zhang, L. P., Wang, X., Chen, X. Y., et al. (2019). The Faults and Their Controlling Effects on the Hydrocarbon Accumulation in the Markit Slope, SW Tarim Basin. Chin. J. Geophys. 54 (4), 1085–1099. doi:10.12017/dzkx.2019.061
Li, A., Ran, Y. K., Gomez, F., Jobe, J. A. T., and Xu, L. (2020). Thompson Jobe, Huaguo Liu, Liangxin Xu. Segmentation of the Kepingtage Thrust Fault Based on Paleoearthquake Ruptures, Southwestern Tianshan, China. Nat. Hazards 103 (1), 1385–1406. doi:10.1007/s11069-020-04040-6
Lu, H. F., Jia, D., Cai, D. S., Wu, S. M., Chen, C. M., and ShiGuo, Y. S. L. Z. (1998). On the Kaping Transpression Tectonics of Northwest Tarim. Geol. J. China universitiesf 4 (1), 49–58. [in Chinese with English abstract].
Lu, R. Q., Xu, X. W., He, D. F., Bo, L., Wang, F., Tan, X., et al. (2017). Seismotectonics of the 2013 Lushan MW 6.7 Earthquake: Inversion Tectonics in the Eastern Margin of the Tibetan Plateau. Geophys. Res. Lett. 44 (16), 8236–8243. doi:10.1002/2017gl074296
Lü, Z., Gao, H., Lei, J., Yang, X., Rathnayaka, S., and Li, C. (2019). Crustal and Upper Mantle Structure of the Tien Shan Orogenic Belt from Full‐Wave Ambient Noise Tomography. J. Geophys. Res. Solid Earth 124, 3987–4000. doi:10.1029/2019jb017387
Molnar, P., and Ghose, S. (2000). Seismic Moments of Major Earthquakes and the Rate of Shortening across the Tien Shan. Geophys. Res. Lett. 27 (16), 2377–2380. doi:10.1029/2000gl011637
Mousavi, S. M., Ogwari, P. O., Horton, S. P., and Langston, C. A. (2017). Spatio-temporal Evolution of Frequency-Magnitude Distribution and Seismogenic Index during Initiation of Induced Seismicity at Guy-Greenbrier, Arkansas. Phys. Earth Planet. Interiors 267, 53–66. doi:10.1016/j.pepi.2017.04.005
Nanjo, K. Z., Hirata, N., Obara, K., and Kasahara, K. (2012). Decade‐scale Decrease in B Value Prior to the M 9‐class 2011 Tohoku and 2004 Sumatra Quakes. Geophys. Res. Lett. 39, L20304. doi:10.1029/2012gl052997
Narteau, C., Byrdina, S., Shebalin, P., and Schorlemmer, D. (2009). Common Dependence on Stress for the Two Fundamental Laws of Statistical Seismology. Nature 462, 642–645. doi:10.1038/nature08553
Romanowicz, B. (1981). Depth Resolution of Earthquakes in Central Asia by Moment Tensor Inversion of Long-Period Rayleigh Waves: Effects of Phase Velocity Variations across Eurasia and Their Calibration. J. Geophys. Res. 86 (B7), 5963–5984. doi:10.1029/jb086ib07p05963
Schorlemmer, D., Wiemer, S., and Wyss, M. (2005). Variations in Earthquake-Size Distribution across Different Stress Regimes. Nature 437 (7058), 539–542. doi:10.1038/nature04094
Shen, Z.-K., Sun, J., Zhang, P., Wan, Y., Wang, M., Bürgmann, R., et al. (2009). Slip Maxima at Fault Junctions and Rupturing of Barriers during the 2008 Wenchuan Earthquake. Nat. Geosci. 2 (10), 718–724. doi:10.1038/ngeo636
Song, C. Y., Gao, R., Liu, J. M., Liu, P., Guo, Y., and Wen, S. Y. (2019). Discussion on Earthquake Sequence and Seismogenic Structure for the Jiashi MS5.5 Earthquake on September 4, 2018, Xinjiang. Earthq. Res. China 35 (2), 256–268. [in Chinese with English abstract]. doi:10.1007/s11589-012-0848-0
Tapponnier, P., and Molnar, P. (1979). Active Faulting and Cenozoic Tectonics of the Tien Shan, mongolia, and Baykal Regions. J. Geophys. Res. 84, 3425–3459. doi:10.1029/jb084ib07p03425
Tian, Z., Sun, J., Windley, B. F., Zhang, Z., Gong, Z., Lin, X., et al. (2016). Cenozoic Detachment Folding in the Southern Tianshan Foreland, NW China: Shortening Distances and Rates. J. Struct. Geol. 84, 142–161. doi:10.1016/j.jsg.2016.01.007
Turner, S. A., Liu, J. G., and Cosgrove, J. W. (2011). Structural Evolution of the Piqiang Fault Zone, Nw Tarim Basin, China. J. Asian Earth Sci. 40 (1), 394–402. doi:10.1016/j.jseaes.2010.06.005
Waldhauser, F., and Ellsworth, W. L. (2000). A Double-Difference Earthquake Location Algorithm: Method and Application to the Northern Hayward Fault, California. Bull. Seismol. Soc. Am. 90 (6), 1353–1368. doi:10.1785/0120000006
Xiao, A. C., Yang, S. F., Wang, Q. H., Chen, H. L., Xie, H. W., and Li, Y. J. (2002). Corresponding Relation of S–N-Striking Fault Systems in the Bachu-Kaping Area, Tarim Basin. Chin. J. Geol. 37, 64–72. [in Chinese with English abstract]. doi:10.15372/gig2020125
Xiao, A. C., Yang, S. F., Li, Y. J., Wang, Q. H., Chen, H. L., and Chen, X. G. (2005). Main Period for Creation of Fracture System in the Bachu Uplift, Tarim Basin. Chin. J. Geol. 40 (2), 291–302. in Chinese with English abstract. doi:10.1002/cjg2.1550
Xu, X., Wen, X., Yu, G., Chen, G., Klinger, Y., Hubbard, J., et al. (2009). Coseismic Reverse- and Oblique-Slip Surface Faulting Generated by the 2008 Mw 7.9 Wenchuan Earthquake, China. Geology 37 (6), 515–518. doi:10.1130/g25462a.1
Xu, L., Ran, Y., Liu, H., and Li, A. (2019). 10Be-derived Sub-milankovitch Chronology of Late Pleistocene Alluvial Terraces along the Piedmont of SW Tian Shan. Geomorphology 328 (1), 173–182. doi:10.1016/j.geomorph.2018.12.009
Yang, X. P., Ran, Y. K., Song, F. M., Xu, X. W., Cheng, J. W., Min, W., et al. (2006). The Analysis for Crust Shortening of Kaping Thrust Tectonic Zone, South-Western Tian Shan, Xinjiang, China. Seismol. Geol. 28 (2), 194–204. [in Chinese with English abstract]. doi:10.5194/egusphere-egu2020-6692
Yang, G., Shi, X., Jia, C. Z., Zhang, J. F., Zhang, C. J., He, D. F., et al. (2008a). Spatial Relationship between Piqiang Fault and Selibuya Fault in Keping-Bachu District, Northwest Tarim Basin. Uranium Geol. 24 (4), 201–207. [in Chinese with English abstract]. doi:10.1080/00206814.2017.1360803
Yang, X. P., Deng, Q. D., Zhang, P. Z., and Xu, X. W. (2008b). Crustal Shortening of Major Nappe Structures on the Front Margins of the Tian Shan. Seismol. Geol. 30 (1), 111–131. [in Chinese with English abstract]. doi:10.1016/b978-0-444-41851-7.50002-9
Yao, Z., Yang, S. M., Chen, H. L., Dilek, Y., Cheng, X. G., Lin, X. B., et al. (2019). The Effect of Overburden Thickness on Deformation Mechanisms in the Keping Fold-Thrust Belt, Southwestern Chinese Tian Shan Mountains: Insights from Analogue Modeling. Tectonophysics 753, 79–92. doi:10.1016/j.tecto.2019.01.005
Yao, Y., Wen, S., Li, T., and Wang, C. (2020). The 2020 MW6.0 Jiashi Earthquake: A Fold Earthquake Event in the Southern Tian Shan, Northwest China. Seismol. Res. Lett. Bull. Seismological Soc. America 109 (2), 114. doi:10.1785/0220200146
Yin, A., Nie, S., Craig, P., Harrison, T. M., Ryerson, F. J., Xianglin, Q., et al. (1998). Late Cenozoic Tectonic Evolution of the Southern Chinese Tian Shan. Tectonics 17 (1), 1–27. doi:10.1029/97tc03140
Zhang, P. Z., Wen, X. Z., Xu, X. W., Gan, W. J., Wang, M., Shen, Z. K., et al. (2009). Tectonic Model of the Great Wenchuan Earthquake of May 12, 2008, Sichuan, China Chin. Sci. Bull. 54 (7), 944–953. [in Chinese with English abstract]. doi:10.1007/s11434-009-0054-1
Zhang, G., Vallée, M., Shan, X., and Delouis, B. (2012). Evidence of Sudden Rupture of a Large Asperity during the 2008 Mw7.9 Wenchuan Earthquake Based on Strong Motion Analysis. Geophys. Res. Lett. 39, 132. doi:10.1029/2012gl052516
Zhang, Y., Chen, Y. T., and Xu, L. S. (2015). The 2014 MW6.1 Ludian, Yunnan, Earthquake: A Complex Conjugated Ruptured Earthquake. Chin. J. Geophys. 58 (1), 153–162. doi:10.1163/2210-7975_hrd-9813-2014167
Zhang, Y., Yang, S., Chen, H., Dilek, Y., Cheng, X., Lin, X., et al. (2019). The Effect of Overburden Thickness on Deformation Mechanisms in the Keping Fold-Thrust Belt, Southwestern Chinese Tian Shan Mountains: Insights from Analogue Modeling. Tectonophysics 753, 79–92. doi:10.1016/j.tecto.2019.01.005
Zhao, C. P., Chen, Z. L., and Zheng, S. H. (2008). Source Rupture Process of 3 Jiashi MS6 Events (1998∼2003) and its Correlation with the Aftershock Activity. Chin. J. Geophys. 51 (4), 1093–1102. [in Chinese with English abstract]. doi:10.1002/cjg2.1270
Keywords: Jiashi earthquake, décollement, aftershock relocation, b-value temporal evolution, Tarim Basin, Tien Shan Mountain, Kaping fold-and-thrust belt
Citation: Yao Q, Yang W, Jiang X, Guo Y, Liu J, Zhang Y, Wang H, Ren J, Yu C, Yue C and Zhao J (2021) The 2020 M6.4 Jiashi Earthquake: An Event that Occurred Under the Décollement on the Kaping Fold-and-Thrust Belt in the Southwestern Tien Shan Mountains, China. Front. Earth Sci. 9:647577. doi: 10.3389/feart.2021.647577
Received: 30 December 2020; Accepted: 29 April 2021;
Published: 26 May 2021.
Edited by:
Fabien Graveleau, Université de Lille, FranceReviewed by:
Eric Hetland, University of Michigan, United StatesAndrey Mikhaylovich Korzhenkov, Institute of Physics of the Earth (RAS), Russia
Copyright © 2021 Yao, Yang, Jiang, Guo, Liu, Zhang, Wang, Ren, Yu, Yue and Zhao. This is an open-access article distributed under the terms of the Creative Commons Attribution License (CC BY). The use, distribution or reproduction in other forums is permitted, provided the original author(s) and the copyright owner(s) are credited and that the original publication in this journal is cited, in accordance with accepted academic practice. No use, distribution or reproduction is permitted which does not comply with these terms.
*Correspondence: Yanshuang Guo, Z3VveXNoQGllcy5hYy5jbg==