 Xuri Huang
 Yungui Xu
 Haoyuan Li
 Zhiwen Zhang2
94% of researchers rate our articles as excellent or good
Learn more about the work of our research integrity team to safeguard the quality of each article we publish.
Find out more
METHODS article
Front. Earth Sci., 22 April 2021
Sec. Solid Earth Geophysics
Volume 9 - 2021 | https://doi.org/10.3389/feart.2021.641705
This article is part of the Research TopicRock Physics and Geofluid DetectionView all 27 articles
The Moxi area in the Sichuan Basin is dominated by carbonate gas reservoirs, where gas productivity is most strongly influenced by their pore types. Fractured caves are the most favorable pore structure type for reservoir productivity, followed by cave and vuggy pore structures, and interparticle pore structures are the least productive. The spatial discrimination of these three pore types is important for cost-effective development. However, the pore type identification remains difficult owing to poor-quality azimuthal seismic data. A practical approach is to understand the seismic signatures of the different pore types and the related productivities from the post-stack data. In this work, seismic forward modeling is conducted using a constructed theoretical model of Hudson's anisotropic representation, and the pre-stack and post-stack anisotropy signatures are analyzed for different pore types. The rock model is further calibrated using log data, and forward modeling is performed based on the calibrated logs. We propose a new attribute of these signatures: namely, the ratio of the absolute peak and the absolute trough immediately below the peak, which is applied to the three-dimensional seismic data in the Moxi area. In contrast with other conventional attributes, this ratio effectively correlates with pore type, which allows the pore types in wells to be differentiated. This attribute also reasonably correlates with open flow gas rate of the well. The results demonstrate that this attribute from the post-stack data is a promising indicator of pore type and gas productivity and can also be readily mapped spatially for the selection of new drilling locations.
A giant Precambrian gas field called the Moxi–Gaoshiti gas field was recently discovered and put into production in the Sichuan Basin (Liao et al., 2011). Recent studies have shown that the gas field is a structural and stratigraphic reservoir (Li Z. et al., 2014; Xu et al., 2019). The lithology is Sinian carbonate with small amounts of shale and silica. The reservoir thickness ranges from 0 to 200 m with erosion breccia, arenite dolomite, silty dolomite, and straticulate dolomite. Shale and silicalite normally serve as the caprock or sealing formation. The pore system is mainly composed of small caves, vuggy pores, interparticle pores, and fractured caves. The pores include interparticle dissolution pores, interparticle pores, intercrystalline dissolution pores, and intercrystalline pores, all of which can develop owing to dolomization and dissolution processes. The pore system in the Dengying group is dominated by dissolution processes, and caves and vuggy pores have developed in response to weathering and dissolution processes. Most of the vuggy pores and caves exhibit elongated “string bean” patterns including bedding features and the path alignment of fractures and dissolution. The fracture geometry is mainly disk-shaped, ellipsoidal, or irregular. The most commonly developed fractures in the reservoir include structural fractures, dissolution fractures, and stylolite lines. Structural fractures are commonly filled with dolomite, asphalt, and quartz. Mid- to high-angle fractures dominate the upper Deng-4 zone, whereas low- to mid-angle fractures dominate the lower Deng-4 zone (Li Y. et al., 2014). Fracture systems with vuggy pores/caves provide a good reservoir pore system (Shirmohamadi et al., 2017; Abdlmutalib et al., 2019), but these features tend to cause a high degree of seismic anisotropy, and current seismic data at present lack high-quality azimuthal information. This poses a challenge to interpret the anisotropy and identify the reservoir pore types and fluid producibilities using the seismic data. In this work, we focus on the Moxi area of the giant gas field, which is a development area with eight gas-producing wells with geological characteristics as described above. Anisotropic modeling is performed based on a theoretical model and log data to guide the extraction of post-stack seismic attributes (Payne et al., 2010; Shiri and Falahat, 2020). Vuggy pores and fractured caves are found to be the pore types that typically yield a high initial gas rate. A newly extracted attribute is applied to correlate with the initial open flow gas rate, which can serve as a productivity indicator and allow the initial open flow gas rate to be spatially mapped as a guide for future drilling.
The pores in the Moxi area are classified into three types based on the aforementioned geological processes: (1) fractured-vuggy pores/caves, (2) vuggy pores/caves, and (3) interparticle pores (Figure 1) (Sain et al., 2008; Kittridge, 2015). The production data show that the pore type strongly impacts gas productivity. Fractured-vuggy pore/cave type structures are generally associated with the highest production levels, whereas interparticle pore structures are associated with the lowest productivity. The three pore types cannot be identified from the seismic data using traditional approaches. The seismic anisotropy can be a critical factor for signal characteristic analysis because fractures are often mixed with caves and vuggy pores. Anisotropic models are therefore required to represent this geology type for a better understanding of the post-stack seismic signatures. The Hudson model (Hudson, 1980, 1986) has been used to characterize anisotropy using a “coin-shaped” pore based on geology. However, this assumed shape generates uncertainties because some particularly long fractures may be present. Nevertheless, the intensity of long fractures is relatively low in this area, thus the model is still applicable (Simon and Philip, 2010; Peng and Xiao, 2017). The related anisotropic parameters are determined to model their corresponding post-stack seismic signatures.
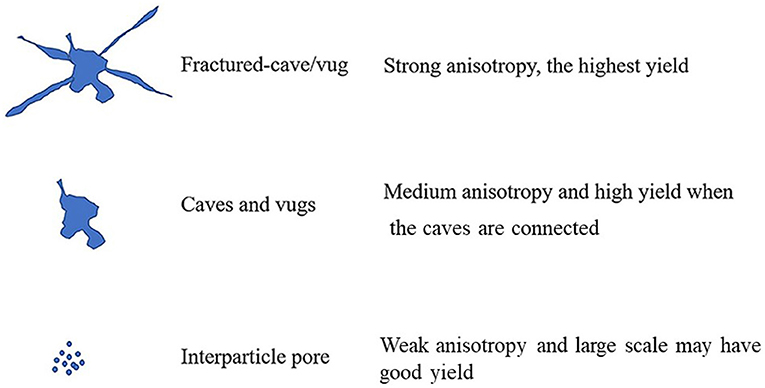
Figure 1. Schematic diagram of the three investigated pore types.
In this work, we use the Hudson model for anisotropic modeling. The linear Wyllie average formula is used to obtain the elastic moduli of the rock matrix and fluid. The Hudson model is used to insert the cracks and then perform the fluid replacement. The procedure includes the following steps (Figure 2).
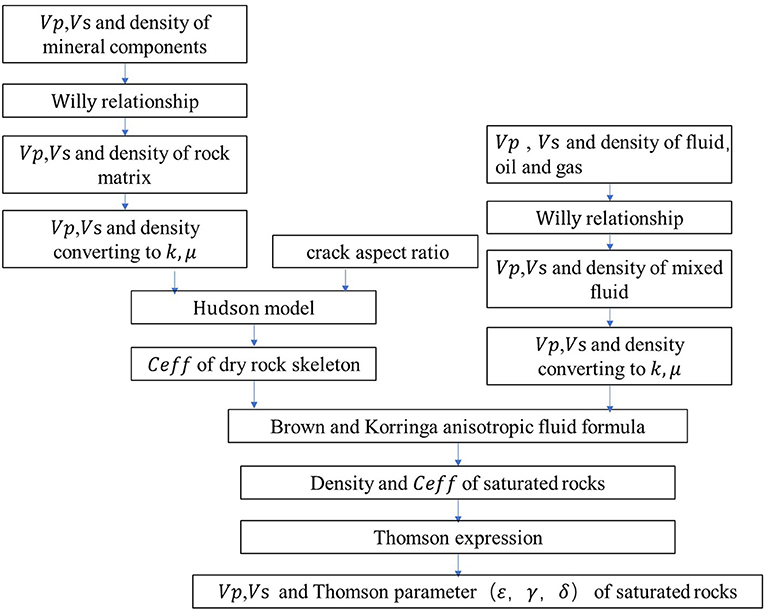
Figure 2. Model building process.
The elastic parameters of the rock matrix are required for the Hudson model. In this work, the velocities of the rock matrix minerals are linearly combined according to their percentages to obtain the matrix background velocity (Hill, 1952; Wyllie et al., 1956):
where Vm is the P-wave velocity (Vp) or S-wave velocity (Vs) of the matrix rock, Cmin_i is the volume fraction of the ith mineral, and Vmin_i is the P-wave or S-wave velocity of the ith mineral.
The Lamé constants (λ and μ) of the matrix can be calculated using Vp and Vs obtained using the above formula and converted into an elastic constant matrix:
where cij is the Voigt expression of the sixth-order matrix of cijkl. Assuming that the rock matrix is an isotropic medium, as discussed in section Rock Skeleton Model, the complete sixth-order expression of the rock matrix (c0) is as follows:
Based on the constant matrix as above in which the matrix lithology or mineral properties can be determined from lab or log data, the Hudson model is used to introduce the effects of cracks into the matrix parameters, which is expressed as:
where is the isotropic background modulus obtained in the previous step, is the first-order fracture influence factor, and is the second-order fracture influence factor that reflects the interaction between fractures. According to the model of Hudson (1980, 1981), we obtain the following.
where
Here, a is the crack aspect ratio.
U1 and U3 represent the functions reflecting the conditions imposed on the crack surface such as dry or fluid-filled (Hudson, 1980, 1981). For a dry rock,
Pores are not filled with fluid in this step.
After the rock skeleton model is built, the Brown–Korringa formula is used to calculate the fluid effect in the rock skeleton as follows (Gassmann, 1951; Brown and Korringa, 1975).
where the superscript m in represents either dry rock or fluid, and the fluid elastic parameters can be calculated by repeating the first step using the linear combination formula.
Thomsen (1986) proposed the following notation for a weakly anisotropic transversely isotropic (TI) medium. His parameters use Vp and Vs propagating along the symmetry axis of the TI medium, in addition to three other constants as follows:
where
According to these parameters, the three-phase velocity can be conveniently approximated as:
In the Moxi area, the sealing caprock is a shale with a thickness of ~150 m. Below this reservoir is a tight dolomite with an approximate thickness of 100 m. A reservoir with various pore types of ~150 m thickness occurs immediately below the tight dolomite, followed by another 150 m of tight reservoir. Three models are therefore designed with four layers: the top layer is a 150-m-thick shale to represent the caprock; the second layer (upper reservoir) is designed as a 100-m-thick tight carbonate rock; the third layer (middle reservoir) is designed to represent the 150-m-thick reservoir; and the bottom or fourth layer is a 150-m-thick tight carbonate. The three models are assigned for the reservoir zone with strong anisotropy for fractured caves, moderate anisotropy for vuggy pores/caves, and weak anisotropy for interparticle pores.
The aspect ratio of the intergranular pores of minerals mainly depends on the mineral petrophysical properties (Pellerin et al., 2015; Henriques et al., 2018; Wang and Zhang, 2019; Falahat and Farrokhnia, 2020). Carbonate rocks dominate the study area with a small amount of siliceous rocks and mudstones. The aspect ratio of the intergranular pores is therefore ~0.8. The intergranular pores tend to be flat under the effect of the overburden pressure, and the aspect ratio is relatively reduced. The interparticle pore aspect ratio of the formation medium is therefore set to 0.7.
Core and imaging log analyses revealed that the target layer mainly developed caves elongated by underground tectonic movement and dissolution. Most of these caves are distributed in layers or along cracks and fractures. The two-dimensional form is an irregular polygon, and the three-dimensional form is a flat ellipsoid and strip. The cave aspect ratio is set to 0.5.
Most of the fracture openings are not wider than 0.3 mm in areas far from the fault (Xu et al., 2019), with fracture lengths on the order of meters. The aspect ratio of the cracks is therefore substantially smaller than that of the pores and caves. The fractures that connect the caves, which can be on the cm-scale, are more elongated than the caves. We estimate an equivalent pore aspect ratio of 0.3 because the fractures may connect several caves.
The background information of the work area is used to obtain reasonable input for the theoretical model of these three models. The Hudson input parameters for the theoretical model are tuned by matching the typical zone average acoustic properties. The lithological parameters of each layer of each model are given in Table 1. The Hudson modeling process is used to obtain the velocity and Thomsen anisotropy parameters of each layer of the three models (Table 1) using the designed model parameters.
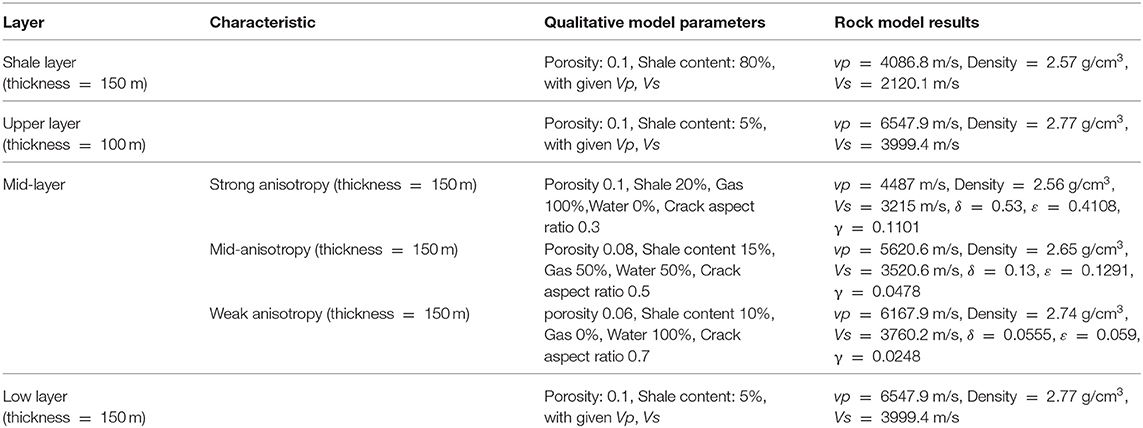
Table 1. Qualitative model parameters.
Table 1 shows that the anisotropic parameters (e.g., δ, ε, γ) follow the designed trend. The models, therefore, represent the three types of pore systems. However, it is quite challenging to understand the anisotropic properties under the geological settings because of the poor azimuthal quality of the seismic data in the study area (Yuan et al., 2020).
The pre-stack angle gathers are forward modeled based on the designed models (Pang and Stovas, 2020; Yuan et al., 2020) and then further stacked to simulate the post-stack data (Zoeppritz and Erdbebenwellen, 1919). Most of the caves and vuggy pores are compressed as oriented coin shapes owing to the deepness of the reservoir. With the Vp, Vs, and Thomsen anisotropy parameters obtained from the rock physics model, the Rüger equation (Rüger, 1997, 1998) is used to obtain the reflection coefficient of each interface at different incident angles (0°-40°).
where θ represents the incident angle, Z = ρVp0 is the vertical compressional wave impedance, and is the vertical shear modulus. The “—” and “Δ” symbols represent the “average of” and “difference between” the upper and lower layer parameters, respectively.
The seismic data have a dominant frequency around 30–40 Hz. A zero-phase wavelet with a 30-Hz frequency is therefore designed for the modeling. The convolution for each angle is applied and the pre-stack angle gathers are then stacked to form a single trace. Figure 3 illustrates the pre-stack angle gathers. Figure 4 shows the full stack traces that have been duplicated five times. The pre-stack gathers show that the strong anisotropic model has strong reflectors on the top and bottom of the reservoir. The mid-anisotropic model shows a strong top reflector, but a relatively weaker bottom reflector. The weak anisotropic model shows the weakest lower reflector. The full stack traces have a similar signature to that of the pre-stack. All of the results show a certain degree of asymmetry between the peak and trough amplitudes, which indicates that these characteristics have the potential to detect pore types but must be verified using local log data.
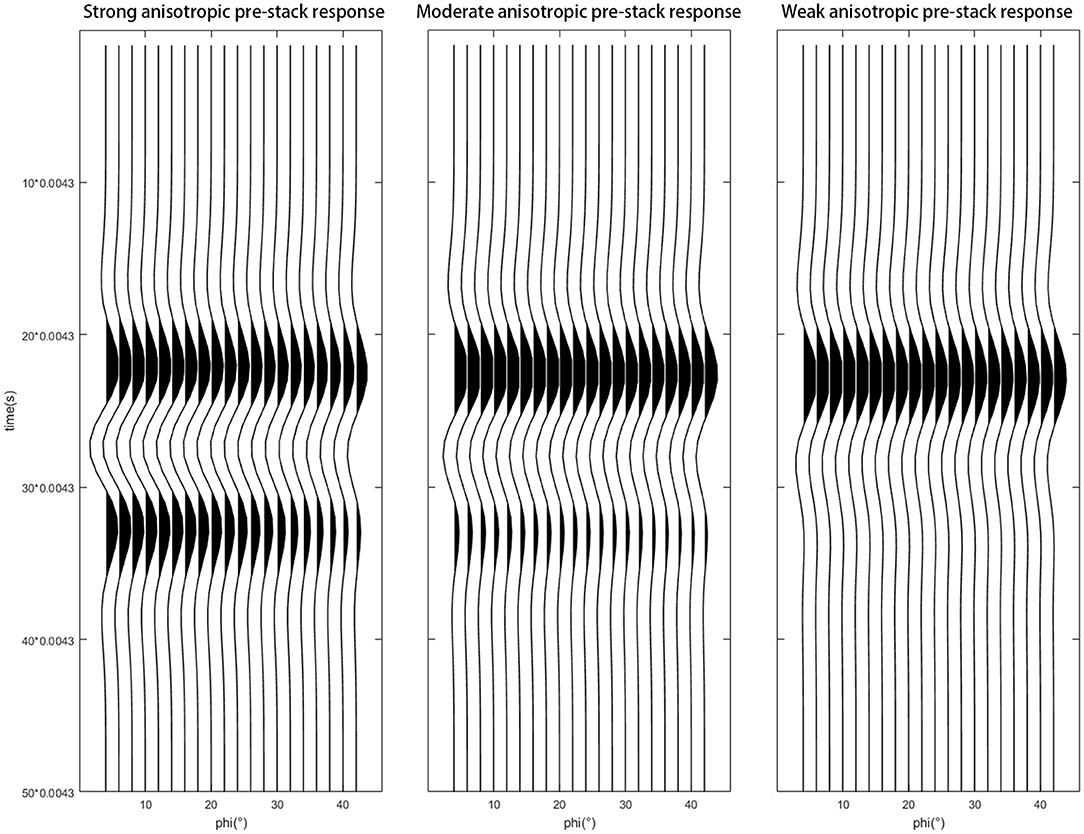
Figure 3. Qualitative model pre-stack response.
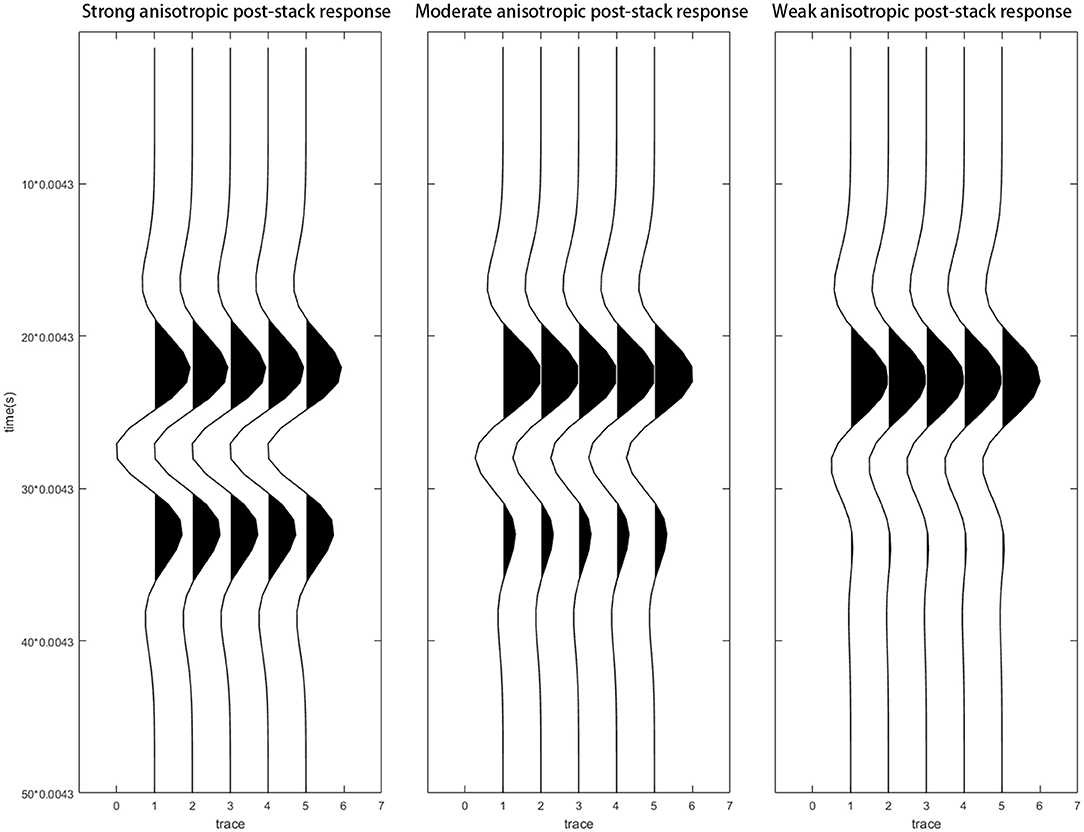
Figure 4. Qualitative model post-stack response.
Data from five wells in the study area are used to verify the observed theoretical model results. The resistivity scan image log is first used to determine the formation pore type (Table 2).
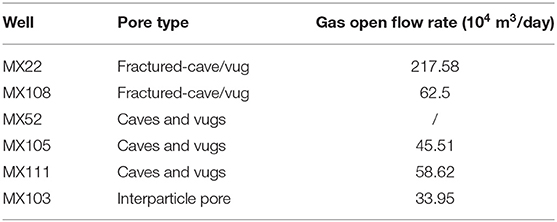
Table 2. Open flow gas rate of wells with different pore structures.
Certain model input parameters, including porosity, shale content, gas saturation, and water saturation, are obtained from the interpretation of the log data, and the others are obtained from the common mineral physical parameters. According to the pore type determined by the resistivity scan image log data, the aspect ratio setting of each confirmed pore type is similar to that of the theoretical model setting.
Figure 5 compares the log (black) and synthetic log (red) results from the Hudson model. The synthetic seismograms are formed based on the log data, using the same process as in the theoretical model.
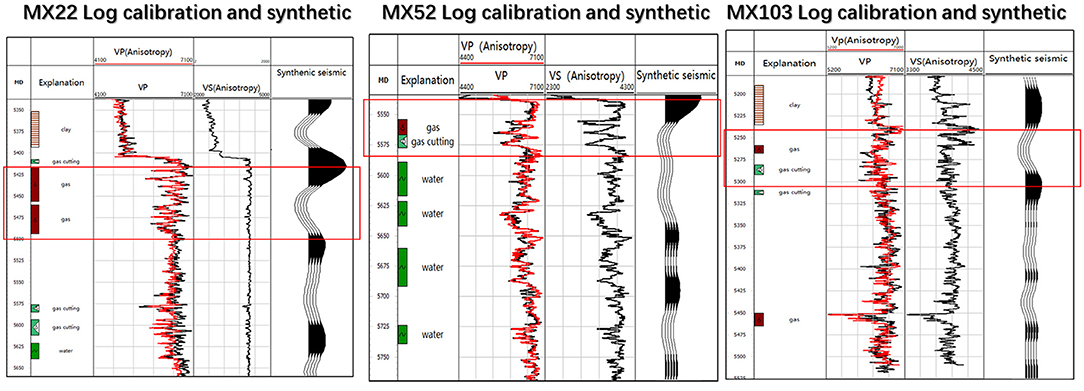
Figure 5. Log calibration and synthetic seismic data.
As shown in Figure 5, the log and geology indicate that the red block zone in well MX22 is dominated by a fractured vuggy pore/cave type structure, the red block zone in well MX52 is dominated by a vuggy or cave type pore structure, and the well MX103 zone marked by a red line is dominated by an interparticle pore type. These findings are also verified from the image logs (Figure 6), and the anisotropic parameters (δ, ε, and γ) also match the logs after tuning the pore type geometry parameters, such as aspect ratio, according to the image log estimation.

Figure 6. Imaging logs.
The synthetic seismic data from the well MX22 log shows a strong peak and trough, consistent with the theoretical model for the fractured vuggy pores/cave zone. The well MX52 log shows relatively strong peaks and troughs for the vuggy pore and cave zones, whereas the well MX103 log has weak reflection energy. A cross-well seismic line with synthetic seismograms in the wells is shown in Figure 7. The synthetic seismic matches well with the observed seismic, which implies that the pore types are detectable from the latter. From the cross-well seismic line, it can be seen that the observed seismic data also show a clear pattern that is visible in the theoretical model and well-synthetic data.
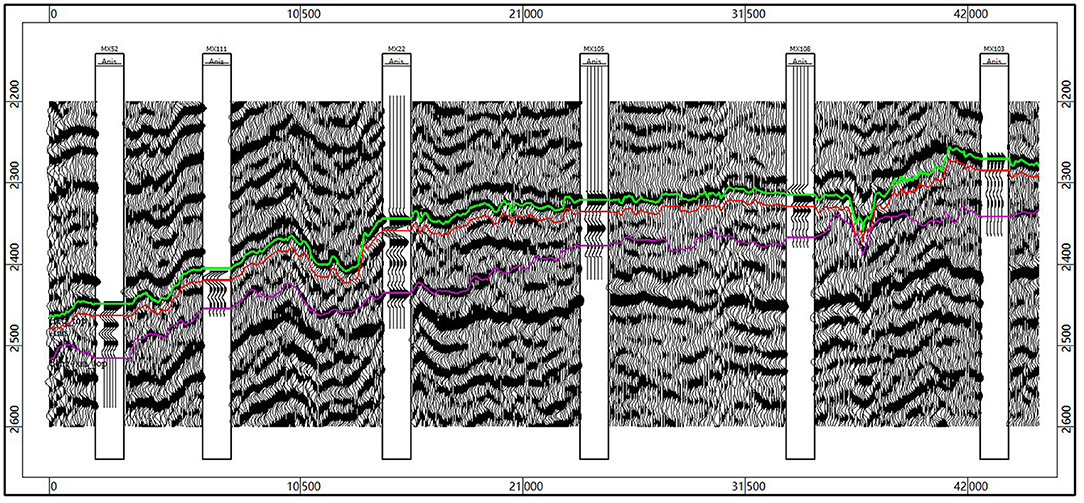
Figure 7. Cross-well seismic section.
The theoretical model and log synthetic modeling highlight the possibility to extract the post-stack seismic signature for pore types, which can be used to semiquantitatively predict gas rates. A promising pore type identification strategy involves the correlation of certain attributes with pore types (Chen et al., 2005). The fractured vuggy pore and cave type pore structure is generally associated with the highest gas rates because the fractures can serve as connective channels to vuggy pores and caves. The vuggy pore/cave type pore structure is associated with moderate gas rates because it has relatively high pore sizes. The interparticle pore type structure can connect adjacent caves, but the connectivity is weaker. The interparticle pore type is normally associated with the lowest productivity because of its low pore space and weak pore connectivity. In the study area, the top horizon is identified from the peak amplitude. To spatially map the productivity, the attributes are extracted from the seismic horizon and correlated with pore type number and open flow gas rate. Twenty-four attributes are extracted from the seismic data using the conventional attribute analysis. Figure 8 shows the correlations between the average absolute amplitude, maximum amplitude, and root mean square (RMS) amplitude with pore type. All other attributes show a similar poor correlation. Traditional attributes are considered to mainly capture values related to the amplitude, phase, and frequency. However, although certain shape information can be obtained, the anisotropic setting and geology are not strictly considered in our case and the traditional attributes cannot be used to differentiate the pore types.
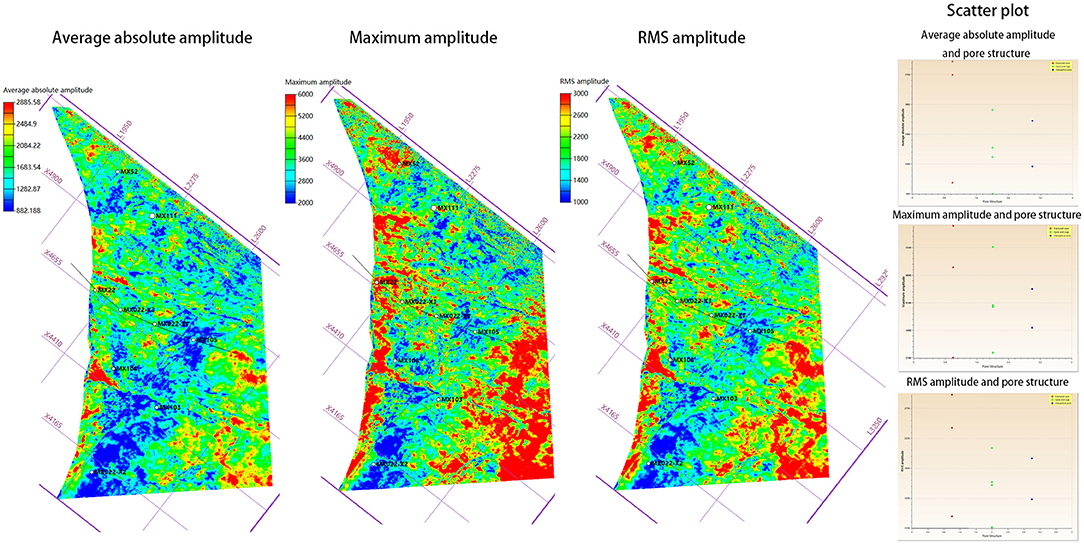
Figure 8. Conventional seismic attribute (average absolute amplitude, RMS amplitude, and maximum amplitude) profiles and their relationship with the pore structures.
To classify the patterns observed in the theoretical and log synthetic models, the top horizon, which reflects the boundary between the caprock shale and carbonate, is moved 15 ms downward and then snapped to the trough minimum. To obtain a single attribute for representing the pore type map, the peak and trough amplitudes are extracted along the top and closest lower horizons, respectively. The procedure for the new attribute is as follows:
(1) Select the amplitude peak as the top horizon and snap to the maximum value (AMPmax).
(2) Move the horizon to the closest trough and snap to the minimum value (AMPmin).
(3) Calculate the asymmetry ratio of the peak and trough:
The attribute defines a certain degree of waveform asymmetry in the major porous zone with different anisotropies as described in the previous sections. As we discussed in “Discussion” section, even if the wavelet phase is changed, the relationship still holds under this geological setting. However, the magnitude is changed. The results indicate that the new attribute can differentiate between pore types by correlating with pore type number and exhibits a good correlation with the open flow gas rate. Figure 9 shows the correlation between the new attribute with the three pore types and with open flow rate.
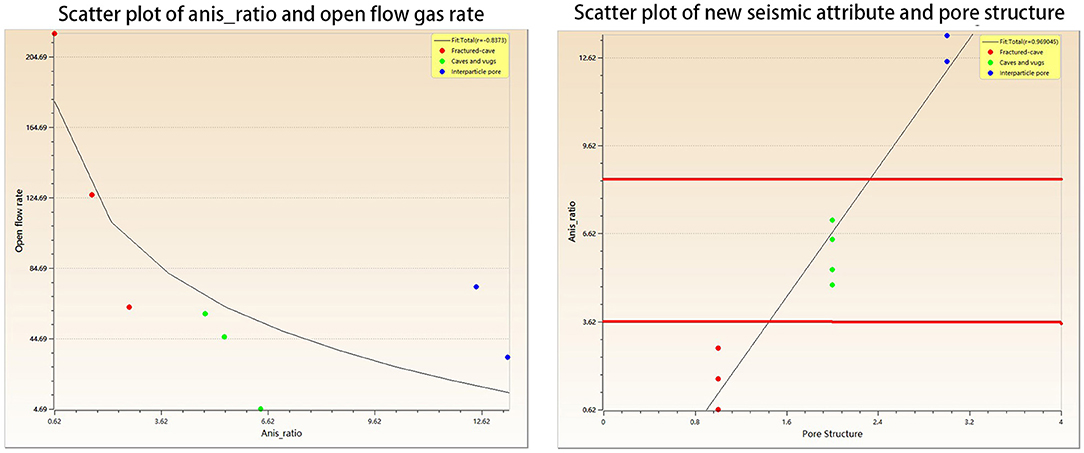
Figure 9. Correlation plot of the anisotropy ratio (anis_ratio) and pore structure and open flow gas rate.
We define this ratio as the “anisotropic attribute,” even though the high value corresponds to low anisotropy (i.e., strong anisotropy corresponds to a low value). The attribute can be mapped along the horizon, as shown in Figure 10. The maps for pore type and gas rate are the same but with different scales because of their linear correlations with the anisotropic attribute. Red or yellow areas in Figure 10 indicate the best zones for fractured vuggy pore/cave type pore structures, which are expected to represent the best gas open flow rates.
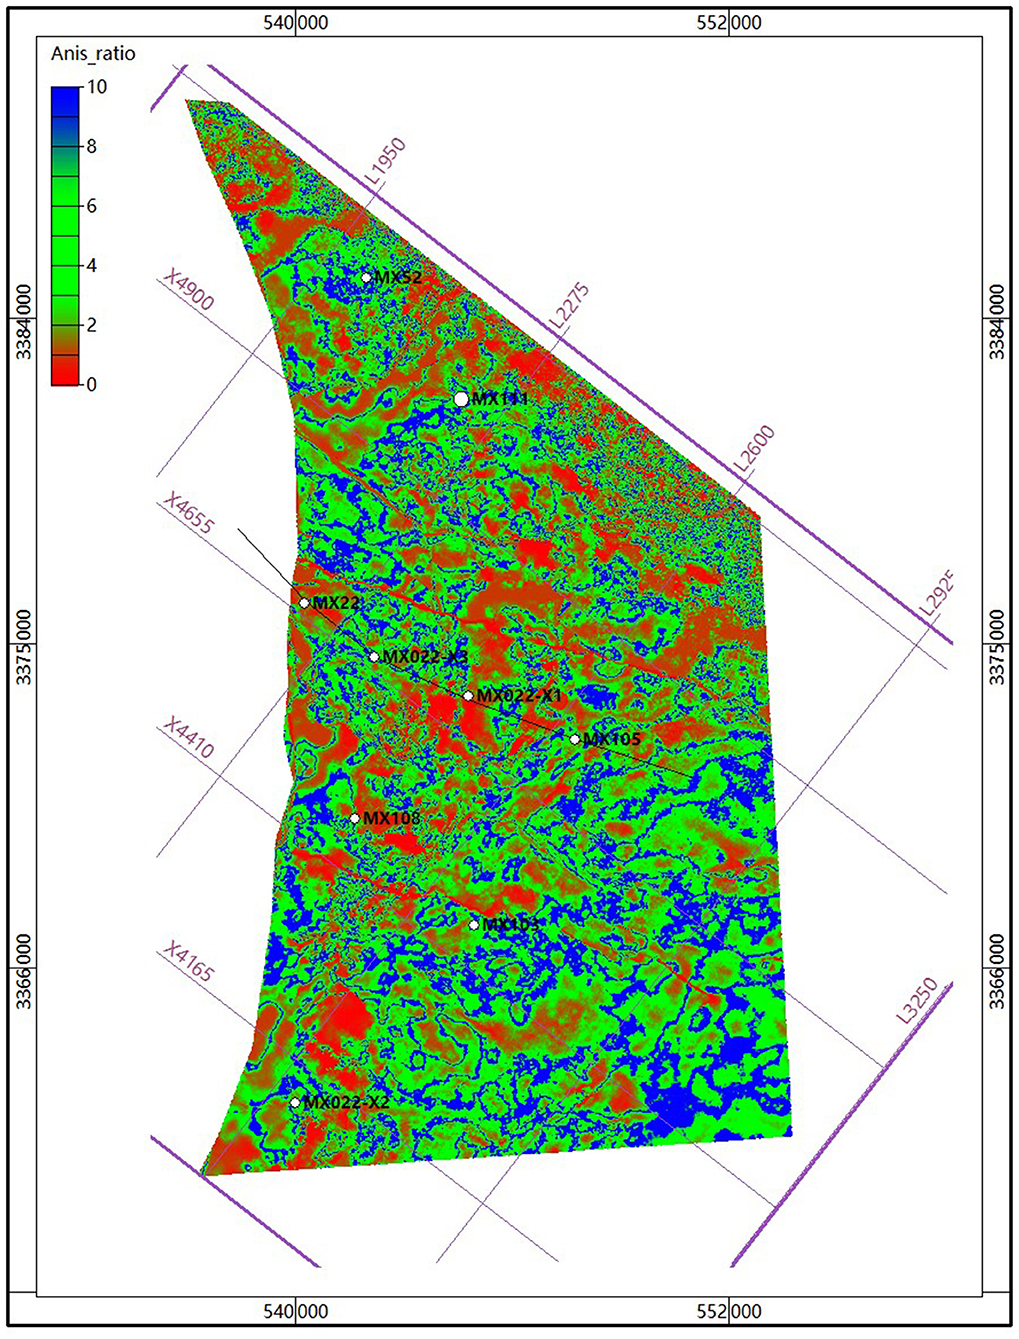
Figure 10. New seismic attribute extracted in the study area.
We developed and tested a theoretical model for guided seismic attribute analysis based on a Precambrian dolomite reservoir and obtained the following conclusions:
(1) The Hudson model can be used to characterize the anisotropic properties of the Precambrian carbonate fractured vuggy pores or caves. However, log calibration is important to obtain more representative model parameters.
(2) The theoretical model and log seismic forward modeling show that under the specific geological setting, the strong anisotropic zone corresponds to a strong peak and trough with lower asymmetry, whereas the weak anisotropic zone has a relatively lower trough with more asymmetry. The phase of wavelet does affect the magnitude of the attribute. Its relationship with pore types is still similar (see Figure 13 and section “Discussion”). Therefore, we recommend to be aware with the wavelet phase if this attribute is applied.
(3) The newly proposed ratio of absolute peak and trough amplitude can be used to better differentiate pore types compared with the conventional attributes. This attribute can also be related to open flow gas rates. The ratio can be used identify the anisotropic properties possibly because the degree of anisotropy leads to different asymmetric wave shapes and amplitude strengths. However, we recommend performing a similar procedure as described here to validate the attribute effectiveness if applying this attribute in similar reservoirs.
The results of anisotropy-guided post-stack attribute analysis indicate an attribute that can be used to differentiate pore types and correlates well with the open flow gas rate. Although the model and log calibration support this application, the mechanism remains poorly understood and requires further discussion.
The amplitude is affected by many factors; thus, this phenomenon must be validated in a range of geological settings. The seismic frequency in this case ranges from 30 to 40 Hz with a central frequency around 37 Hz. The fractured or vuggy reservoir thickness varies from 0 to 150 m. Figure 11 shows that the relationship between this attribute and the three pore types holds for 30 Hz above 60 m and for 37 Hz with thicknesses above 30 m. Furthermore, the top tight carbonate zone thickness also varies from 0 to 150 m. Figure 12 illustrates the relationship between the new attribute and pore type for the tight zone variation. When the wavelet frequency in the tight zone is ~30 Hz, the weak and moderate anisotropies can be reversed below 40 m, which may introduce uncertainties. However, for a wavelet with a frequency of 37 Hz, all of the thicknesses show a similar relationship. The reservoirs in the Moxi area are relatively thick, above 50 m for the porous zone, particularly in the bank inset reef area. Interpretations determined from this approach may, therefore, need to be reevaluated for thin reservoirs. Also, the wavelet phase may not be zero phase. Figure 13 is a comparison of 0, 45, and 90° wavelets (mirror for 180, 135, and 90°). Due to that, we picked the top strong reflector in the interpretation (trough picking for 180° wavelet), and we could see that the relationships between the new attribute and pore types still hold. However, the magnitudes are changed. By rescaling the color bar, the spatial patterns are still the similar. Based on these modeling, we believe that the geological setting is thus a critical aspect of determining whether or not the post-stack signature relationship can be applied to differentiate pore types and gas productivity. Our recommendation is that the procedure detailed herein should be applied to obtain a reasonable interpretation, instead of directly applying this new attribute.
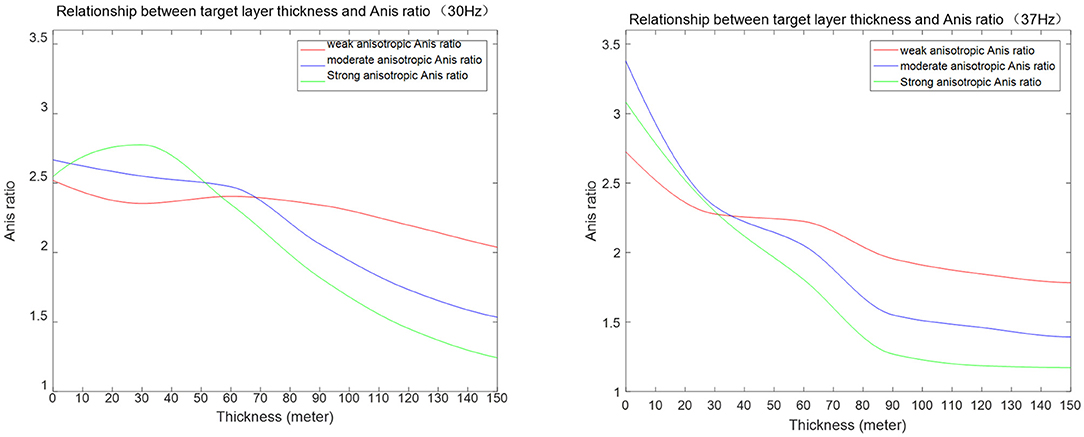
Figure 11. Reflection coefficient of the qualitative model.
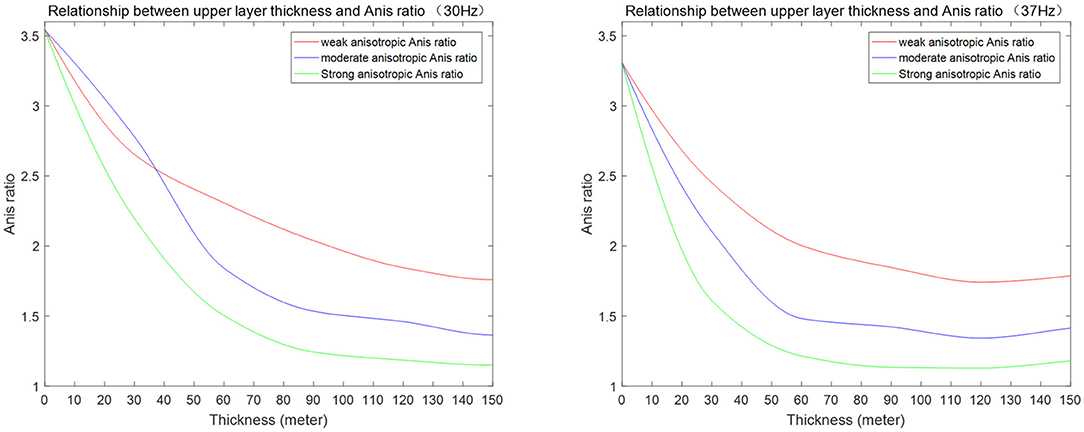
Figure 12. Adjusted model seismic response.
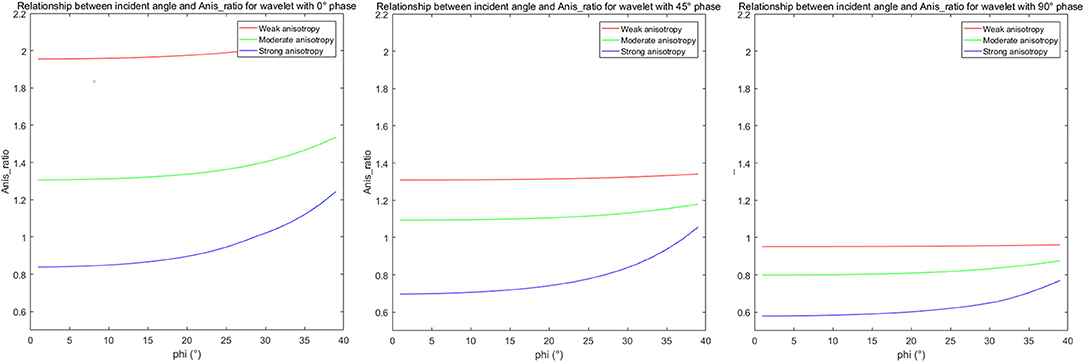
Figure 13. Wavelet phase impact on anis_ratio.
The data analyzed in this study is subject to the following licenses/restrictions: The data were owned by company, but results for publication can be shared. Requests to access these datasets should be directed to eHJodWFuZ0BzdW5yaXNlcHN0LmNvbQ==.
XH designed the procedure and new attribute and wrote the manuscript. YX developed the rock model and reviewed the manuscript. HL performed the log calibration and edited the manuscript. ZZ performed the attribute analysis. WX performed the seismic interpretation. All authors contributed to the article and approved the submitted version.
This research was funded by the China Natural Science Foundation (41874167), China Natural Science Foundation (u20b2016), and the Petro-China Southwest Exploration and Production Research Institute Project.
WX was employed by the company PetroChina.
The remaining authors declare that the research was conducted in the absence of any commercial or financial relationships that could be construed as a potential conflict of interest.
The authors thank the Petro-China Southwest Exploration and Production Research Institute for permission to publish this work and financial support. The authors also thank the China Natural Science Foundation (41874167, u20b2016) for supporting this work. The authors are grateful to all those who supported this work and helped to improve this manuscript, particularly Allyson Gajraj of SunRise PetroSolutions Tech., Inc. They also thank Esther Posner, PhD, from Liwen Bianji, Edanz Editing China (www.liwenbianji.cn/ac), for editing the English text of a draft of this manuscript.
The Supplementary Material for this article can be found online at: https://www.frontiersin.org/articles/10.3389/feart.2021.641705/full#supplementary-material
Abdlmutalib, A., Abdullatif, O., Abdelkarim, A., and Yousif, I. (2019). Factors influencing acoustic properties of carbonate rocks: examples from middle Jurassic carbonates, Central Saudi Arabia. J. African Earth Sci. 150, 767–782. doi: 10.1016/j.jafrearsci.2018.10.005
Brown, R., and Korringa, J. (1975). On the dependence of the elastic properties of a porous rock on the compressibility of the pore fluid. Geophysics 40, 608–616. doi: 10.1190/1.1440551
Chen, Z., Dai, Y., and Lang, Z. (2005). Reservoir permeability model and production characteristics of fractured carbonate reservoir. Petrol. Explor. 3, 101–105.
Falahat, R., and Farrokhnia, F. (2020). Rock physics modelling of the carbonate reservoirs: a log-based algorithm to determine the pore aspect ratio. J. Appl. Geophys. 173. doi: 10.1016/j.jappgeo.2019.103930. [Epub ahead of print].
Gassmann, F. (1951). Elastic waves through a packing of spheres. Geophysics 16, 673–685. doi: 10.1190/1.1437718
Henriques, J. P., de Figueiredo, J. J. S., Santos, L. K., Macedo, D. L., Coutinho, I., da Silva, C. B., et al. (2018). Experimental verification of effective anisotropic crack theories in variable crack aspect ratio medium. Geophys. Prospect. 166, 141–156. doi: 10.1111/1365-2478.12544
Hill, R. (1952). The elastic behavior of crystalline aggregate. Proc. Phys. Soc. London A 65, 349–354. doi: 10.1088/0370-1298/65/5/307
Hudson, J. A. (1980). Overall properties of a cracked solid. Proc. Camb. Philol. Soc. 88, 371–384. doi: 10.1017/S0305004100057674
Hudson, J. A. (1981). Wave speeds and attenuation of elastic waves in material containing cracks. Geophys. J. R. Astronomical Soc. 64, 133–150. doi: 10.1111/j.1365-246X.1981.tb02662.x
Hudson, J. A. (1986). A higher order approximation to the wave propagation constants for a cracked solid. Geophys. J. R. Astronomical Soc. 87, 265–274. doi: 10.1111/j.1365-246X.1986.tb04556.x
Kittridge, M. G. (2015). Investigating the influence of mineralogy and pore shape on the velocity of carbonate rocks: insights from extant global data sets. Interpretation 3, SA15–SA31. doi: 10.1190/INT-2014-0054.1
Li, Y., Wu, F., Liu, D., Peng, Y., Chen, S., Deng, X., et al. (2014). Distribution rule and exploration prospect of the Longwangmiao Fm reservoirs in the Leshan-Longnüsi Paleouplift: Sichuan Basin. Natural Gas Industry 34, 61–66. doi: 10.1016/j.ngib.2014.10.009
Li, Z., Jiang, H., Wang, Z., Wang, T., Lu, W., and Lü, Z. (2014). Control of tectonic movement on hydrocarbon accumulation in the Sinian strata: Sichuan Basin. Natural Gas Industry 34, 23–30.
Liao, Q., Hu, H., Lin, J., Liu, Z., and Mu, X. (2011). Petroleum exploration prospect of the Jurassic tight reservoirs in central Sichuan Basin. Oil Gas Geol. 32, 815–822,838.
Pang, S., and Stovas, A. (2020). Frequency-dependent PP and PS reflection coefficients in fractured media. Geophys. Prospect. 68, 926–940. doi: 10.1111/1365-2478.12880
Payne, S., Wild, P., and Lubbe, R. (2010). “An integrated solution to rock physics modelling in fractured carbonate reservoirs,” SEG Technical Program Expanded Abstracts 2010, (Denver, CO). doi: 10.1190/1.3513596
Pellerin, M., Fournier, F., Leonide, P., Borgomano, J., and Hairabian, A. (2015). “Deciphering pore-type signatures from acoustic data in carbonates: equivalent pore aspect ratio approach,” in 14th International Congress of the Brazilian Geophysical Society & EXPOGEF, (Rio De Janeiro). doi: 10.1190/sbgf2015-167
Peng, D., and Xiao, F. (2017). “An estimation method of hole-vug-fracture parameters and its sensitivity to elastic properties for carbonate reservoirs based on anisotropic rock physics models,” SEG 2017 Workshop: Carbonate Reservoir E&P Workshop, (Chengdu). doi: 10.1190/carbonate2017-28
Rüger, A. (1997). P-wave reflection coefficients for transversely isotropic media with vertical and horizontal axis of symmetry. Geophysics 62, 713–722. doi: 10.1190/1.1444181
Rüger, A. (1998). Variation of P-wave reflectivity with offset and azimuth in anisotropic media. Geophysics 63, 935–947 doi: 10.1190/1.1444405
Sain, R., Chen, G., Payne, A. M., Xu, S., and Sultan, A. A. (2008). “Carbonate rock physics: geophysical and petrophysical pore types of carbonate rocks from an offshore carbonate field,” in 2008 SEG Technical Program Expanded, (Las Vegas, NV) doi: 10.1190/1.3059226
Shiri, S., and Falahat, R. (2020). Rock physics modeling and 4D seismic feasibility study in one of the Iranian carbonate reservoirs. J. Appl. Geophys. 172. doi: 10.1016/j.jappgeo.2019.103855
Shirmohamadi, M., Kadkhodaie, A., Rahimpour-Bonab, H., and Faraji, M. A. (2017). Seismic velocity deviation log: an effective method for evaluating spatial distribution of reservoir pore types. J. Appl. Geophys. 139, 223–238. doi: 10.1016/j.jappgeo.2017.03.001
Simon, S. P., Philip, W, and Rudi, L. (2010). An Integrated Solution to Rock Physics Modelling in Fractured Carbonate Reservoirs. SEG Technical Program Expanded Abstracts 2010.
Wang, H., and Zhang, J. (2019). The effect of various lengths of pores and throats on the formation resistivity factor. J. Appl. Geophys. 162, 35–46. doi: 10.1016/j.jappgeo.2019.01.005
Wyllie, M. R. J., Gregory, A. R., and Gardner, L. W. (1956). Elastic wave velocities in heterogeneous and porous media. Geophysics 21, 41–70. doi: 10.1190/1.1438217
Xu, K., Dai, J., Feng, J., and Ren, Q. (2019). The control effect of faults on fracture distribution in Moxi-Gaoshiti block. J. Southwest Petrol. Univ. 41, 10–22.
Keywords: anisotropy, rock model, gas productivity, pore type, fractures, caves
Citation: Huang X, Xu Y, Li H, Zhang Z and Xu W (2021) Anisotropic Rock Model-Guided Post-Stack Attribute Analysis With Pore Type and Production Data for a Carbonate Gas Reservoir. Front. Earth Sci. 9:641705. doi: 10.3389/feart.2021.641705
Received: 14 December 2020; Accepted: 22 March 2021;
Published: 22 April 2021.
Edited by:
Jing Ba, Hohai University, ChinaReviewed by:
Aldo Vesnaver, National Institute of Oceanography and Applied Geophysics, ItalyCopyright © 2021 Huang, Xu, Li, Zhang and Xu. This is an open-access article distributed under the terms of the Creative Commons Attribution License (CC BY). The use, distribution or reproduction in other forums is permitted, provided the original author(s) and the copyright owner(s) are credited and that the original publication in this journal is cited, in accordance with accepted academic practice. No use, distribution or reproduction is permitted which does not comply with these terms.
*Correspondence: Xuri Huang, eHJodWFuZ0BzdW5yaXNlcHN0LmNvbQ==
Disclaimer: All claims expressed in this article are solely those of the authors and do not necessarily represent those of their affiliated organizations, or those of the publisher, the editors and the reviewers. Any product that may be evaluated in this article or claim that may be made by its manufacturer is not guaranteed or endorsed by the publisher.
Research integrity at Frontiers
Learn more about the work of our research integrity team to safeguard the quality of each article we publish.