 Han Jin
 Cai Liu1
 Zhiqi Guo
- 1College of Geo-Exploration Science and Technology, Jilin University, Changchun, China
- 2CNOOC Research Institute Co., Ltd., Beijing, China
Gas identification using seismic data is challenging for tight gas reservoirs with low porosity and permeability due to the complicated poroelastic behaviors of tight sandstone. In this study, the Chapman theory was used to simulate the dispersion and attenuation caused by the squirt flow of fluids in the complex pore spaces, which are assumed to consist of high aspect-ratio pores (stiff pores) and low aspect-ratio microcracks (soft pores). The rock physics modeling revealed that as the gas saturation varies, P-wave velocity dispersion and attenuation occurs at seismic frequencies, and it tends to move to high frequencies as the gas saturation increases. The velocity dispersion of the tight gas sandstone causes a frequency-dependent contrast in the P-wave impedance between the tight sandstone and the overlying mudstone, which consequently leads to frequency-dependent incidence reflection coefficients across the interface. In the synthetic seismic AVO modeling conducted by integrating the rock physics model and the propagator matrix method, the variations in the amplitudes and phases of the PP reflections can be observed for various gas saturations. The tests of the frequency-dependent AVO inversion of these synthetic data revealed that the magnitude of the inverted P-wave dispersion attribute can be used to indicate gas saturation in tight sandstone reservoirs. The applications of the frequency-dependent AVO inversion to the field pre-stacked seismic data revealed that the obtained P-wave dispersion attribute is positively correlated with the gas production from the pay zone at the well locations. Thus, the methods of the rock physics modeling and the frequency-dependent AVO inversion conducted in this study have good potential for the evaluation of the gas saturation in tight gas sandstone reservoirs.
Introduction
Tight gas sandstone is generally characterized by a strong heterogeneity, low effective porosity, and extremely low permeability. It is challenging to predict the complicated poroelastic behaviors of tight gas sandstone due to the presence of a complex pore and crack system. Correspondingly, the seismic responses from tight gas sandstone are complex because of the dispersion and attenuation caused by the squirt flow of fluids in the complex pore spaces when the seismic waves pass through the tight sandstone. Thus, in order to evaluate the fluid properties of tight sandstone, it is essential to construct valid rock physics models for the investigation of seismic dispersion and attenuation and to develop effective techniques for estimating gas saturation using such poroelastic properties.
For rock physics modeling for a poroelastic medium, Biot (1956a, b) established a macroscopic pore elasticity model in order to consider global fluid-flow in a fluid saturated medium. White (1975) proposed a model that considers the dispersion and attenuation that occurs at the seismic frequencies associated with the patchy saturation of two fluid phases. Dvorkin and Nur (1993) developed the Biot/Squirt (BISQ) model by combining the global Biot flow and the local squirt-flow mechanism. Chapman et al. (2002) and Chapman (2003, 2009) proposed the theory of multiscale fractures for an effective medium containing microscopic pores and cracks and with mesoscopic fractures. Ba et al. (2012) investigated the Biot-Rayleigh theory for modeling tight gas sandstone using a double-pore model. Ba et al. (2016) researched compressional wave dispersion due to rock matrix stiffening by clay squirt flow. Ba et al. (2017) investigated the wave propagating in an anelastic rock with patchy-saturation and fabric heterogeneity.
For the investigation of the seismic responses associated with fluid flow, the frequency-dependent amplitude variation with offset (AVO) method was proposed. Chapman et al. (2005, 2006) analyzed the frequency dependency of the AVO signatures associated with the dispersion and attenuation caused by the presence of fluids. Wilson et al. (2009) and Wilson (2010) extended the conventional AVO approximation to frequency dependency and derived the P-wave dispersion attribute as an indicator for reservoir fluid characterization, in which the spectral decomposition technique was used in the implement of the dispersion attribute inversion. Wu (2010) improved the accuracy of the time-frequency analysis in the inversion in the application of field data. Zhang et al. (2014) extended the AVO Shuey approximation and introduced the concepts of a frequency-dependent intercept and gradient into the AVO inversion. Li (2013) investigated numerical and physical modeling as well as field data for the frequency-dependent AVO in order to enable the quantitative estimation of gas saturation. Wu et al. (2014) also illustrated another field case study of the frequency-dependent AVO by improving the procedure of inversion. Chen et al. (2015) quantitatively calculated the gas saturation based on the dispersion inversion using stacked seismic data. Wang et al. (2019) investigated the problem of reflection and transmission of plane elastic waves at an interface between two double-porosity media.
In this study, we developed a rock physics model for a tight gas sandstone reservoir based on the Chapman theory that considers the squirt flow of fluids in complex pore spaces. Then we used our model to investigate the influence of gas saturation on P-wave velocity dispersion and attenuation. The frequency-dependent AVO modeling and inversion were tested and analyzed for various gas saturations using synthetic data. Finally, the frequency-dependent AVO inversion was applied to field data for a tight gas sandstone reservoir, and the P-wave dispersion attributes were inverted and calibrated in order to determine the gas saturation in the tight sandstone reservoir.
Materials and Methods
Rock Physics Model of Tight Sandstone
For tight gas sandstone reservoirs, their complex pore structures result in complicated elastic properties and seismic responses associated with fluids. Smith et al. (2009) and Ruiz and Cheng (2010) investigated a rock model including soft and stiff pores, which divided the complex pores into stiff pores and soft pores. They studied the influence of the distributions of stiff and soft pores on the elastic properties of tight sandstone. Their results indicated that the dual-porosity model can well predict the elastic behaviors of tight sandstone. However, this model could not describe inelasticity associated with fluids. Chapman (2003) proposed the theory of multiscale pores and fractures and studied the dispersion and attenuation related to the squirt flow of fluids in complex pore spaces in gas sandstone reservoirs. Thus, we used the concept of stiff and soft pores in Chapman’s theory to describe pore structures of tight gas sandstone reservoirs. A schematic diagram of the complex pore spaces consisting of stiff and soft pores is shown in Figure 1.
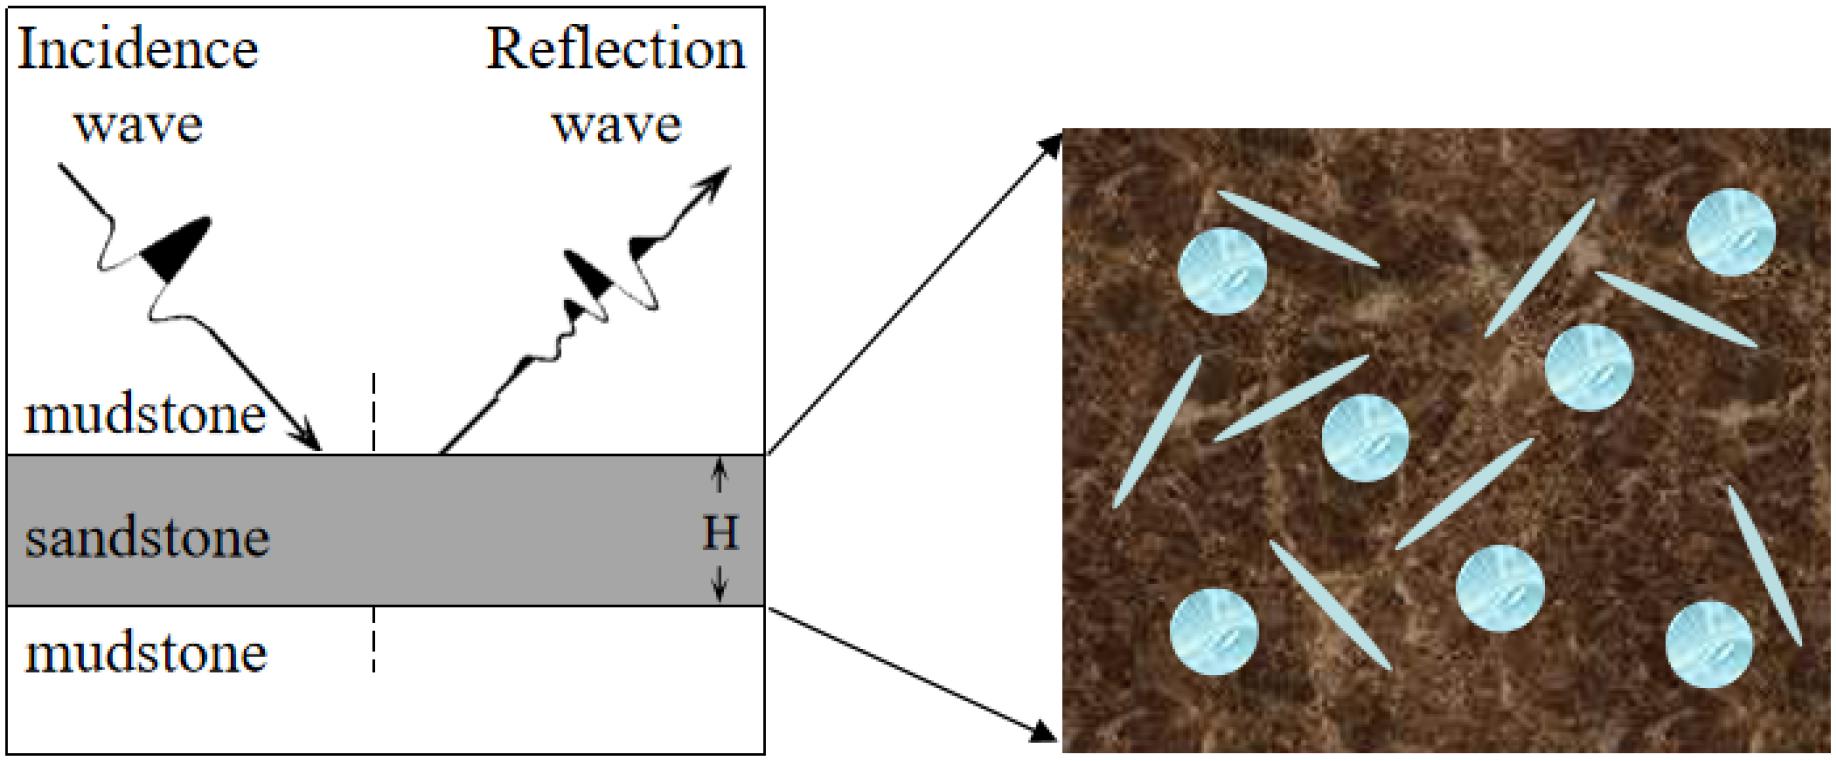
Figure 1. Schematics of the microstructural distributions of stiff and soft pores in tight sandstone.
In Chapman’s theory (Chapman, 2003), the expression for the anisotropic stiffness matrix of an equivalent medium is
where C0ijkl is the stiffness of the isotropic background; C1ijkl, C2ijkl, and C3ijkl are the disturbances caused by the pores, micro-cracks, and fractures, respectively; φp is the porosity; εc is the crack density; and εf is the fracture density.
According to geological understanding of the tight sandstone reservoir in this study area, mesoscale fractures are not developed, and the pore space is dominated by micro pores and cracks. Thus, in Eq. 1, we maintain the terms of the micro pores and cracks, while we drop the term of the mesoscale fractures. So, Eq. 1 becomes
According to Chapman et al. (2002), the relaxation time τ plays an important role in determining the frequency bandwidth of the seismic dispersion and attenuation:
where μ is the shear modulus; and v is the Poisson ratio of the solid matrix. a is the crack radius; r is the aspect ratio; η is the fluid viscosity; ς is the grain size; and k is the permeability.
The frequency-dependent P-wave velocity Vp(ω) and the attenuation factor 1/Q(ω) can be calculated from C3333(ω) in Eq. 2 and the density ρs of the fluid-saturated sandstone. The equations are as follows:
where Re and Im indicate the real part and imaginary part of a complex modulus, respectively.
Physical Parameters of a Mixed Fluid
The viscosity of the mixed fluid in Eq. 1 has an impact on the frequency band of the dispersion and attenuation. For a mixture of water and gas, the viscosity has the following form (Davide and Carcione, 2003):
where ηg is the viscosity of the gas; ηw is the viscosity of water; and Sg is the gas saturation.
Under different gas saturations, the density of the fluid mixture and that of the fluid saturated sandstone are as follows:
where ρf is the density of the fluid mixture; ρg is the density of the gas; ρw is the density of water; ρs is the density of the saturated rock; ρm is the density of the solid matrix; and φ is the porosity.
The bulk module Kf and the velocity Vf of the fluid mixture are calculated using Wood’s equations (Wood, 1995):
In these equations, Kg and Kw are the bulk modulus of gas and water, respectively.
The Method for the Modeling of the Frequency-Dependent AVO
Based on the rock physics model, the propagator matrix theory was used to calculate the seismic responses of the tight sandstone gas reservoir.
The reflection and transmission coefficient vectors r = [RPP, RPS, TPP, TPS] in the case of the P-wave incidence are solved using the following equation (Carcione, 2001):
where the matrices A1 and A2 are the propagation matrices related to the elastic moduli of the upper and lower media, respectively. Bα = T(0)T−1(hα)(α = 1,...,N) is the propagation matrix of the middle layer, which has an N-layer structure. hα is the thickness of each individual layer. ip is the P-wave incident vector related to the elastic properties of the incidence medium.
The reflection coefficient Rpp at each frequency can be calculated using the propagator matrix theory. We use Rf to denote Rpp in the following. By multiplying the frequency reflection coefficient Rf by the spectrum of the seismic wavelet Wf, we can calculate the amplitude spectrum Uf of the reflected wave.
After the inverse Fourier transform of Uf, the reflection waveform Ut in the time domain can be calculated as
where f is the angular frequency; i is the unit of the imaginary number; and t is time.
The Frequency-Dependent AVO Theory
Based on the AVO approximate formula given by Shuey (1985); Chapman et al. (2006) deduced the frequency-dependent AVO formula shown as
where DP represents the derivatives of the seismic wave velocities with frequency; and DG is the frequency-dependent AVO gradient.
Equations 14, 15 form the basis of the frequency-dependent AVO inversion. More details for the implementation of the inversion are displayed in Appendix A.
Modeling and Inversion Using Synthetic Data
Dispersion and Attenuation in Tight Sandstone
Based on the rock physics model discussed above, Figure 2 shows the calculated velocity dispersion and attenuation of a tight gas sandstone reservoir for different gas saturations. The properties used in the rock physics model are presented in Table 1. As can be seen from Figure 2A, the P-wave velocity Vp in the seismic frequency bandwidth decreases as the gas saturation Sg increases from 0 to 0.6 to 1. Moreover, the range of the frequency at which the velocity dispersion occurs moves to a higher frequency. Accordingly, as illustrated in Figure 2B, the attenuation peak also moves to a higher frequency as Sg increases. According to Eqs. 3, 6, Sg affects the viscosity coefficient of the fluid mixture, and thus, it changes the relaxation time parameter τ, which controls the frequency range of the velocity dispersion and attenuation. Therefore, variations in the gas saturation have a significant impact on the dispersion and attenuation of the tight gas sandstone reservoirs.
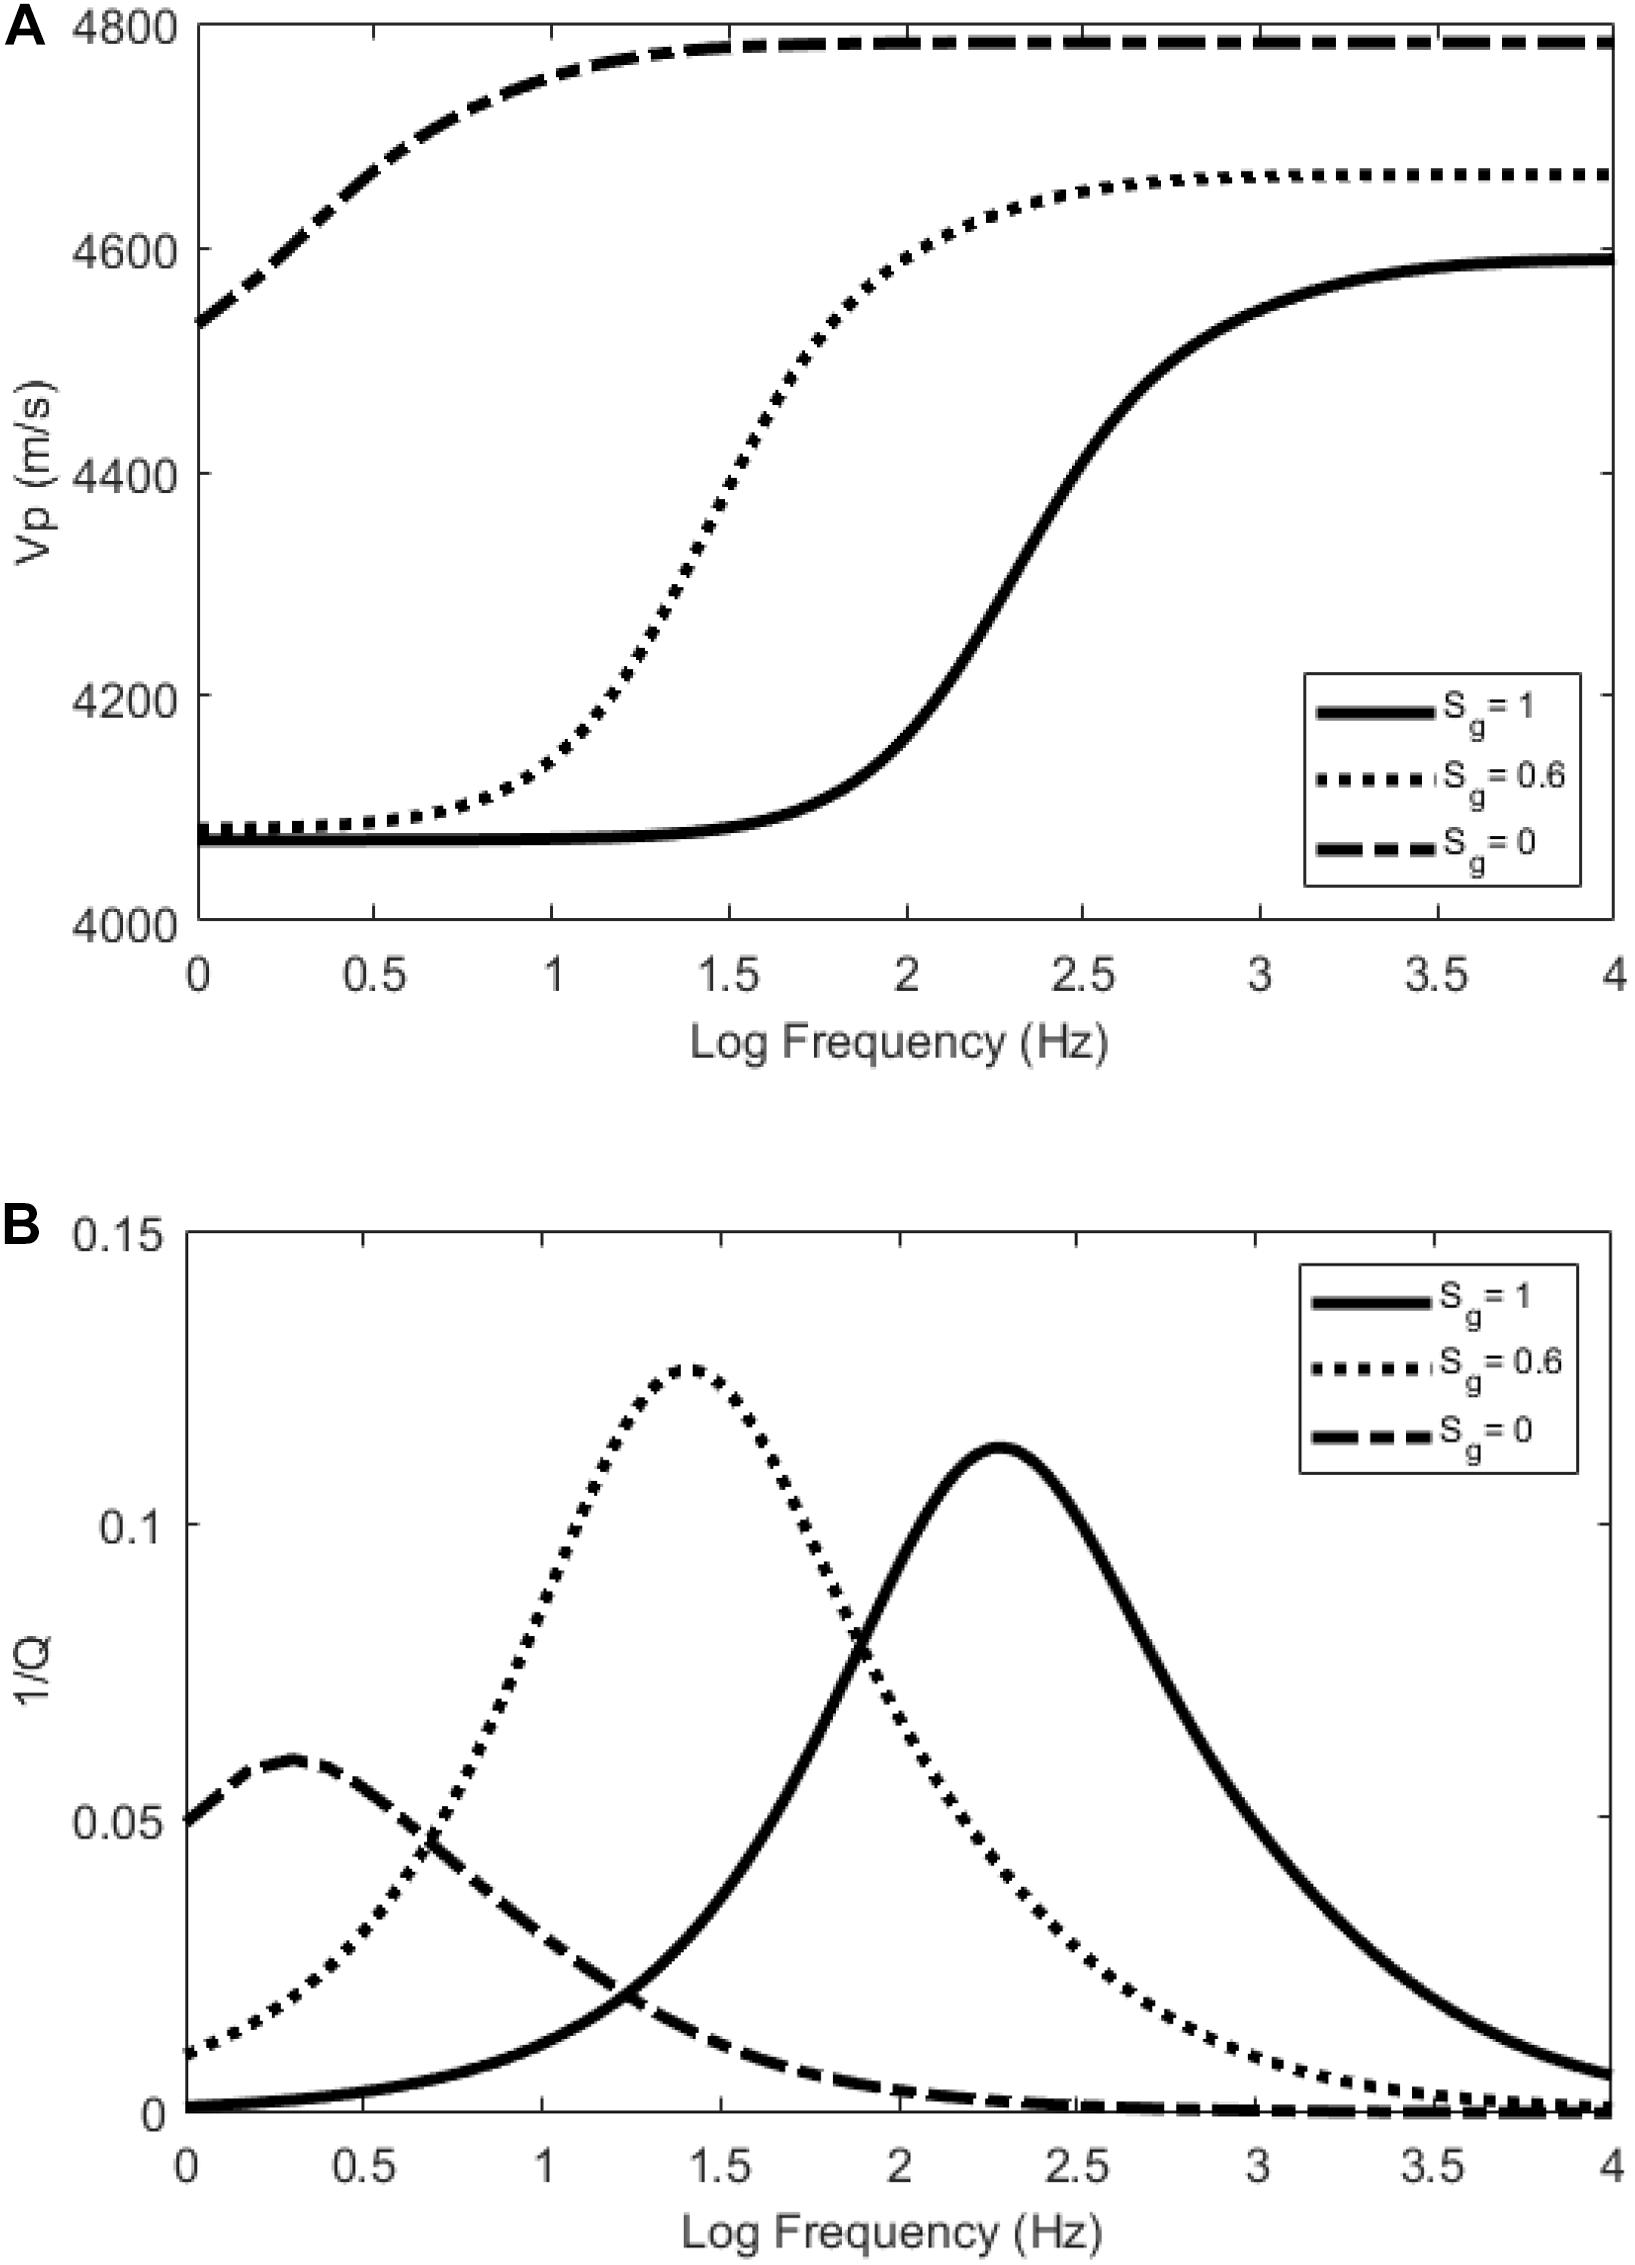
Figure 2. (A) Dispersion of Vp; and (B) attenuation factor 1/Q for various gas saturations Sg.
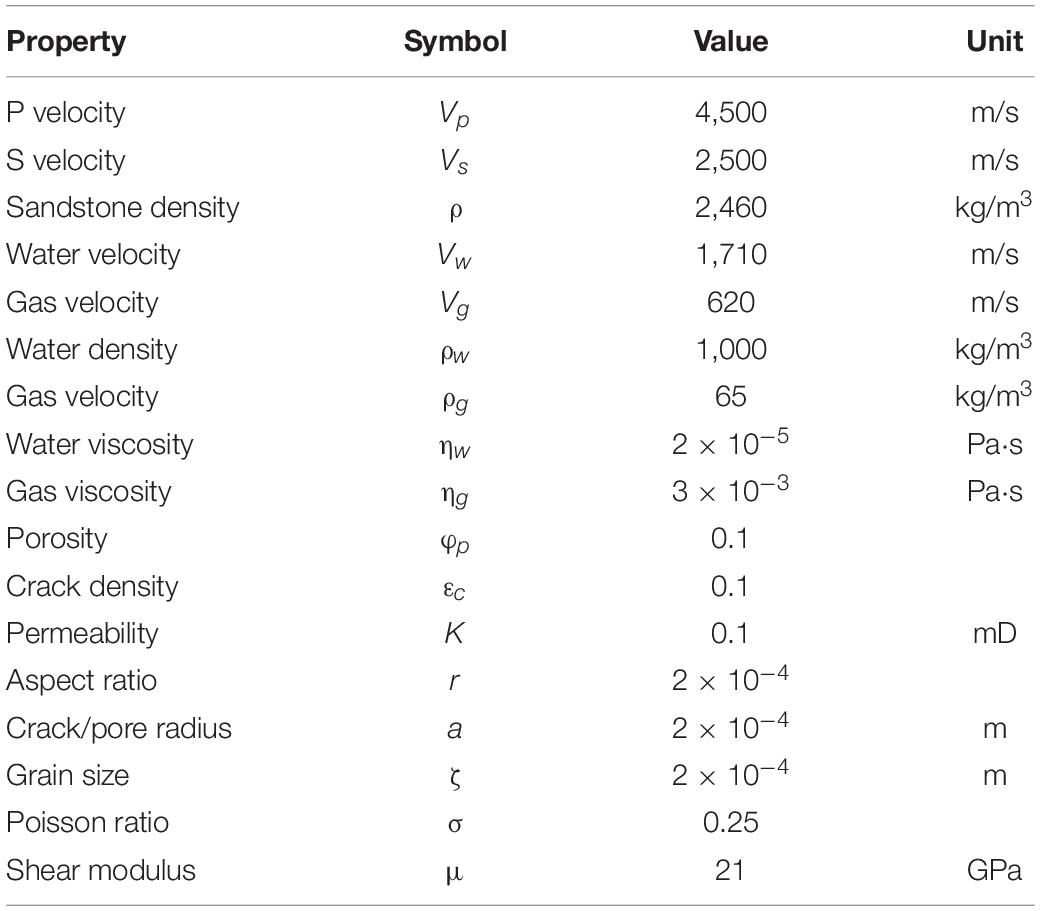
Table 1. Properties of tight gas sandstone.
Seismic Modeling and Dispersion Attribute Inversion in the Theoretical Models
In the theoretical model shown in Figure 1, the velocity dispersion and attenuation of the tight gas sandstone are calculated using results shown in Figure 2. Given a density of 2,460 kg/m3 for tight sandstone, the corresponding P-wave impedance can be calculated for various gas saturations as shown in Figure 3A. Also, we assume that the surrounding mudstone is elastic and has a P-wave velocity of 4,000 m/s, a shear wave velocity of 2,350 m/s, and a density of 2,650 kg/m3. Thus, the frequency-independent P-wave impedance of the mudstone is shown by the gray line in Figure 3A.
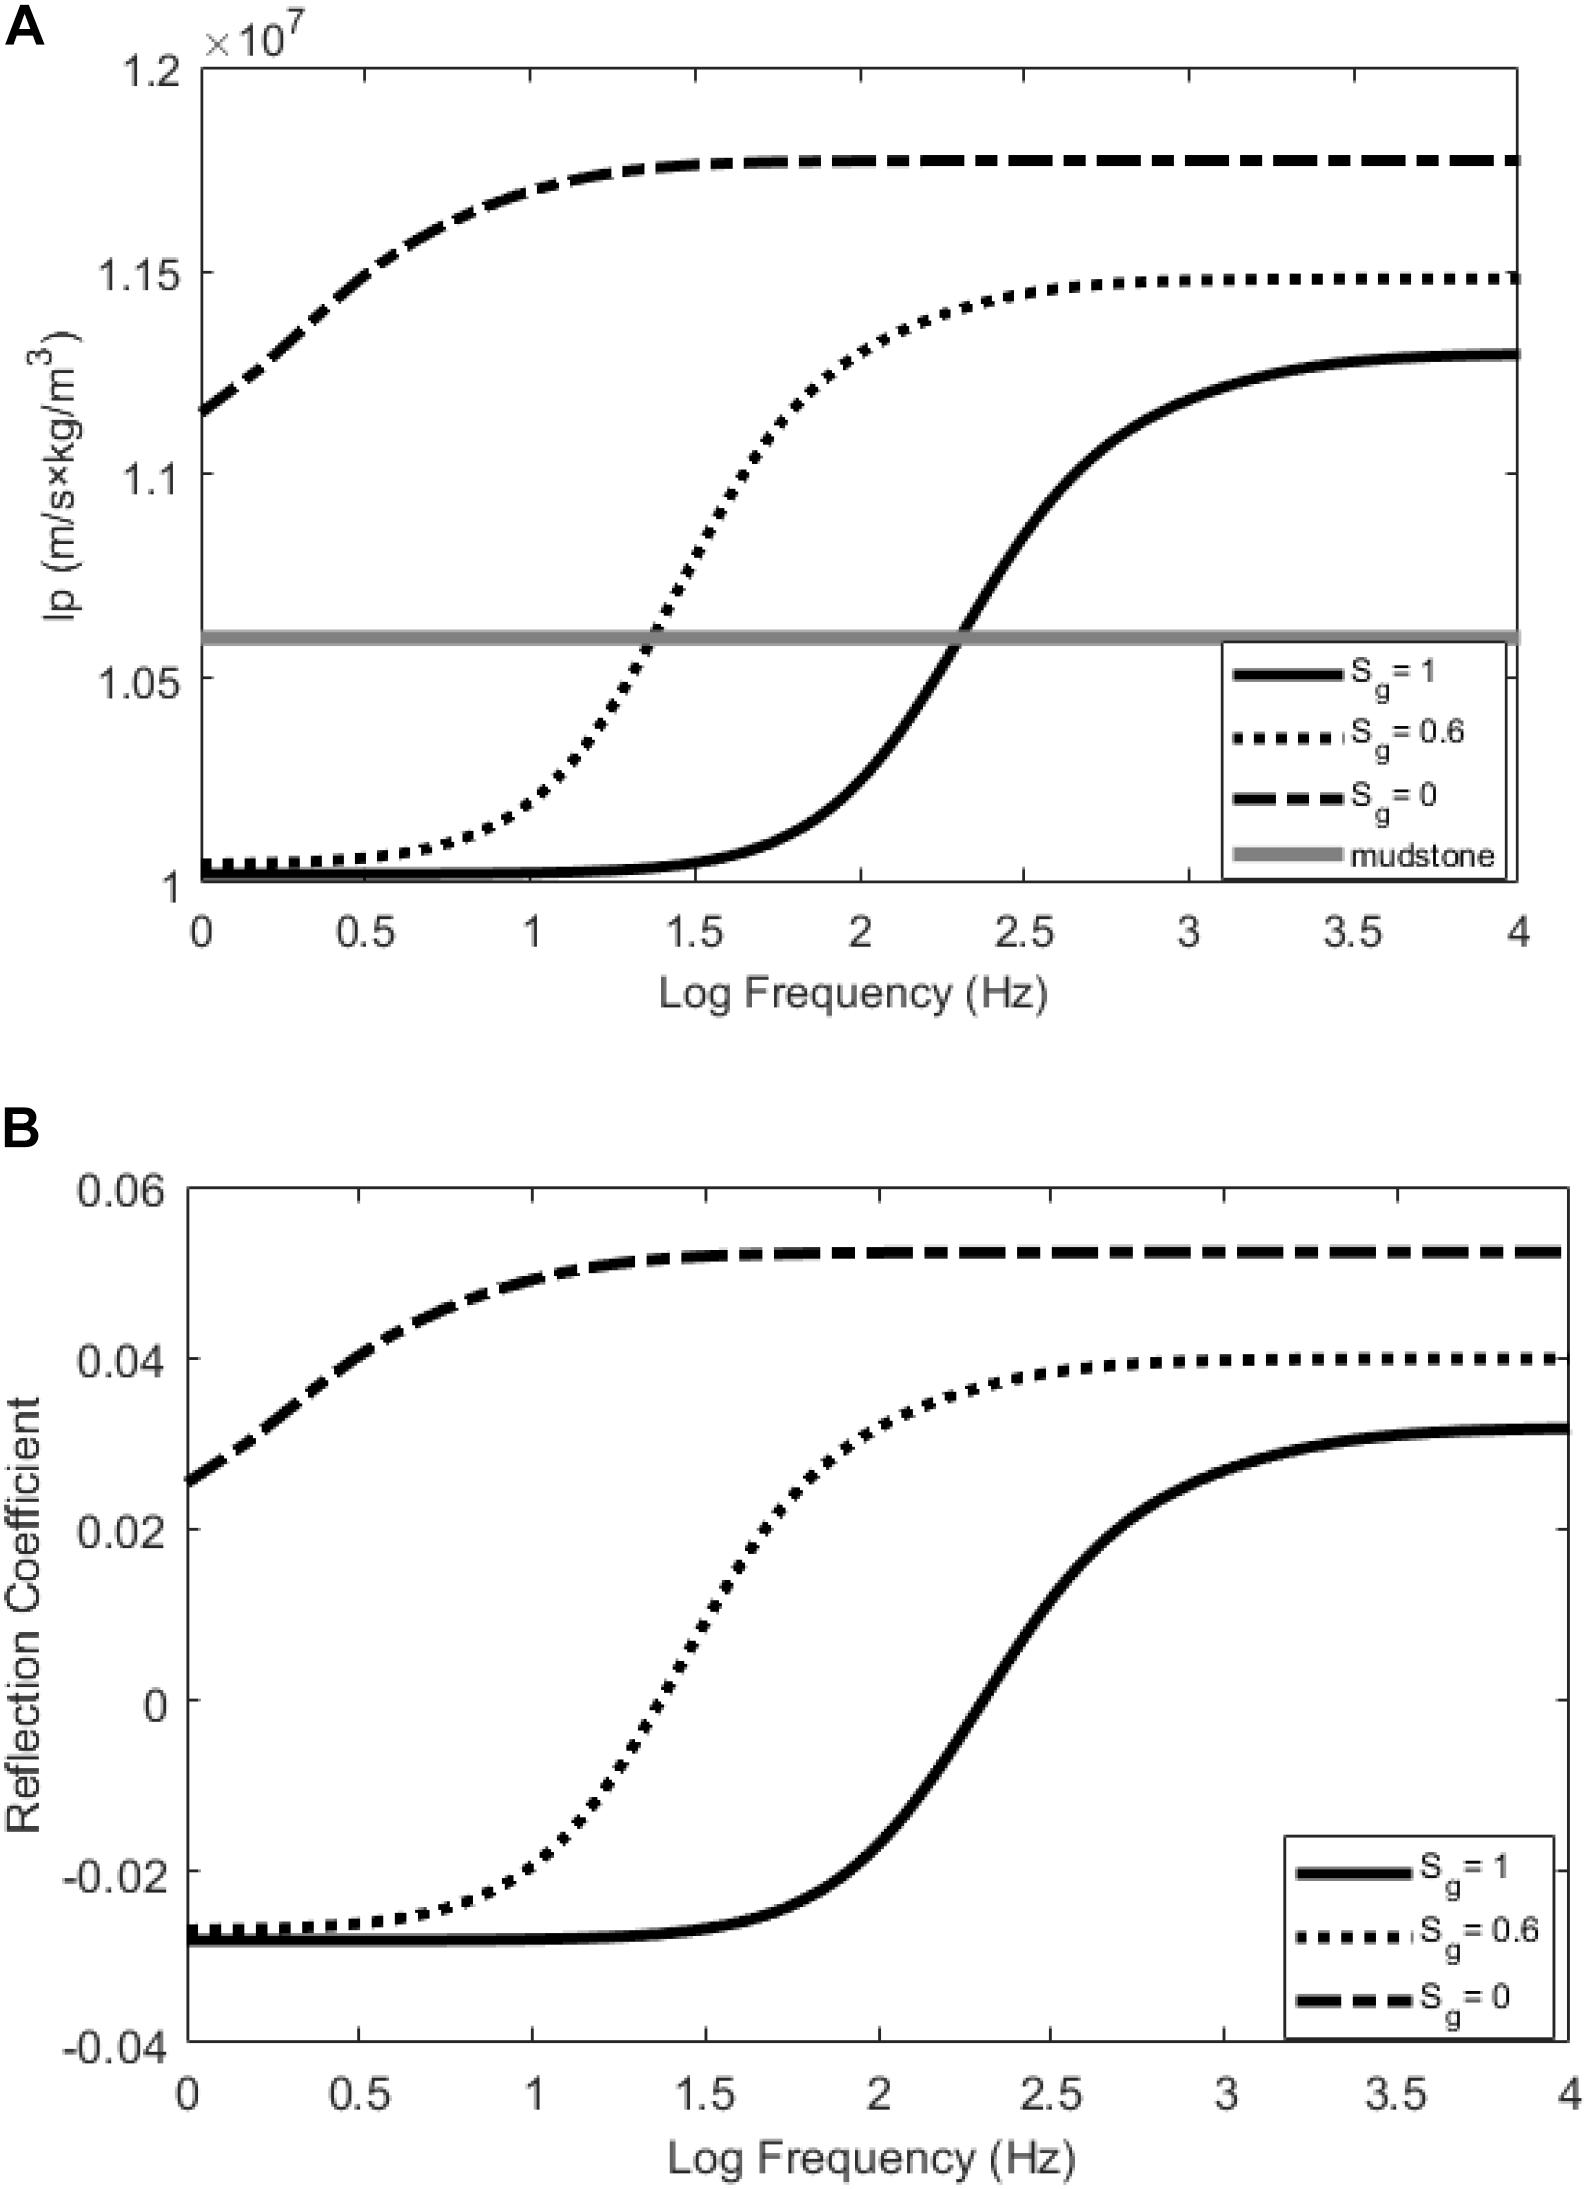
Figure 3. (A) Frequency-dependent P-wave impedance Ip; and (B) frequency-dependent reflection coefficient of the normal incidence at the interface between the mudstone and the tight gas sandstone.
The two intersecting points in Figure 3A show the frequencies where the P-wave impedance Ip of the shale equals that of the tight sandstone with a gas saturation of 0.6 and 1, respectively. Accordingly, Figure 3B shows that normal-incidence reflection coefficients are 0 at the two frequencies, and will change from negative to positive for increasing frequencies across the two frequencies.
In the following, the frequency-dependent seismic responses of the tight sandstone gas reservoir are calculated using the propagator matrix method. We assume that the thickness of the tight sandstone layer is 5 m. Figure 4 shows the absolute values of the complex frequency-dependent PP wave reflection coefficients for gas saturations of 1, 0.6, and 0, with incidence angles ranging from 0° to 40°. For an incident Ricker wavelet of 45 Hz, the amplitude spectra of the reflected PP waves can be obtained by multiplying the spectrum of the incident Ricker wavelet by the frequency-dependent reflection coefficients. The results are shown in Figure 5. Furthermore, the reflected waveforms can be calculated by conducting an inverse Fourier transform of the reflected spectra. The results are shown in Figure 6. For the various gas saturations, there were significant differences in the PP wave frequency-dependent reflection coefficients, the spectrum, and the waveforms.
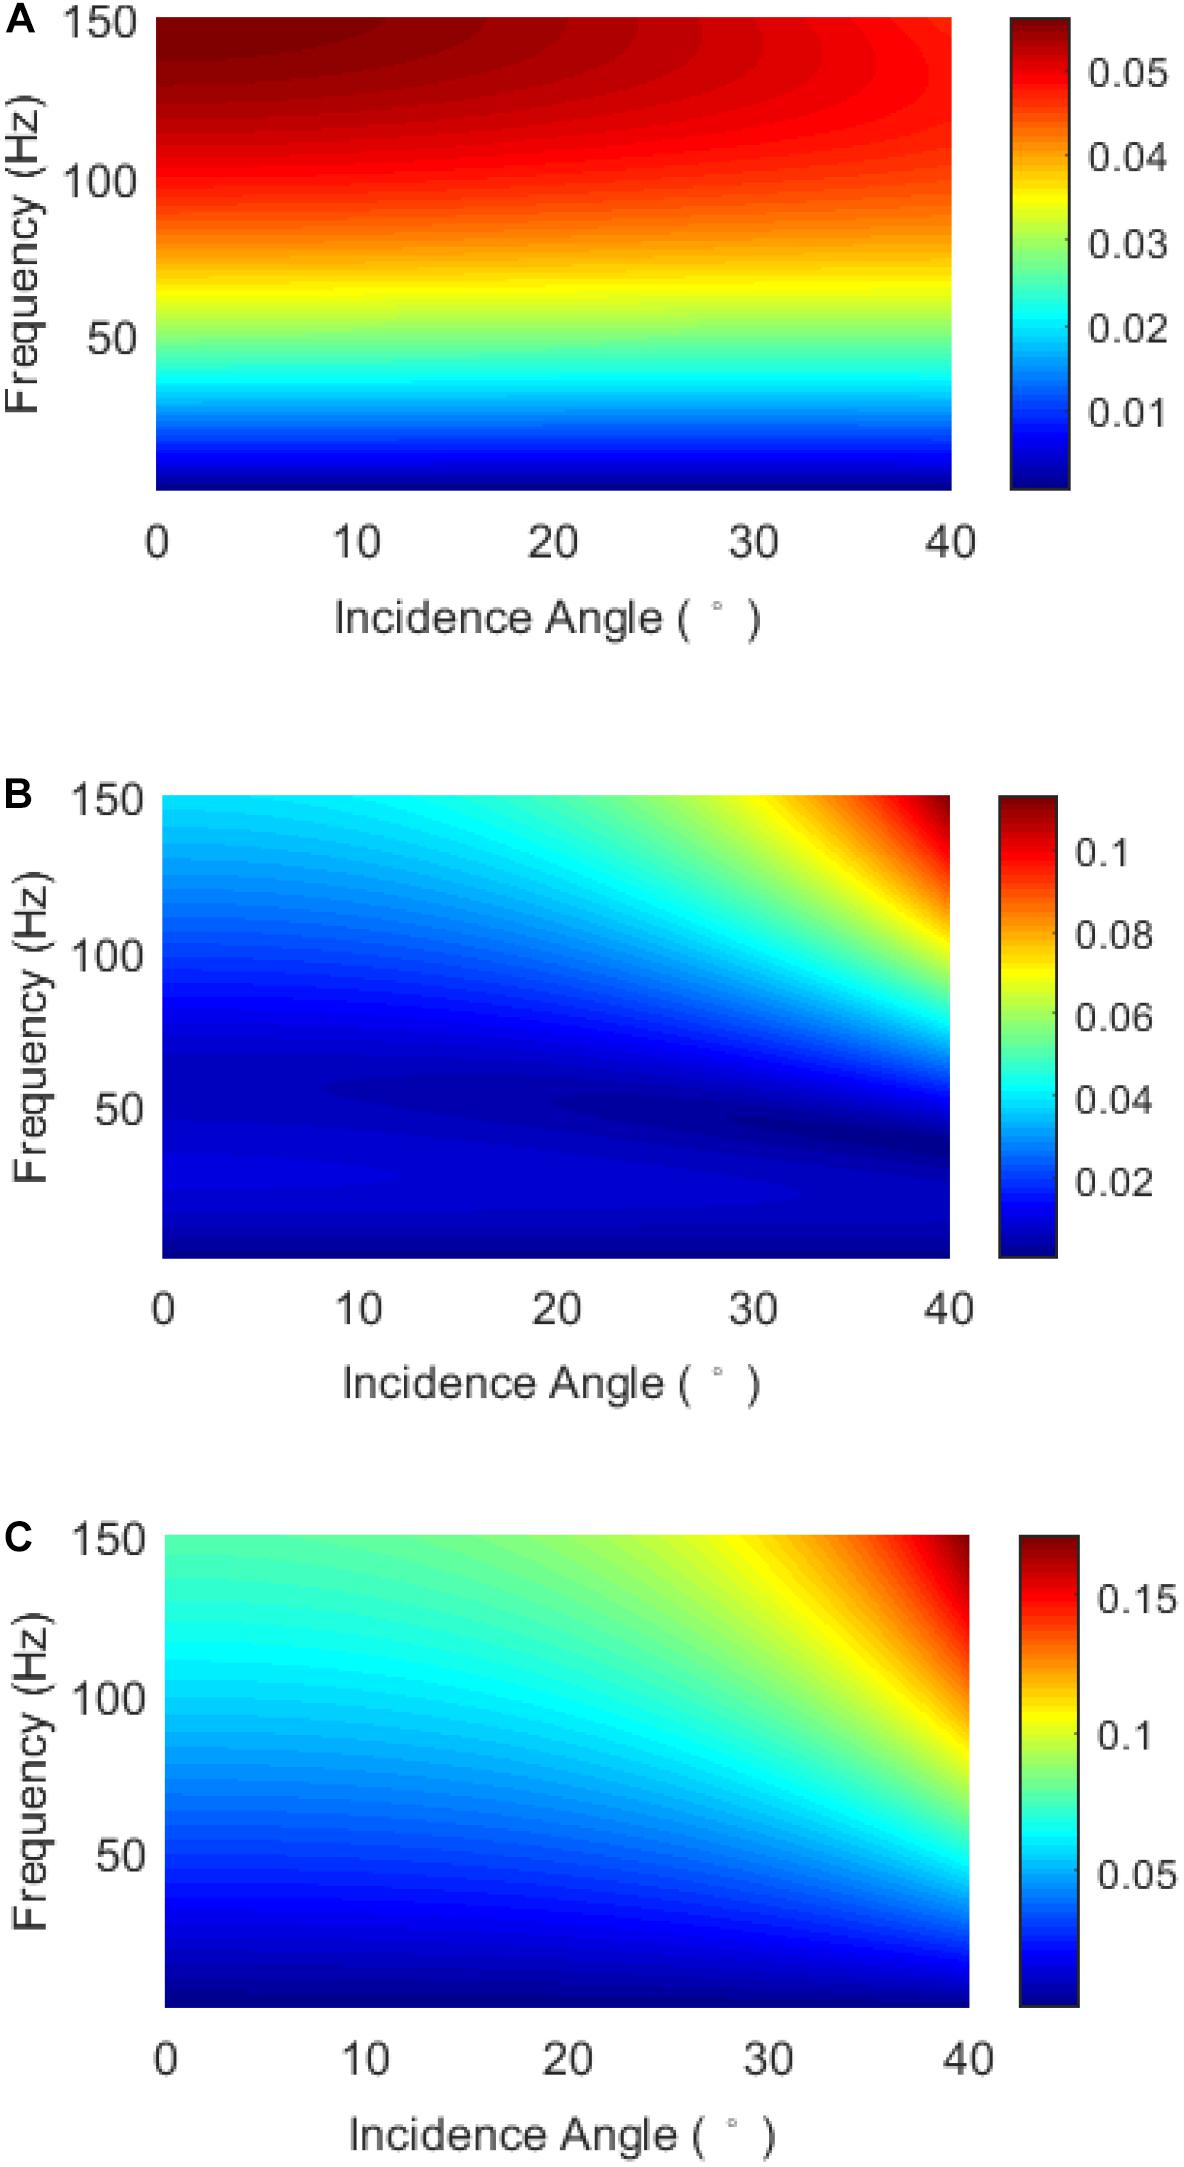
Figure 4. Frequency-dependent reflection coefficients of the PP waves for gas saturations of (A) 1, (B) 0.6, and (C) 0.
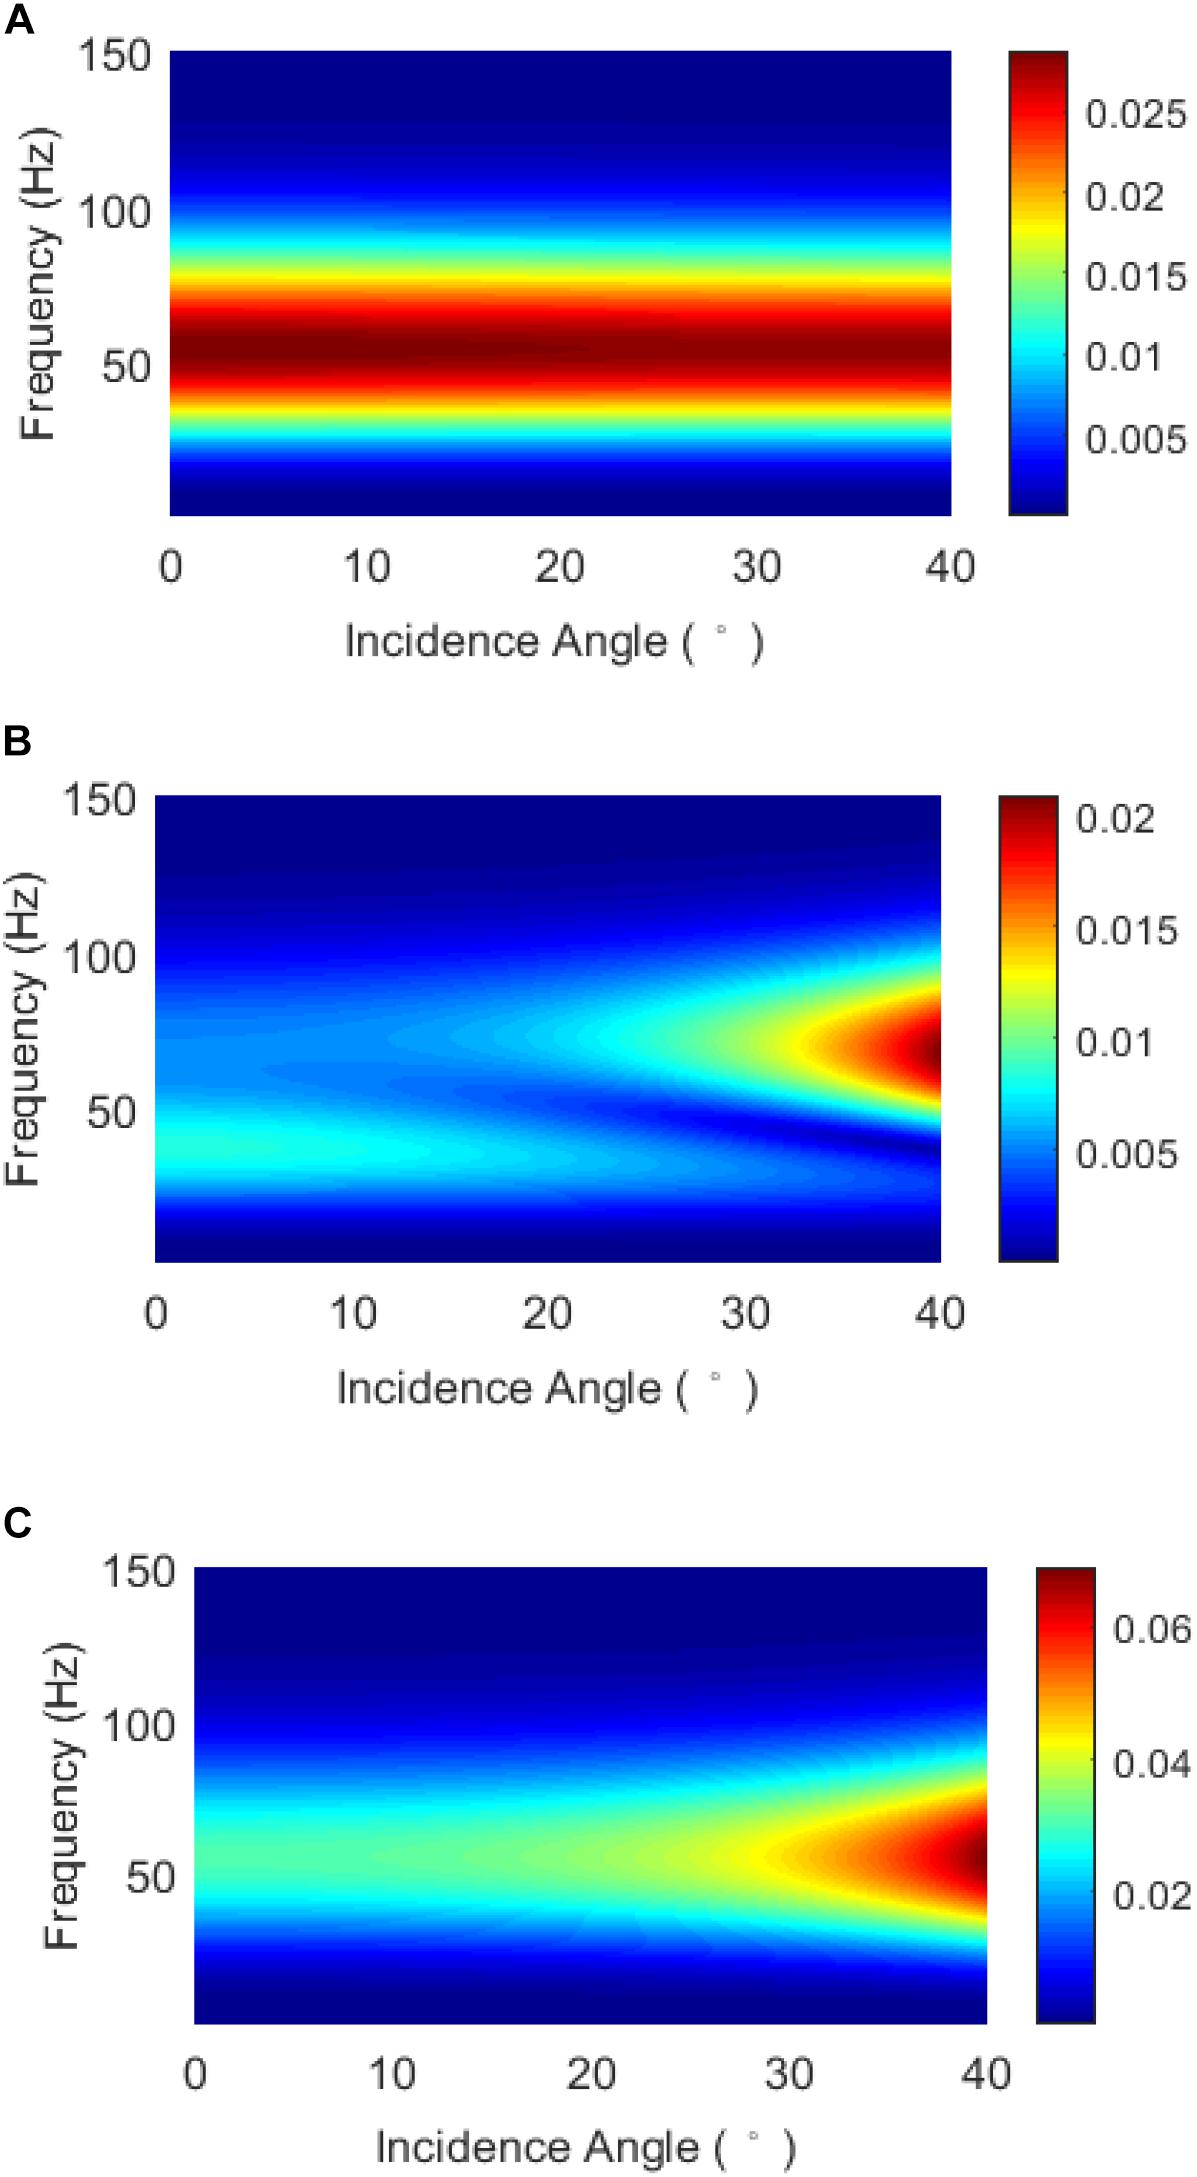
Figure 5. Amplitude spectra of the PP reflection waves for gas saturations of (A) 1, (B) 0.6, and (C) 0.
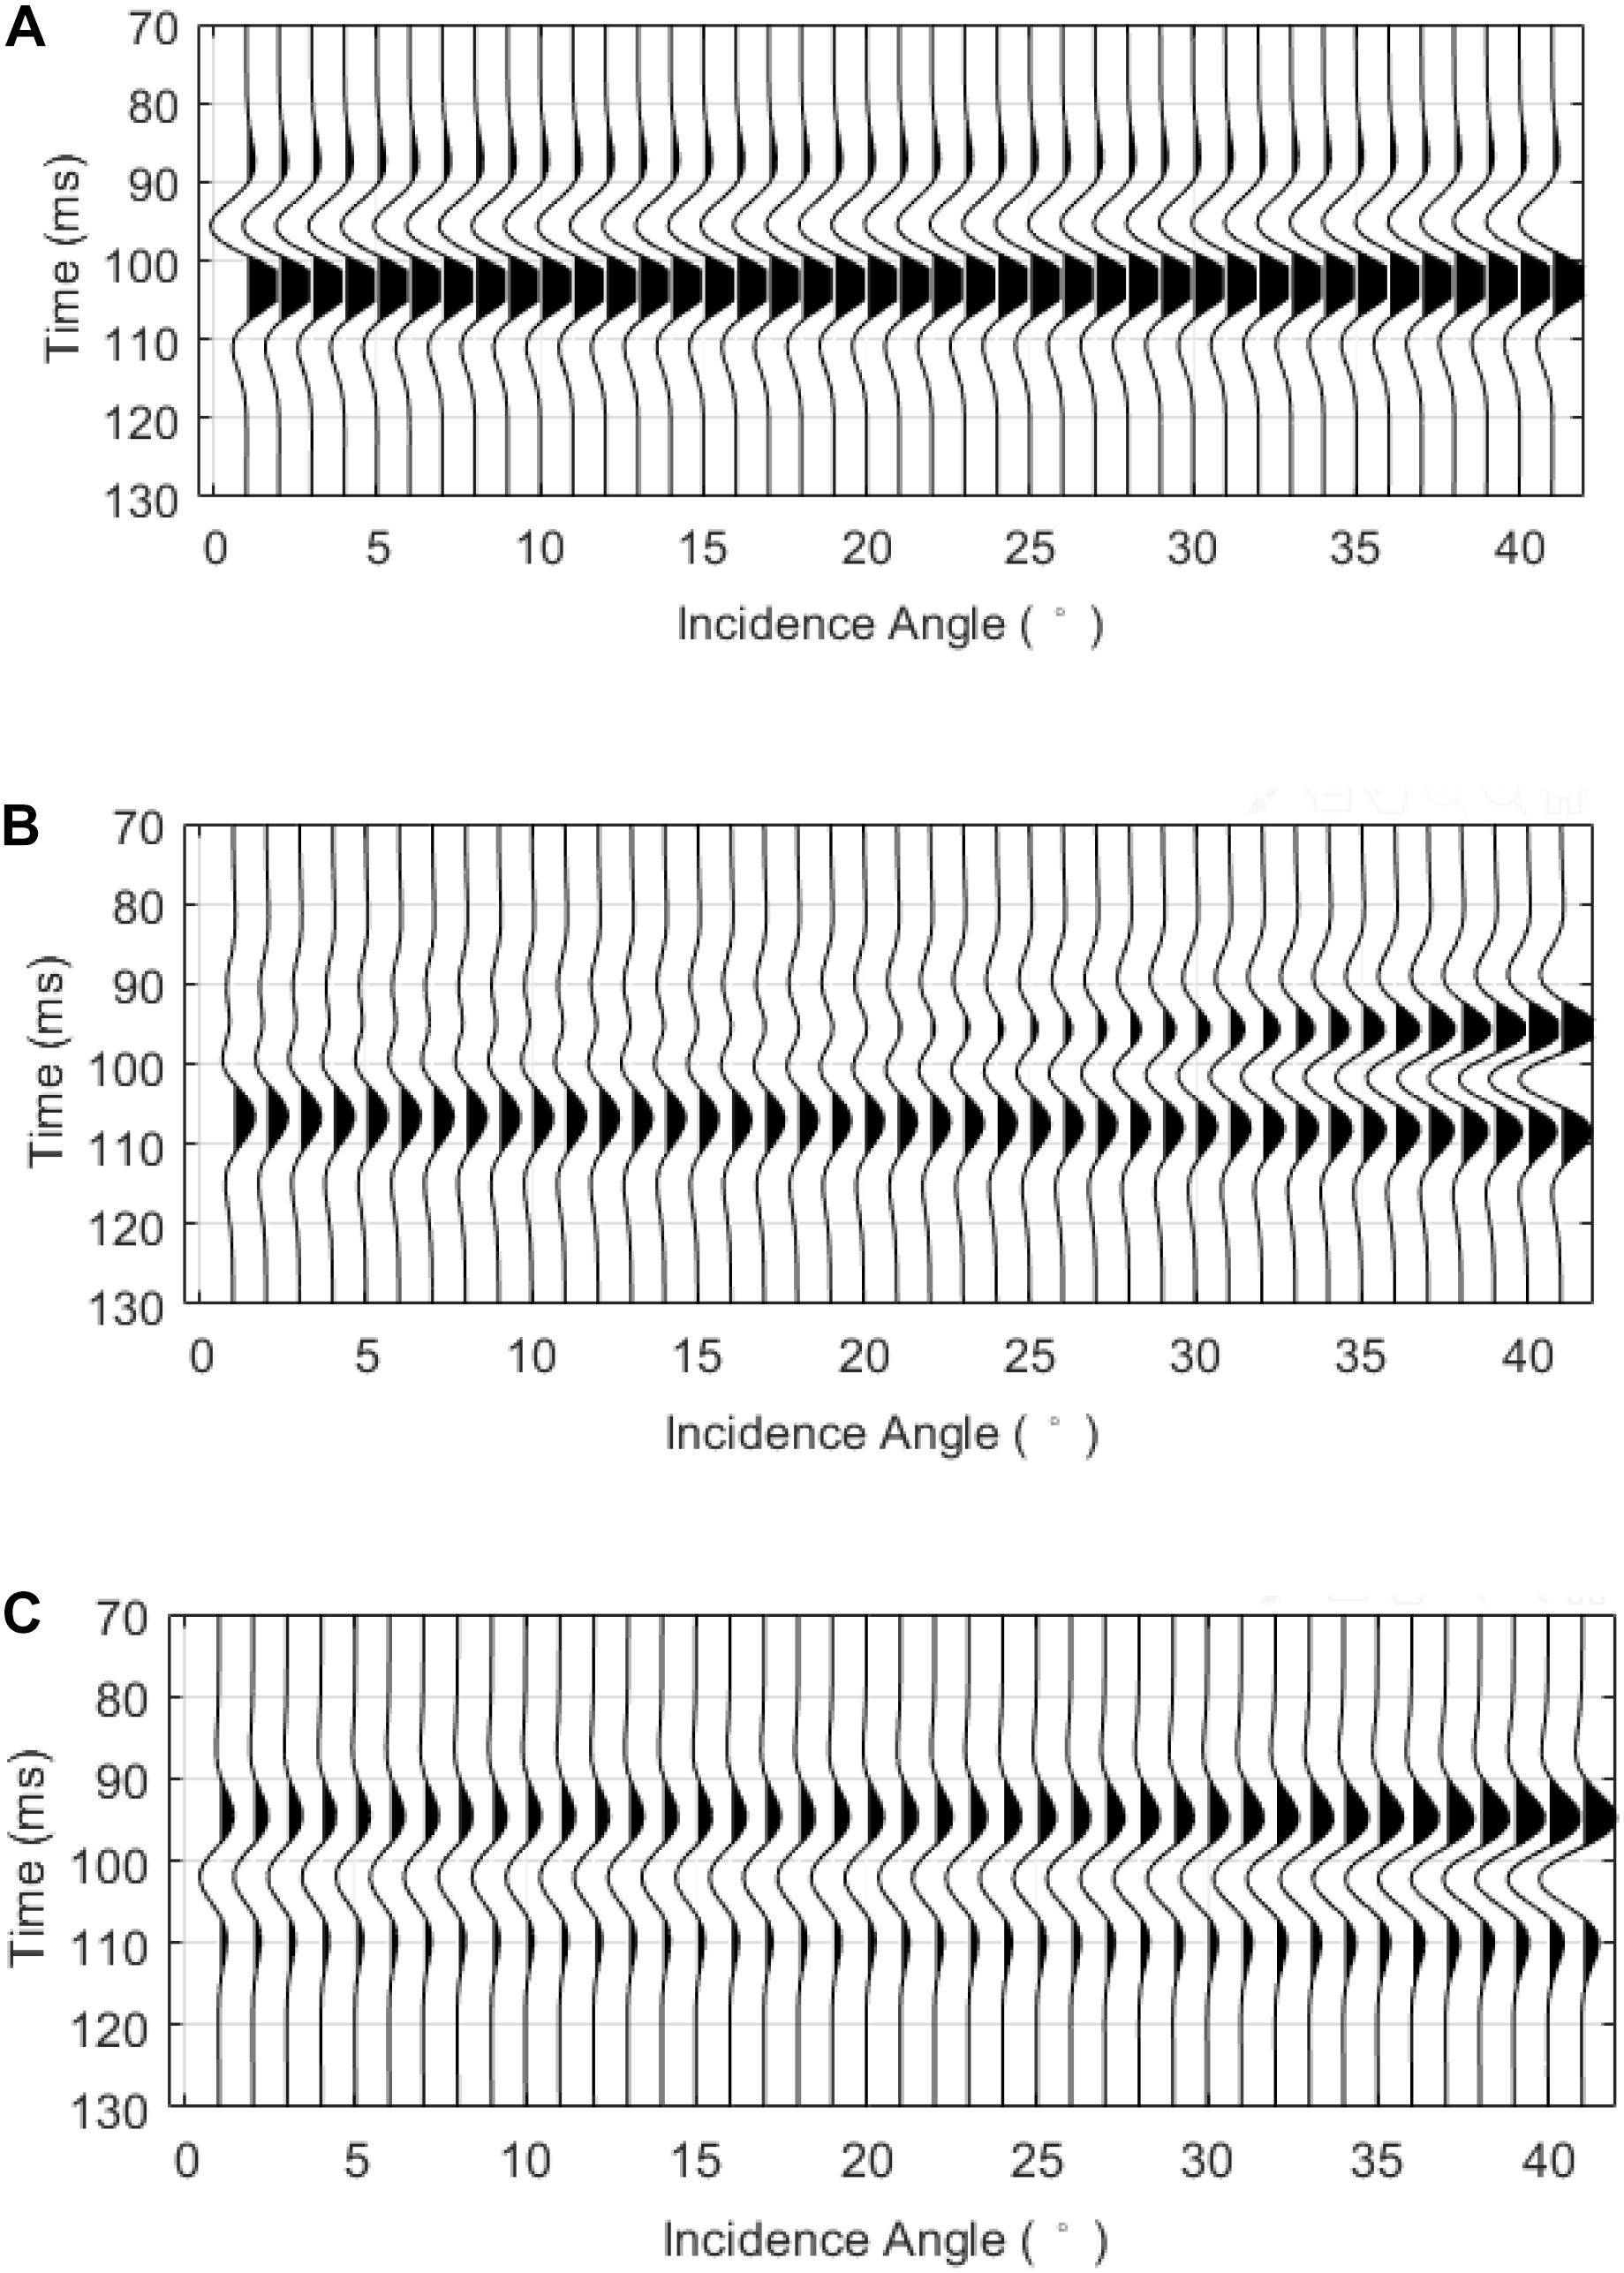
Figure 6. AVO response model for gas saturations of (A) 1, (B) 0.6, and (C) 0.
As can be seen from the AVO waveforms in Figure 6, the phase of the waveform for complete gas saturation is opposite to that for complete water saturation, and the variations in the reflection amplitude with incidence angle are different. When the gas saturation is 0.6, the polarity reversal can be observed as the incidence angle increases.
Figure 7A shows the stacked seismic responses for various gas saturations obtained from AVO gathers in Figure 6. Figures 7B–D show the frequency spectrum of the AVO reflections corresponding to gas saturations of 1, 0.6, and 0, respectively. Figure 7E shows the P-wave dispersion attribute DP calculated using the frequency-dependent AVO inversion method. As can be seen, the case of high gas saturation corresponds to the value of the high DP attribute. Due to the change in reflection phase for the case of the gas saturation of 0.6, there is a time shift for the inverted DP attribute compared to the cases of complete gas saturation and complete water saturation. Thus, the calculation results using synthetic data of the theoretical model verify the feasibility of identifying gas-bearing tight sandstone reservoirs using the P-wave velocity dispersion attribute.
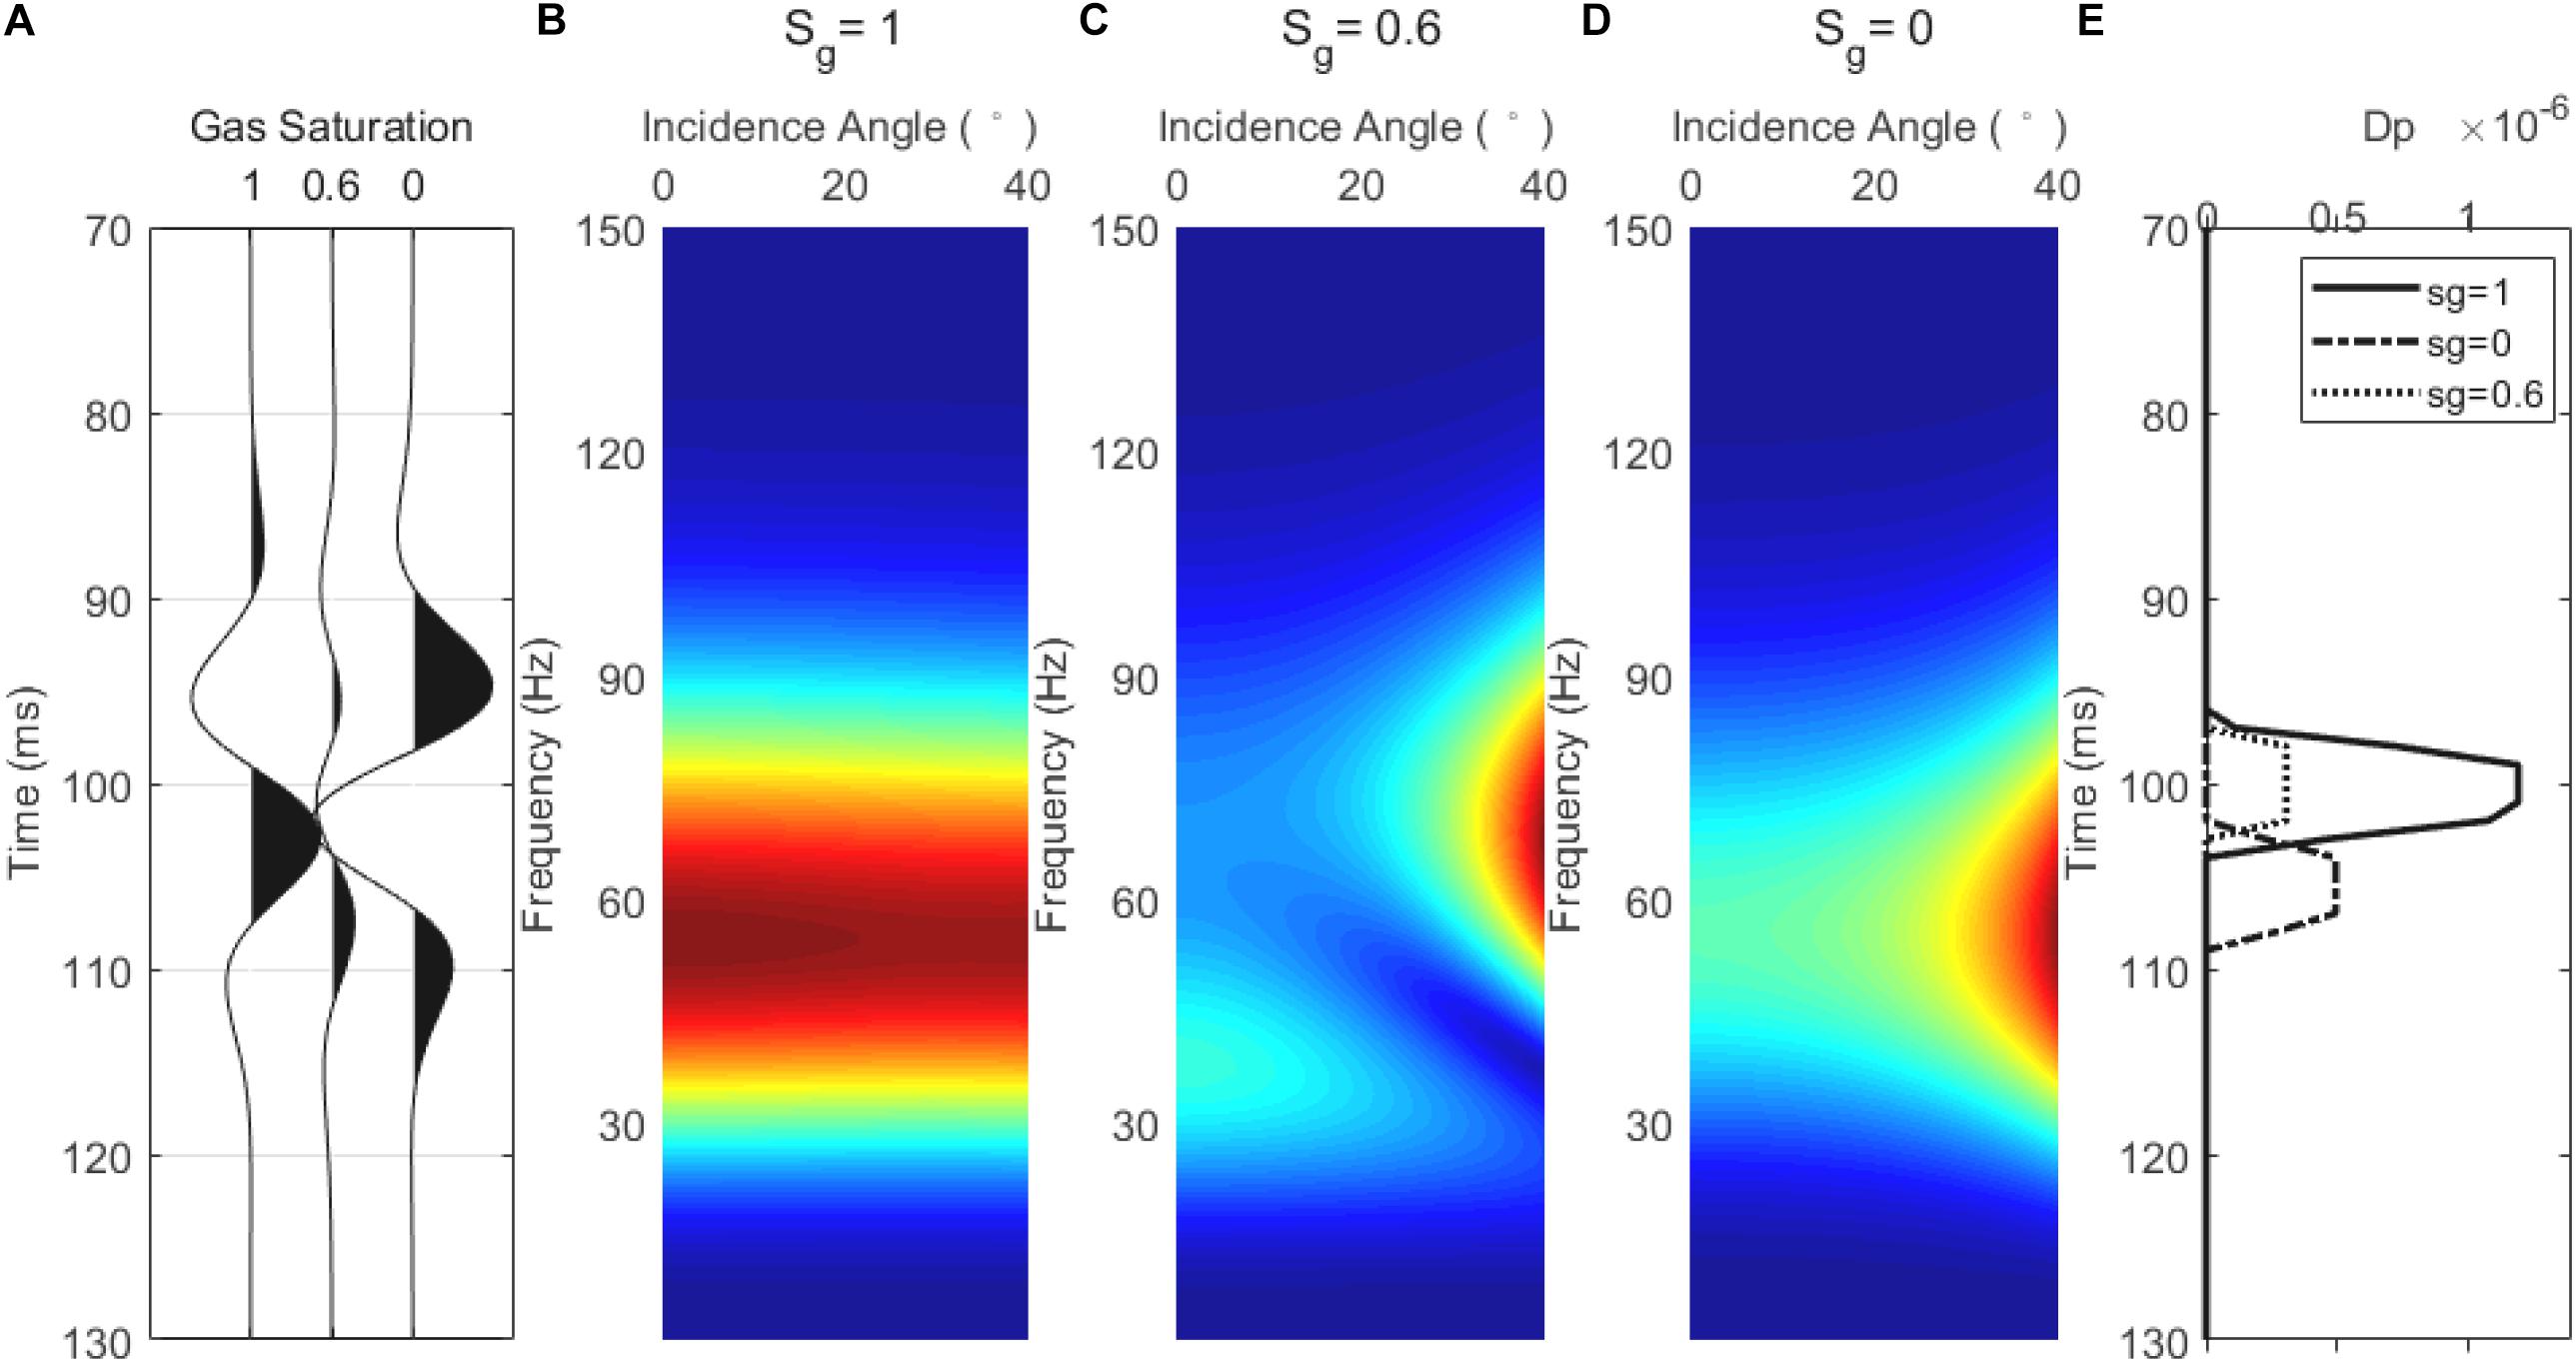
Figure 7. (A) Stacked seismic responses for three gas saturations of 1, 0.6, and 0; (B) spectrum of the PP reflection for a gas saturation of 1; (C) spectrum of the PP reflection for a gas saturation of 0.6; (D) spectrum of the PP reflection for a gas saturation of 0; (E) inverted Dp for the three gas saturation cases.
Real Data Applicaions
Logging and Seismic Data
Figure 8 shows the logging data for the tight sandstone gas reservoir in the study area. The target layer is tight sandstone with a thickness of about 5.5 m below a depth of about 1,325 m. The target layer has a lower gamma ray value and relative higher P- and S-wave velocities than the surrounding mudstone. It has a density about 2.5 g/cm3 and a porosity of about 0.12. The quartz content of the tight sandstone is greater than 85%.
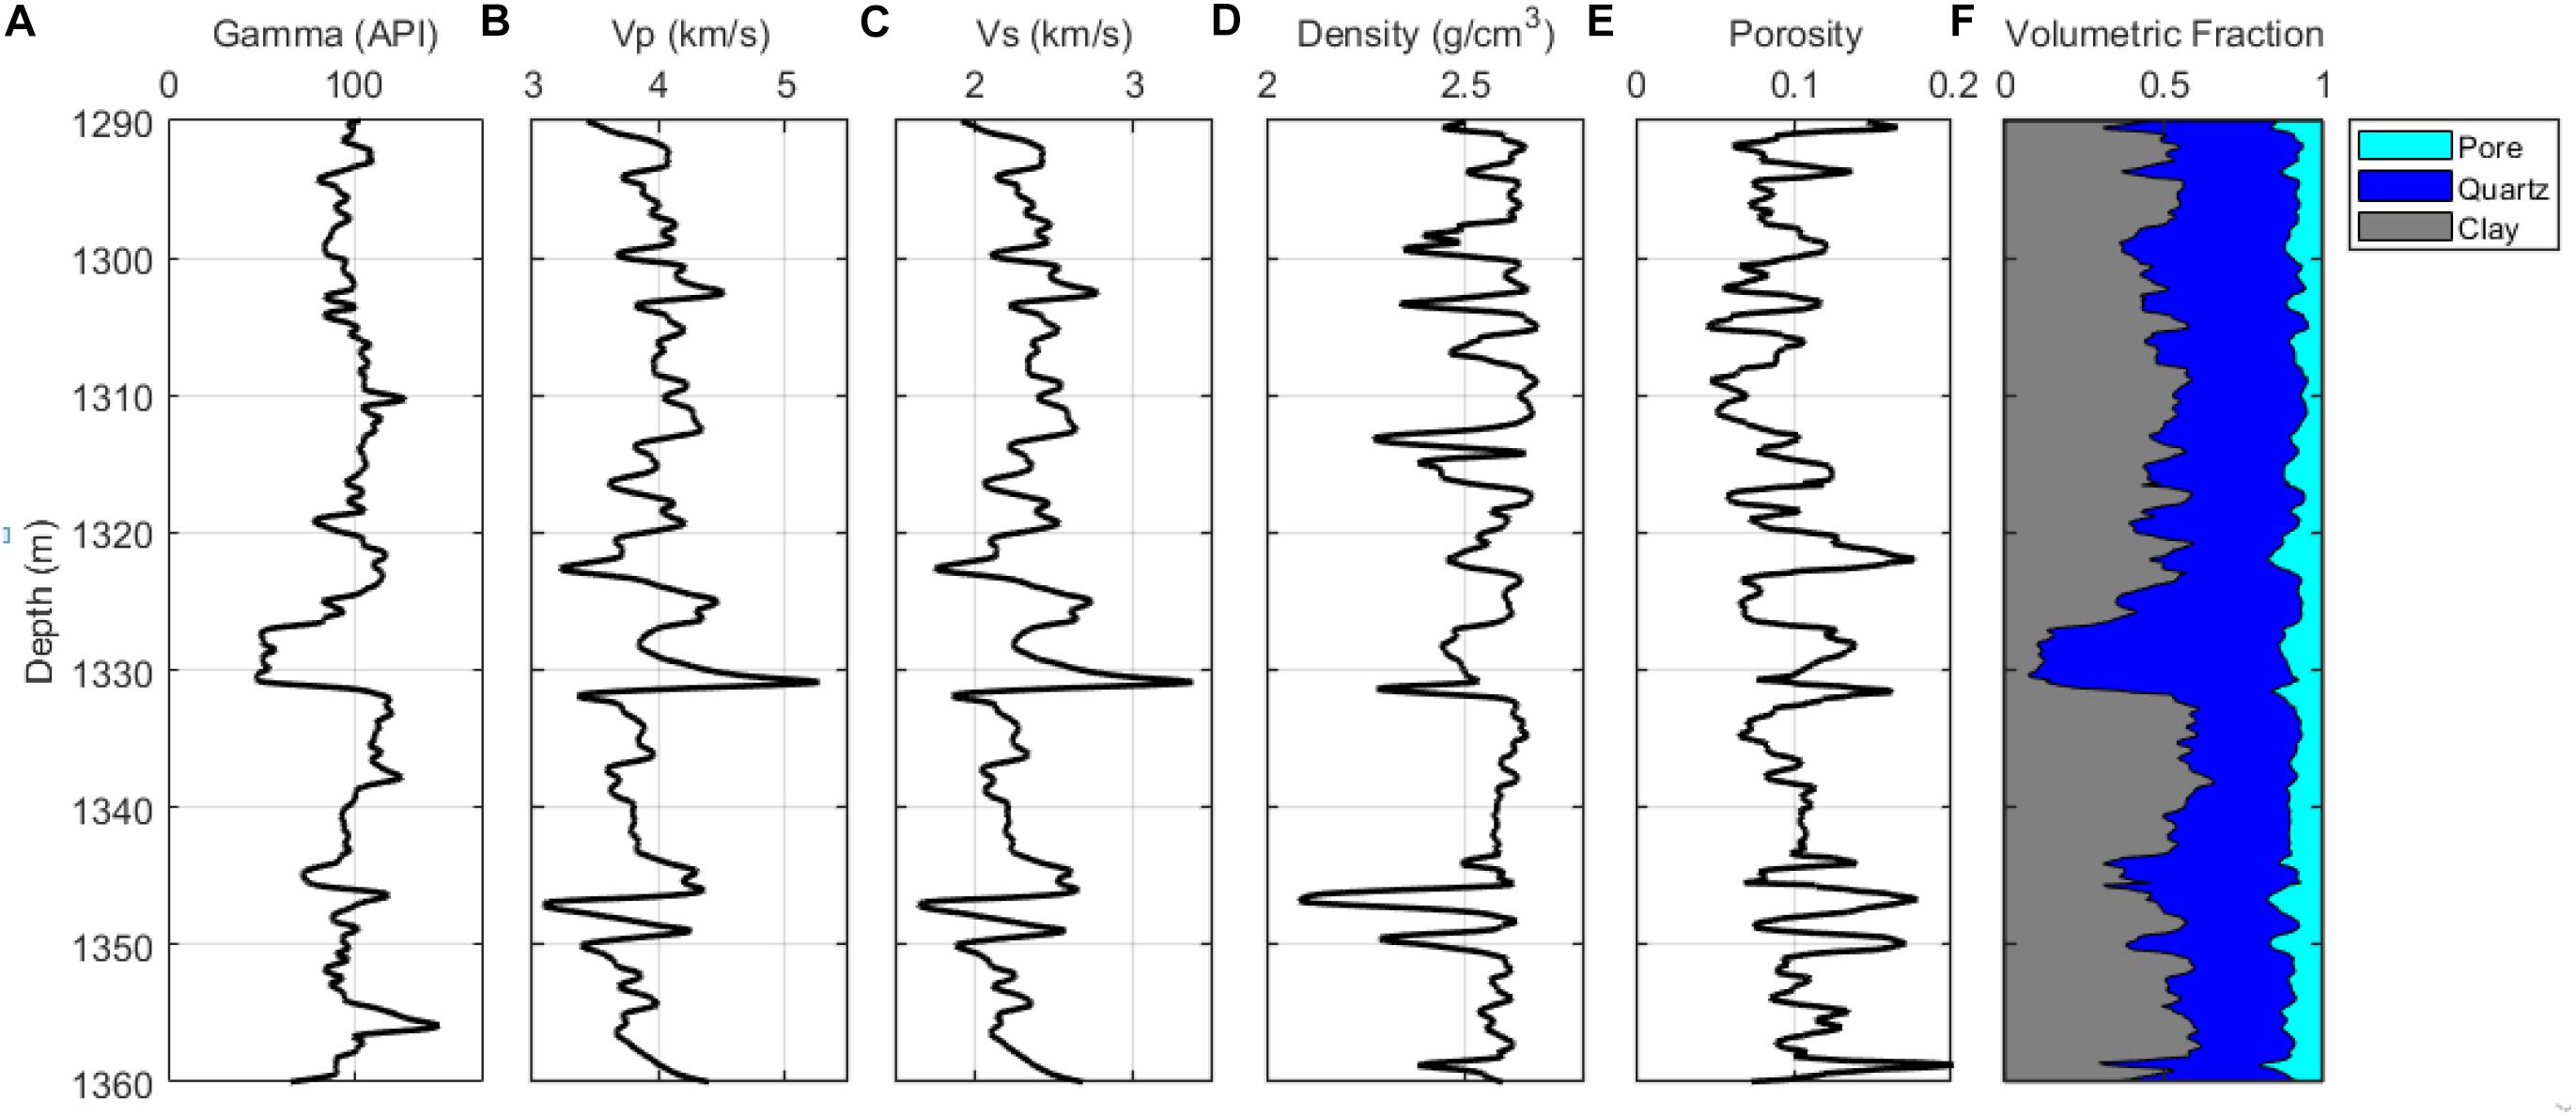
Figure 8. Logging data for the tight sandstone reservoir. (A) Gamma; (B) Vp; (C) Vs; (D) density; (E) porosity; and (F) volumetric fraction of minerals.
Figure 9 shows the post-stacked seismic profile across the well. The yellow curve shows the gamma ray values from the well, and the target layer can be recognized by its low gamma value of around 920 ms.
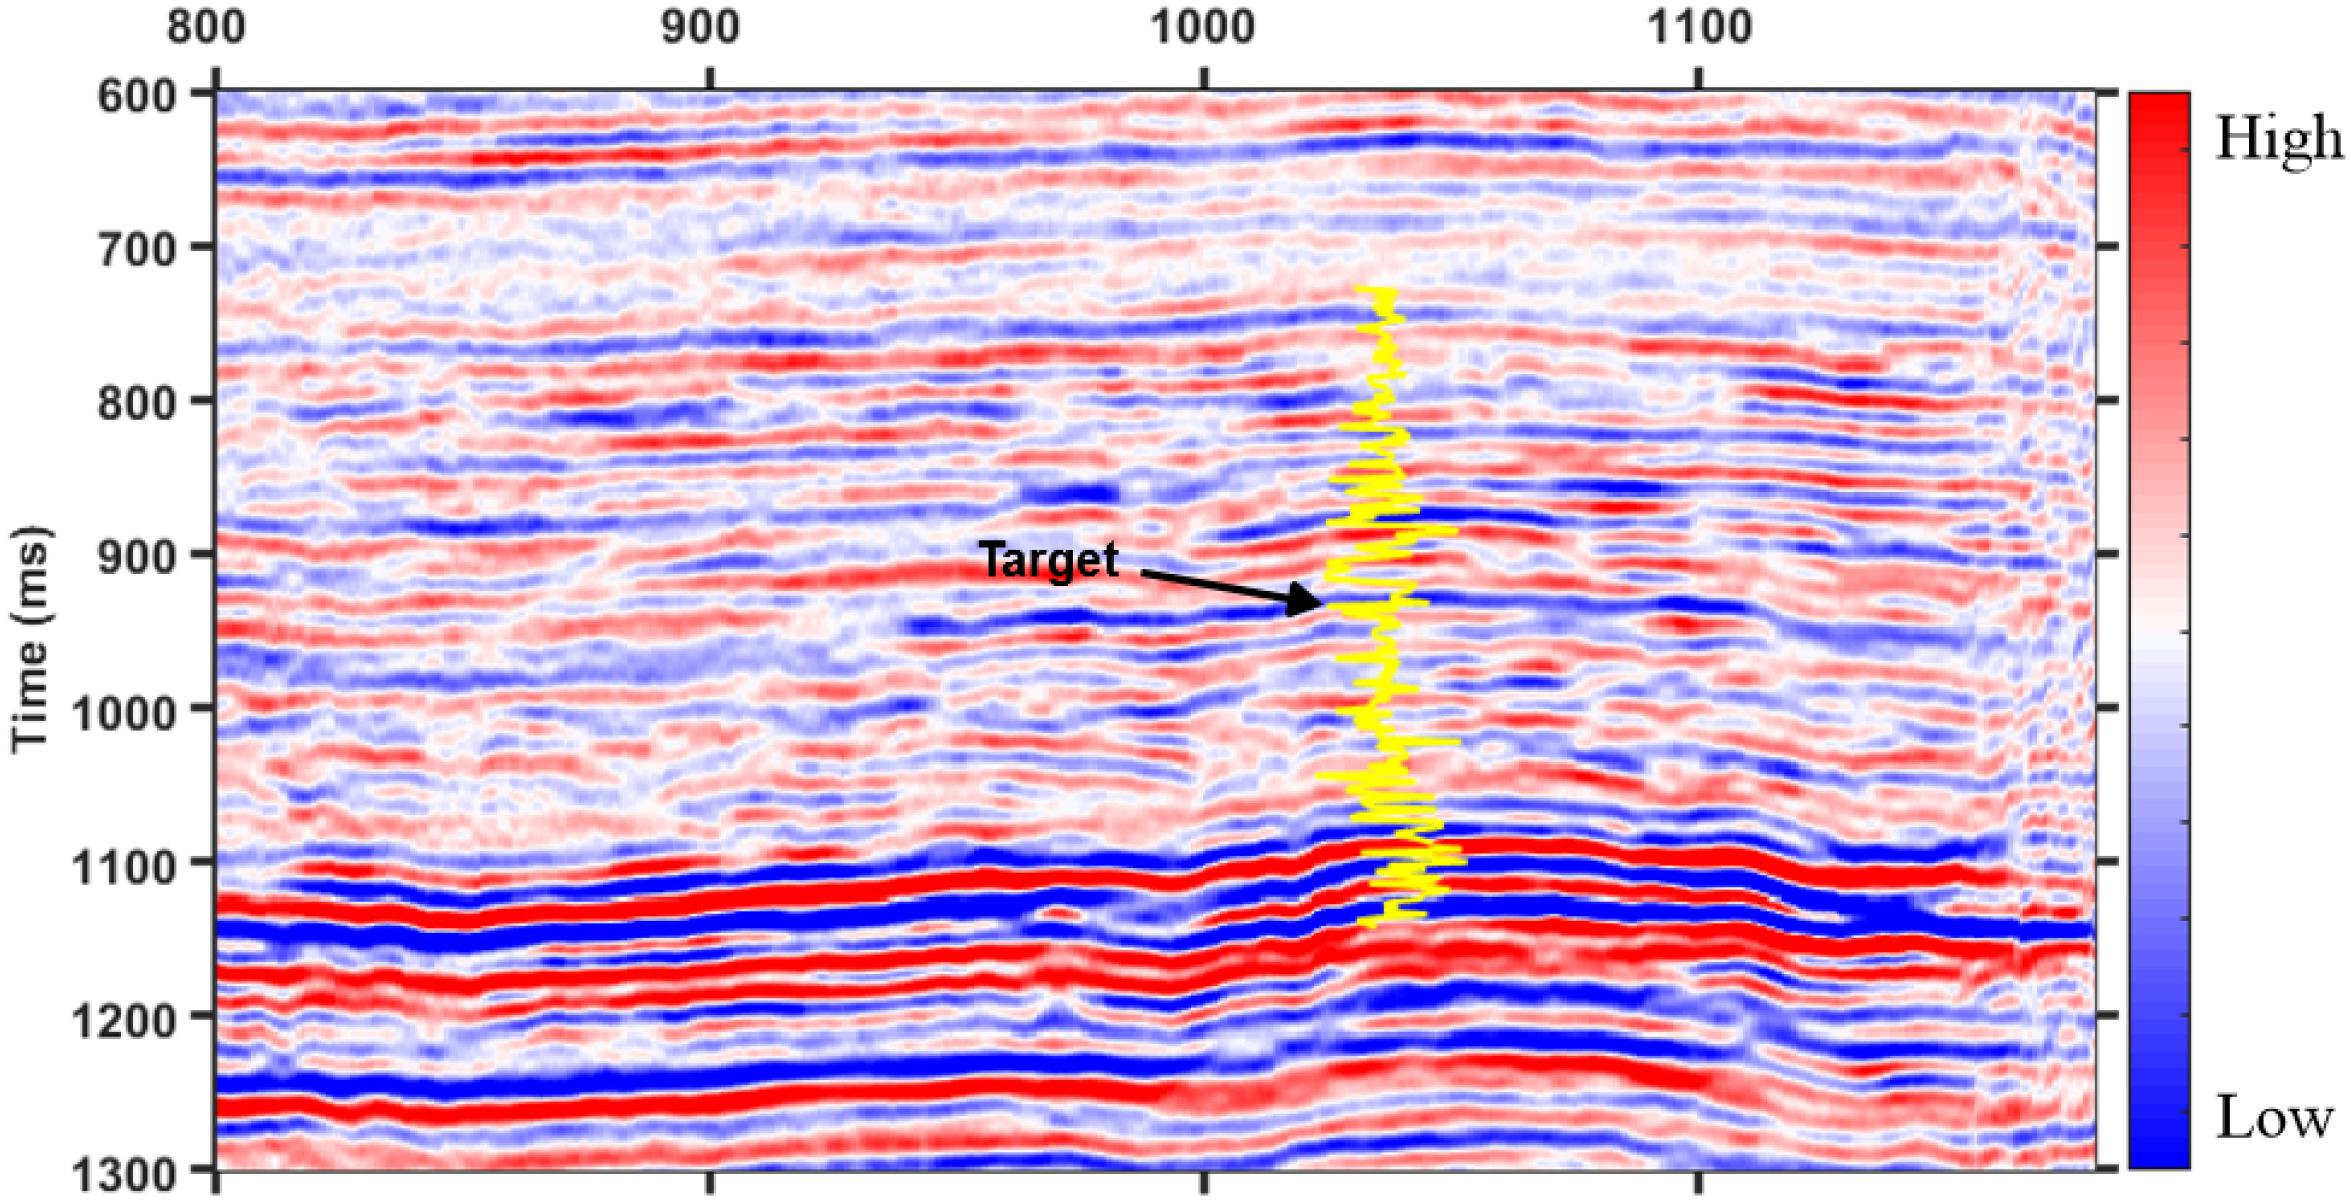
Figure 9. Post-stacked seismic profile across well A.
Inversion of P-Wave Dispersion Attribute Dp
Figure 10 shows the results of the time-frequency analysis of the post-stacked seismic data in Figure 9. The time-frequency analysis profiles correspond to frequencies of 10, 30, 50, and 70 Hz. As shown in Figure 10, the variations in the strength reflected from the target layer at different frequencies form the basis for the inversion of the P-wave dispersion attributes.
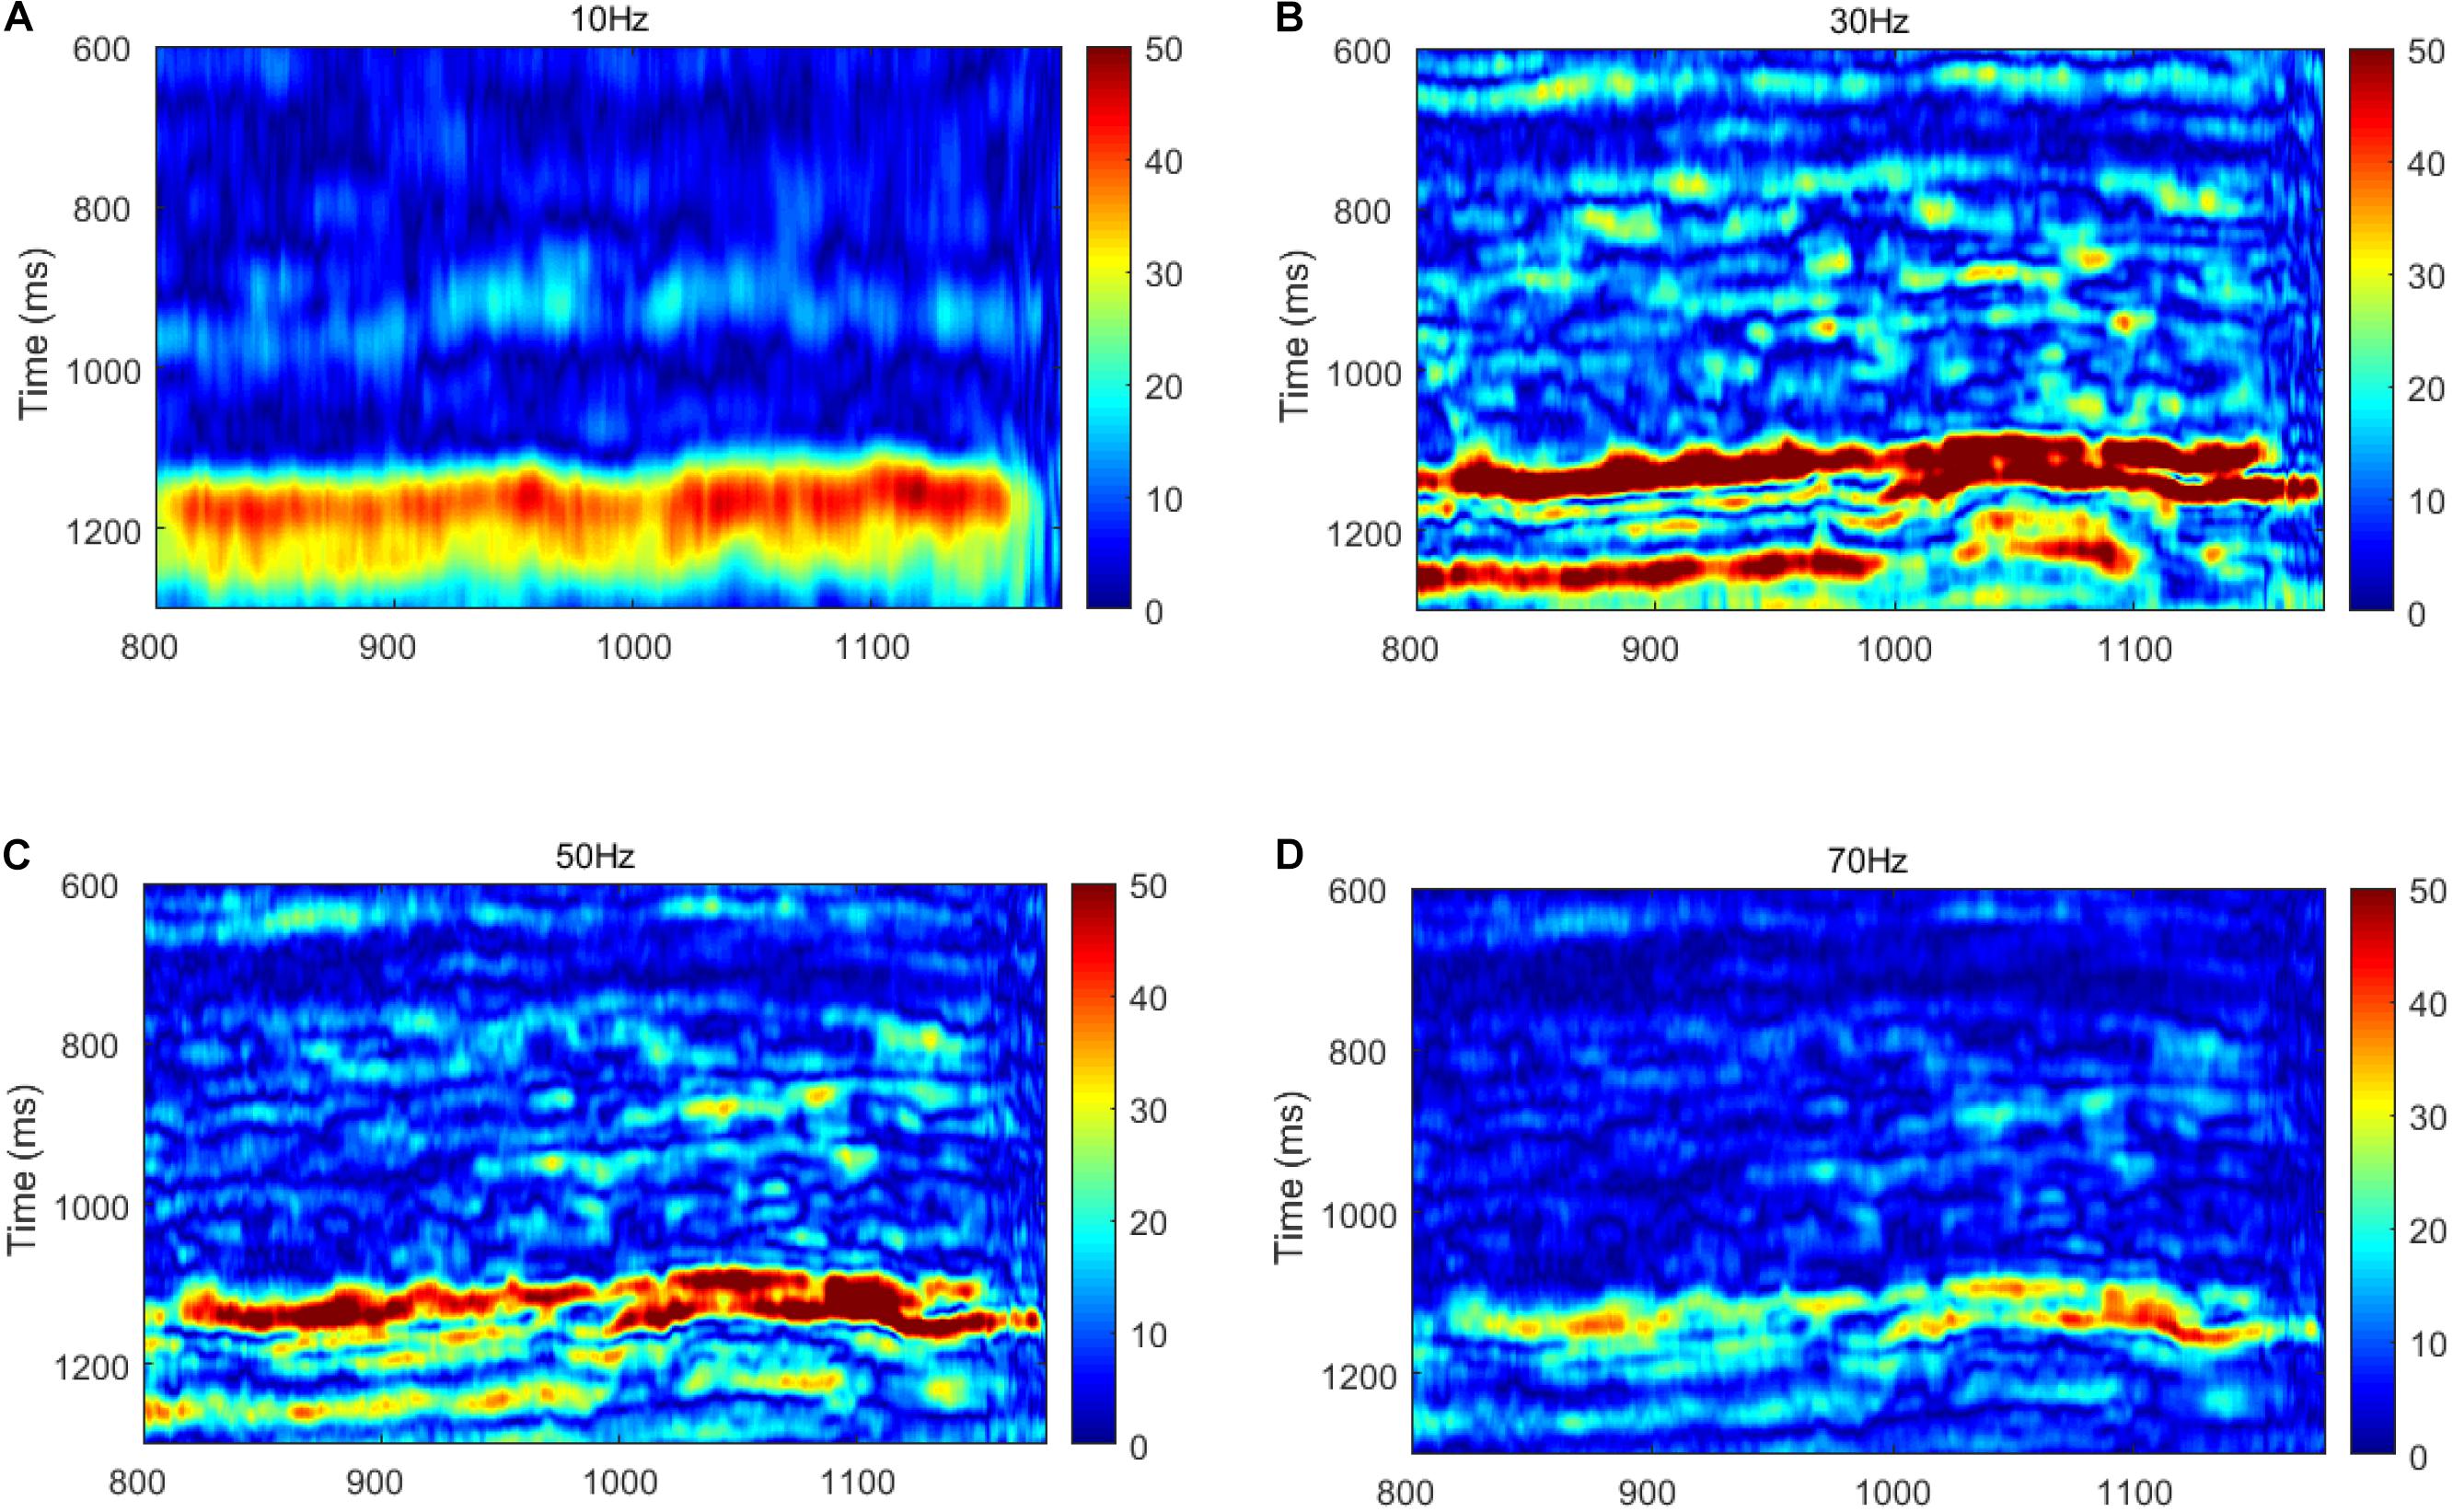
Figure 10. Time-frequency analysis of the post-stack seismic profiles shown in Figure 9. (A) 10 Hz; (B) 30 Hz; (C) 50 Hz; and (D) 70 Hz.
Based on the frequency-dependent AVO inversion theory, the dispersion attribute profile of Dp is calculated and shown in Figure 11. The red curve in Figure 11 is the logging gamma ray value. Strong P-wave velocity dispersion can be observed at the position of the target layer around 920 ms, as pointed out by an arrow.
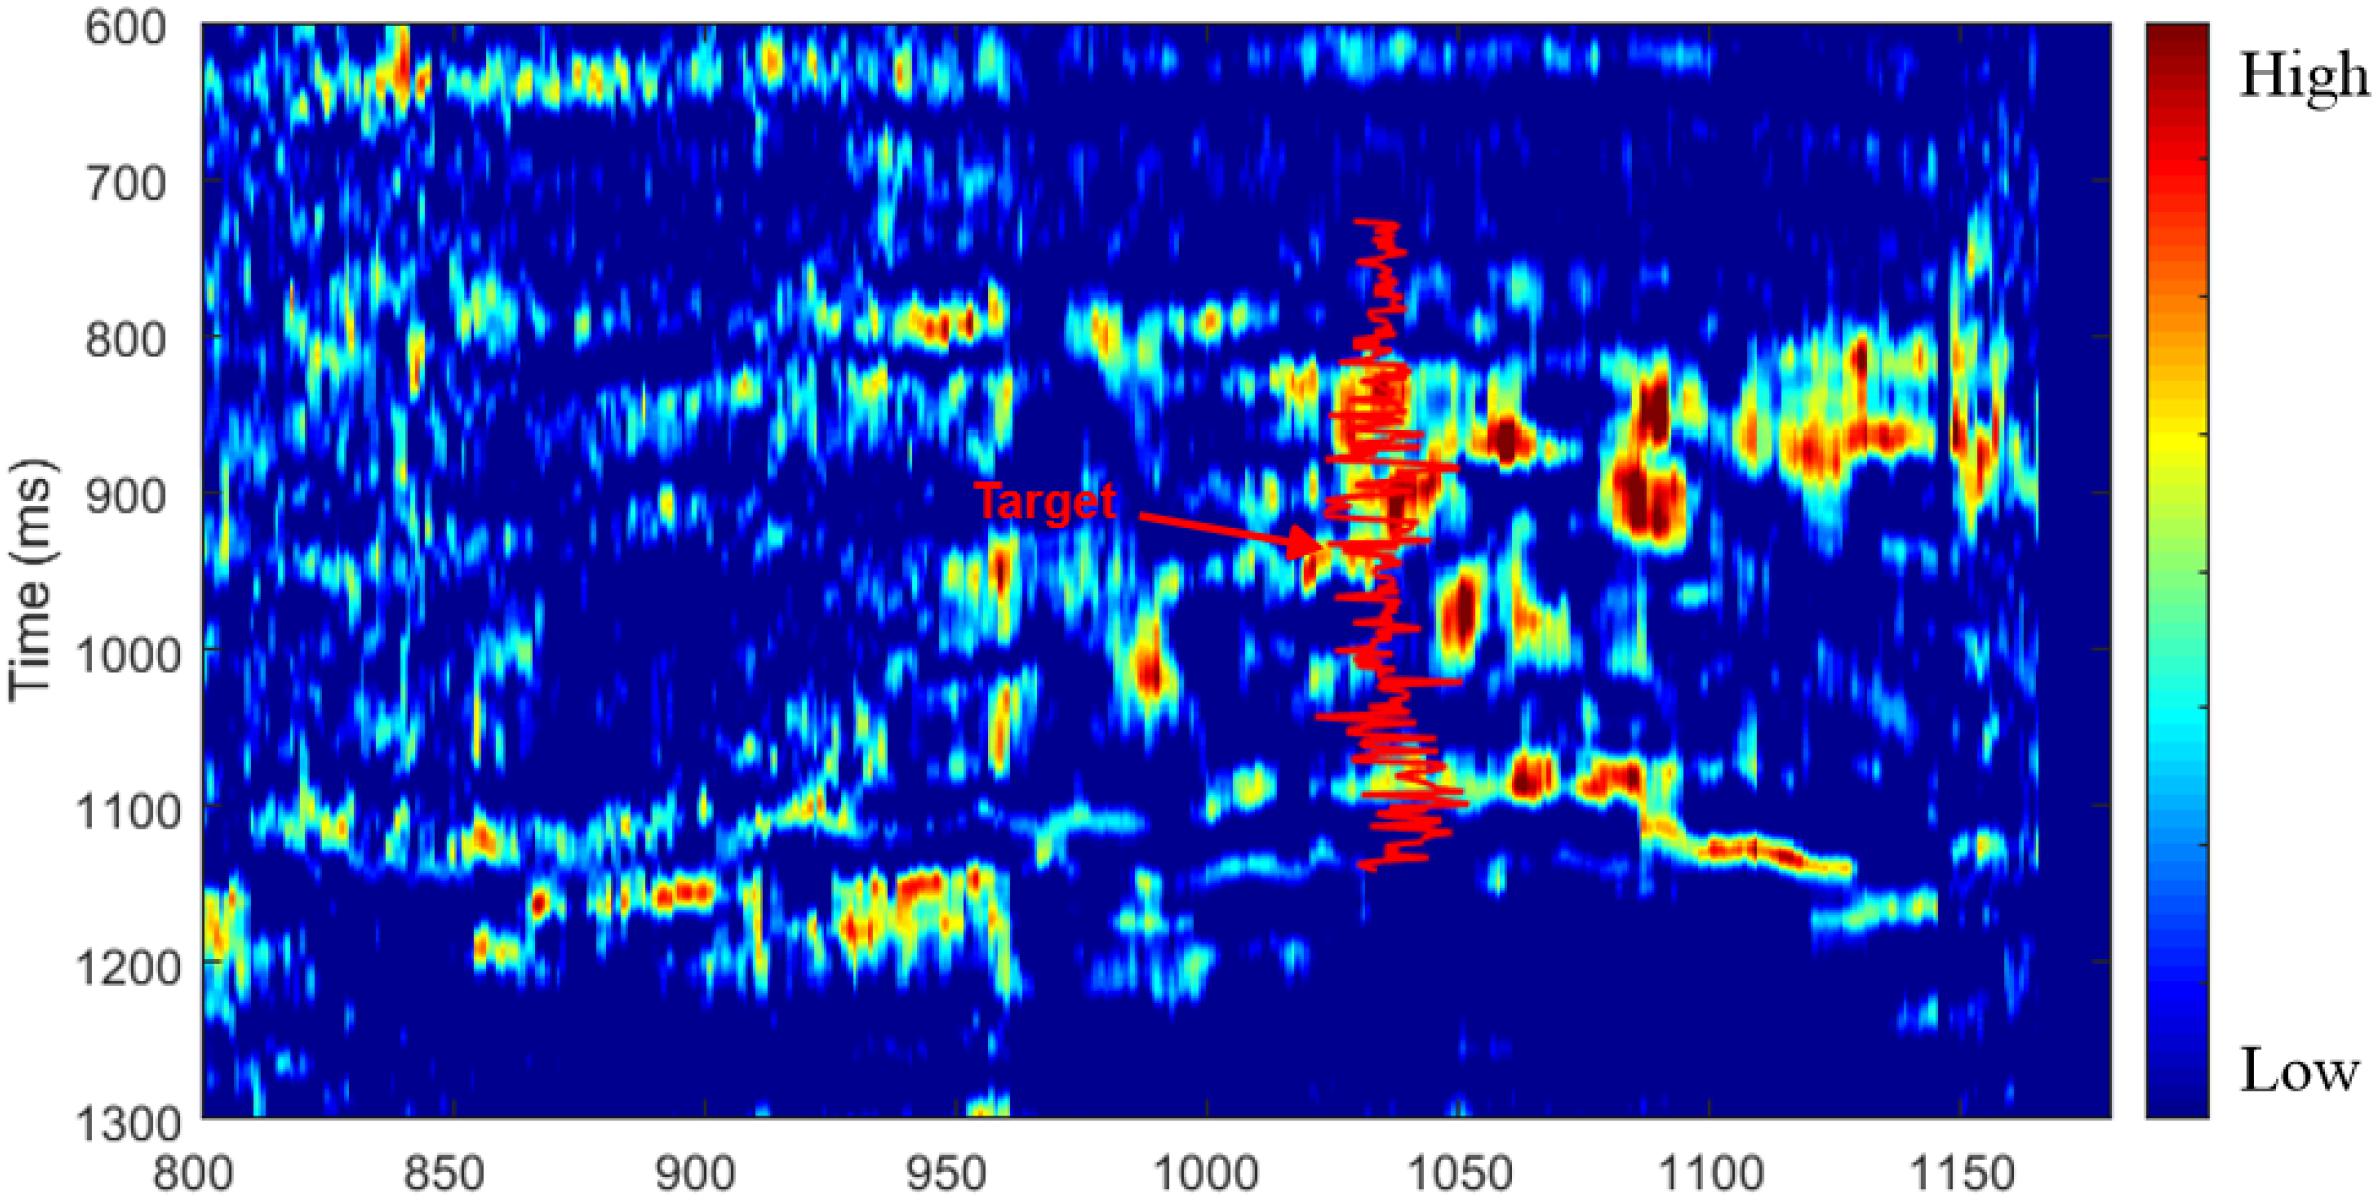
Figure 11. Profile of the dispersion attribute Dp calculated using the frequency-dependent AVO inversion method.
However, in Figure 11, a high value of the Dp attribute can be observed just above the target zone. A reasonable interpretation on this may be the interbedded structure consisting of thin layers of mudstone and sandstone over the position of the target zone. Such interbedded layers that can be observed on logging data in Figure 8 mean that seismic events represent more phases (peaks and troughs) as shown in Figure 9. Strong reflection energy reveals the presence of interference between reflected waves.
The frequency-dependent attributes of seismic reflections are affected by both the interference caused by stacked thin layers, and by the dispersion and attenuation related to fluid flow. Thus, when we intend to identify reservoir fluids using frequency-dependent attributes, it is necessary to notice this uncertainty.
When comparing Figures 9, 11, it is meaningful that the inverted Dp attribute reveals the location of the pay zone which has high gas saturation. Such a pay zone cannot be predicted on the post-stacked seismic profile, where the seismic events show fewer obvious variations laterally.
Figure 12 shows a horizontal slice of the RMS amplitude of the seismic reflection from the target zone. Figure 13 is the corresponding slice of P-wave velocity dispersion attribute Dp. The values of the dispersion attribute Dp for wells A, B, and C in the study area range from high to low. The development of the reservoir shows that the productivities of the three wells are consistent with the inverted Dp attributes, which verifies the feasibility of identifying gas-bearing tight sandstone reservoirs based on frequency-dependent AVO inversion.
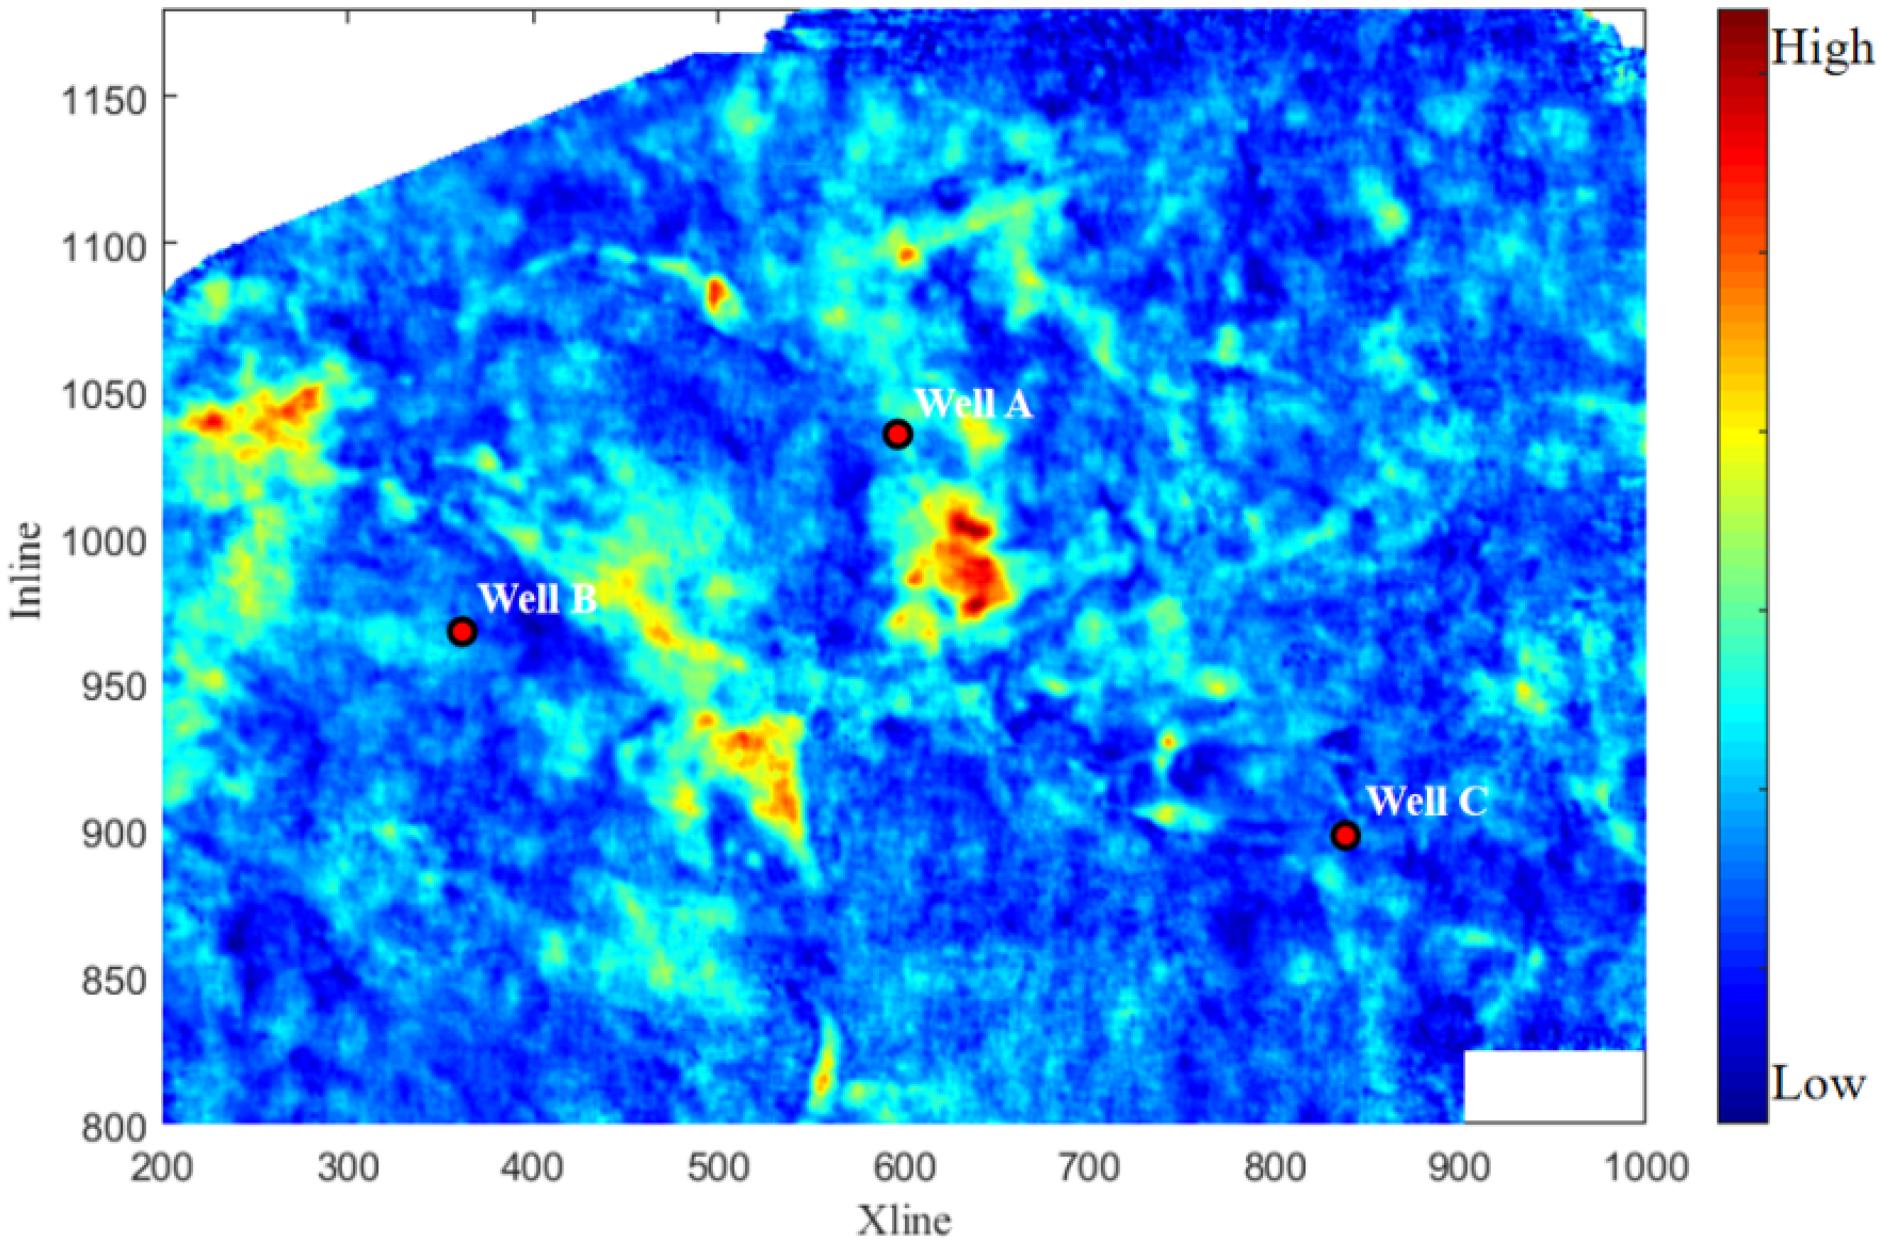
Figure 12. Horizontal slice of the RMS amplitudes of the seismic reflection area.
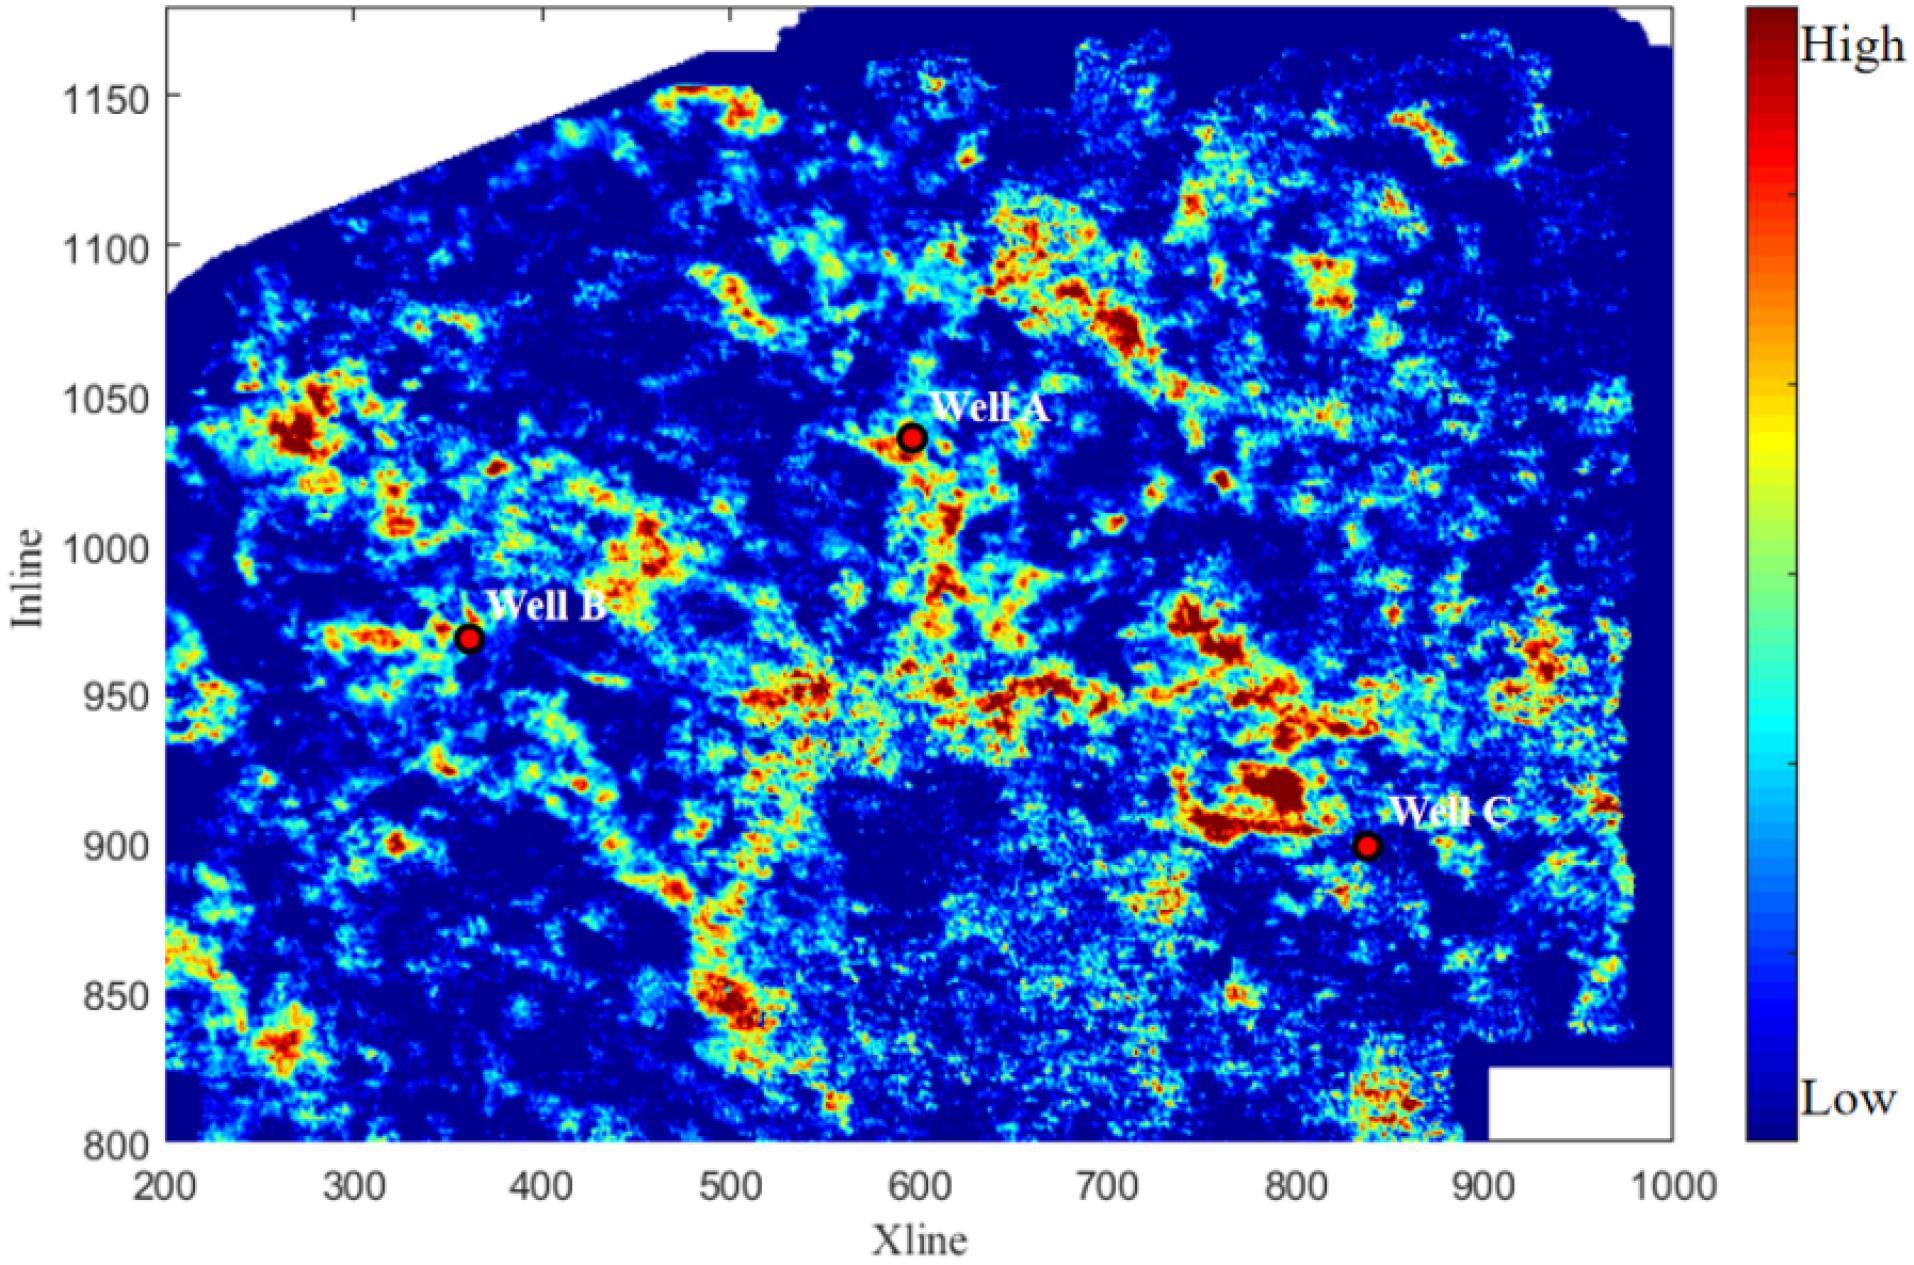
Figure 13. Horizontal slice of the P-wave velocity dispersion attribute Dp.
Discussion and Conclusion
We conducted rock physics modeling of tight gas sandstone by employing the Chapman theory to simulate the dispersion and attenuation caused by the squirt flow of fluids in complex pore spaces. The frequency dependence of the AVO signatures and the inversion of the P-wave dispersion attribute were investigated in different theoretical models with various gas saturations in tight gas sandstone. The field data applications of the frequency-dependent AVO inversion indicate that the estimated P-wave dispersion attribute can be used as a reliable indicator of gas identification in tight gas sandstone reservoirs.
In the constructed rock physics model, the complex pore space is equivalent to a combination of high aspect-ratio pores (stiff pores) and low aspect-ratio microcracks (soft pores). The velocity dispersion and attenuation were simulated by the squirt flow of fluids in the complex pore spaces, which is affected by the gas saturation and the viscosity of the fluid mixtures of gas and brine. The rock physics modeling revealed that as the gas saturation increases, the P-wave velocity generally decreases. P-wave velocity dispersion and attenuation occurs at seismic frequencies, and it tends to move toward higher frequencies as the gas saturation increases.
According to the rock physics modeling results, P-wave velocity dispersion in tight sandstone results in the frequency-dependence of the contrast in the elastic impedance at the interface between the tight sandstone and the overlying mudstone, and therefore, it leads to frequency-dependent reflection coefficients. The synthetic model based on the propagator matrix method revealed that the reflection coefficient varies significantly with frequency, and the variations in the amplitudes and phases of the PP reflections can be observed for various gas saturations.
The tests of the frequency-dependent AVO inversion using synthetic data revealed that the magnitude of the P-wave dispersion attribute is an effective indicator of gas saturation in the tight sandstone. Finally, the frequency-dependent AVO inversion was applied to pre-stacked field seismic data. The results indicate that the inverted P-wave dispersion attribute is well correlated with the production of the pay zone for the evaluation wells. Thus, the methods investigated in this study have good potential for the evaluation of gas saturation in tight gas sandstone reservoirs.
Data Availability Statement
The original contributions presented in the study are included in the article/supplementary material, further inquiries can be directed to the corresponding author.
Author Contributions
ZG contributed as the corresponding author of the manuscript. HJ did a part of writing and coding works. CL, YZ, CN, DW, and YL provided some interesting ideas. All authors contributed to the article and approved the submitted version.
Funding
This research was supported by the China National Offshore Oil Corporation (CNOOC) research project (No. YXKY-2019-ZY-04) and the National Natural Science Foundation of China (No. 42074153).
Conflict of Interest
YZ, CN, DW, and YL were employed by the company CNOOC and declare that this study received funding from CNOOC. The funder had the following involvement with the study: YZ provided some new ideas and suggestions, CN and DW gave analysis on results, and YL collected the data.
The remaining authors declare that the research was conducted in the absence of any commercial or financial relationships that could be construed as a potential conflict of interest.
References
Ba, J., Carcione, J. M., Cao, H., Du, Q. Z., Yuan, Z. Y., and Lu, M. H. (2012). Vertical wave dispersion and attenuation in unsaturated rock: wave propagation equation of dual pore medium. Chin. J. Geophys. 55, 219–231. doi: 10.6038/j.issn.0001-5733.2012.01.021
Ba, J., Xu, W., Fu, L., Carcione, J. M., and Zhang, L. (2017). Rock anelasticity due to patchy-saturation and fabric heterogeneity: a double double-porosity model of wave propagation. J. Geophys. Res. Solid Earth 122, 1949–1976. doi: 10.1002/2016JB013882
Ba, J., Zhao, J., Carcione, J. M., and Huang, X. (2016). Compressional wave dispersion due to rock matrix stiffening by clay squirt flow. Geophys. Res. Lett. 43, 6186–6195.
Biot, M. A. (1956a). Theory of propagation of elastic waves in a fluid-saturated porous solid. I. Low frequency range. J. Acoust. Soc. Am. 138, 168–178. doi: 10.1121/1.1908239
Biot, M. A. (1956b). Theory of propagation of elastic waves in a fluid-saturated porous solid. II. Higher frequency range. J. Acoust. Soc. Am. 138, 179–191. doi: 10.1121/1.1908241
Carcione, J. M. (2001). AVO effects of a hydrocarbon source-rock layer. Geophysics 66, 419–427. doi: 10.1190/1.1444933
Chapman, M. (2003). Frequency-dependent anisotropy due to meso-scale fractures in the presence of equant porosity. Geophys. Prospect. 51, 369–379. doi: 10.1046/j.1365-2478.2003.00384.x
Chapman, M. (2009). Modeling the effect of multiple sets of mesoscale fractures in porous rock on frequency-dependent anisotropy. Geophysics 74, 97–103. doi: 10.1190/1.3204779
Chapman, M., Liu, E., and Li, X. Y. (2005). The influence of abnormally high reservoir attenuation on the AVO signature. Lead. Edge 24, 1120–1125. doi: 10.1190/1.2135103
Chapman, M., Liu, E., and Li, X. Y. (2006). The influence of fluid-sensitive dispersion and attenuation on AVO analysis. Geophys. J. Int. 167, 89–105. doi: 10.1111/j.1365-246X.2006.02919.x
Chapman, M., Sergei, V., and Zatsepin, S. C. (2002). Derivation of a microstructural poroelastic model. Geophys. J. Int. 151, 427–451. doi: 10.1046/j.1365-246X.2002.01769.x
Chen, S. Q., Chapman, M., and Wu, X. Y. (2015). The application of quantitative gas saturation estimation based on the seismic wave dispersion inversion. J. Appl. Geophys. 20, 81–95. doi: 10.1016/j.jappgeo.2015.07.001
Davide, G., and Carcione, J. M. (2003). Acoustic properties of sediments saturated withgas hydrate, free gas and water. Geophys. Prospect. 51, 141–157. doi: 10.1046/j.1365-2478.2003.00359.x
Dvorkin, J., and Nur, A. (1993). Dynamic poroelasticity: a unified model with the squirt and the Biot mechanisms. Geophysics 58, 524–533. doi: 10.1190/1.1443435
Li, X. Y. (2013). “Quantitative estimation of gas saturation by frequency dependent AVO: numerical, physical modelling and field studies,” in Proceedings of the 6th International Petroleum Technology Conference, (Beijing).
Ruiz, F., and Cheng, A. (2010). A rock physics model for tight gas sand. Lead. Edge 29, 1484–1489. doi: 10.1190/1.3525364
Shuey, R. T. (1985). Simplification of the zoeppritz equations. Geophysics 50, 609–614. doi: 10.1190/1.1441936
Smith, T. M., Sayers, C. M., and Sondergeld, C. H. (2009). Rock properties in low-porosity//low-permeability sandstones. Lead. Edge. 28, 48–59. doi: 10.1190/1.3064146
Wang, E., Carcione, J. M., Ba, J., and Liu, Y. (2019). Reflection and transmission of plane elastic waves at an interface between two double-porosity media: effect of local fluid flow. Surv. Geophys. 41, 283–322.
White, J. E. (1975). Computed seismic speeds and attenuation in rocks with partial gas saturation. Geophysics 40, 224–232. doi: 10.1190/1.1440520
Wilson, A. (2010). Theory and Methods of Frequency-Dependent AVO Inversion. Edinburgh: The University of Edinburgh.
Wilson, A., Chapman, M., and Li, X. Y. (2009). “Frequency-dependent AVO Inversion,” in 79th annual SEG meeting Expanded Abstracts, Vol. 28, (Tulsa, OK: Society of Exploration Geophysicists), 341–345.
Wu, X. Y. (2010). Frequency Dependent AVO Inversion Using Spectral Decomposition Techniques. Beijing: China University of Geosciences.
Wu, X. Y., Chapman, M., Li, X. Y., and Boston, P. (2014). Quantitative gas saturation estimation by frequency-dependent amplitude-versus-offset analysis. Geophys. Prospect. 62, 1224–1237. doi: 10.2307/1933611
Zhang, Z., Yin, X. Y., and Hao, Q. Y. (2014). Frequency variable fluid identification based on AVO inversion. Chin. J. Geophys. 12, 4171–4184. doi: 10.6038/cjg20141228
APPENDIX A
The Frequency-Dependent AVO Theory
Shuey (1985) gave an approximate formula for the PP reflection coefficient for isotropic media:
where θ is the incident angle. Vp and ρ are the mean values of the P-wave velocity and density across the interface, respectively. ΔVp and Δρ are the differences in the P-wave velocity and density across the interface, respectively. G is the AVO gradient.
Based on Eq. A1, Chapman et al. (2006) concluded that the dispersion of the P-wave velocity caused the frequency dependency of the reflection coefficient. Thus, Eq. A1 can be rewritten as
Using the Taylor series expansion method, we obtained the frequency-dependent RPP for a reference frequency:
Thus,
where DP represents the derivatives of the seismic wave velocities with frequency; and DG is the frequency-dependent AVO gradient.
In the application of the frequency-dependent AVO method to real data, the time-frequency spectra S(t,θ,f) of the pre-stacked gathers contains the information for the incidence wavelet spectrum, so it is necessary to eliminate the effect of the incidence wavelet.
where max(Af=ref(θ)) is the maximum value of the amplitude spectrum in the selected time window used for the calculation.
According to Eq. A4,
where ΔM(t,θ,f)=M(t,θ,f)−M(t,θ,f0).
Eq. A8 can be rewritten in the form of a matrix:
where the DP and DG values of inversion parameters can be obtained by solving the over-determined equation.
Keywords: tight gas sandstone, rock physics, seismic responses, dispersion attribute, gas saturation
Citation: Jin H, Liu C, Guo Z, Zhang Y, Niu C, Wang D and Ling Y (2021) Rock Physical Modeling and Seismic Dispersion Attribute Inversion for the Characterization of a Tight Gas Sandstone Reservoir. Front. Earth Sci. 9:641651. doi: 10.3389/feart.2021.641651
Received: 14 December 2020; Accepted: 01 March 2021;
Published: 29 April 2021.
Edited by:
Jing Ba, Hohai University, ChinaReviewed by:
Zhiwei Wang, China University of Petroleum (Huadong), ChinaFei Gong, China University of Petroleum, China
Copyright © 2021 Jin, Liu, Guo, Zhang, Niu, Wang and Ling. This is an open-access article distributed under the terms of the Creative Commons Attribution License (CC BY). The use, distribution or reproduction in other forums is permitted, provided the original author(s) and the copyright owner(s) are credited and that the original publication in this journal is cited, in accordance with accepted academic practice. No use, distribution or reproduction is permitted which does not comply with these terms.
*Correspondence: Zhiqi Guo, emhpcWlndW9AYWxpeXVuLmNvbQ==