 Zhiqi Guo
- 1College of Geo-Exploration Science and Technology, Jilin University, Changchun, China
- 2CNOOC Research Institute Co., Ltd., Beijing, China
Strong heterogeneity of pore microstructures leads to complicated velocity-porosity relationships in tight sandstone that cannot be well explained by conventional empirical formulas. To better understand the effect of complex pore structures on elastic properties of tight gas sandstone, we compared three rock physics models. In the first model, we used a single aspect ratio value to quantify varied pore geometry in the tight sands. In the second model, complex pore space was equivalent to the combination of high-aspect-ratio round pores (stiff pores) and low-aspect-ratio compliant microcracks (soft pores). In the third multiple pore-aspect-ratio model, pore spaces are represented using a set of pores with varied values of aspect ratio following statistical normal distribution. Modeling results showed that complex velocity-porosity relationships could be interpreted by the variations in pore aspect ratio in the first model, by the fraction of soft pores in the second model, and by the mean value and variance in the third statistical model. For a given mean value in the third model, higher variance of the multiple pore-aspect-ratio indicated stronger heterogeneity of pore spaces. Further studies on rock physical inversion showed that, compared with the first single pore-aspect-ratio model, the second dual-pore model gave better prediction in shear wave velocity by regarding the soft pore fraction as a fitting parameter. This finding revealed that the dual-pore model could be a more realistic representation of tight sandstone. The third statistical model showed comparable precision in the prediction of shear wave velocity compared with the dual-pore model; however, uncertainty existed for simultaneously determining mean value and variance of pore aspect ratio. On the basis of the dual-pore model, we evaluated the elastic modulus of dry frames of the tight sandstone using logging data in a borehole. Compared with empirical formulas, such as the Krief methods, the method in this paper provided a more rigorous way to determine elastic properties of dry frames for the tight sandstone. Comparisons of rock physical modeling methods offer a better understanding of the microstructures controlling the elastic behaviors of tight gas sandstone.
Introduction
Tight sandstone of low porosity and low permeability usually represent complex pore structures, which significantly impacts elastic properties of the tight sandstone. Complicated elastic behaviors of the tight sandstone with heterogeneous pore structures cannot be properly described by traditional rock physical methods that rely on empirical relations. Thus, it is necessary to investigate elastic properties related to heterogeneity using rock physical methods that incorporate pore structures.
The effect of microcracks on the rock elastic properties has been studied by Stuart and David (1977) in their theoretical rock physics models. After that, numerous works have been dedicated to the connection between elastic properties and microstructures in the tight sandstone reservoirs. According to study by Tutuncu et al. (1994), the existence of microcracks with low aspect ratio leads to the phenomenon that the P- and S-wave velocities Vp and Vs are sensitive to pressure changes. The presence of low-aspect-ratio pores or microcracks can explain the complex relationship between velocity and porosity in tight sandstone gas reservoirs (Smith et al., 2009; Vernik and Kachanov, 2010). Ruiz and Cheng (2010) introduced two sets of pores with different aspect ratios in the rock physical modeling, and applied the model to the prediction of elastic modulus of a tight sandstone.
Yin et al. (2017) conducted experimental measurements and rock physical modeling to investigate the effect of pressure and fluid on elastic moduli of the tight sandstone, and found that microcracks in tight sandstone dominate the changes in elastic properties of the rock. Yan et al. (2011) employed the Mori–Tanaka model (Mori and Tanaka, 1973) to analyze experimental measurements on the dry frame of sandstone of low porosity. Deng et al. (2015) explored the influence of pore structures on velocity dispersion of tight sandstone, and found that the existence of microcracks is related to the heterogeneity of the rock skeleton and the fluid distribution. Ba et al. (2017) established a double dual-pore model for the anelasticity of P-wave propagation to analyze the effect of dissipation mechanisms caused by the heterogeneity of fabric and fluid distribution. Wang (2017) proposed a rock physics model for the prediction of gas-bearing sandstone properties based on the measurements and analysis on data for tight sandstone samples. Wang et al. (2020) incorporated the Bayes discriminant and deterministic rock physics modeling method to implement joint probabilistic fluid discrimination of tight sandstone reservoirs.
In this study, we built three rock physics models for the description of elastic properties associated with heterogeneous pore structures in tight gas sandstone. Using the three built models, we then predicted shear wave velocity and inverted corresponding parameters of pore structure to evaluate and compare the applicability of the models. Finally, we used the built model to estimate elastic modulus of the rock skeleton of tight gas sandstone.
Well Data of Tight Gas Sandstone Reservoir
Figure 1 shows the logging data from the tight gas sandstone reservoir in the Ordos Basin, China. The strata consist of the interbed of sandstone and mudstone. The tight sandstone corresponds relatively local low value of GR. Compared with the mudstone, the sandstone has relatively higher P-wave and S-wave velocities around 4.5 km/s and 2.5 km/s, and a relatively lower density of approximately 2.5 g cm–3. Porosity generally is below 15% for the sandstone. As illustrated by the logging data of water saturation, the sandstone has a gas saturation usually higher than 40%. Data of the mineralogical volume show variations in the fraction of quartz and clay in the formation.
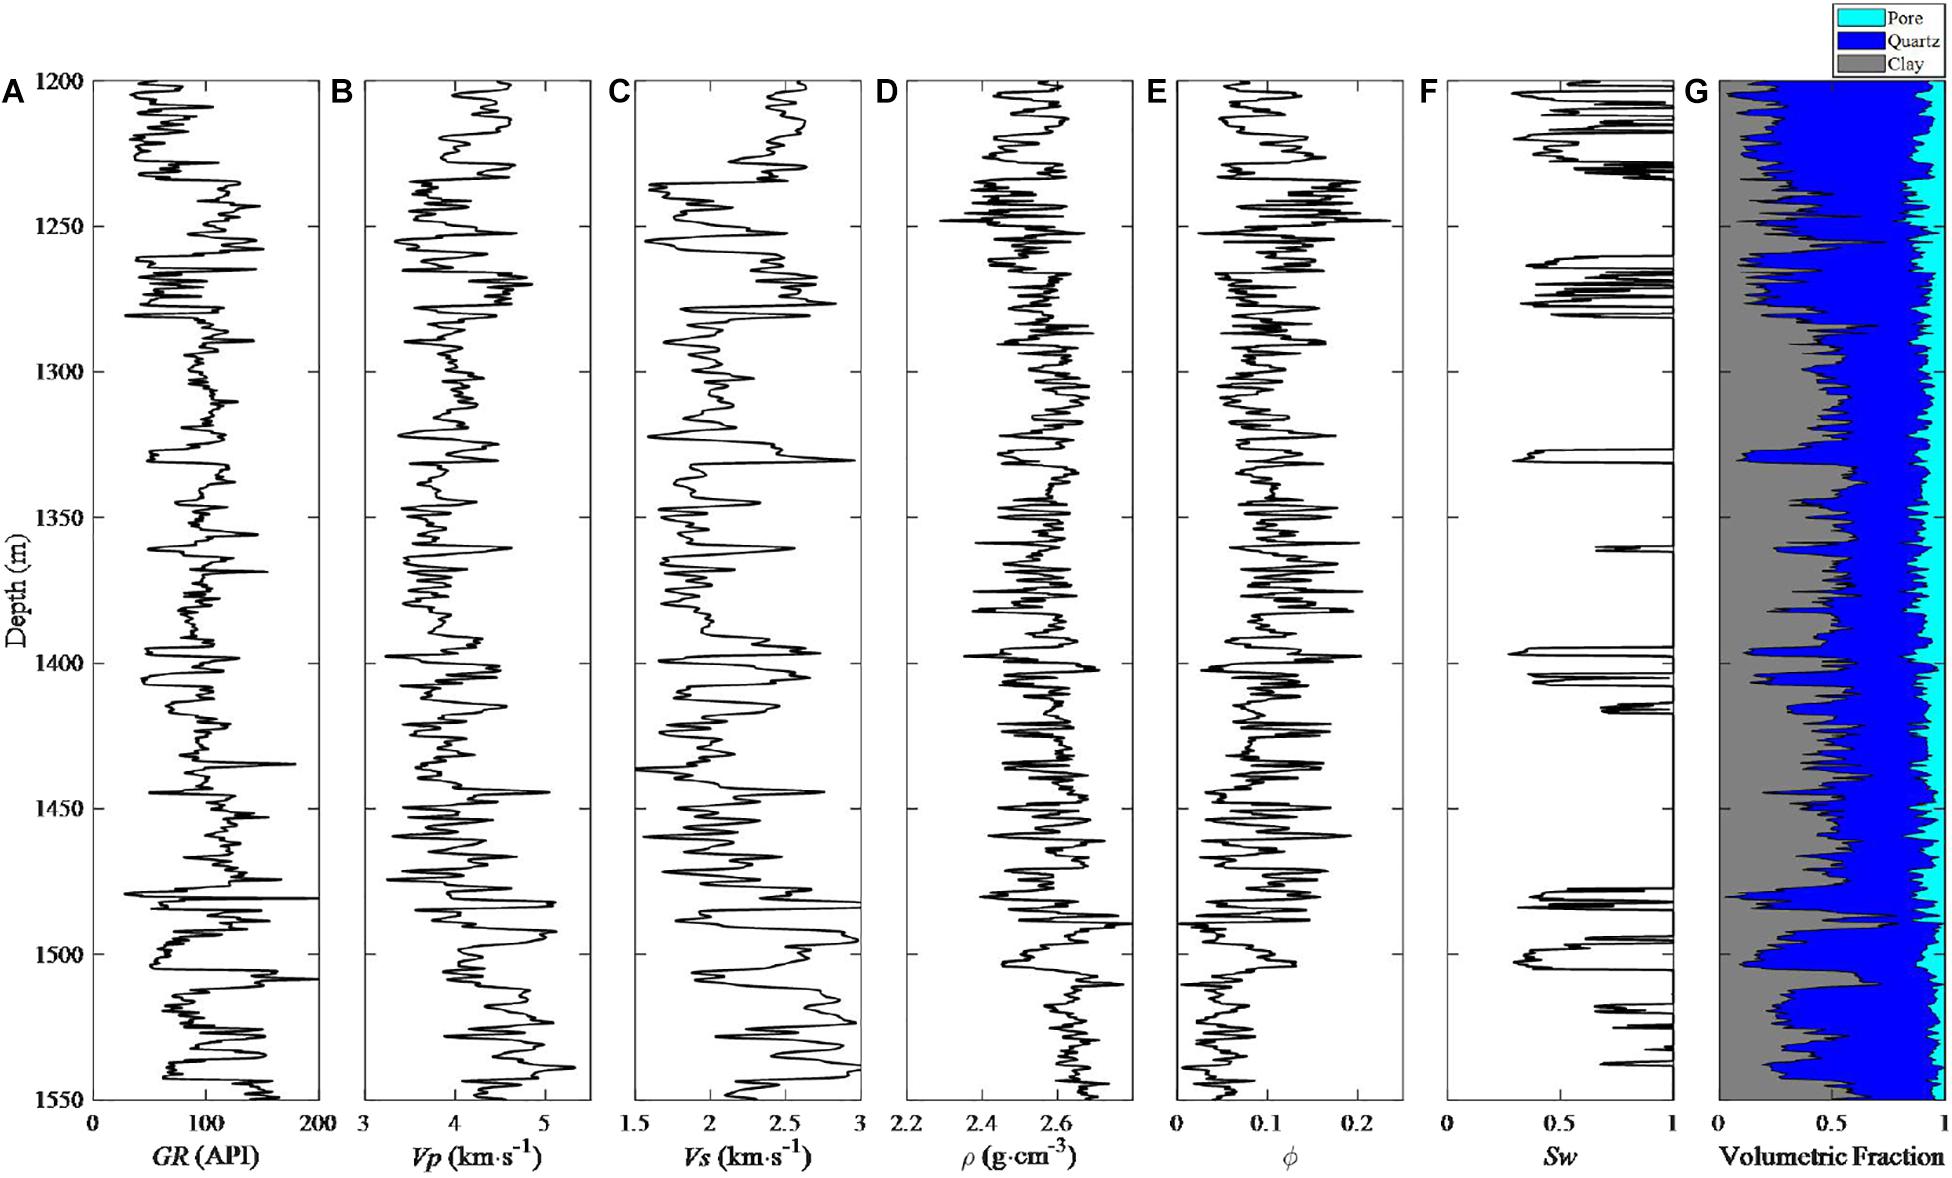
Figure 1. Logging data of the tight gas sandstone reservoirs in the Ordos Basin, China. (A) Gamma Ray. (B) P-wave velocity Vp. (C) S-wave velocity Vs. (D) Density ρ. (E) Porosity ϕ. (F) Water saturation Sw. (G) Volume fraction of compositions.
Using the logging data in Figures 1, 2 show the variations in P-wave velocity Vp and S-wave velocity Vs versus porosity ϕ for sandstone and mudstone in the strata. Although velocities generally decrease with increasing porosity, the data points represent certain degree of scatting distributions, which indicates that porosity is not the only factor that affected the elastic properties of the tight sandstone. According to the discussion given by Smith et al. (2009) and Ruiz and Cheng (2010), both the volume of pore space (porosity) and the distribution or geometry of the pore (such as aspect ratio) have an impact on the elastic modulus of the tight sandstone. Thus, it is necessary to establish rock physical models that consider complex pore structures to quantitatively predict elastic behaviors for tight sandstone reservoirs.
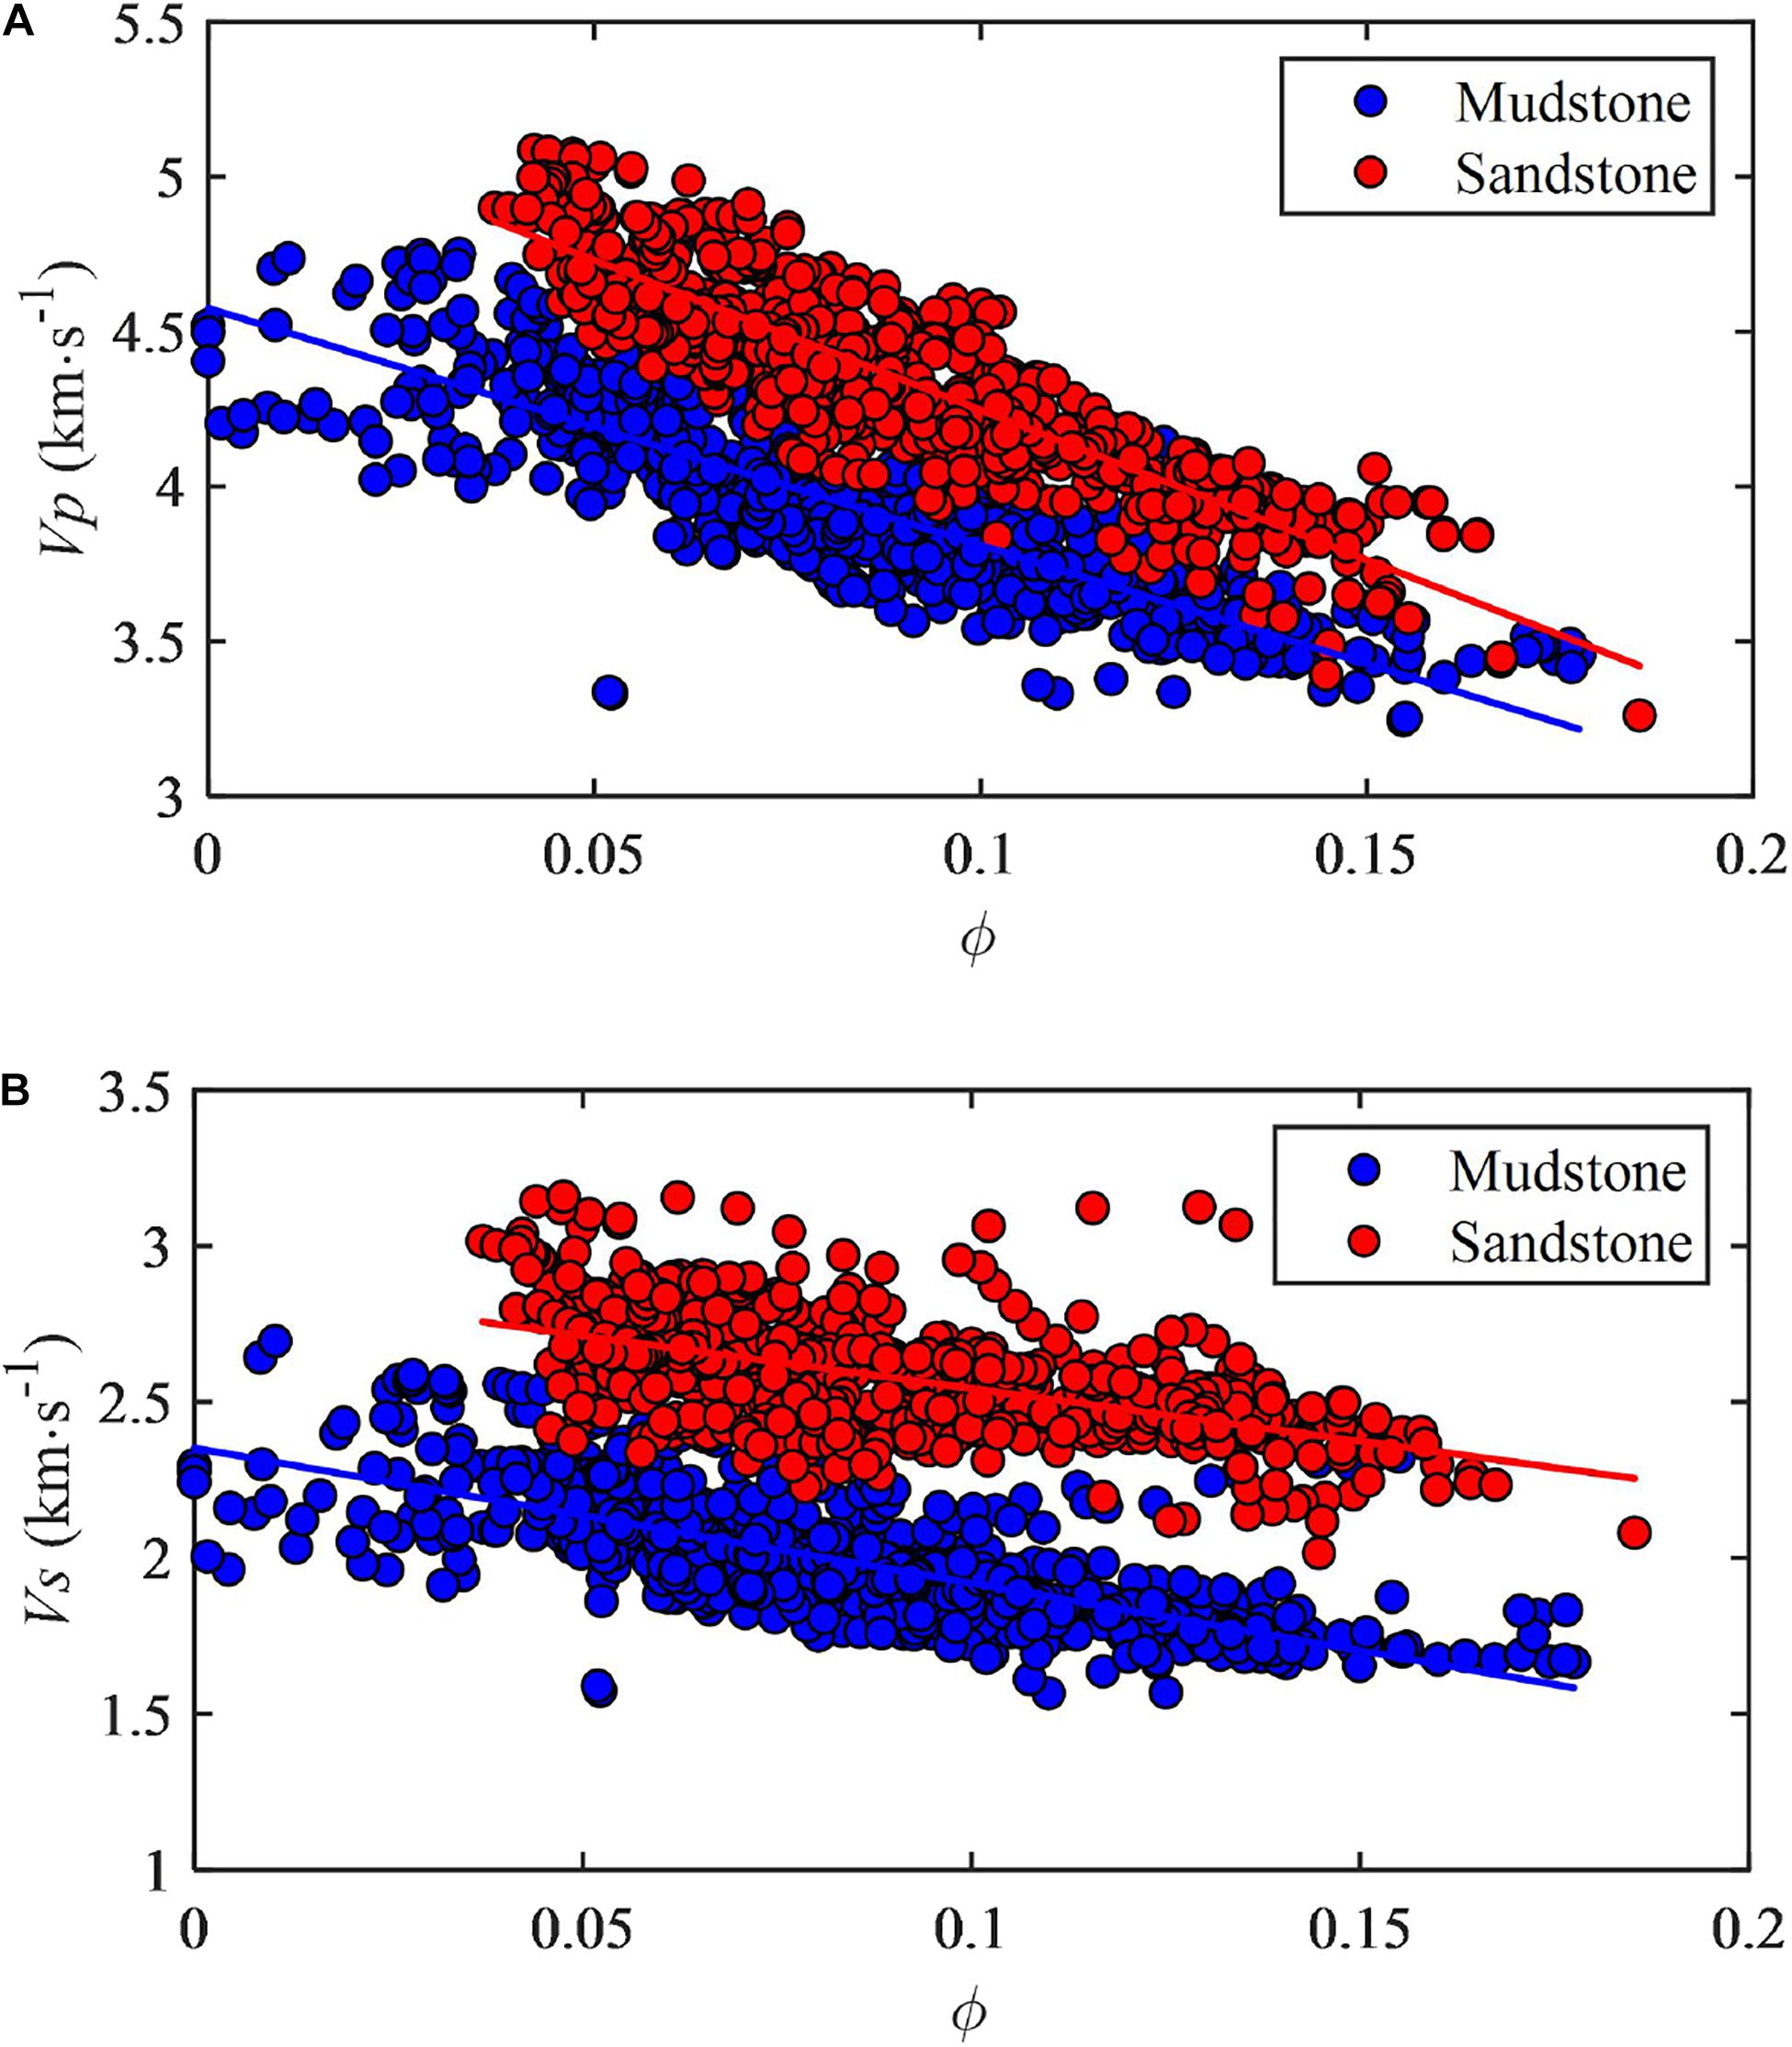
Figure 2. Cross plot of (A) P-wave velocity Vp versus ϕ and (B) S-wave velocity Vs versus ϕ.
Rock Physics Model
Theory
As illustrated by the schematic diagrams in Figure 3, we compare three methods for modeling heterogeneous pore structures of tight sandstone. Figure 3A shows the single pore-aspect-ratio model, where all pores have the same geometry represented by the pore aspect ratio. Figure 3B shows the dual-pore model, where the total porosity ϕTotal is equivalent to the combination of two parts, including the stiff pores with a porosity ϕStiff and soft pores with a porosity ϕSoft, that is, ϕTotal = ϕStiff + ϕSoft. The stiff pores are set to be spherical and have an aspect ratio αStiff = 1, whereas the soft pores are assumed to have an aspect ratio αSoft = 0.01. We use the fraction of soft pores in the total pore space, that is, fSoft = ϕSoft / ϕTotal, to represent heterogeneous distribution of the pore space in the dual-pore model.
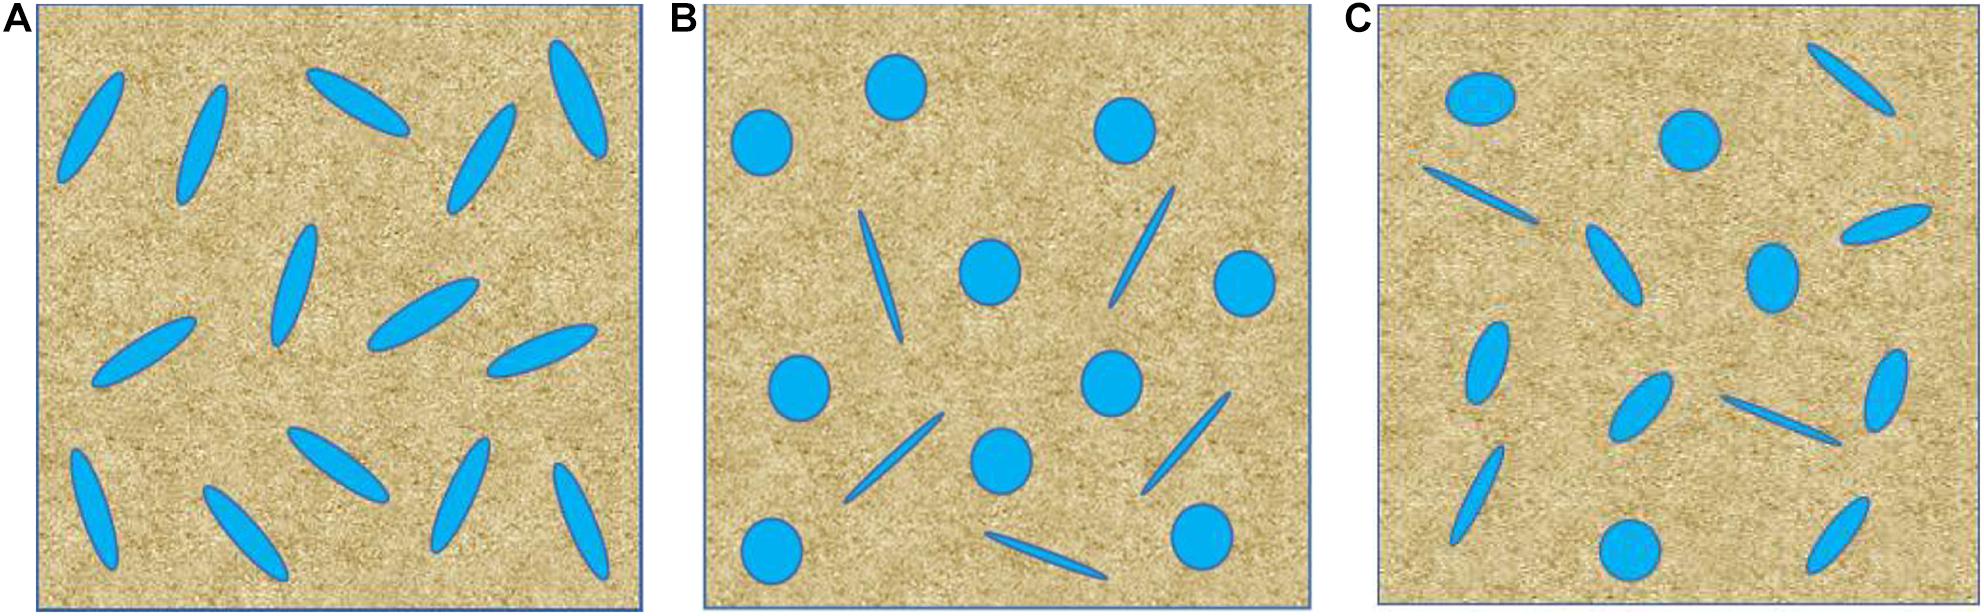
Figure 3. Schematics of rock physics models for tight sandstone: (A) single pore-aspect-ratio model, (B) dual-pore model, and (C) multiple pore-aspect-ratio model.
Figure 3C illustrates that the value of the pore aspect ratio is assumed to have the normal distribution. In this model, heterogeneous distributions of pore space are controlled by the mean value αM of the pore aspect ratio and corresponding variance αV. Accordingly, Figure 4 shows two cases of normal distribution of pore aspect ratio, where αM and αV are 0.4 and 0.01 for the first scenario, and 0.6 and 0.0001 for the second. A higher value of αM means that the pores tend to be round and a higher αV implies that the pore geometry has a wide range of shapes.
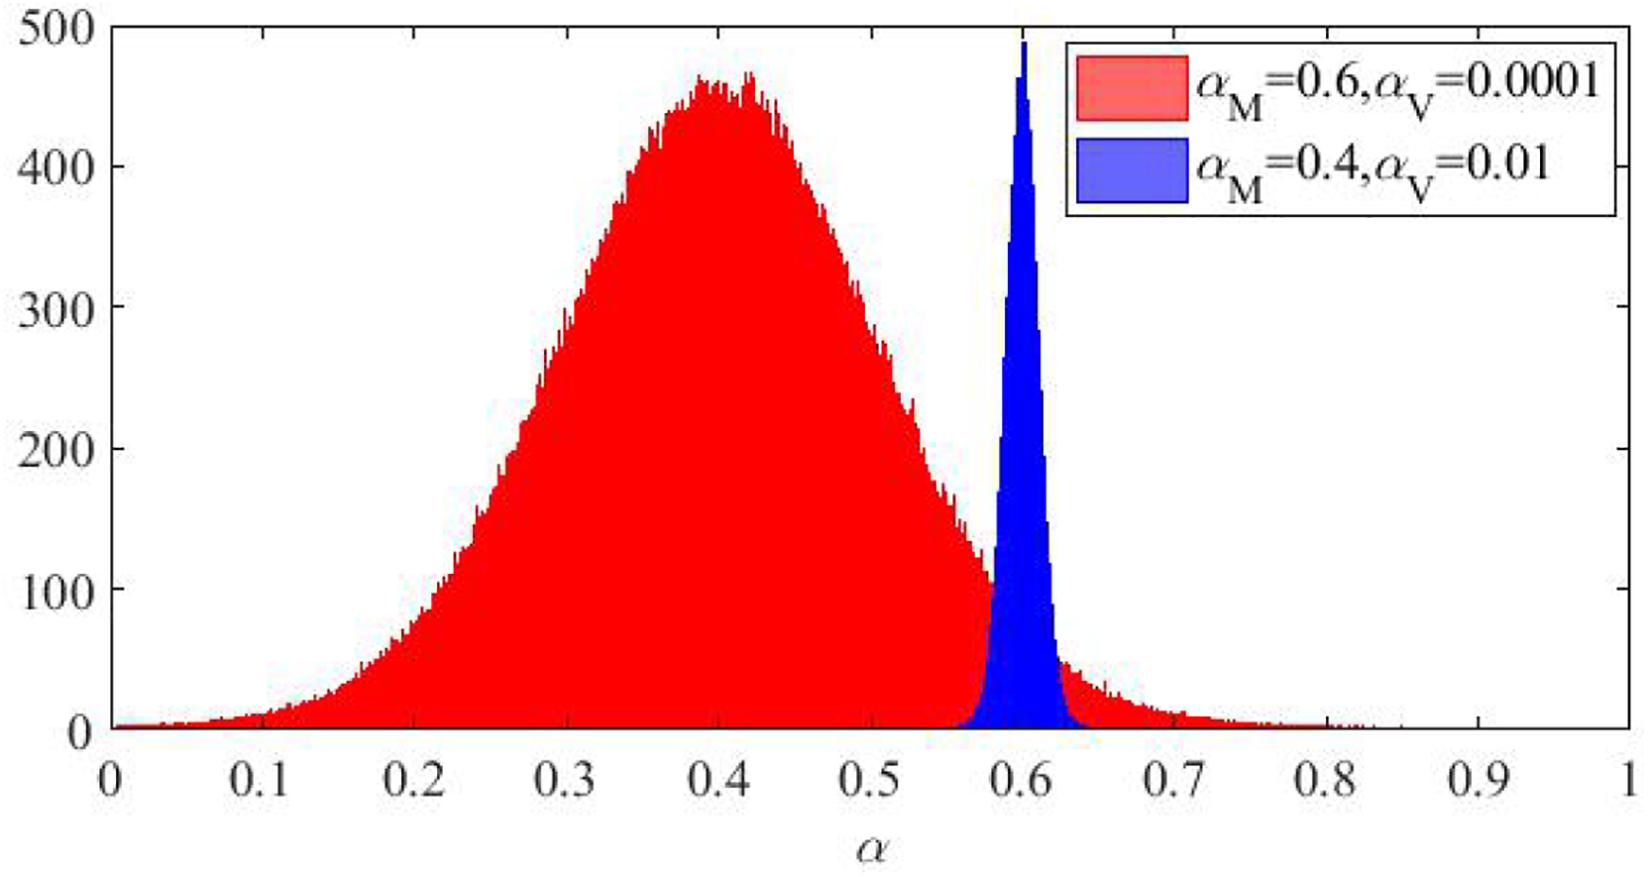
Figure 4. Histogram of normal distributions of pore aspect ratio quantified by αM and αV.
The rock physical methods for the three cases in Figure 3 are illustrated in Figure 5. In all the three models, we use the average of the Hashin–Shtrikman bounds (HSB) (Hashin and Shtrikman, 1963) to obtain elastic properties of solid matrix, and then apply the self-consistent approximation (SCA) method (Berryman, 1995; Mavko et al., 2009) to add pores with different geometries and distributions as discussed above. Elastic properties of minerals and fluids used in the rock physical model are given in Table 1.
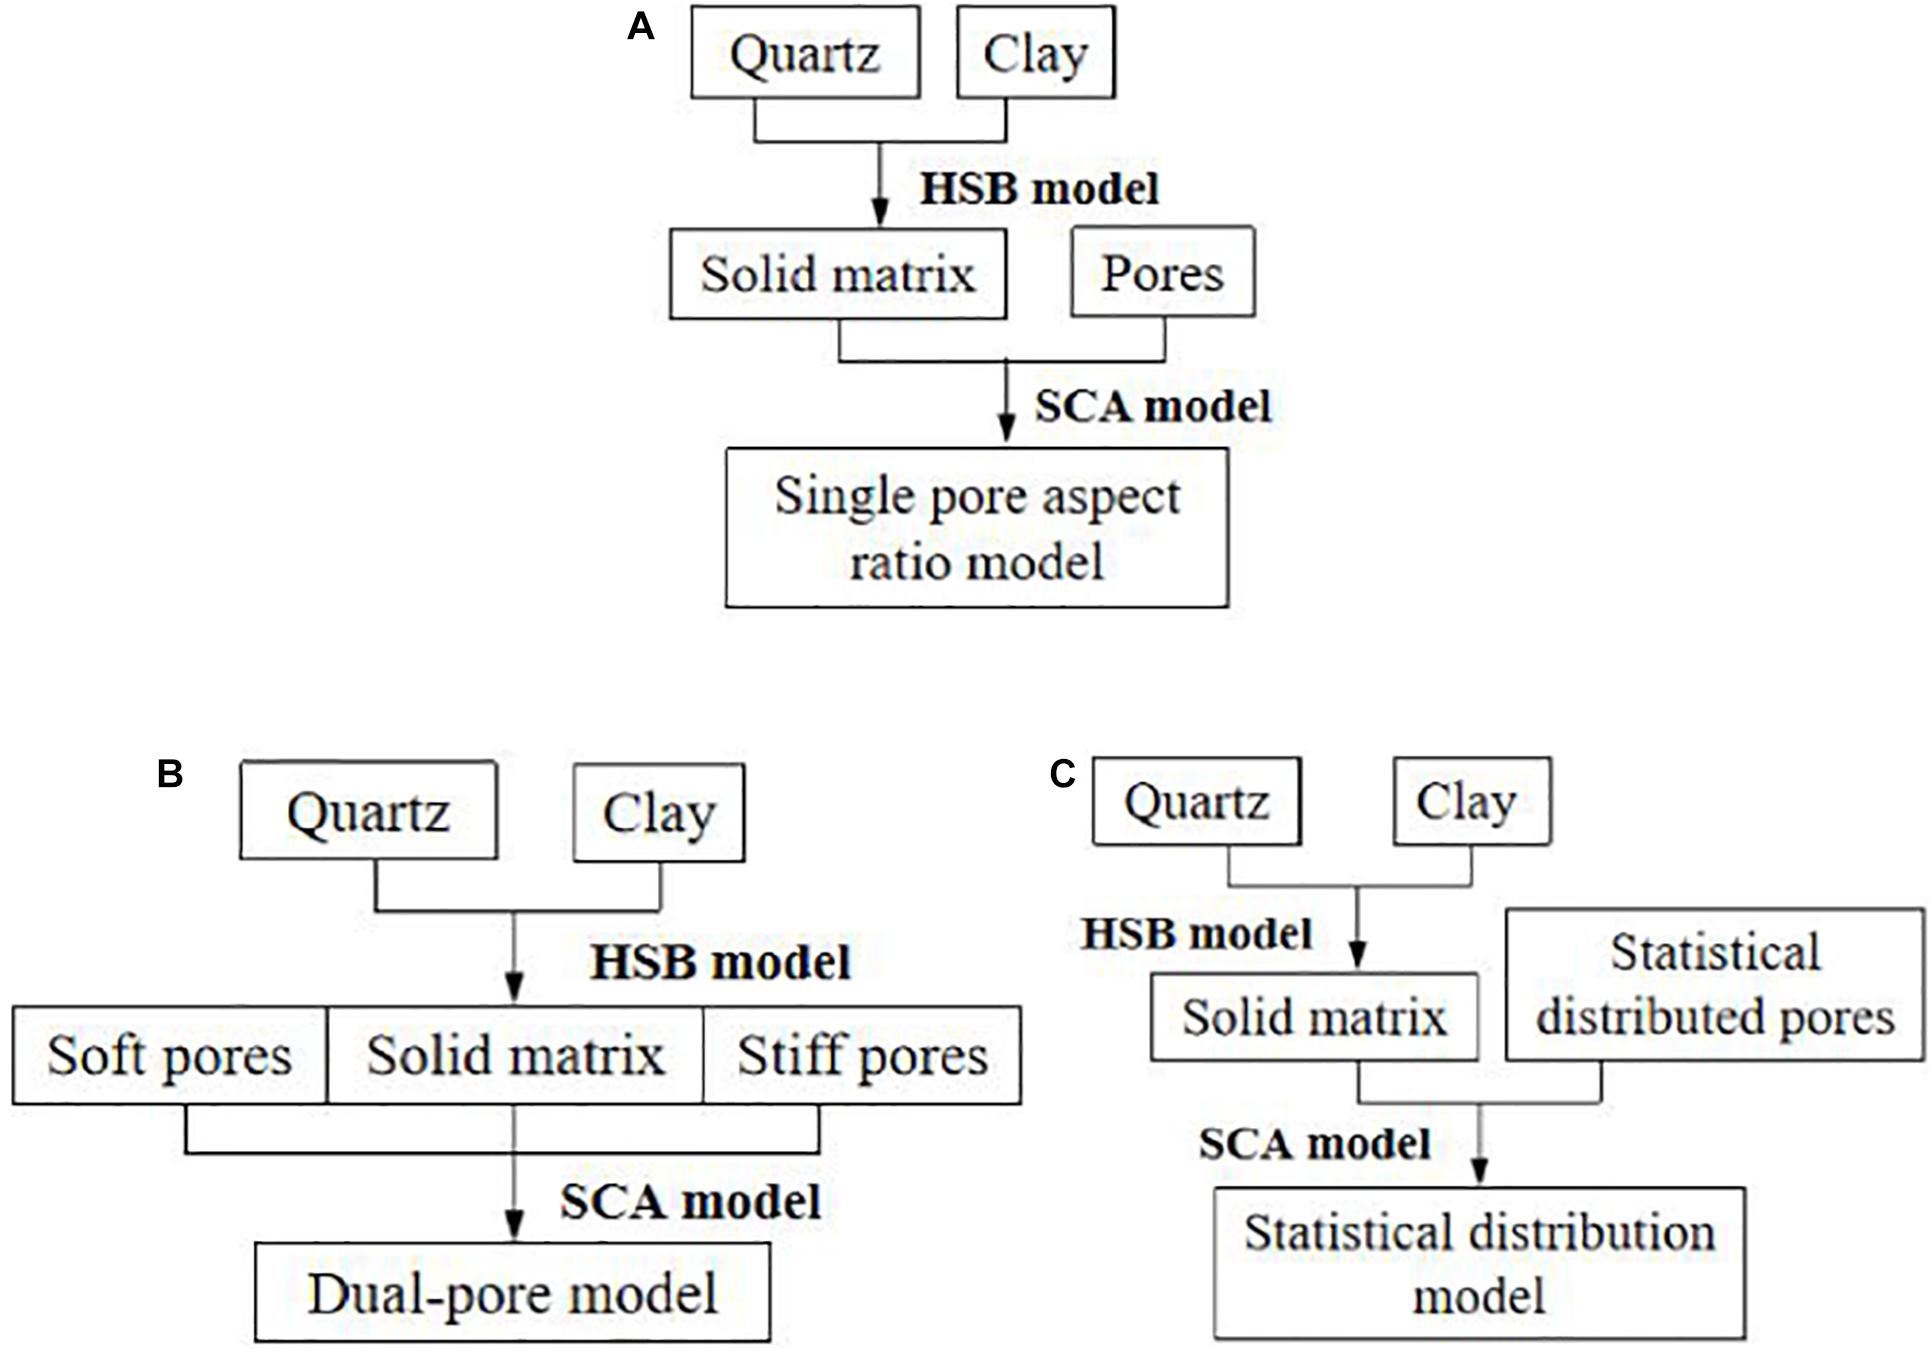
Figure 5. Workflow for the construction of rock physics models corresponding to Figure 3: (A) single pore-aspect-ratio model, (B) dual-pore model, and (C) multiple pore-aspect-ratio model.
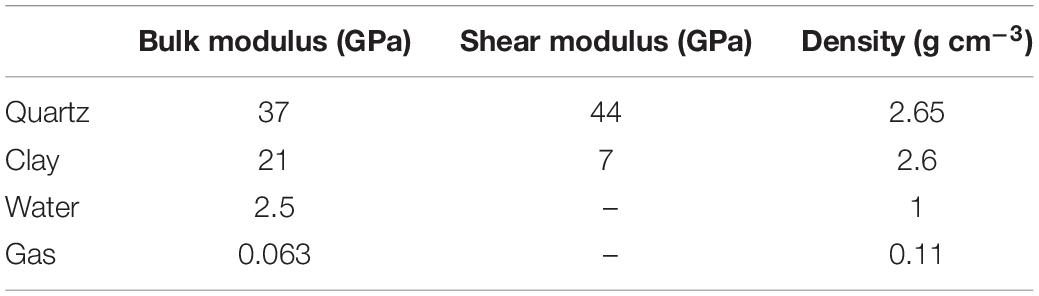
Table 1. Elastic properties of constituents used in the rock physical model.
For the construction of the rock physical models in Figure 5, the SCA theory for multi-phase media is as follows:
where j is the j-th material, fj is its volume fraction, Kj and µj represent the bulk modulus and shear modulus of the j-th component, K*SC and µSC* represent the calculated equivalent bulk modulus and shear modulus, and P*i and Q*i are geometric factors of the inclusion added to the background medium.
The bulk module of the fluid mixture consisting of gas and water is calculated by the Wood (1955) theory, as follows:
where K_w and K_g are bulk modulus of water and gas, respectively, S_w and S_g are water and gas saturation, respectively.
The density of the fluid mixture is as follows:
where ρw and ρg are the densities of water and gas, respectively.
Rock Physical Modeling
Figures 6A,B show the Vp and Vs varying with pore aspect ratio α and porosity ϕ for the single pore-aspect-ratio model of the tight sandstone. It can be observed that Vp and Vs decrease rapidly with increasing porosity, especially for lower-valued pore aspect ratio α, because the presence of elongated pores can dramatically reduce the elastic modulus of rocks.
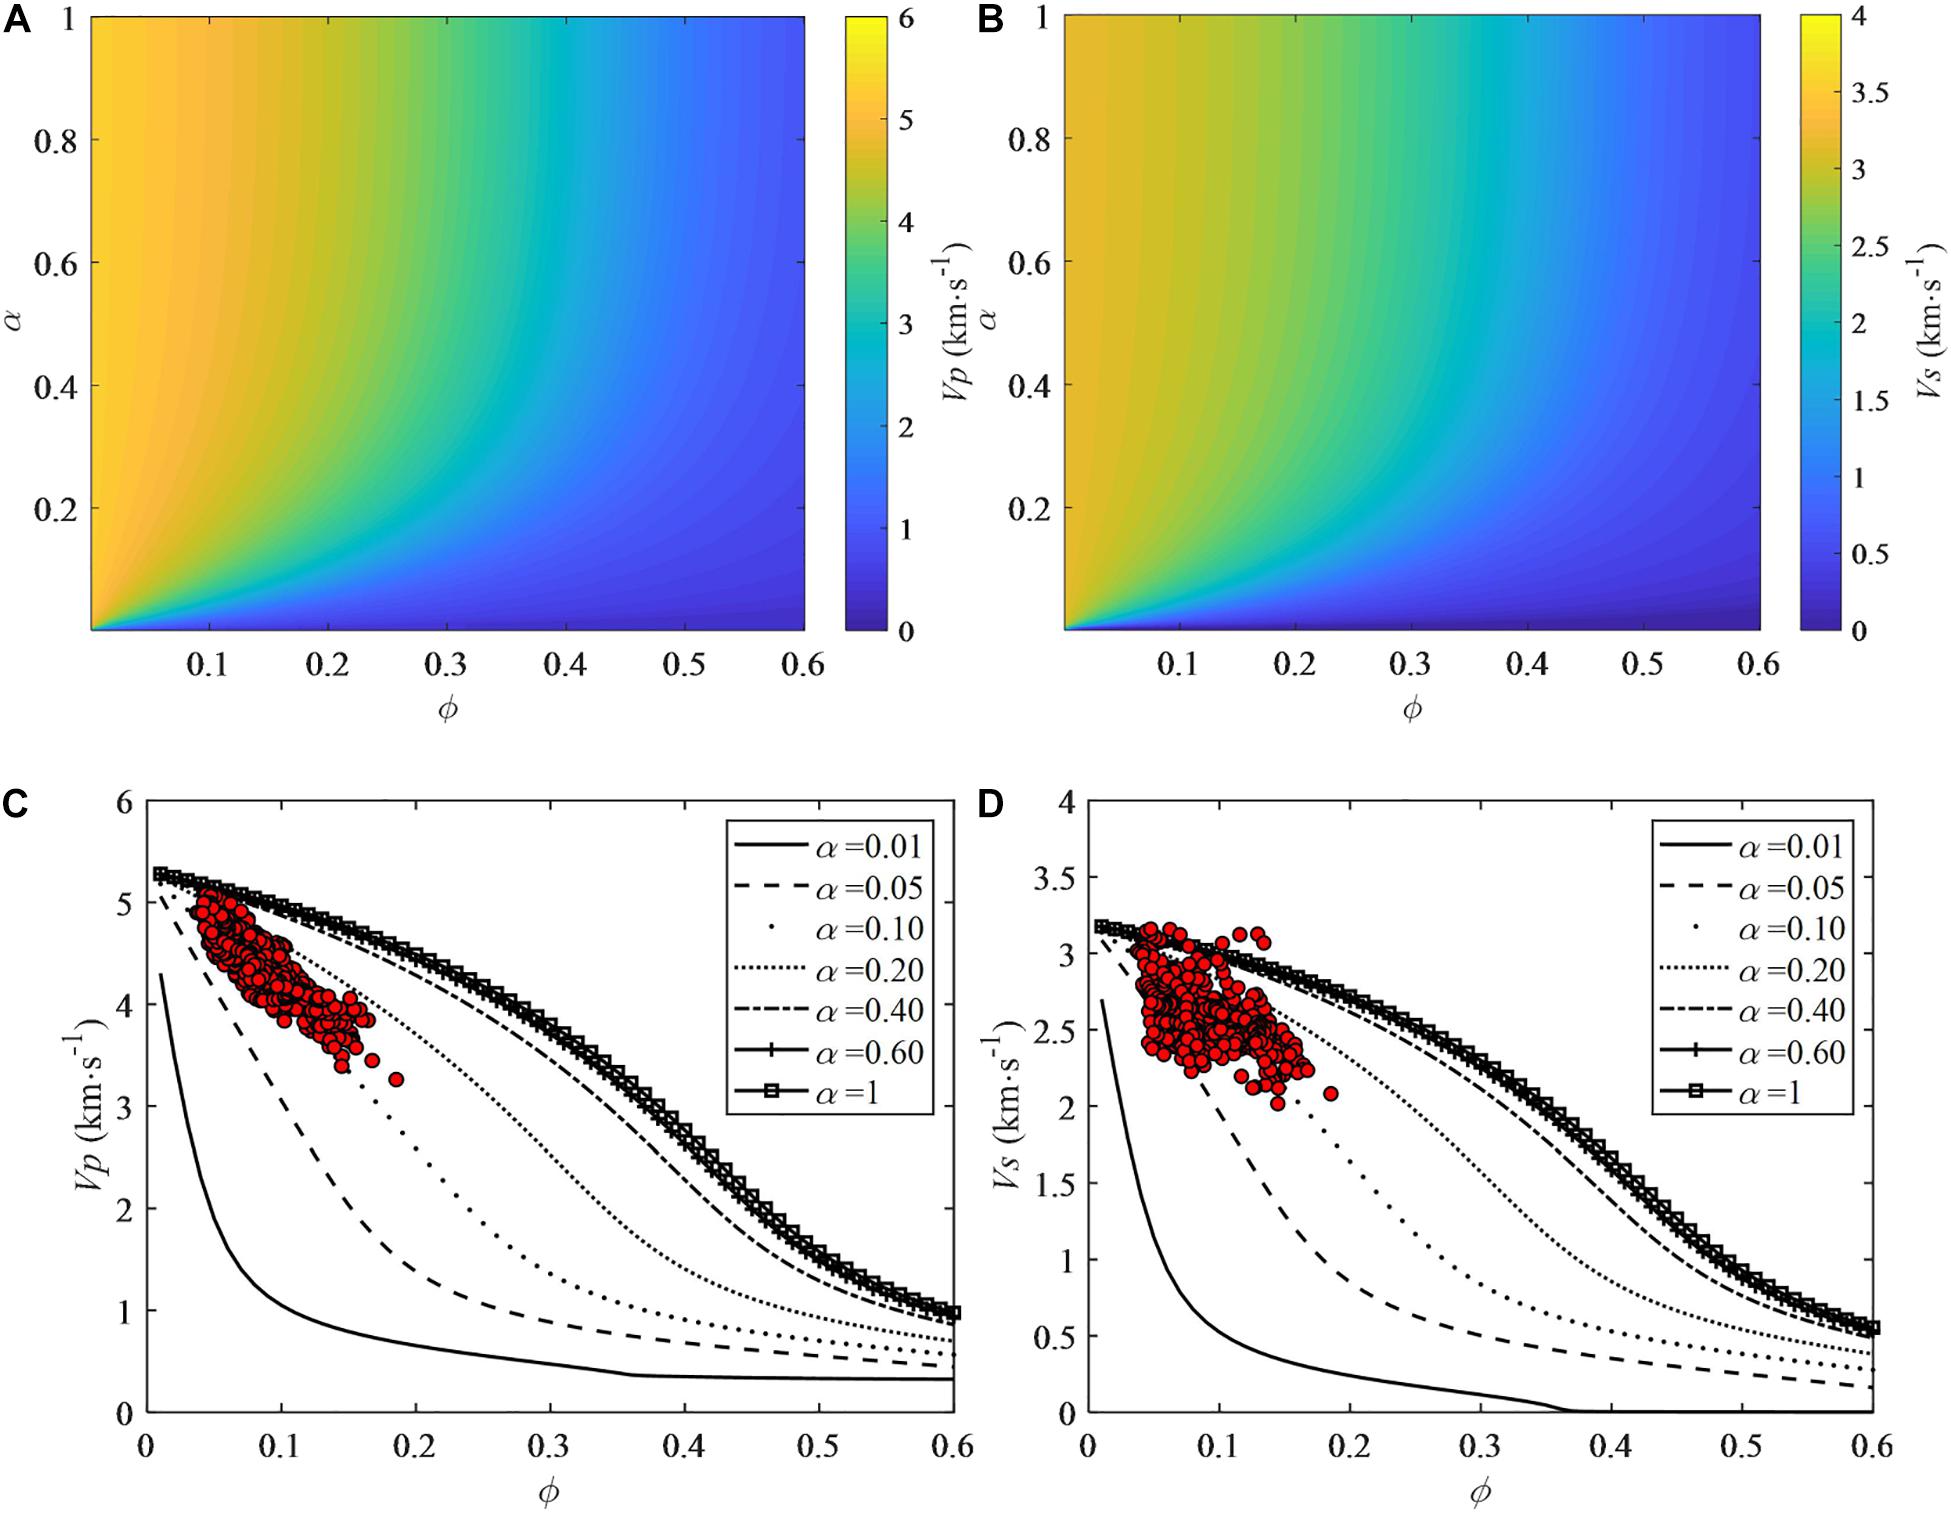
Figure 6. (A) P-wave velocity Vp and (B) S-wave velocity Vs varying with pore aspect ratio α and porosity ϕ for the single pore-aspect-ratio model of the tight sandstone. (C) P-wave velocity Vp and (D) S-wave velocity Vs varying with porosity ϕ for a series of pore aspect ratio α for the single pore-aspect-ratio model with logging data from the target zone overlapped.
Accordingly, Figures 6C,D illustrate calculated Vp and Vs varying with porosity ϕ for a set of pore aspect ratio α that has a value ranging from 0.05 to 0.2. Corresponding logging data from the target zone are overlapped. The relationship between Vs and ϕ is more scattered compared with the relationship between Vp and ϕ.
In Figures 7A,B, the presence of small amount of soft pores can dramatically reduce velocities of the tight sandstone. Accordingly, Figures 7C,D indicates that the parameter fSoft ranges from 0.05 to 0.2 for the Vp data and from 0.05 to 0.4 for the Vs data for the interpretation of the velocity-porosity relationships.
Figure 7. (A) P-wave velocity Vp and (B) S-wave velocity Vs varying with the proportion of soft pore fsoft and porosity ϕ for the dual-pore model of the tight sandstone. (C) P-wave velocity Vp and (D) S-wave velocity Vs varying with porosity ϕ for a series of parameter fsoft for the dual-pore model with logging data from the target zone overlapped.
Similarly, Figures 8A,B show velocities that change for varied mean value αM and variance αV of pore aspect ratio in the multiple pore-aspect-ratio model. A higher value of αM corresponds to the presence of more spherical pores and thus results in higher modulus and velocities. The value of αV denotes the spread range of the pore aspect ratio, and a higher αV means more heterogeneity of pore geometry distribution. For a specific value of αM, the increase in αV reduces velocities.
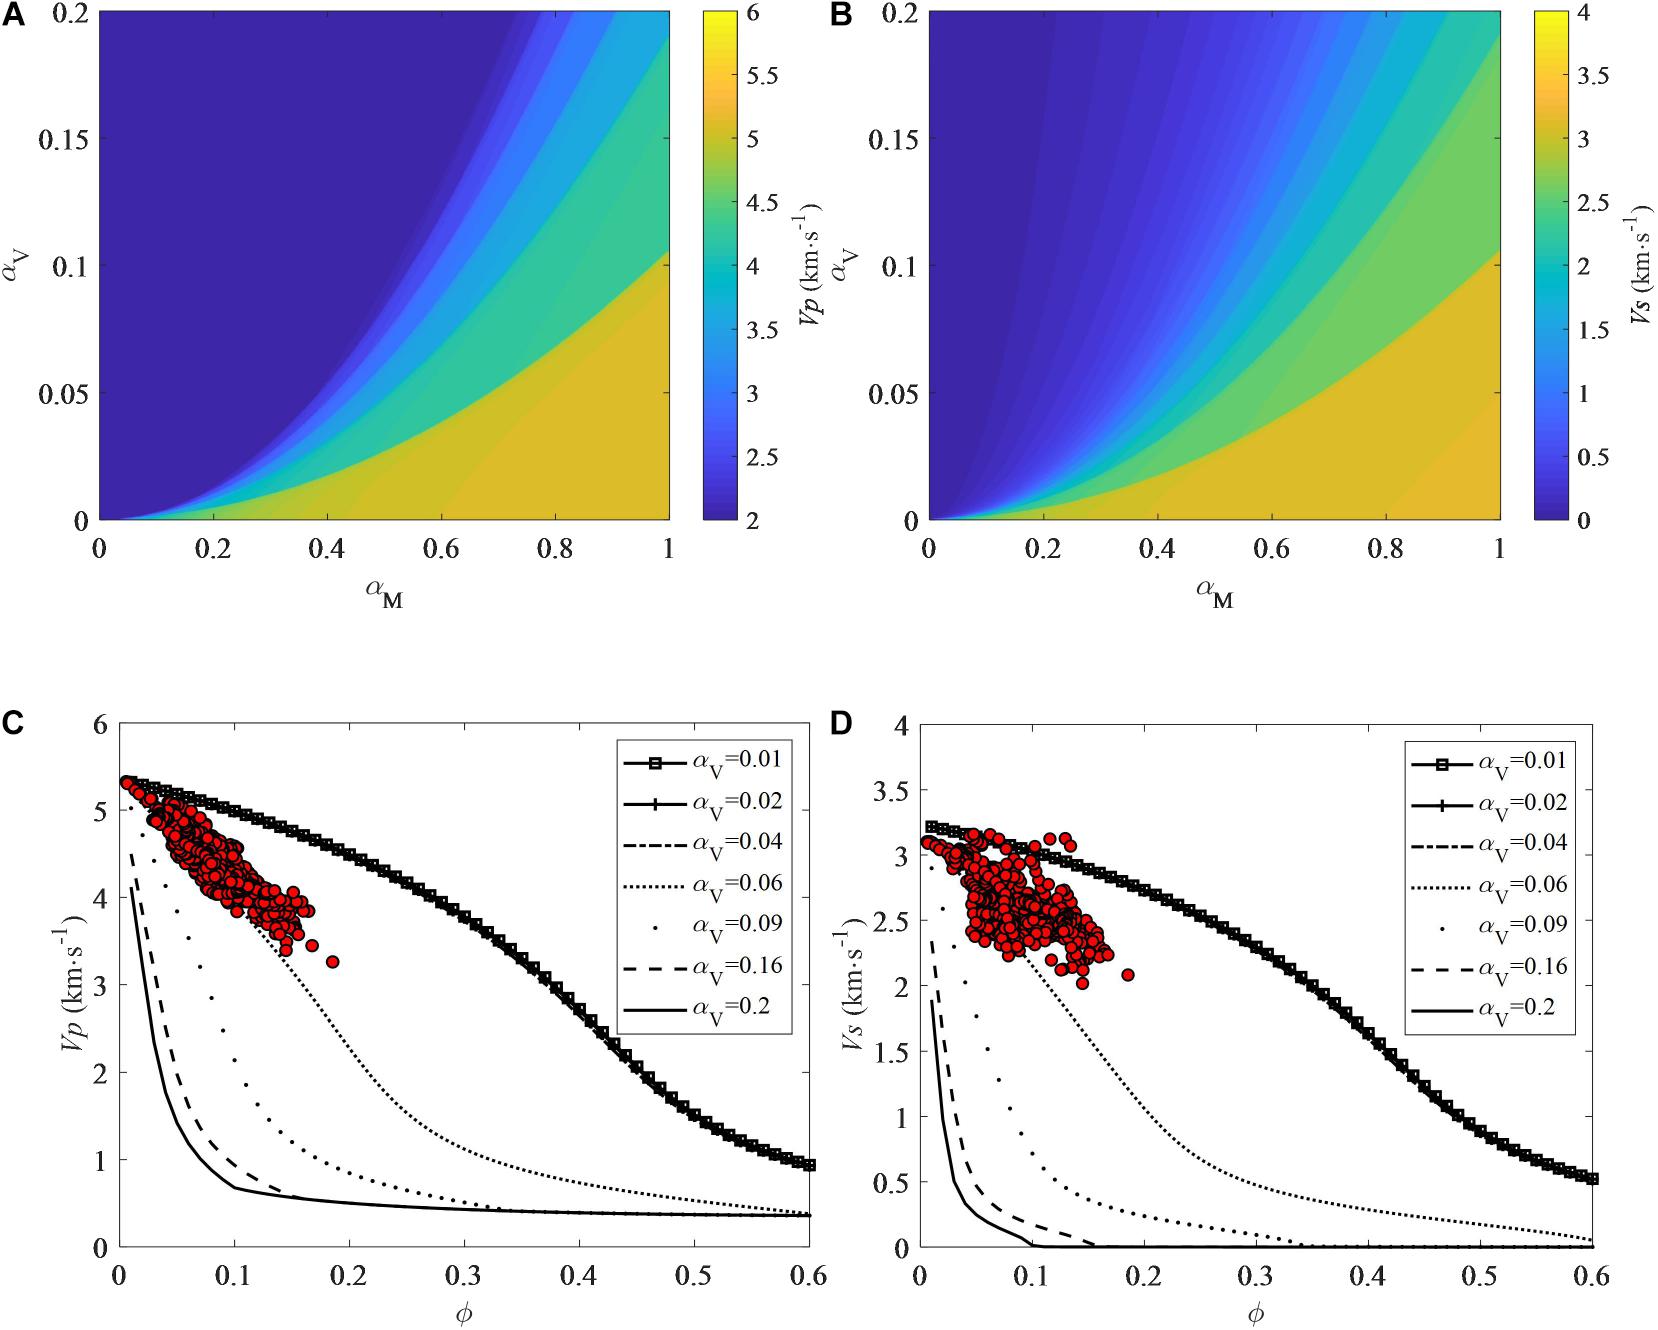
Figure 8. (A) P-wave velocity Vp and (B) S-wave velocity Vs varying with mean value αM and variance αV of pore aspect ratio for the normal distribution model of the tight sandstone. (C) P-wave velocity Vp and (D) S-wave velocity Vs varying with porosity ϕ for a series of values of αV with the assumption αM = 0.75 in the normal distribution model with logging data from the target zone overlapped.
In Figures 8C,D, we assume αM = 0.75 in the tight sandstone. We find that αV should vary from 0.01 and 0.06 to interpret the velocity-porosity relationships of the overlapped logging data.
Figures 6–8 show rock physical modeling using the constructed models in Figure 5, where the procedures for calculation are described in details. The purpose of the rock physical modeling is to illustrate how the porosity and pore geometry parameters influence the Vp and Vs. As shown in Figures 6–8, it means that the model can interpret the data if the overlapped data fall into the ranges covered by the calculated curves. Then, it is feasible to conduct rock physical inversion to estimate pore geometry parameter as shown in Figure 9.
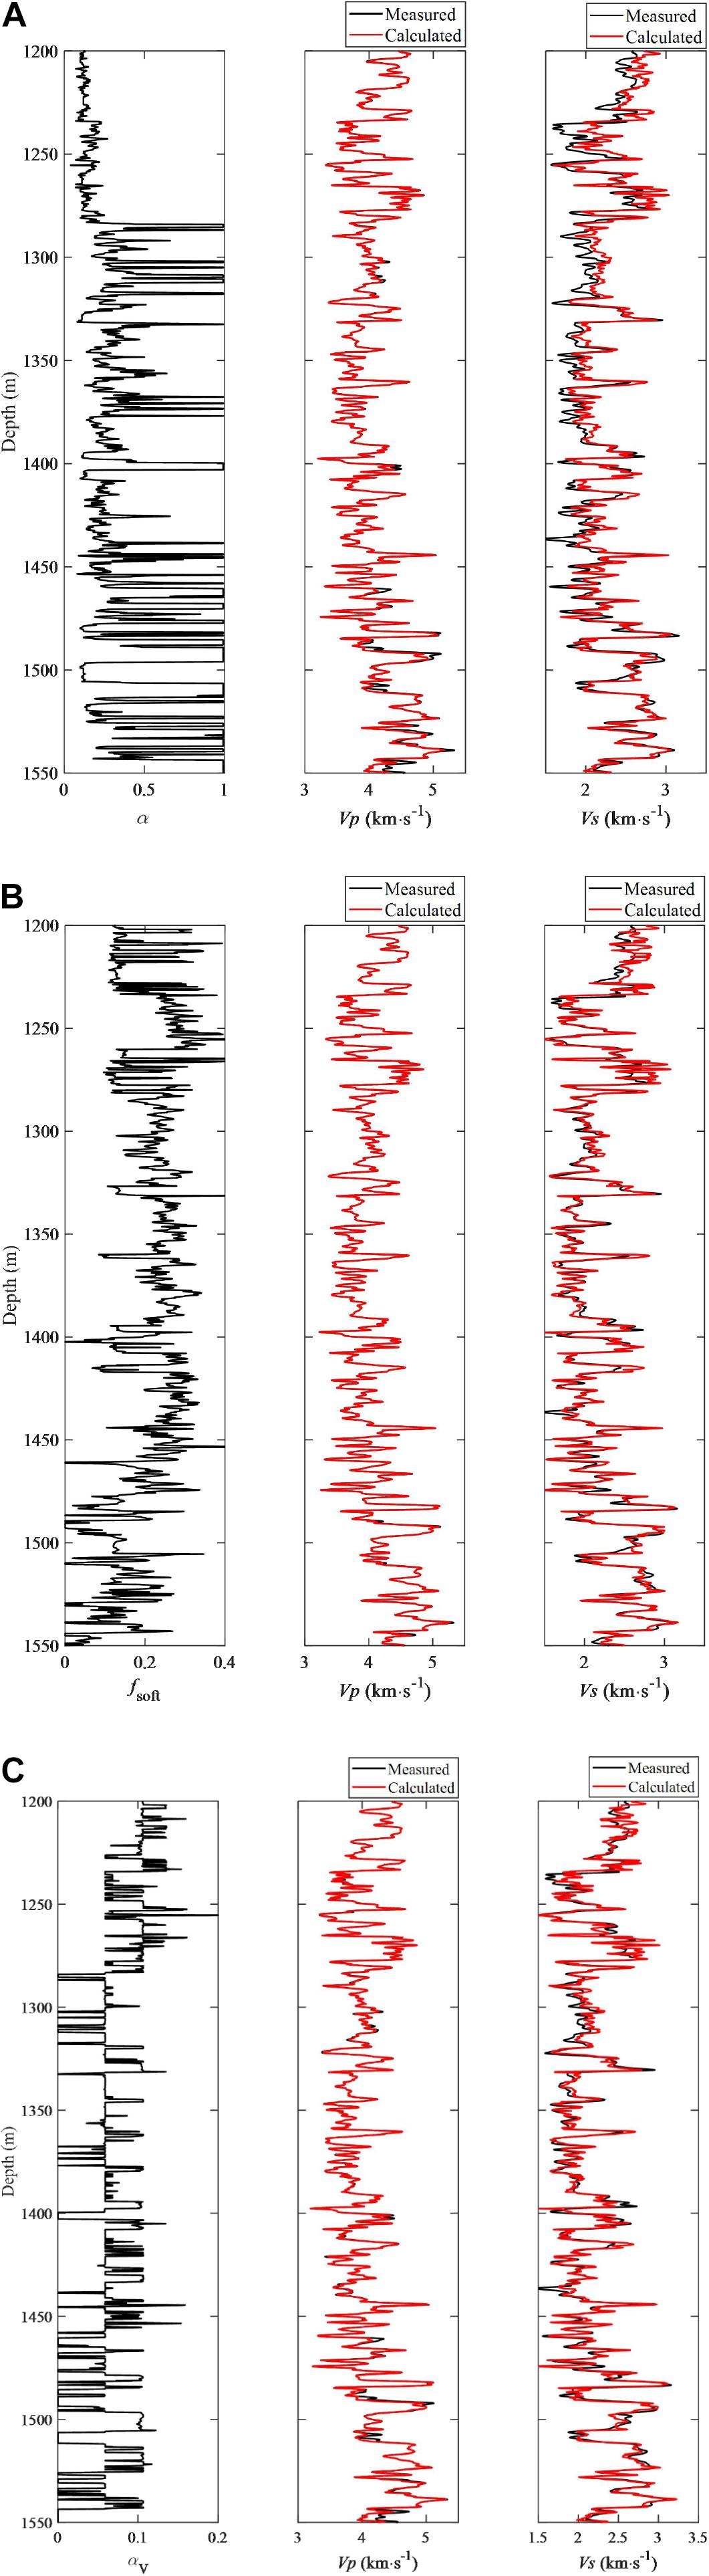
Figure 9. (A) Inverted pore aspect ratio, estimated Vp and Vs by the single pore-aspect-ratio model. (B) Inverted proportion of soft pores, estimated Vp and Vs by the dual-pore model. (C) Inverted variance of pore aspect ratio, estimated Vp and Vs by the multiple pore-aspect-ratio. Black curves are the measured logging data while and red curves show the predicted results.
Vs Prediction Using the Built Rock Physics Models
On the basis of the constructed rock physics models shown in Figure 5, we predict S-wave velocity Vs, when the information of porosity, mineral compositions, and fluid saturation is known as illustrated in Figure 1.
According to the method by Guo and Li (2015), we find the best fit parameters, including pore aspect ratio α, the proportion of soft pores fsoft, and the variance of pore aspect ratio αV in the three models by adjusting the values of them to minimize the absolute difference between the P-wave velocities Vp measured in the well and those calculated by the rock physics models in Figure 5. The S-wave velocities Vs calculated by the estimated α, fsoft and αV are regarded as the predicted values.
Figures 9A–C show the prediction results from the three rock physics models, where all of the prediction results provide reasonable estimates of Vs. The correlation coefficients between the predicted and measured Vs are 0.9077, 0.9375, and 0.9277, respectively. As illustrated in Figure 9B, the inversion based on the dual-pore model generates the best result for the Vs prediction. Theoretically, the multiple pore-aspect-ratio model in Figure 5C may work better, as there always exists a certain normal distribution of the multiple pore-aspect-ratio in the model to fit the true scenario. However, it may takes too many parameters to determine, which is unlikely to realize. Comparatively, the dual-pore model shows the advantage to obtain a relatively fine and stable result without solving too many parameters.
Elastic Modulus of Dry Frame of Tight Sandstone
Calculation of Elastic Modulus for Dry Frame
The elastic modulus of rock skeleton that are determined by minerals, porosity, and pore structures are the key input parameters for various rock physical theories, including the Gassmann fluid substitution theory (Gassmann, 1951), the Biot theory (Biot, 1955) and the BISQ theory (Dvorkin and Nur, 1993; Dvorkin et al., 1994).
Although the elastic modulus of the rock skeleton can be obtained through laboratory measurements of specimens, it is difficult to estimate these properties for in situ underground formations. Empirical formulas usually are used to estimate elastic modulus of the dry frame.
Based on the experimental data from Raymer et al. (1980); Krief et al. (1990) proposed the nonlinear empirical relationships between the rock skeleton modulus and porosity, as shown by the followings:
where K0 and μ0 are the bulk and shear modulus of the solid matrix, respectively, and φ is porosity. Empirical parameter m generally ranges from 0 to 10, which is related to porosity, pressure, temperature, clay content, and other lithology factors (Han et al., 1986).
Because these empirical relationships between elastic modulus of rock skeleton and porosity were established based on data from specific study areas, it may limit the application of the methods to other field data which represent different lithology or microstructures.
In this work, based on the inverted results of pore structures using the dual-pore model shown in Figure 9B, we can calculate the elastic modulus of rock skeleton in a manner that represents more physical meaning. We conduct rock physical modeling to calculate the elastic modulus of rock skeleton by using the inverted values of pore structure parameter fsoft, and by setting the bulk and shear modulus of the pore fillings to 0. The calculation results are shown in Figure 10.
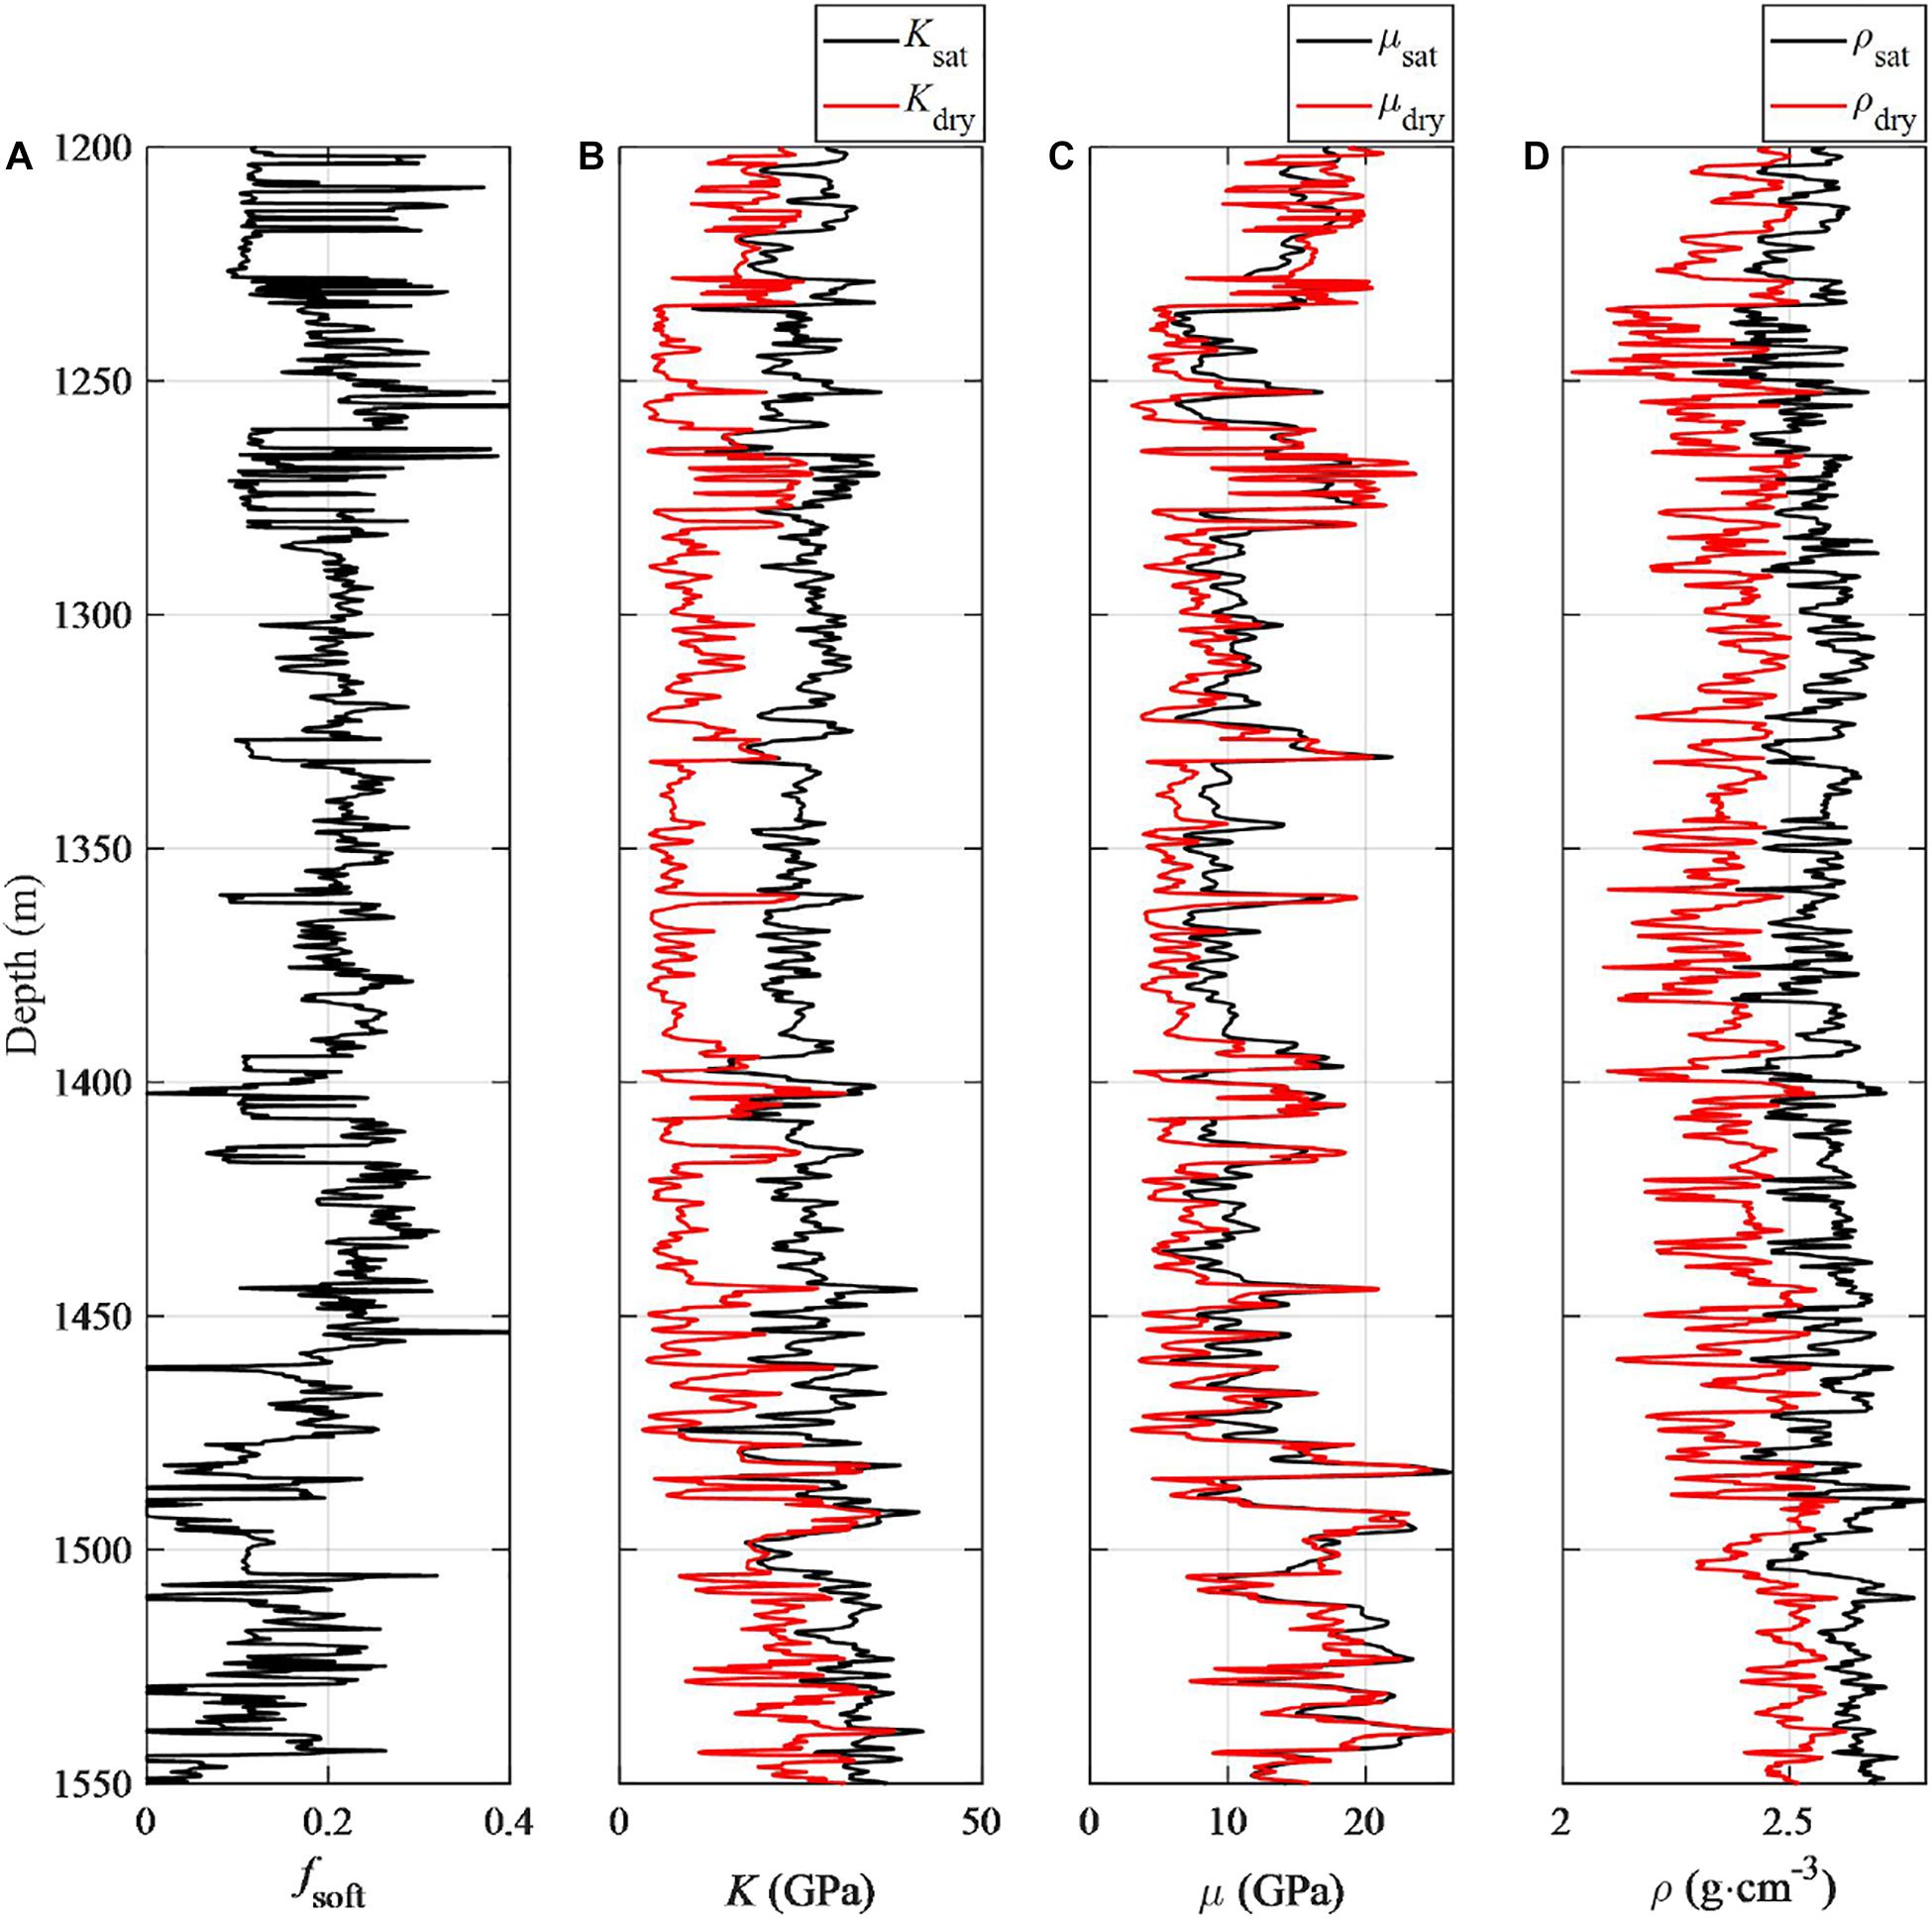
Figure 10. (A) Inverted soft pore fraction fsoft as given by Figure 9; (B) bulk modulus and (C) shear modulus of rock skeleton, and (D) density. Red curves show the calculated values while the black curves denote measured logging data.
Data points in Figure 11 show the elastic modulus of skeleton predicted by the method presented discussed above. Curves in Figure 11 are the elastic modulus estimated by the Krief empirical formulas in Eqs 5 and 6. Due to the presence of complex pore structure in tight sandstone, the relationship between the modulus of the skeleton and porosity are scattering and thus cannot be well described by adjusting the empirical parameter m in the Krief theory.
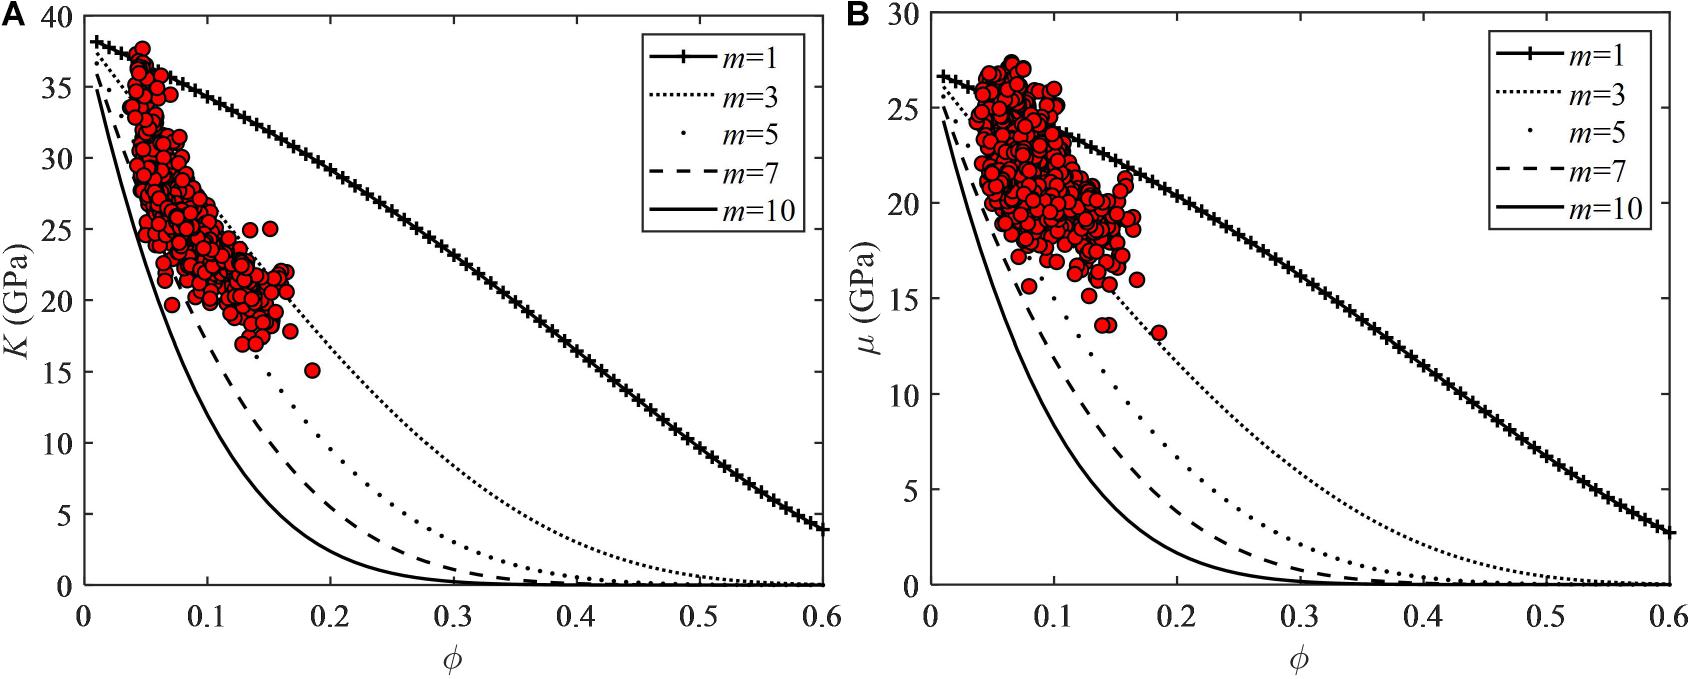
Figure 11. Crossplot of (A) rock skeleton bulk modulus K versus porosity ϕ and (B) rock skeleton shear modulus μ versus porosity ϕ. Data points indicate elastic modulus calculated by the dual-pore model and curves show the elastic properties modeled by the Krief’s empirical relationship.
Comparatively, the methods presented in this study have considered the influence of minerals, porosity, and pore structures in the calculation of the elastic modulus of dry frame, which show more physical meaning compared to the Krief empirical relations.
Analysis on Elastic Properties of Dry Frame
Figure 12A is the crossplot of the Poisson’s ratio versus porosity of the fluid-saturated tight sandstone from the logging data in Figure 1. In Figure 12A, the Poisson’s ratio of tight sandstone is mainly between 0.2 and 0.3 when the porosity is less than 0.1. Porosity that is greater than 0.1 corresponds to higher gas saturation and relatively lower Poisson’s ratio. Figure 12B is the crossplot of the Poisson’s ratio versus porosity of the rock skeleton of the same sandstone, with calculated elastic modulus of the rock skeleton shown in Figure 10. In Figure 12B, it is found that the Poisson’s ratio of the rock skeleton of the sandstone decreases with increasing porosity.
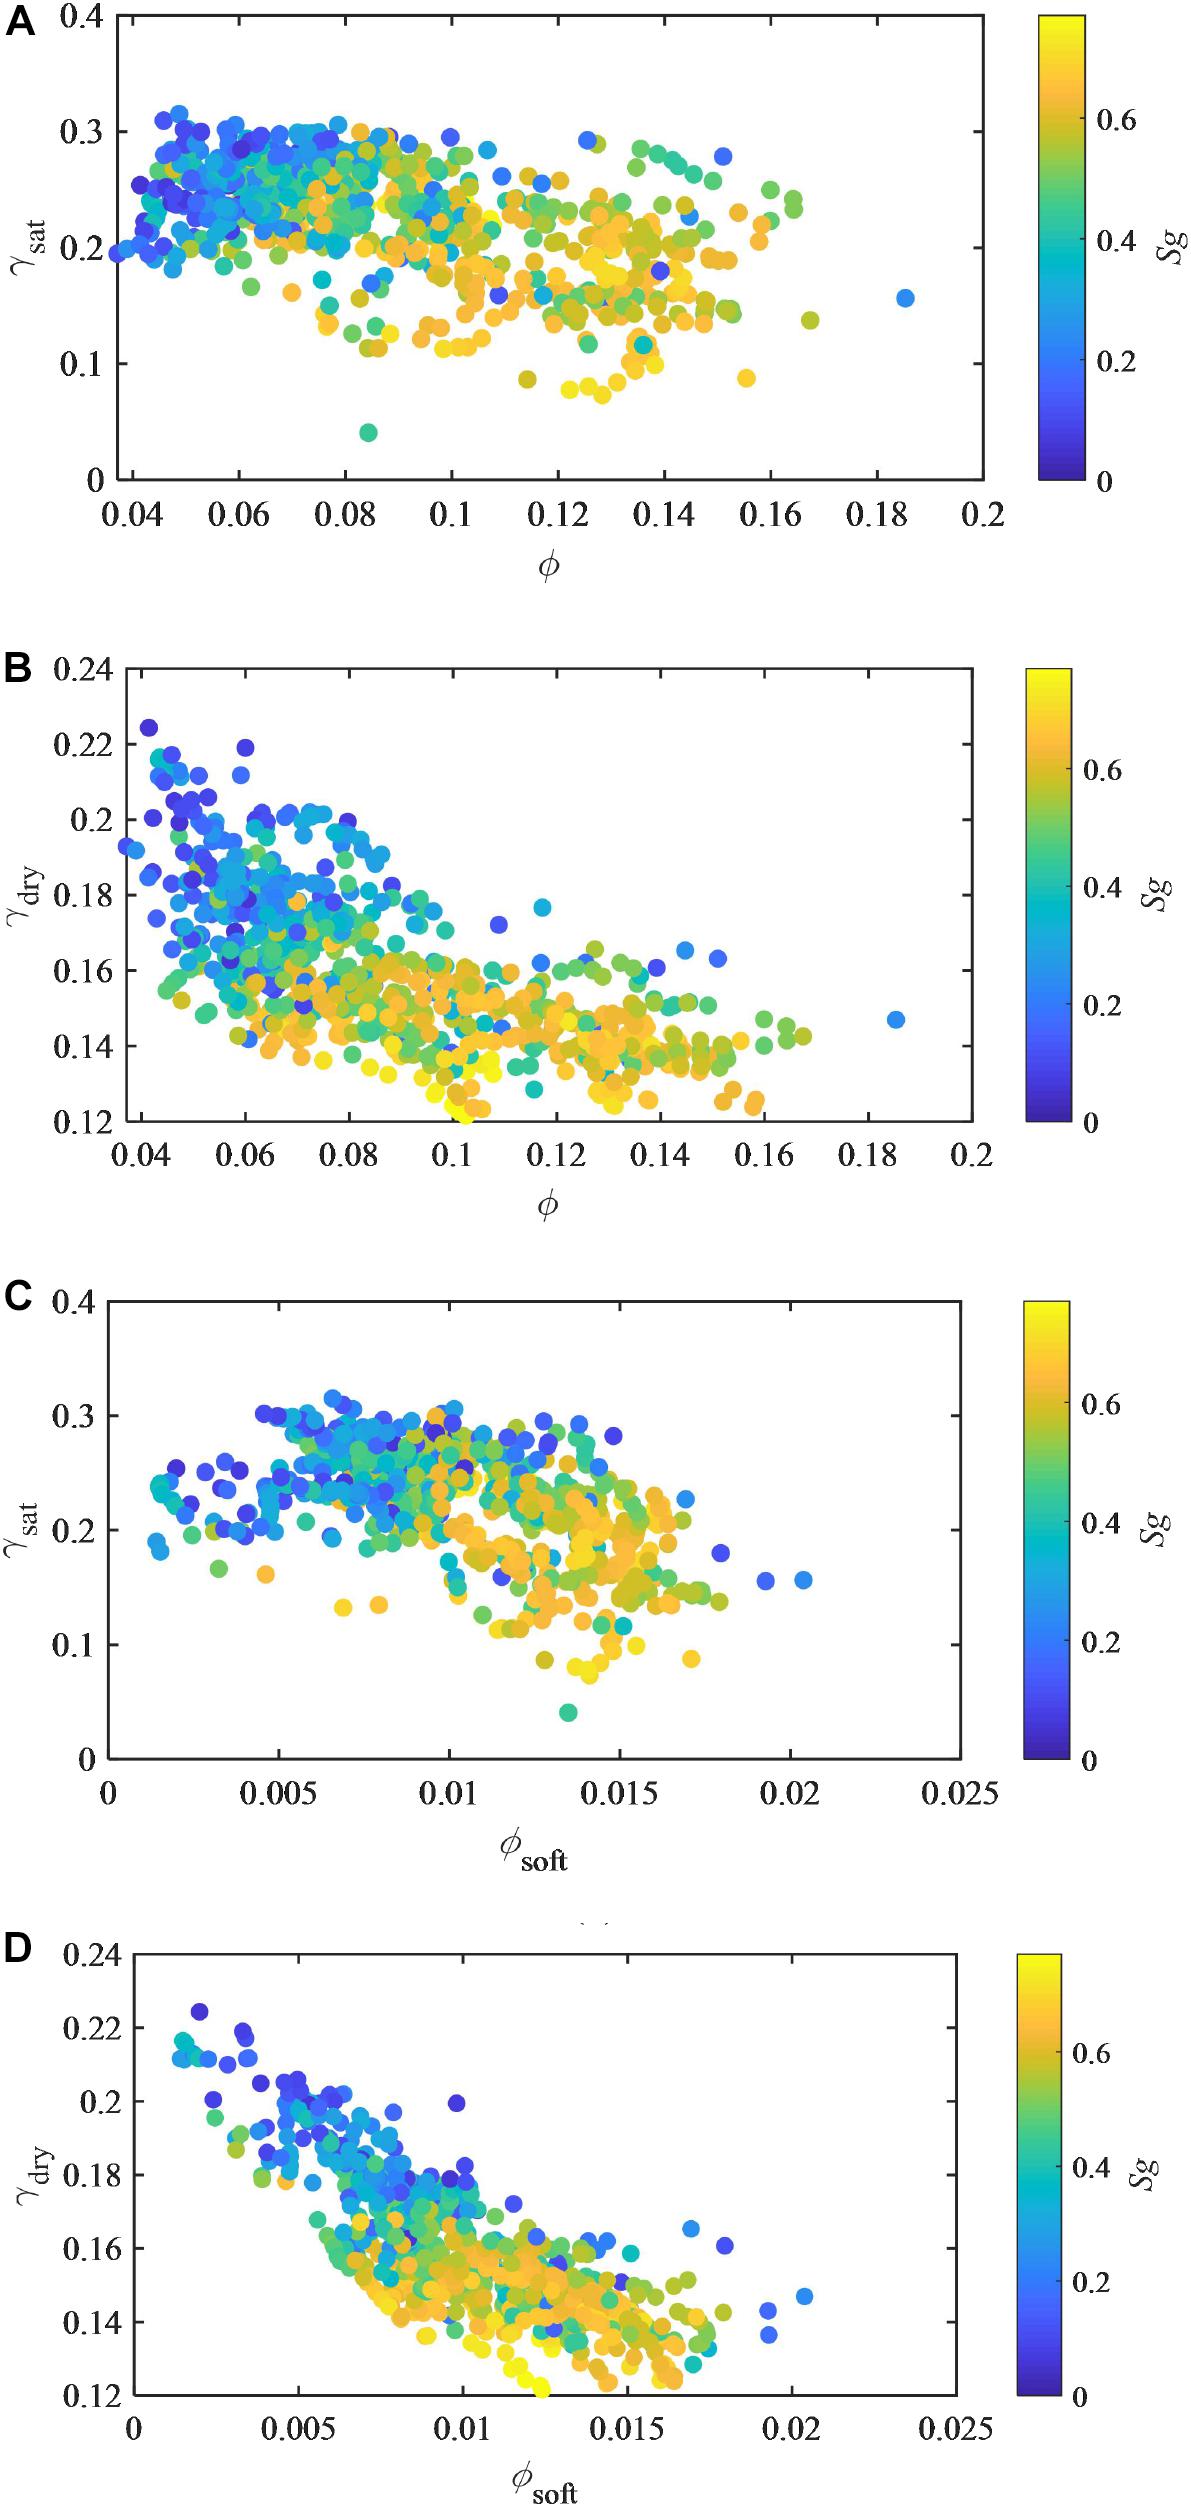
Figure 12. Crossplot of (A) the Poisson’s ratio versus porosity of fluid-saturated tight sandstone; (B) the Poisson’s ratio versus porosity of dry frame of tight sandstone; (C) the Poisson’s ratio versus soft porosity of fluid-saturated tight sandstone; (D) the Poisson’s ratio versus soft porosity of tight sandstone rock skeleton. Gas saturation Sg is color-coded for all the crossplots.
For further analysis, Figures 12C,D are the crossplot of the Poisson’s ratio versus the micro-crack porosity ϕsoft (ϕsoft = ϕfsoft) of the fluid-saturated rock and the rock skeleton of the tight sandstone, respectively. Figure 12D shows that the micro-crack porosity has a linear relationship with the Poisson’s ratio of the rock skeleton. The decrease in the Poisson’s ratio of the dry frame corresponds to an increase in the fraction of micro-cracks. It reveals that the Poisson’s ratio of the rock skeleton is sensitive to the heterogeneity of pore spaces.
Discussion and Conclusion
For the tight gas sandstone with low porosity and permeability, porosity is not the only factor that affects elastic behaviors of the sandstone. Heterogeneity of pore spaces should be considered in rock physical modeling to reasonably predict elastic modulus.
We established three rock physics model to describe the complex pore structure of tight gas sandstone reservoirs. In the single pore-aspect-ratio model, all pores are assumed to have the same pore aspect ratio. In the dual-pore model, the pore space is equivalent to a combination of stiff and soft pores. In the multiple pore-aspect-ratio model, the aspect ratio mean value and variance are used to represent statistical normal distribution of pores with varied aspect ratio.
Results for pore structure inversion and S-wave velocity prediction show that the dual-pore model works well and behaves as a more appropriate representation of the tight gas sandstone compared to the other model built in this study. The inverted parameter of soft pore fraction fSoft can explain the heterogeneity of pore structure of the tight sandstone. Increasing fraction of soft pores can dramatically decrease elastic modulus of the tight sandstone.
We applied the dual-pore rock physics model to estimate elastic modulus of rock skeleton. Compared to conventional empirical formulas, such as the Krief methods, the methods presented in this study considered the influence of minerals, porosity and pore structures in the calculation of the elastic modulus of dry frame of tight sandstone, which show more physical meaning and is more appropriate for the dry frame representing heterogeneous pore structures.
As to the applicability of the built rock physics models, it is not sure whether these models are valid for the tight sandstone from different areas. However, the rock physics models that are constructed using effective medium theories generally work well than those empirical models. The reason is that the former ones follow certain kinds of physical laws by incorporating parameters with specific physical meaning (for example, aspect ratio of pores). If the geological scenario agrees with the assumptions of the effective medium theories, the built model will work well and generate good results. The application results show that the models in this study are suitable for the tight sandstone of the research area. However, it may be that not all the tight sands are the same. So, the applicability of the built rock physics models should be carefully checked when applied to other fields.
Data Availability Statement
The original contributions presented in the study are included in the article/supplementary material, further inquiries can be directed to the corresponding author/s.
Author Contributions
ZG contributed as the major author of the manuscript. XQ did a part of writing and coding works. YZ, CN, DW, and YL provided some interesting ideas. YZ provided the suggestions. CN and DW gave analysis on results. YL collected the data. All authors contributed to the article and approved the submitted version.
Funding
This research was supported by the China National Offshore Oil Corporation (CNOOC) research project (No. YXKY-2019-ZY-04) and the National Natural Science Foundation of China (No. 42074153).
Conflict of Interest
YZ, CN, DW, and YL were employed by the company CNOOC and declare that this study received funding from CNOOC.
The remaining authors declare that the research was conducted in the absence of any commercial or financial relationships that could be construed as a potential conflict of interest.
References
Ba, J., Xu, W., Fu, L. Y., Carcione, J. M., and Zhang, L. (2017). Rock anelasticity due to patchy saturation and fabric heterogeneity: a double double-porosity model of wave propagation. J. Geophys. Res. Solid Earth 122, 1949–1976. doi: 10.1002/2016JB013882
Berryman, J. G. (1995). “Mixture theories for rock properties,” in Rock Physics and Phase Relations - a Handbook of Physical Constants, ed. T. J. Ahrens (Washington, DC: American Geophysical Union).
Biot, M. A. (1955). Theory of propagation of elastic waves in a fluid-saturated porous solid. I. Low frequency range. II. Higher frequency range. J. Acoust. Soc. Am. 28, 168–191. doi: 10.1121/1.1908239
Deng, J. X., Zhou, H., Wang, H., Zhao, G., and Wang, S. X. (2015). The influence of pore structure in reservoir sandstone on dispersion properties of elastic waves. Chin. J. Geophys. Chin. Edition 58, 3389–3400. doi: 10.6038/cjg20150931
Dvorkin, J., Nolen-Hoeksema, R. C., and Nur, A. (1994). The squirt-flow mechanism: macroscopic description. Geophysics 59, 428–438. doi: 10.1190/1.1443605
Dvorkin, J., and Nur, A. (1993). Dynamic poroelasticity: a unified model with the squirt and the Biot mechanisms. Geophysics 58, 524–533. doi: 10.1190/1.1443435
Gassmann, F. (1951). Uber die elastizitat poroser medien. Vier. Der Nat. Gesellschaft Zurich 96, 1–23.
Guo, Z. Q., and Li, X. Y. (2015). Rock physics model-based prediction of shear wave velocity in the Barnett Shale formation. J. Geophys. Eng. 12, 527–534.
Han, D. U., Nur, A., and Morgan, D. (1986). Effects of porosity and clay content on wave velocities in sandstones. Geophysics 51, 2093–2107. doi: 10.1190/1.1442062
Hashin, Z., and Shtrikman, S. (1963). A variational approach to the theory of the elastic behaviour of multiphase materials. J. Mech. Phys. Solids 11, 127–140. doi: 10.1016/0022-5096(63)90060-7
Krief, M., Garat, J., Stellingwerff, J., and Ventre, J. (1990). A rock physical interpretation using the velocities of P and S waves (full-waveform sonic). Log Anal. 31, 355–369.
Mavko, G., Mukerji, T., and Dovrkin, J. (2009). The Rock Physics Handbook, 2nd Edn. New York, NY: Cambridge University Press.
Mori, T., and Tanaka, K. (1973). Average stress in matrix and average elastic energy of materials with misfitting inclusions. Acta Metallurgica 21, 571–574. doi: 10.1016/0001-6160(73)90064-3
Raymer, L. L., Hunt, E. R., and Gardner, J. S. (1980). “An improved sonic transit time-to-porosity transform,” in Paper presented at the SPWLA 21st Annual Logging Symposium, (Lafayette, LA), doi: 10.1029/2003JB002639
Ruiz, F., and Cheng, A. (2010). A rock physics model for tight gas sand. Lead. Edge 29, 1484–1489. doi: 10.1190/1.3525364
Smith, T. M., Sayers, C. M., and Sondergeld, C. H. (2009). Rock properties in low-porosity//low-permeability sandstones. Lead. Edge 28, 48–59. doi: 10.1190/1.3064146
Stuart, C., and David, B. (1977). Inversion of P-wave velocity anisotropy. Geophys. J. Int. 49, 123–132. doi: 10.1111/j.1365-246X.1977.tb03704.x
Tutuncu, A. N., Podio, A. L., and Sharma, M. M. (1994). An experimental investigation of factors influencing compressional- and shear-wave velocities and attenuations in tight gas sandstones. Geophysics 59, 77–86. doi: 10.1190/1.1443536
Vernik, L., and Kachanov, M. (2010). Modeling elastic properties of siliciclastic rocks. Geophysics 75:E171. doi: 10.1190/1.3494031
Wang, D. X. (2017). A study on the rock physics model of gas reservoir in tight sandstone. Chin. J. Geophys. 60, 64–83. doi: 10.1002/cjg2.30028
Wang, P., Li, J., Chen, X., and Wang, B. (2020). Joint probabilistic fluid discrimination of tight sandstone reservoirs based on Bayes discriminant and deterministic rock physics modeling. J. Pet. Eng. 191:107218. doi: 10.1016/j.petrol.2020.107218
Yan, X. F., Yao, F. C., Cao, H., Ba, J., Hu, L. L., and Yang, Z. F. (2011). Analyzing the mid-low porosity sandstone dry frame in central Sichuan based on effective medium theory. Appl. Geophys. 18, 163–170. doi: 10.1007/s11770-011-0293-1
Keywords: tight gas sandstone, rock physics, pore structure, dry frame, elastic properties
Citation: Guo Z, Qin X, Zhang Y, Niu C, Wang D and Ling Y (2021) Numerical Investigation of the Effect of Heterogeneous Pore Structures on Elastic Properties of Tight Gas Sandstones. Front. Earth Sci. 9:641637. doi: 10.3389/feart.2021.641637
Received: 14 December 2020; Accepted: 15 March 2021;
Published: 01 April 2021.
Edited by:
Jing Ba, Hohai University, ChinaReviewed by:
Hemin Yuan, China University of Geosciences, ChinaXiao He, Institute of Acoustics, Chinese Academy of Sciences, China
Copyright © 2021 Guo, Qin, Zhang, Niu, Wang and Ling. This is an open-access article distributed under the terms of the Creative Commons Attribution License (CC BY). The use, distribution or reproduction in other forums is permitted, provided the original author(s) and the copyright owner(s) are credited and that the original publication in this journal is cited, in accordance with accepted academic practice. No use, distribution or reproduction is permitted which does not comply with these terms.
*Correspondence: Zhiqi Guo, emhpcWlndW9AYWxpeXVuLmNvbQ==