
94% of researchers rate our articles as excellent or good
Learn more about the work of our research integrity team to safeguard the quality of each article we publish.
Find out more
ORIGINAL RESEARCH article
Front. Earth Sci., 15 April 2021
Sec. Solid Earth Geophysics
Volume 9 - 2021 | https://doi.org/10.3389/feart.2021.641177
This article is part of the Research TopicRock Physics and Geofluid DetectionView all 27 articles
Frequency-dependent attenuation (1/Q) should be used as a seismic attribute to improve the accuracy of seismic methods and imaging of the subsurface. In rocks, 1/Q is highly sensitive to the presence of saturating fluids. Thus, 1/Q could be crucial to monitor volcanic and hydrothermal domains and to explore hydrocarbon and water reservoirs. The experimental determination of seismic and teleseismic attenuation (i.e., for frequencies < 100 Hz) is challenging, and as a consequence, 1/Q is still uncertain for a broad range of lithologies and experimental conditions. Moreover, the physics of elastic energy absorption (i.e., 1/Q) is often poorly constrained and understood. Here, we provide a series of measurements of seismic wave attenuation and dynamic Young’s modulus for dry and partially saturated Berea sandstone in the 1–100 Hz bandwidth and for confining pressure ranging between 0 and 20 MPa. We present systematic relationships between the frequency-dependent 1/Q and the liquid saturation, and the confining pressure. Data in the seismic bandwidth are compared to phenomenological models, ultrasonic elastic properties and theoretical models for wave-induced-fluid-flow (i.e., squirt-flow and patchy-saturation). The analysis suggests that the observed frequency-dependent attenuation is caused by wave-induced-fluid-flow but also that the physics behind this attenuation mechanism is not yet fully determined. We also show, that as predicted by wave-induced-fluid-flow theories, attenuation is strongly dependent on confining pressure. Our results can help to interpret data for near-surface geophysics to improve the imaging of the subsurface.
Frequency-dependent attenuation of seismic waves (1/Q) should be considered in geophysical processing to improve exploration geophysics (e.g., De Siena et al., 2014). In particular, 1/Q could provide insights about the physical-chemical state of the Earth’s interior including the nature of saturating phases (Chapman et al., 2006; McCarthy et al., 2011; Thakur and Rajput, 2011; Spencer, 2013; Tisato and Quintal, 2013; Amalokwu et al., 2014; Mikhaltsevitch et al., 2014a, b; Pimienta et al., 2015a, b; Tisato et al., 2015). Geo-materials attenuate seismic waves as a consequence of different mechanisms. For example, in the seismic bandwidth saturated rocks mostly attenuate waves as a consequence of wave-induced-fluid-flow (WIFF) and wave-induced-gas-exsolution-dissolution (WIGED) (e.g., White, 1975; Dutta and Odé, 1979; Mavko and Jizba, 1991; Müller et al., 2010; Tisato et al., 2015). While dry rocks typically exhibit 1/Q < 0.02, saturated rocks may exhibit frequency-dependent attenuation as high as ∼0.1 (e.g., Winkler and Nur, 1982; Peselnick and Liu, 1987; Yin et al., 1992; Batzle et al., 2006; Barton, 2007; Adam et al., 2009; Tisato and Madonna, 2012; Madonna and Tisato, 2013; Tisato and Quintal, 2014; Pimienta et al., 2015a, b; Tisato et al., 2015; Chapman et al., 2016). For instance, Tisato and Madonna (2012) and Yin et al. (1992) report that in dry and partially saturated Berea sandstone attenuation at ∼100 Hz is ∼0.01 and ∼0.04, respectively.
Wave-induced-fluid-flow can occur at macro-, meso-, or micro- scale depending on the wavelength to the fluid-flow-distance ratio (Mavko et al., 2009). WIFF at the meso- and micro-scale are also known as patchy-saturation and squirt-flow, respectively, and they have been modeled by several authors (e.g., Dvorkin and Nur, 1993; Gurevich and Lopatnikov, 1995; Pride et al., 2004; Jakobsen and Chapman, 2009; Gurevich et al., 2010; Müller et al., 2010; Quintal et al., 2011; Papageorgiou and Chapman, 2015).
Laboratory studies offer the opportunity to understand the physics of attenuation mechanisms and to validate theories (e.g., Tisato and Quintal, 2013). However, the few lithologies and physical conditions investigated to date are insufficient to achieve such a goal, and some studies report measurements which are not yet fully understood (e.g., Tisato and Madonna, 2012).
The present contribution reports a series of seismic wave attenuation measurements in extensional mode (Green et al., 1967, 1974a,b) as a function of frequency and confining pressure for two partially saturated Berea sandstone specimens. Samples were saturated with water, glycerin, and air. Saturation levels were chosen to mimic different saturation conditions as proxies of subsurface reservoir conditions. Moreover, an additional sample is used to estimate pressure-dependent ultrasonic wave velocities for dry Berea sandstone.
We employ phenomenological models to fit the dataset confirming the relation of causality between modulus dispersion and attenuation in our measurements (i.e., Kramers-Kronig relation). Further, squirt-flow and patchy-saturation models and ultrasonic wave speed measurements indicate that WIFF can cause the observed frequency-dependent seismic wave attenuation.
We present measurements of physical properties for three Berea sandstone samples named: BS2, BS3, and BS5s. The three cylindrical samples were acquired from Cleveland Quarries1 and had dimensions (length x diameter) of 250 x 75.1 mm, 250 x 75.1 mm, and 59 x 25.6 mm, respectively. The samples’ length and diameter were measured with an uncertainty of ± 0.025 mm using a 0.01 mm division caliper. Sample BS3 has hydraulic permeability of ∼10–12 m2, while BS2 and BS5s, which originated from the same block, have hydraulic permeability of ∼0.75x10⁻¹² m2. Permeability values were provided by Cleveland Quarries. Berea sandstone contains bedding planes controlling elastic properties anisotropy (Lo et al., 1986; Sayers et al., 1990). The axes of our cylindrical samples were perpendicular to such bedding planes.
For samples BS2 and BS3, we measured the frequency-dependent Young’s modulus (E) and seismic wave attenuation, i.e., 1/QE that here we call 1/Q for the sake of simplicity. Measurements were performed at room temperature (∼20° C) in the bandwidth 1– 100 Hz and at confining pressures (Pc) ranging 0 - 20 MPa. Samples were oven-dried at 105° C for more than 24 h, then let cool at room temperature and humidity for several hours, jacketed for testing, and finally loaded inside the testing apparatus. Data are presented for dry and partially saturated samples. Under the aforementioned conditions, we also measured the ultrasonic longitudinal wave speeds of sample BS3. Such measurements were performed at a frequency (f) of ∼100 kHz.
Sample BS5s was smaller than BS2 and BS3, and used to estimate the longitudinal and transverse ultrasonic (f∼1 MHz) velocities of dry samples. The density (ρ) of the dry samples is 2110 ± 31 kg/m3, and it was obtained from the sample volume and weight, which was measured with a 0.1 g resolution scale. Porosity (Φ) of sample BS5s is 0.205, and it was estimated using a helium pycnometer (AccuPyc 1330, Micromeritics). We use such a porosity value as a proxy for the porosity of BS2 and BS3.
We saturated the samples with air, water, and a water-glycerin mixture. The latter is called GWmix and contains 55 and 45 volume % of glycerin and distilled water, respectively. In general, the subscript W and GW refer to water and GWmix, respectively. GWmix viscosity (ηGW = 11 ± 0.25 mPa s) and density (ρGW = 1.12 ± 0.02 g/cm3) were measured with a falling ball viscometer, a 0.1 mg precision scale and a 0.1 ml precision vial, respectively. The bulk modulus of GWmix (KGW = 2.4 ± 0.1 GPa) was estimated by analyzing the pressure-volume curve obtained with a high-pressure syringe pump (ISCO 260D). Sample BS2 was saturated with air and water, while BS3 was saturated with air and GWmix.
While inside the pressure vessel, water or GWmix (i.e., liquid) was pumped into the sample through the sample bottom-end-face, letting air flow through the sample top-end-face. Saturation was calculated according to the quantity of injected liquid and the porosity of the sample. The injected liquid was drained from a graduated burette, and any excess liquid flowing through the top end-faces was collected on a second graduated burette. Thus, the volume of injected liquid was estimated as the difference between the liquid levels in the two graduated burettes. Some of the injected fluid was used to fill the hydraulic circuit and was not considered in the saturating fluid volume. In particular, before recording the initial volume of fluid in the burettes, we prefilled the injection circuit except for the bottom sample holder to avoid sample imbibition. We also estimated the internal volumes of the sample holders and draining circuit with an accuracy of +/−1 ml representing less than 0.5% of BS2 or BS3 pore space volume. Once the wanted saturation was reached, the sample was isolated from the hydraulic circuit by closing the inlet and outlet valve. All the experiments were performed with fluid pressure equal to room pressure (∼0.1 MPa), and Pc represents a proxy for effective stress (σ’).
Each saturated sample effective density (ρr) was estimated considering the rock porosity, saturation, and fluid density. Table 1 reports a summary of the characteristics of each sample and the conducted tests.
Attenuation and complex Young’s modulus in the bandwidth 1 – 100 Hz are obtained employing the sub-resonance method (McKavanagh and Stacey, 1974). Attenuation is:
where φ is the phase shift between the stress (σ) imposed by the seismic wave and the strain (ε) measured across the whole sample. Q is the quality factor. The σ to ε ratio equals the complex Young’s modulus (Ez), so that 1/Q is also:
The real part of Ez [i.e., Re(Ez)] or simply ESF is given by:
where SF stands for “seismic-frequencies,” σpp and εpp are the peak-to-peak values of the σ and ε, respectively (Lakes, 2009). εpp was kept around 1.2x10⁻⁶, which is similar to the strain caused by the propagation of a seismic wave (Karato and Spetzler, 1990).
The extensional seismic wave attenuation (1/Q) and complex Young’s modulus (EZ) of sample BS2 and BS3 were measured using the Burlini attenuation vessel (BBAV) (Figure 1; Tisato and Madonna, 2012). We calculated i) the stress from the load-cell measurement (i.e., force) and the sample cross-section area, and ii) the strain from the displacement sensor measurement (i.e., sample shortening) and sample length. Force and shortening time series are fit with sinusoidal functions. Amplitude and phase of the fitting functions yield the parameters to calculate 1/Q and ESF. The fitting functions are assumed to represent the true values. We calculate two standard deviations between the true values and the measurements to estimate the 95% confidence bounds on both the amplitude and the phase of the signals. Such uncertainties and those related to the sample cross area and length provide a proxy for accuracy on Young’s modulus and attenuation. Precision (i.e., repeatability) is estimated by calculating the standard deviation of five measurements performed at each frequency. Accuracy and precision are summed to provide uncertainty on the measurements that are provided as error bars in Figures 2–8.
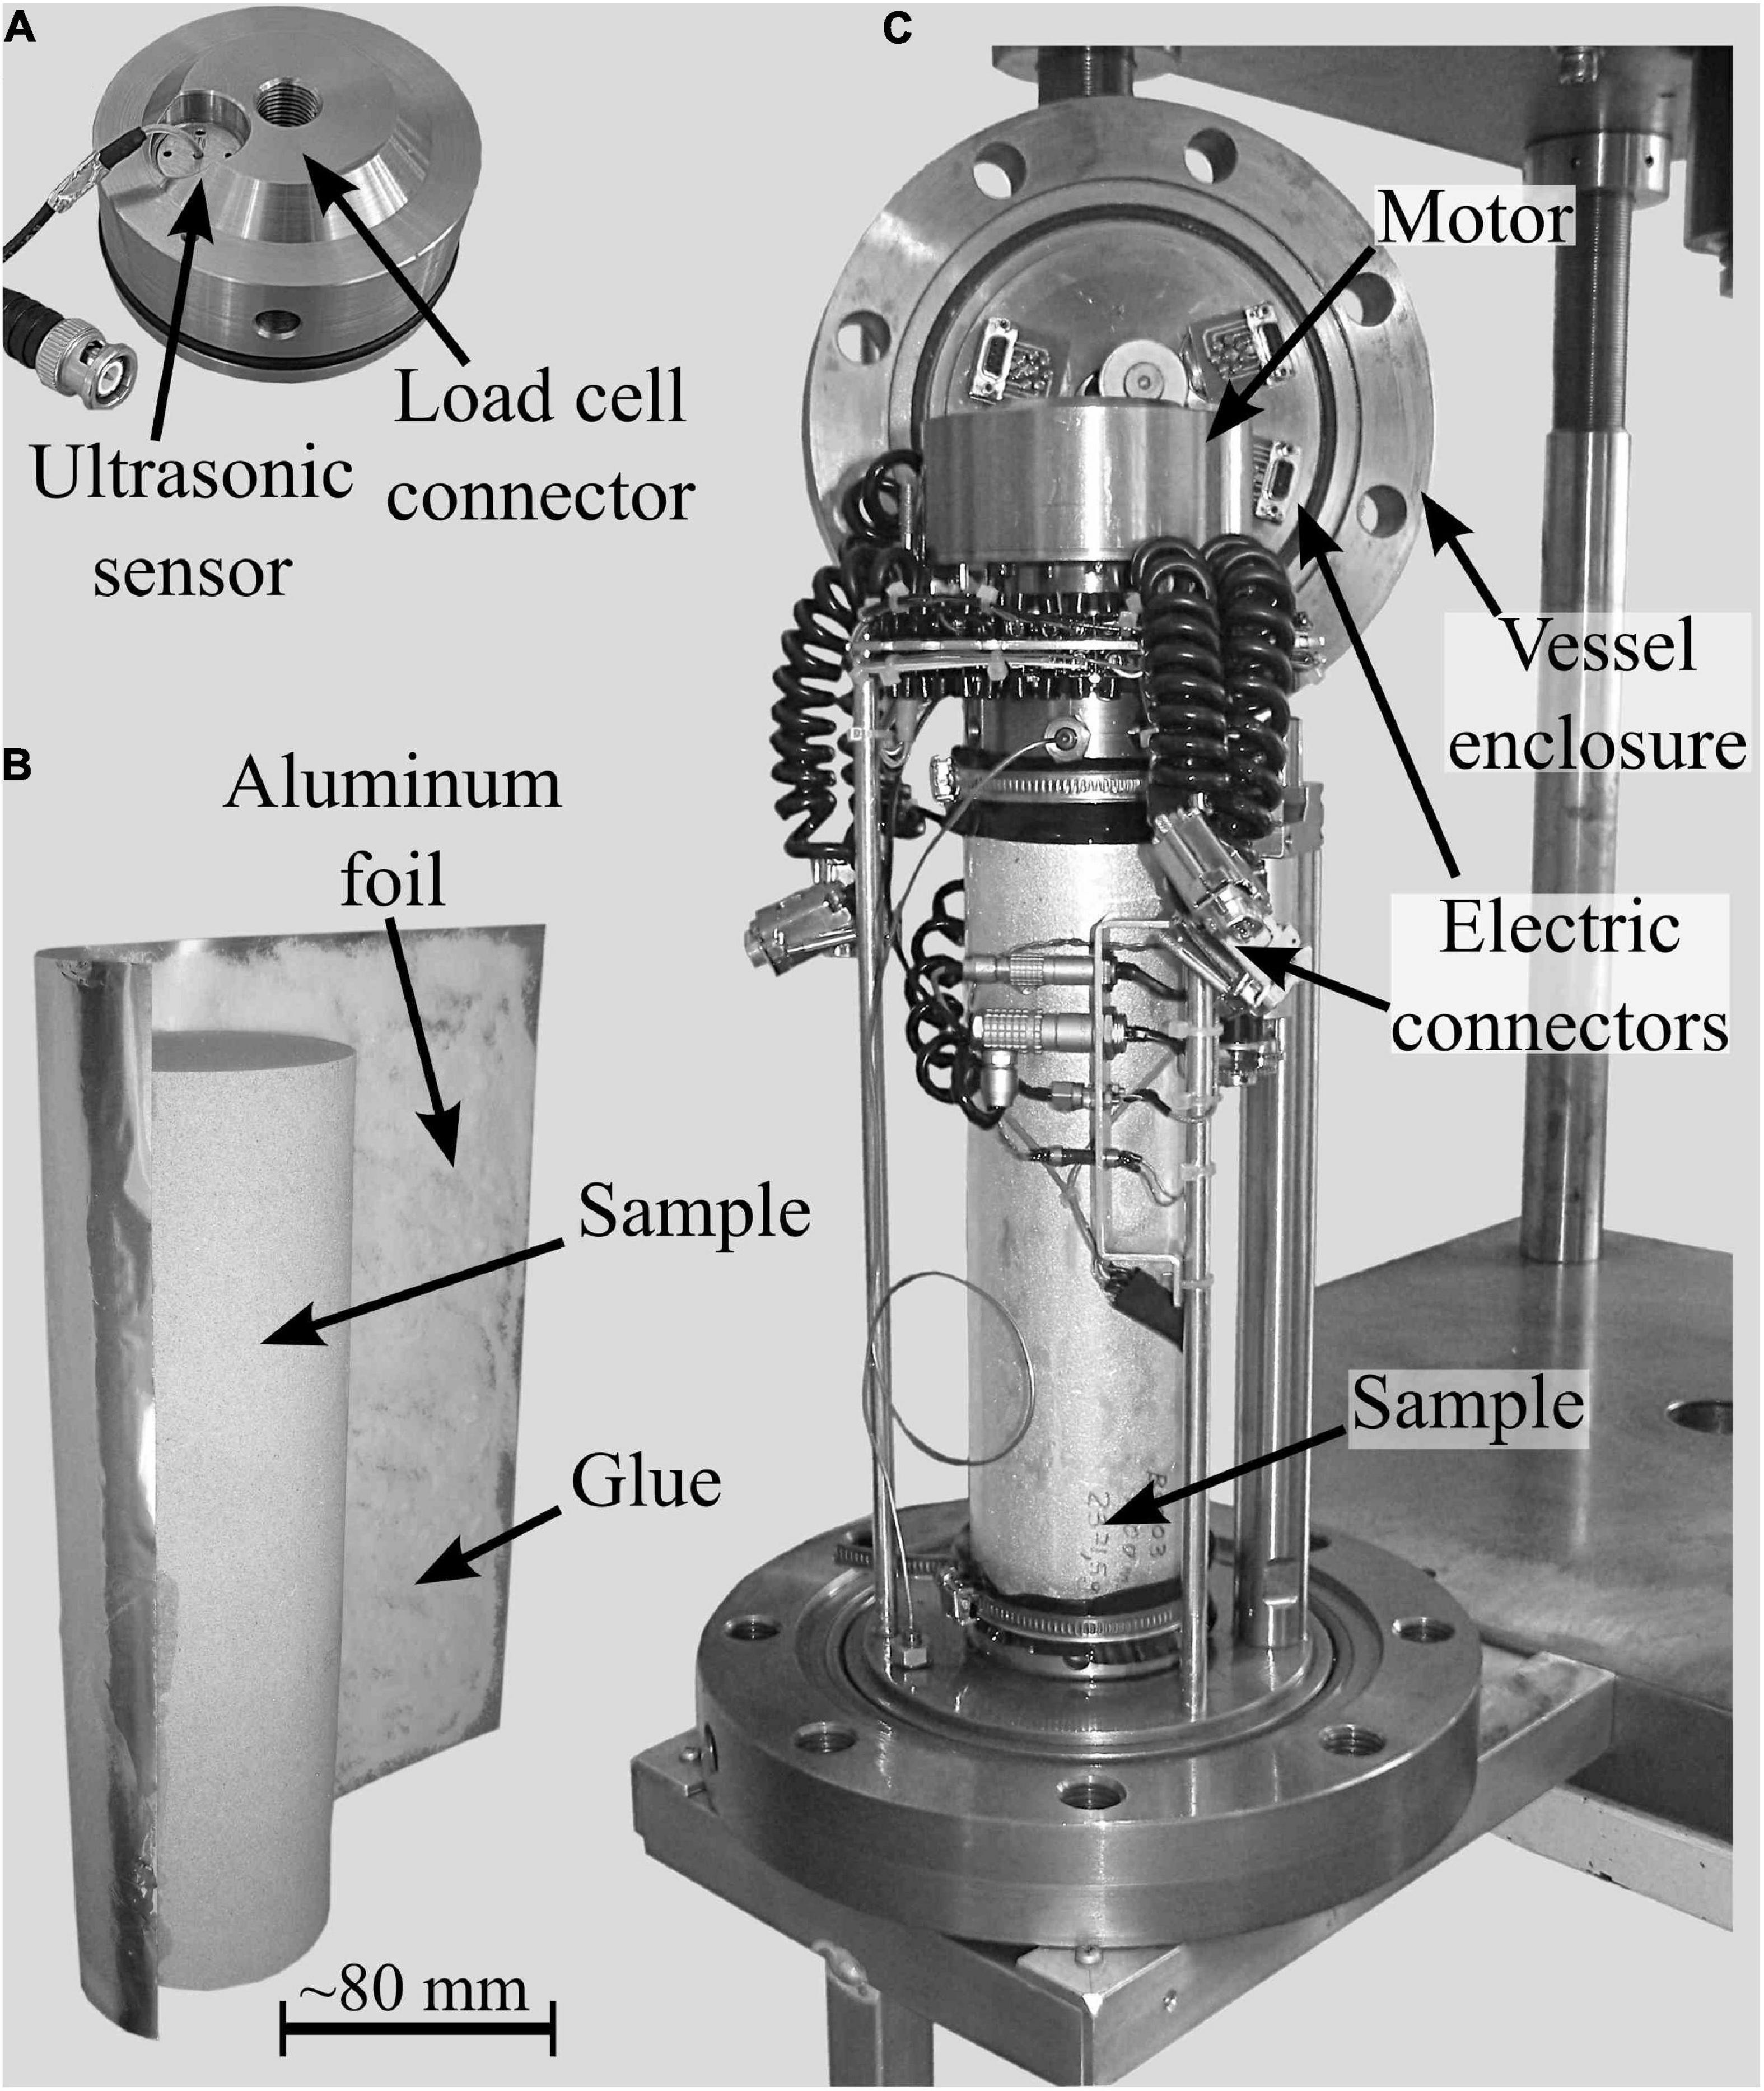
Figure 1. The Burlini attenuation vessel (BBAV). (A) Top-sample holder. (B) Detail about the application of the aluminum foil on the sample. We employed “tesa spray glue extra strong.” (C) Measuring column of the BBAV that during testing is mounted inside the pressure vessel (here not shown).
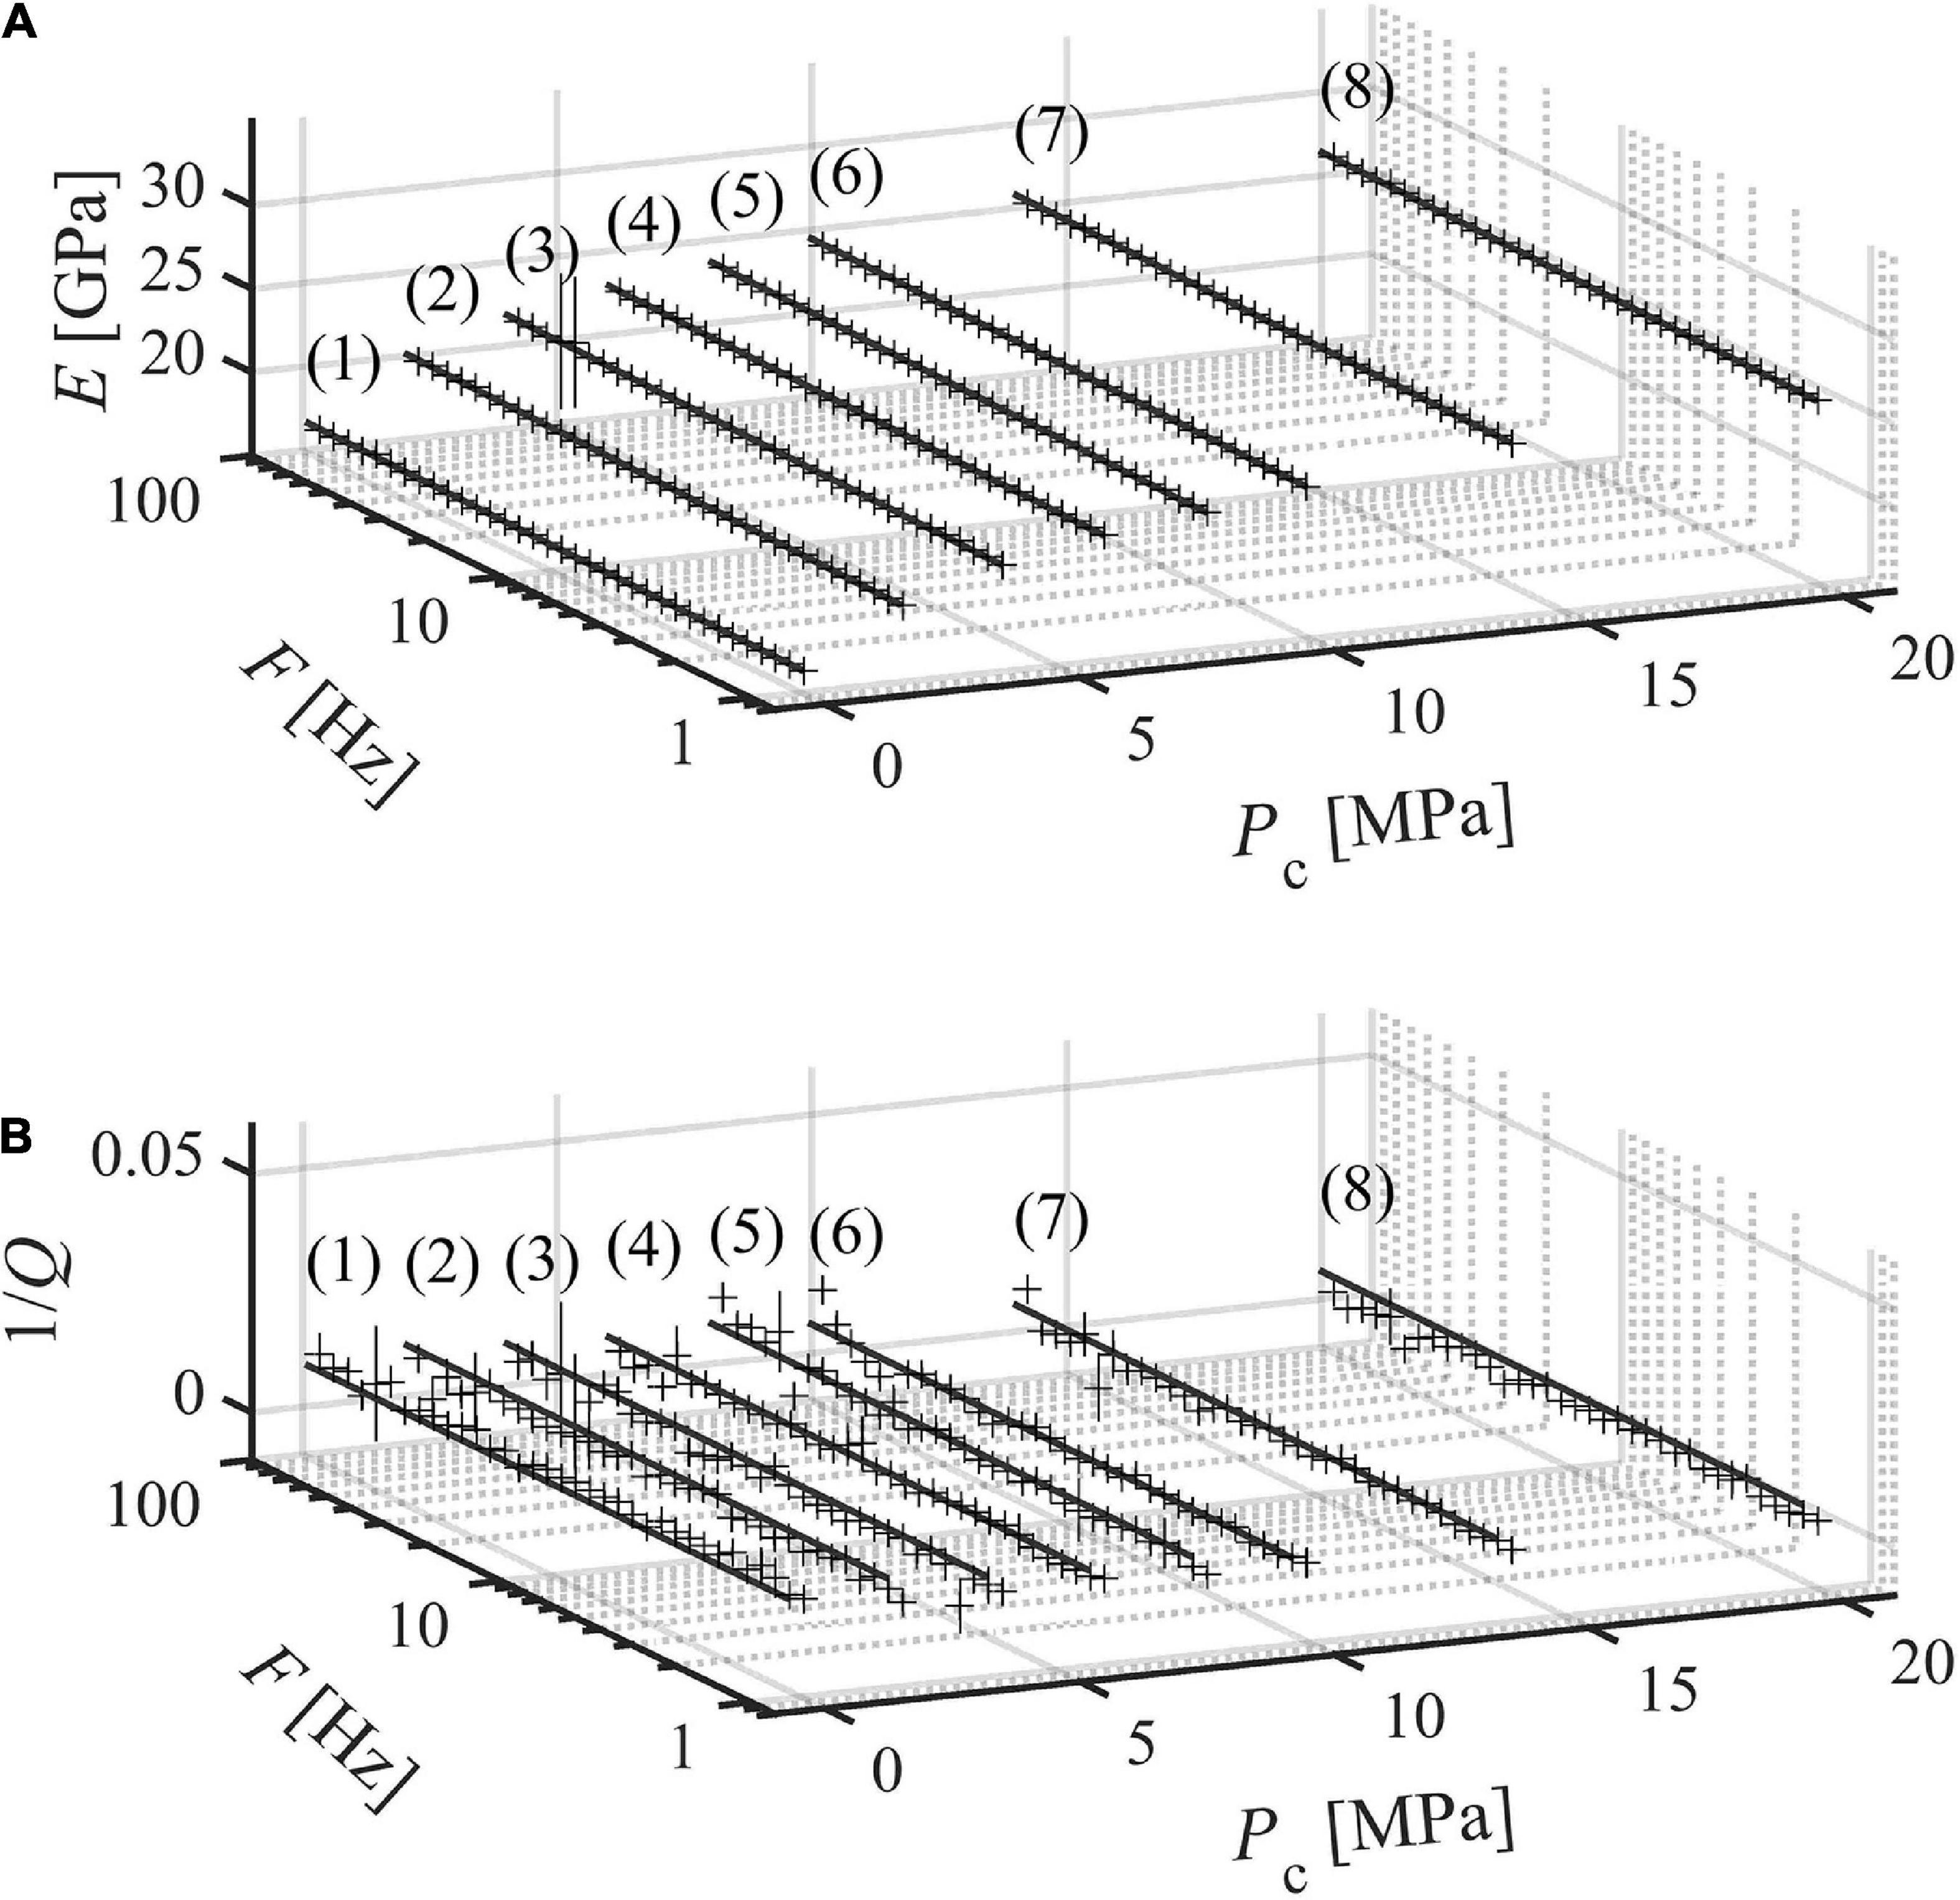
Figure 2. Measurements for case i (BS3 dry). (A) Dynamic Young’s modulus and (B) attenuation in the bandwidth 1–100 Hz. Vertical bars indicate the sum of measurement uncertainty and repeatability. Results are interpolated with the nearly constant Q model (NCM) (Liu et al., 1976).
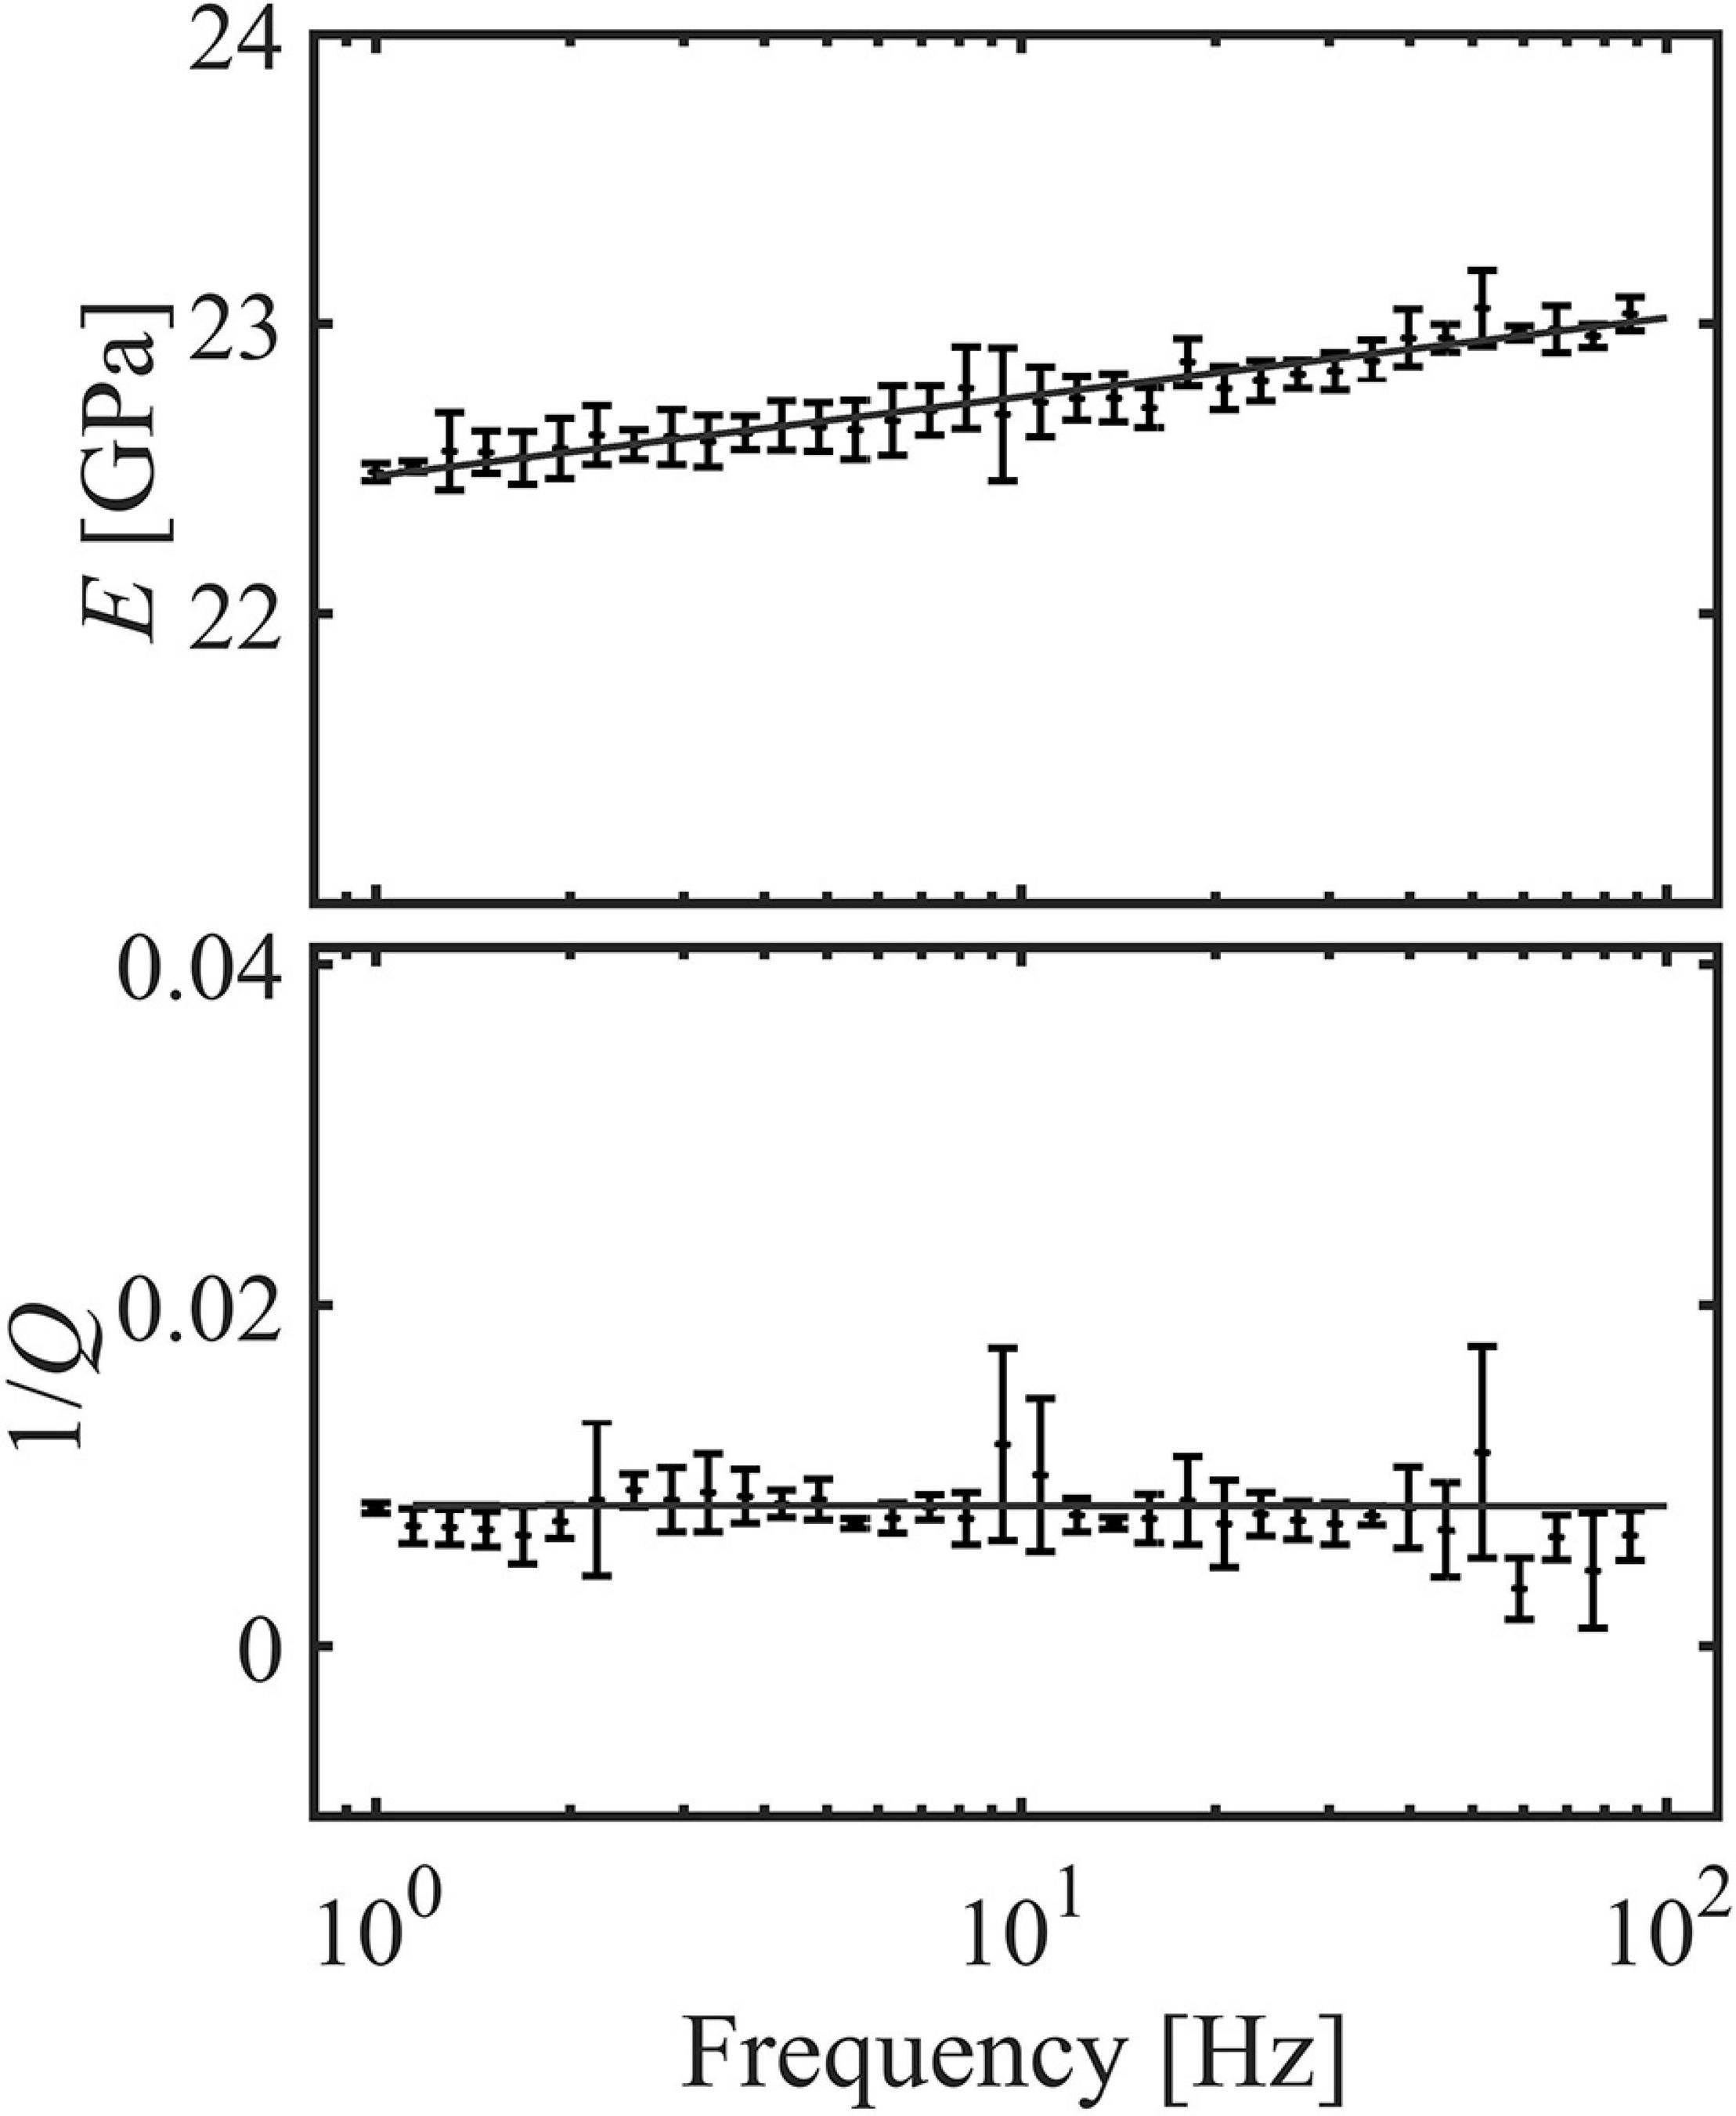
Figure 3. Close up of Figure 2 curves 4A and 4B (Pc = 6 MPa). Fits (solid lines) are performed by means of the nearly constant Q model (NCM) (Liu et al., 1976).
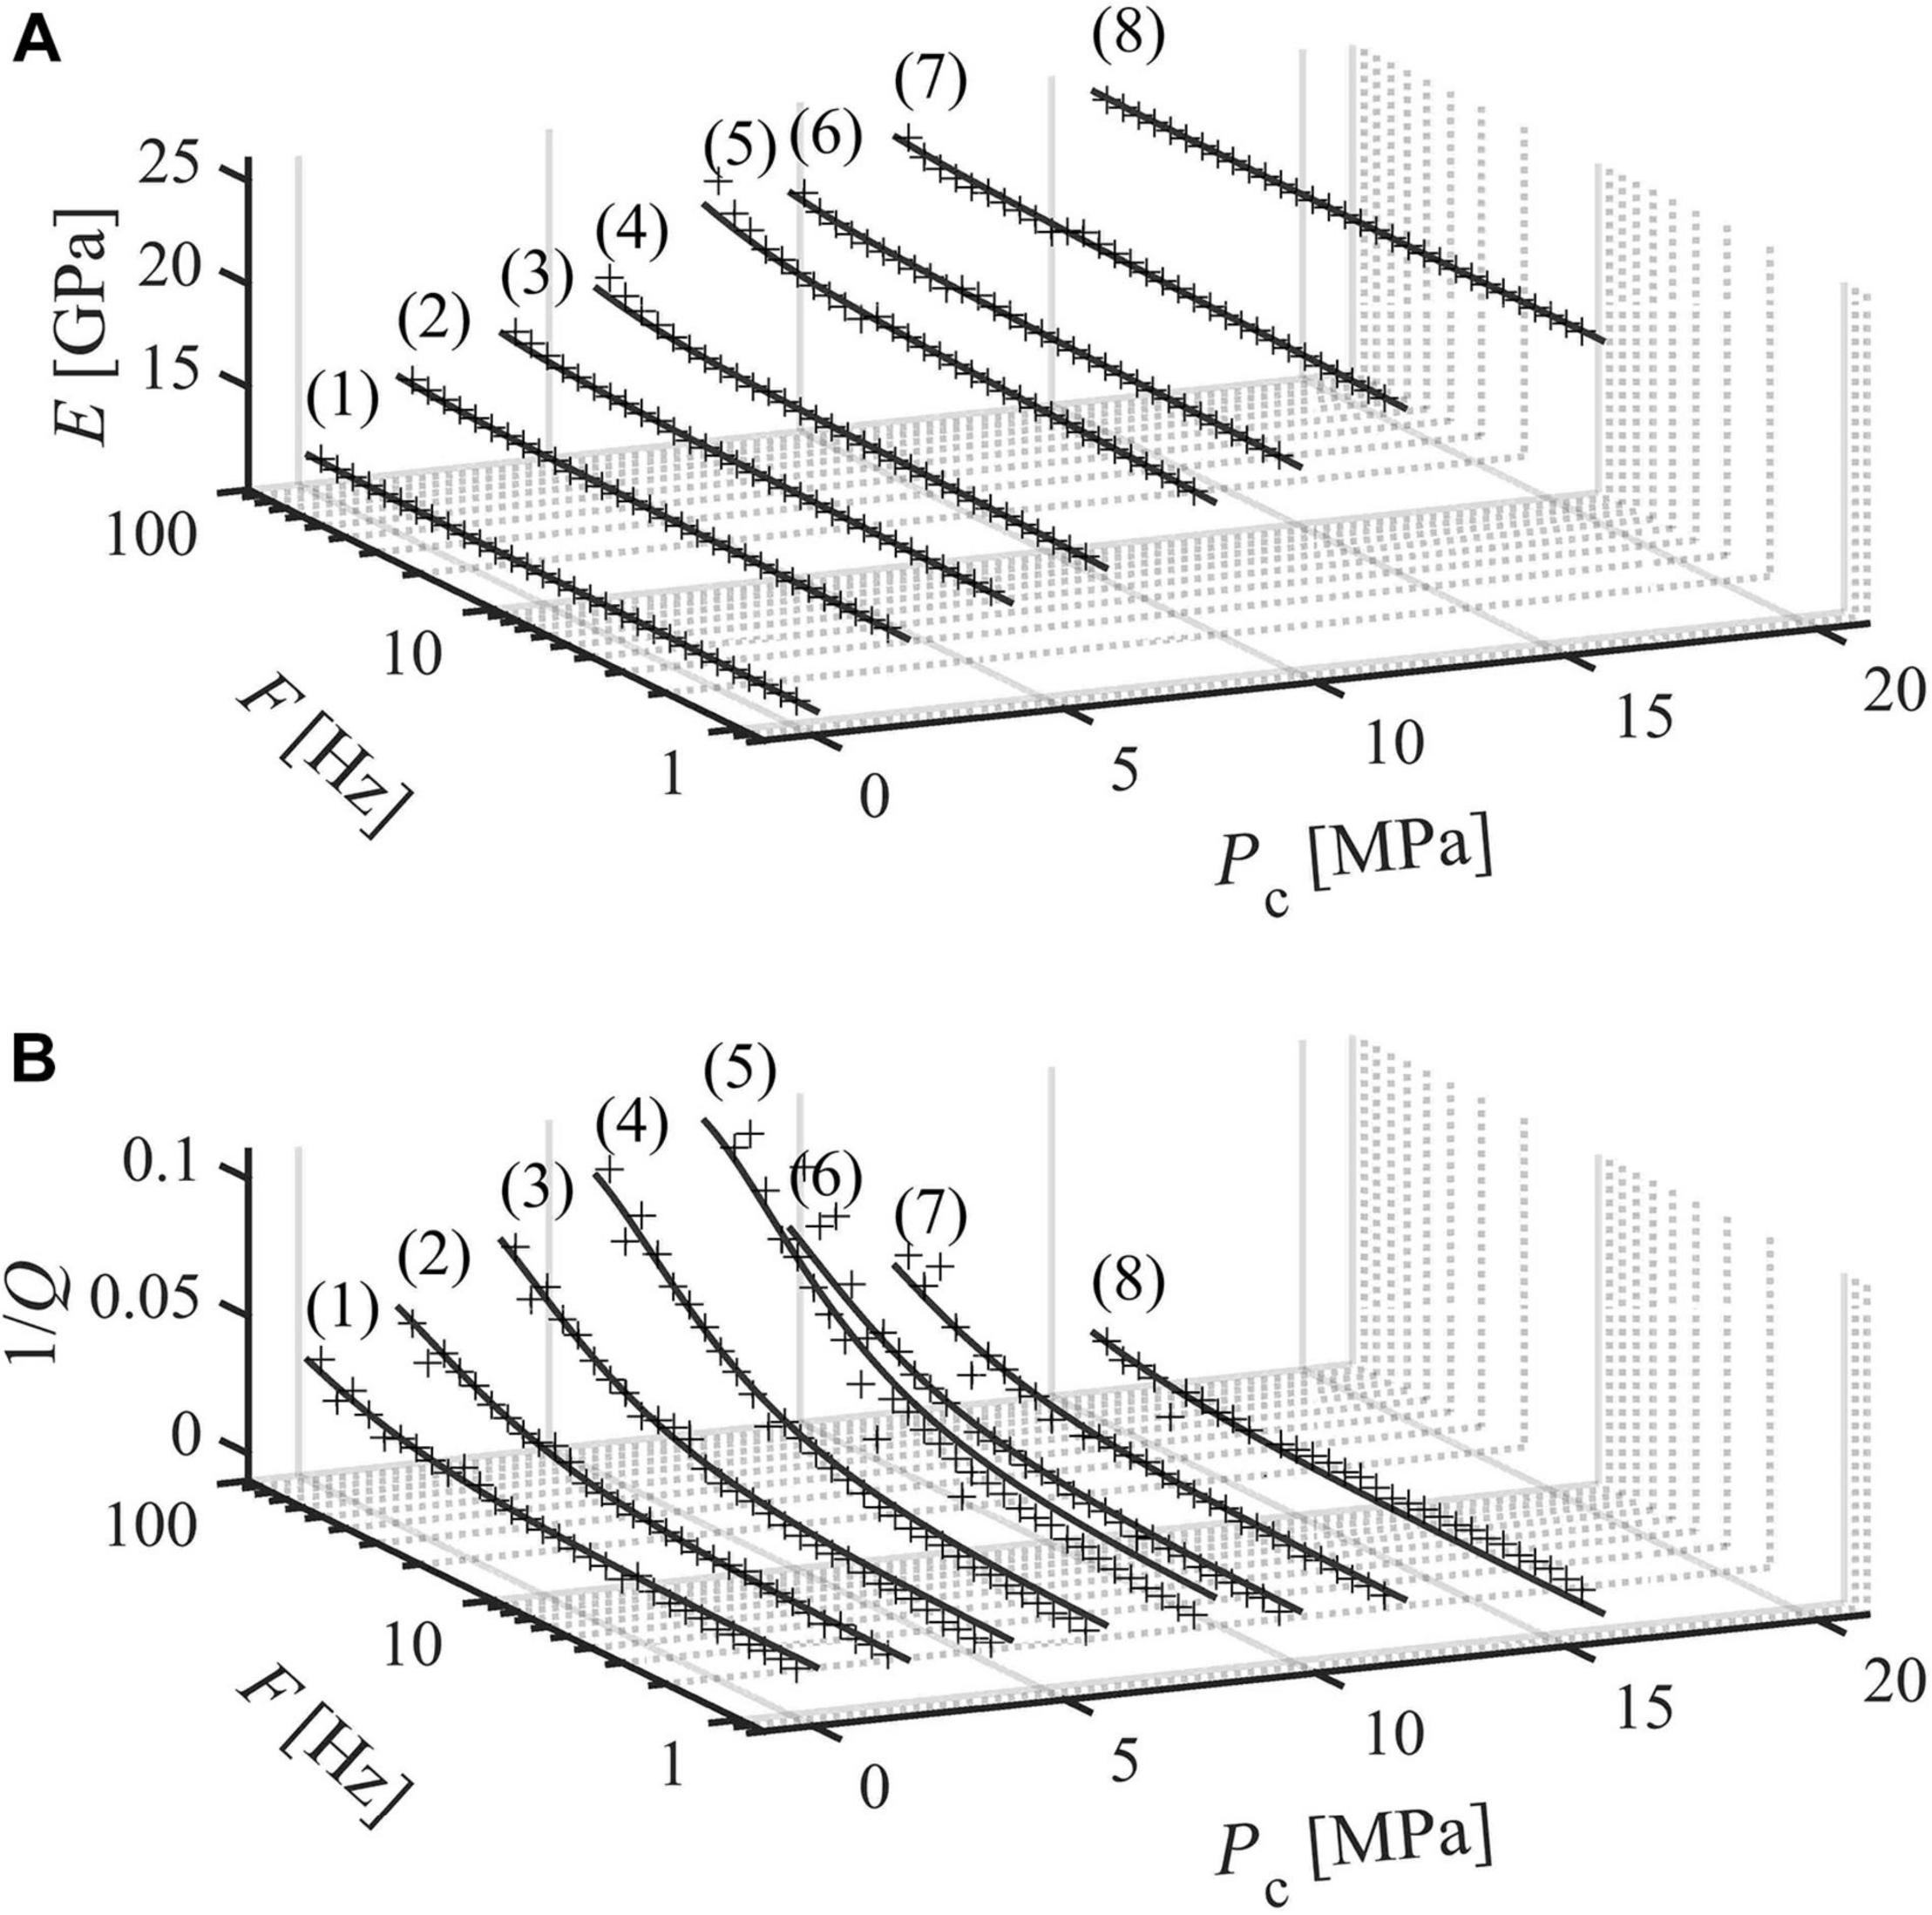
Figure 4. Measurements for case ii (BS2 SW = 60%). (A) Young’s modulus and (B) attenuation in the bandwidth 1–100 Hz. Vertical bars indicate the sum of measurement uncertainty and repeatability. Results are interpolated with the nearly constant Q model (NCM) and the standard linear solid model (SLS) (Liu et al., 1976; Carcione, 2007).
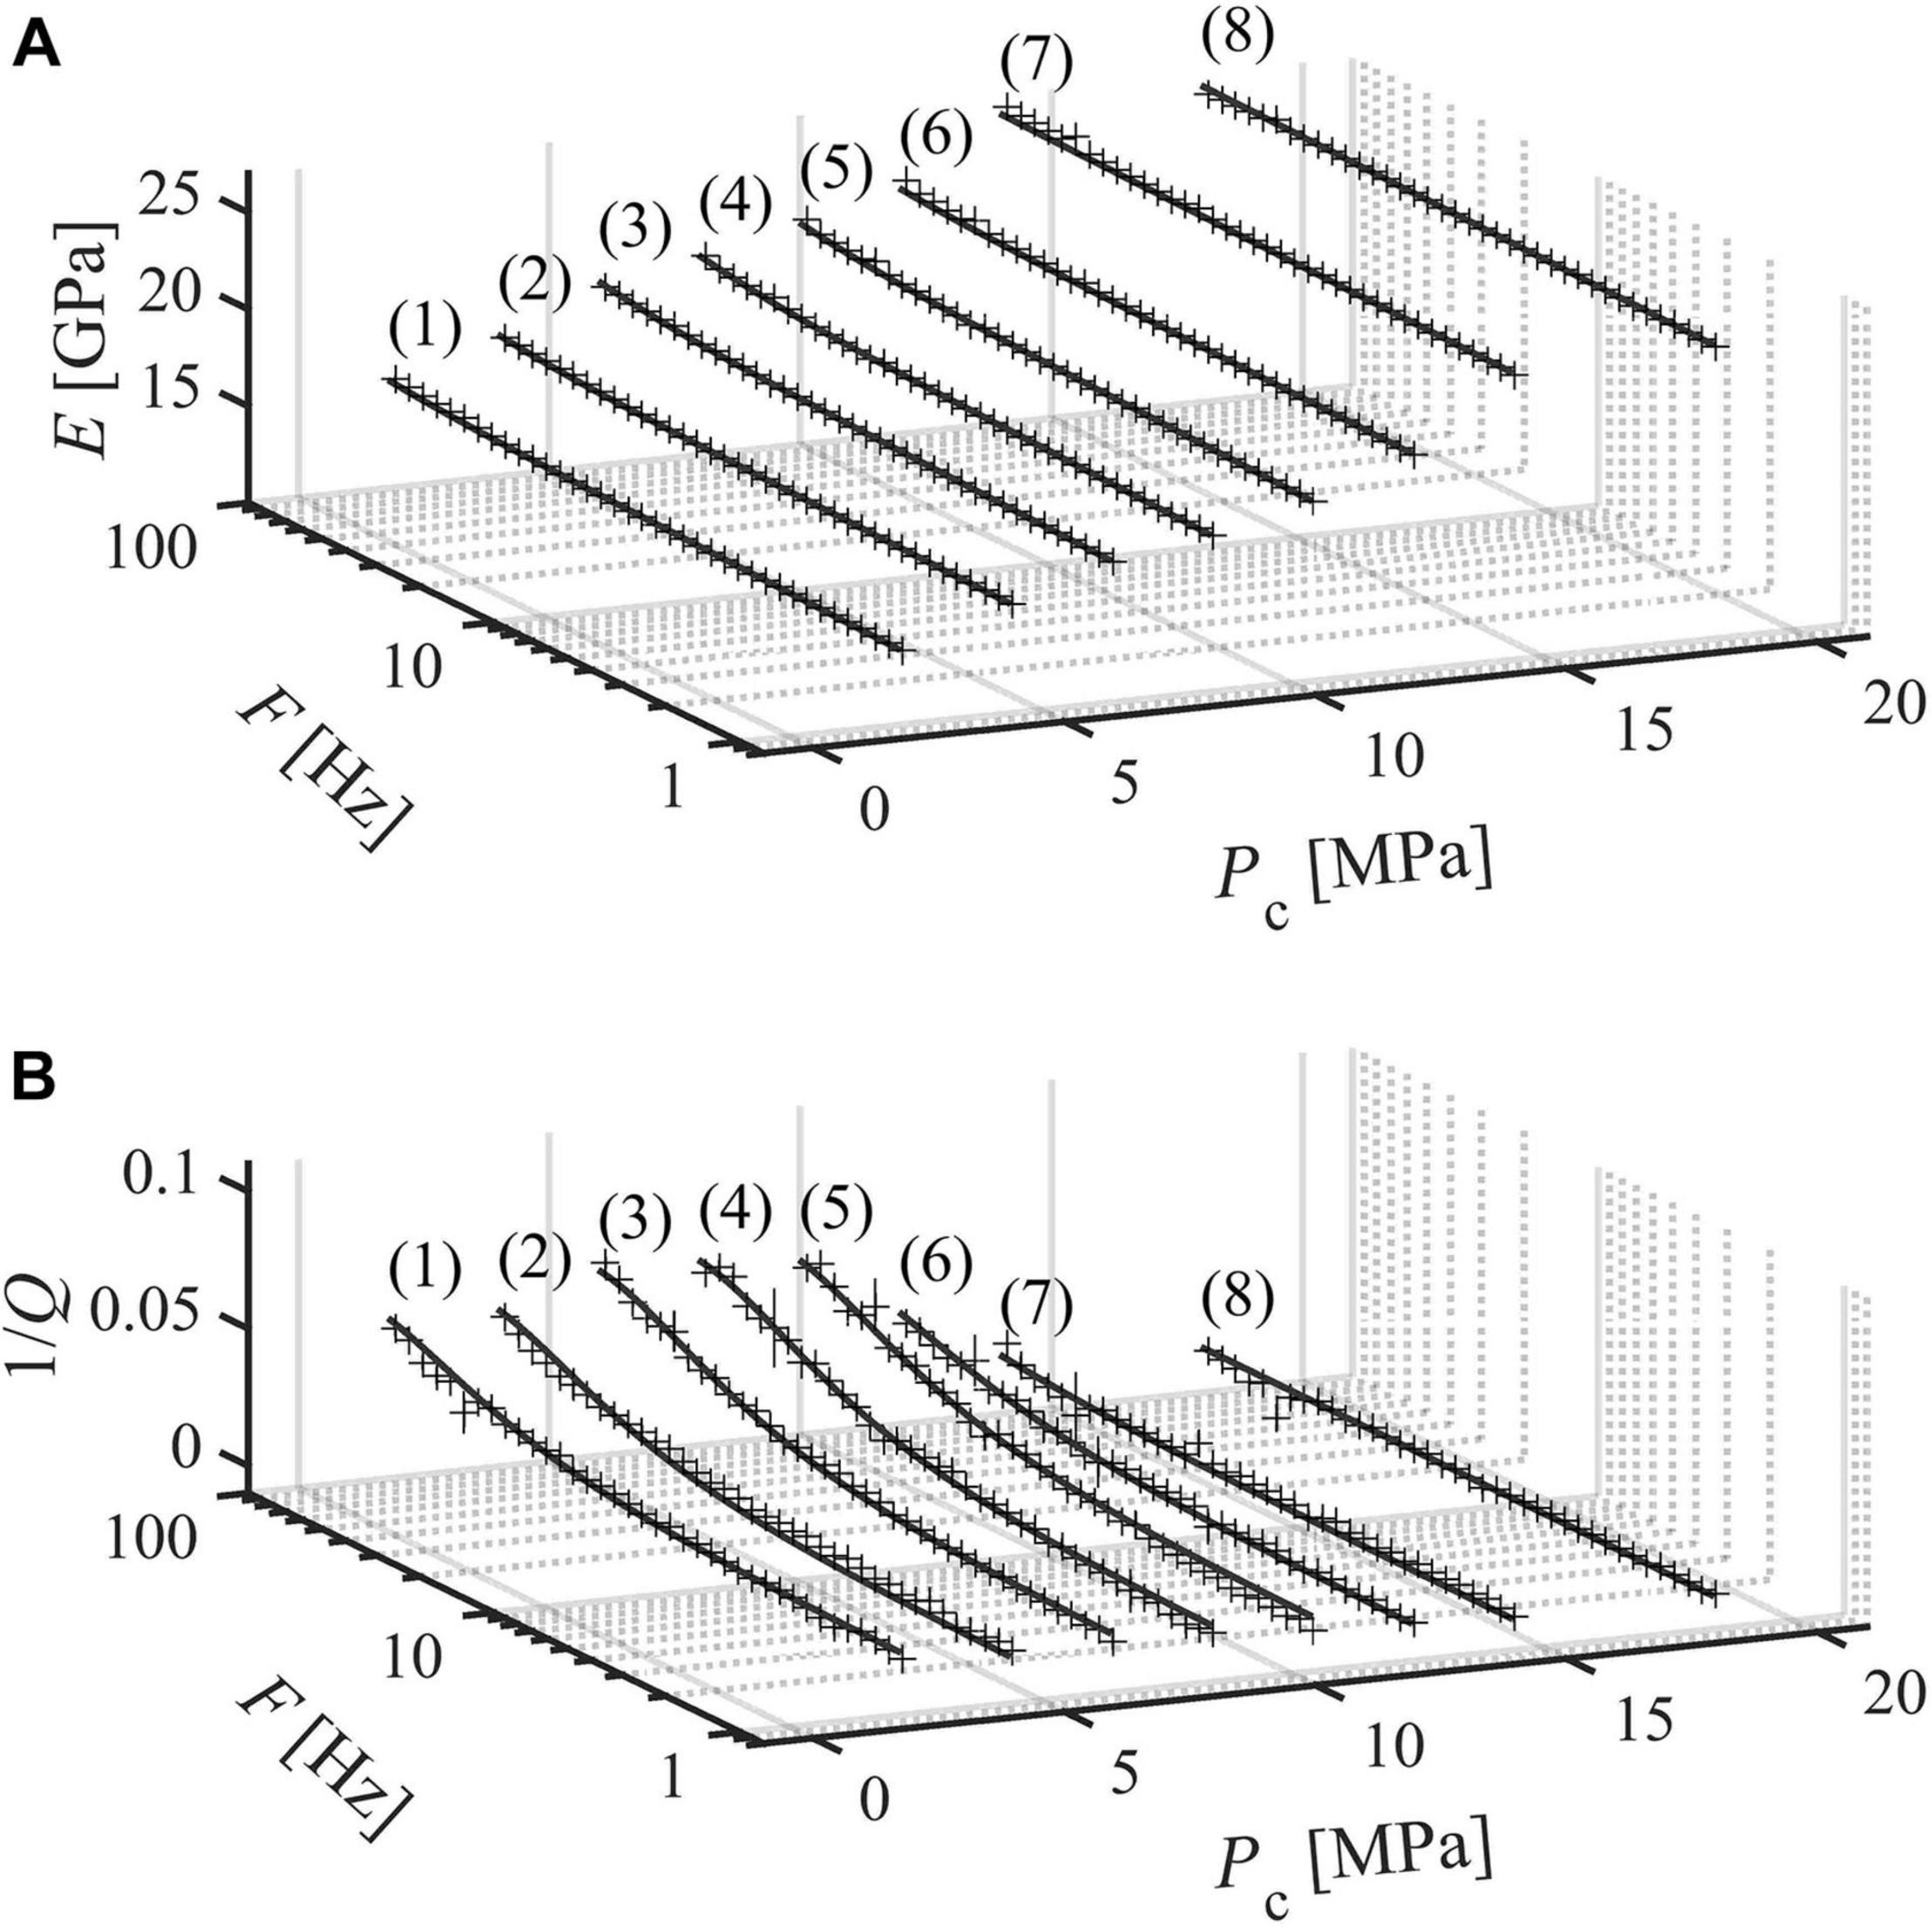
Figure 5. Measurements for case iii (BS3 SGW = 53.5%). (A) Young’s modulus and (B) attenuation in the bandwidth 1–100 Hz. Vertical bars indicate the sum of measurement uncertainty and repeatability. Results are interpolated with the nearly constant Q model (NCM) and the standard linear solid model (SLS) (Liu et al., 1976; Carcione, 2007).
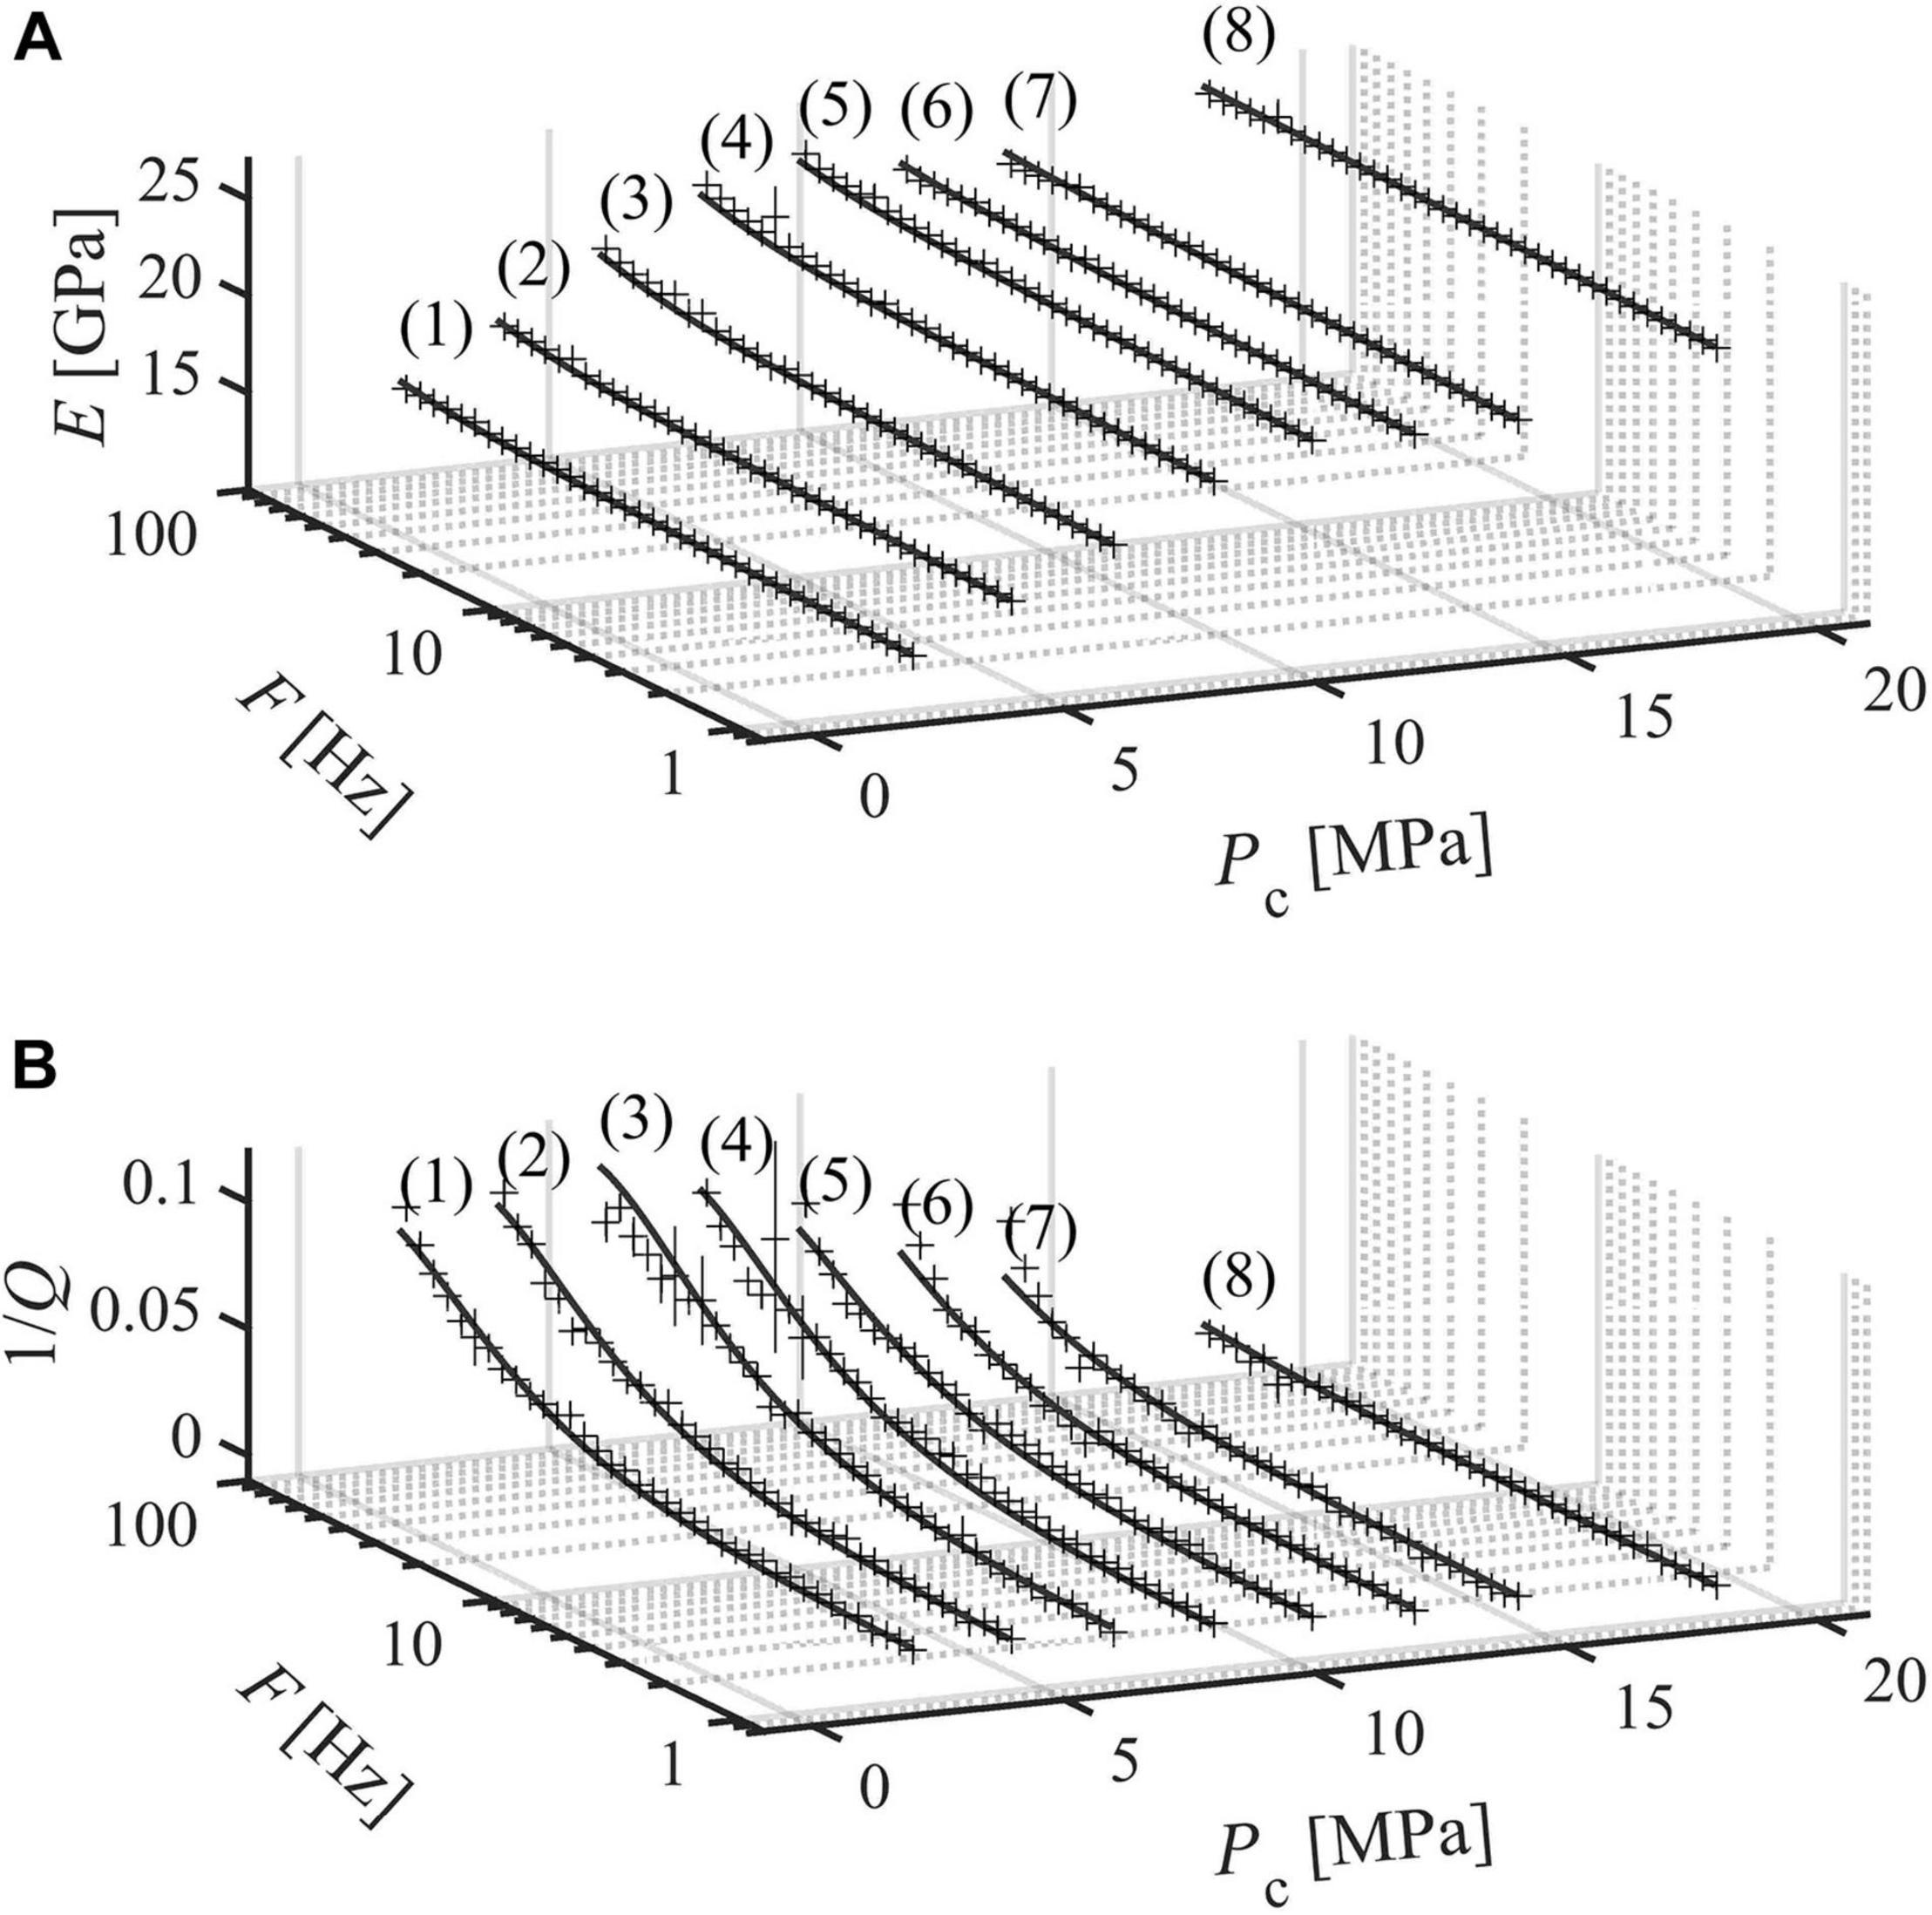
Figure 6. Measurements for case iv (BS3 SGW = 80.2%). (A) Young’s modulus and (B) attenuation in the bandwidth 1–100 Hz. Vertical bars indicate the sum of measurement uncertainty and repeatability. Results are interpolated with the nearly constant Q model (NCM) and the standard linear solid model (SLS) (Liu et al., 1976; Carcione, 2007).
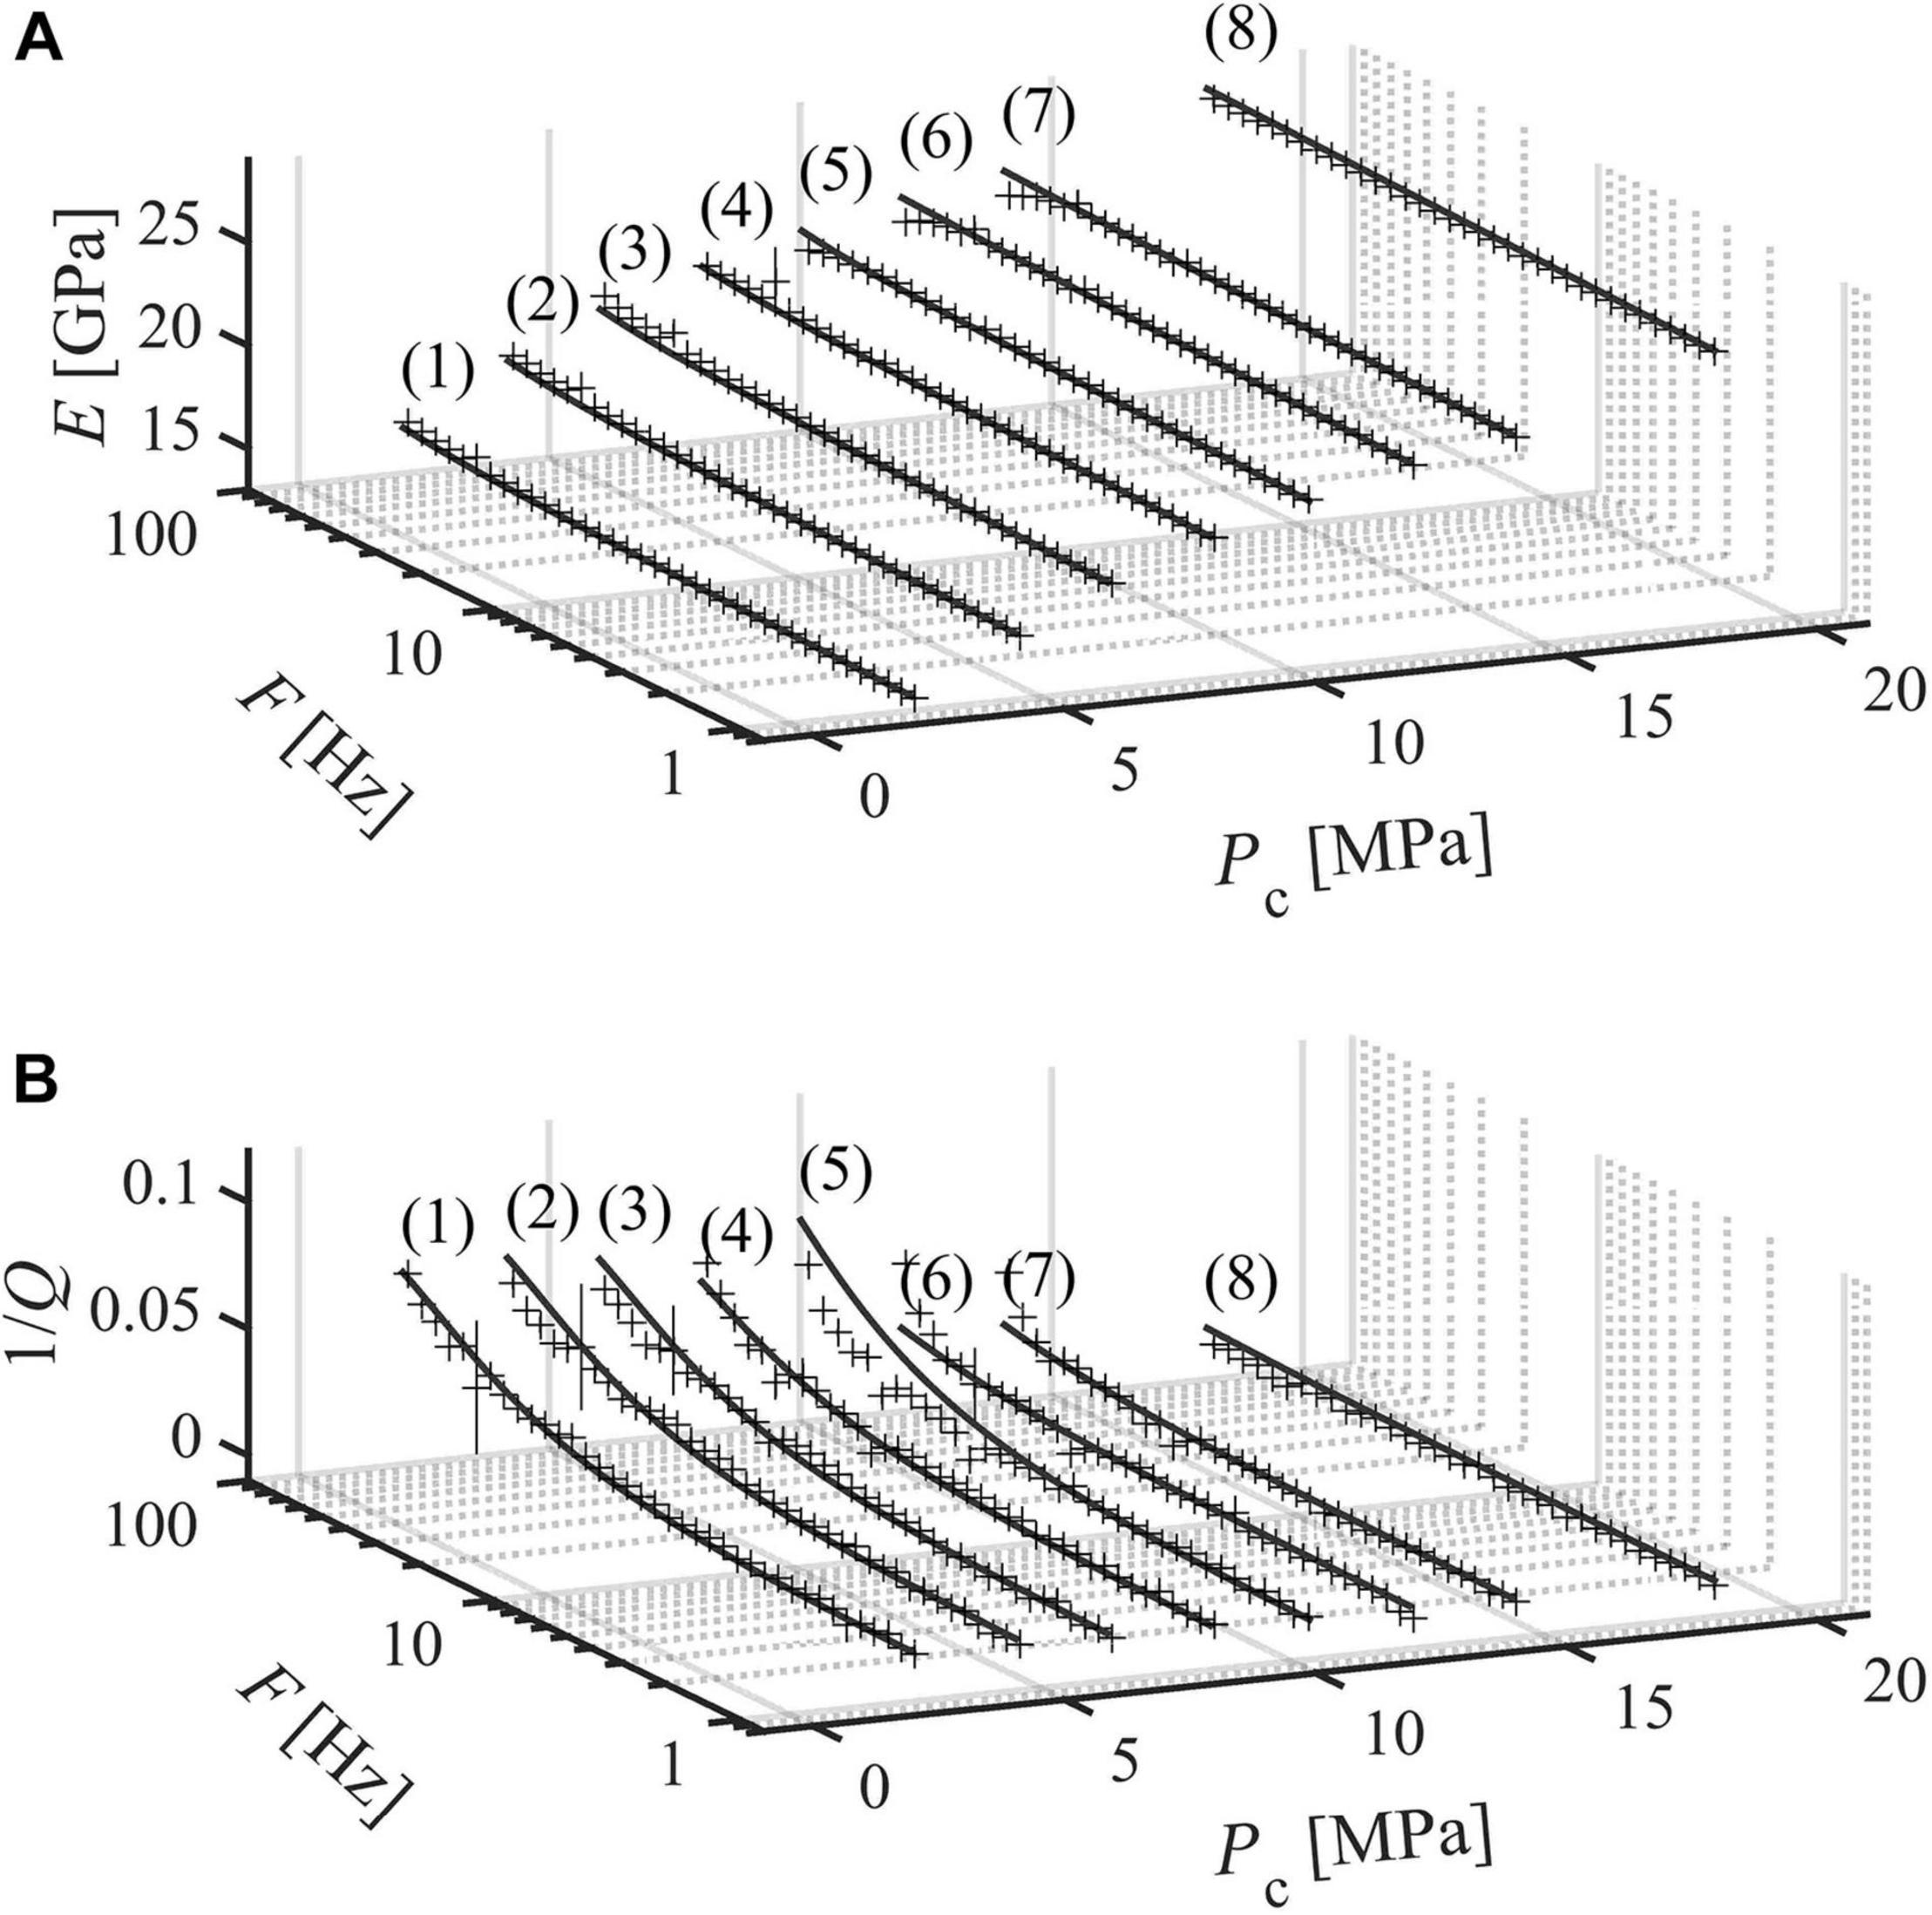
Figure 7. Measurements for case v (BS3 SGW = 86.4%). (A) Young’s modulus and (B) attenuation in the bandwidth 1–100 Hz. Results are interpolated with the nearly constant Q model (NCM) and the standard linear solid model (SLS) (Liu et al., 1976; Carcione, 2007).
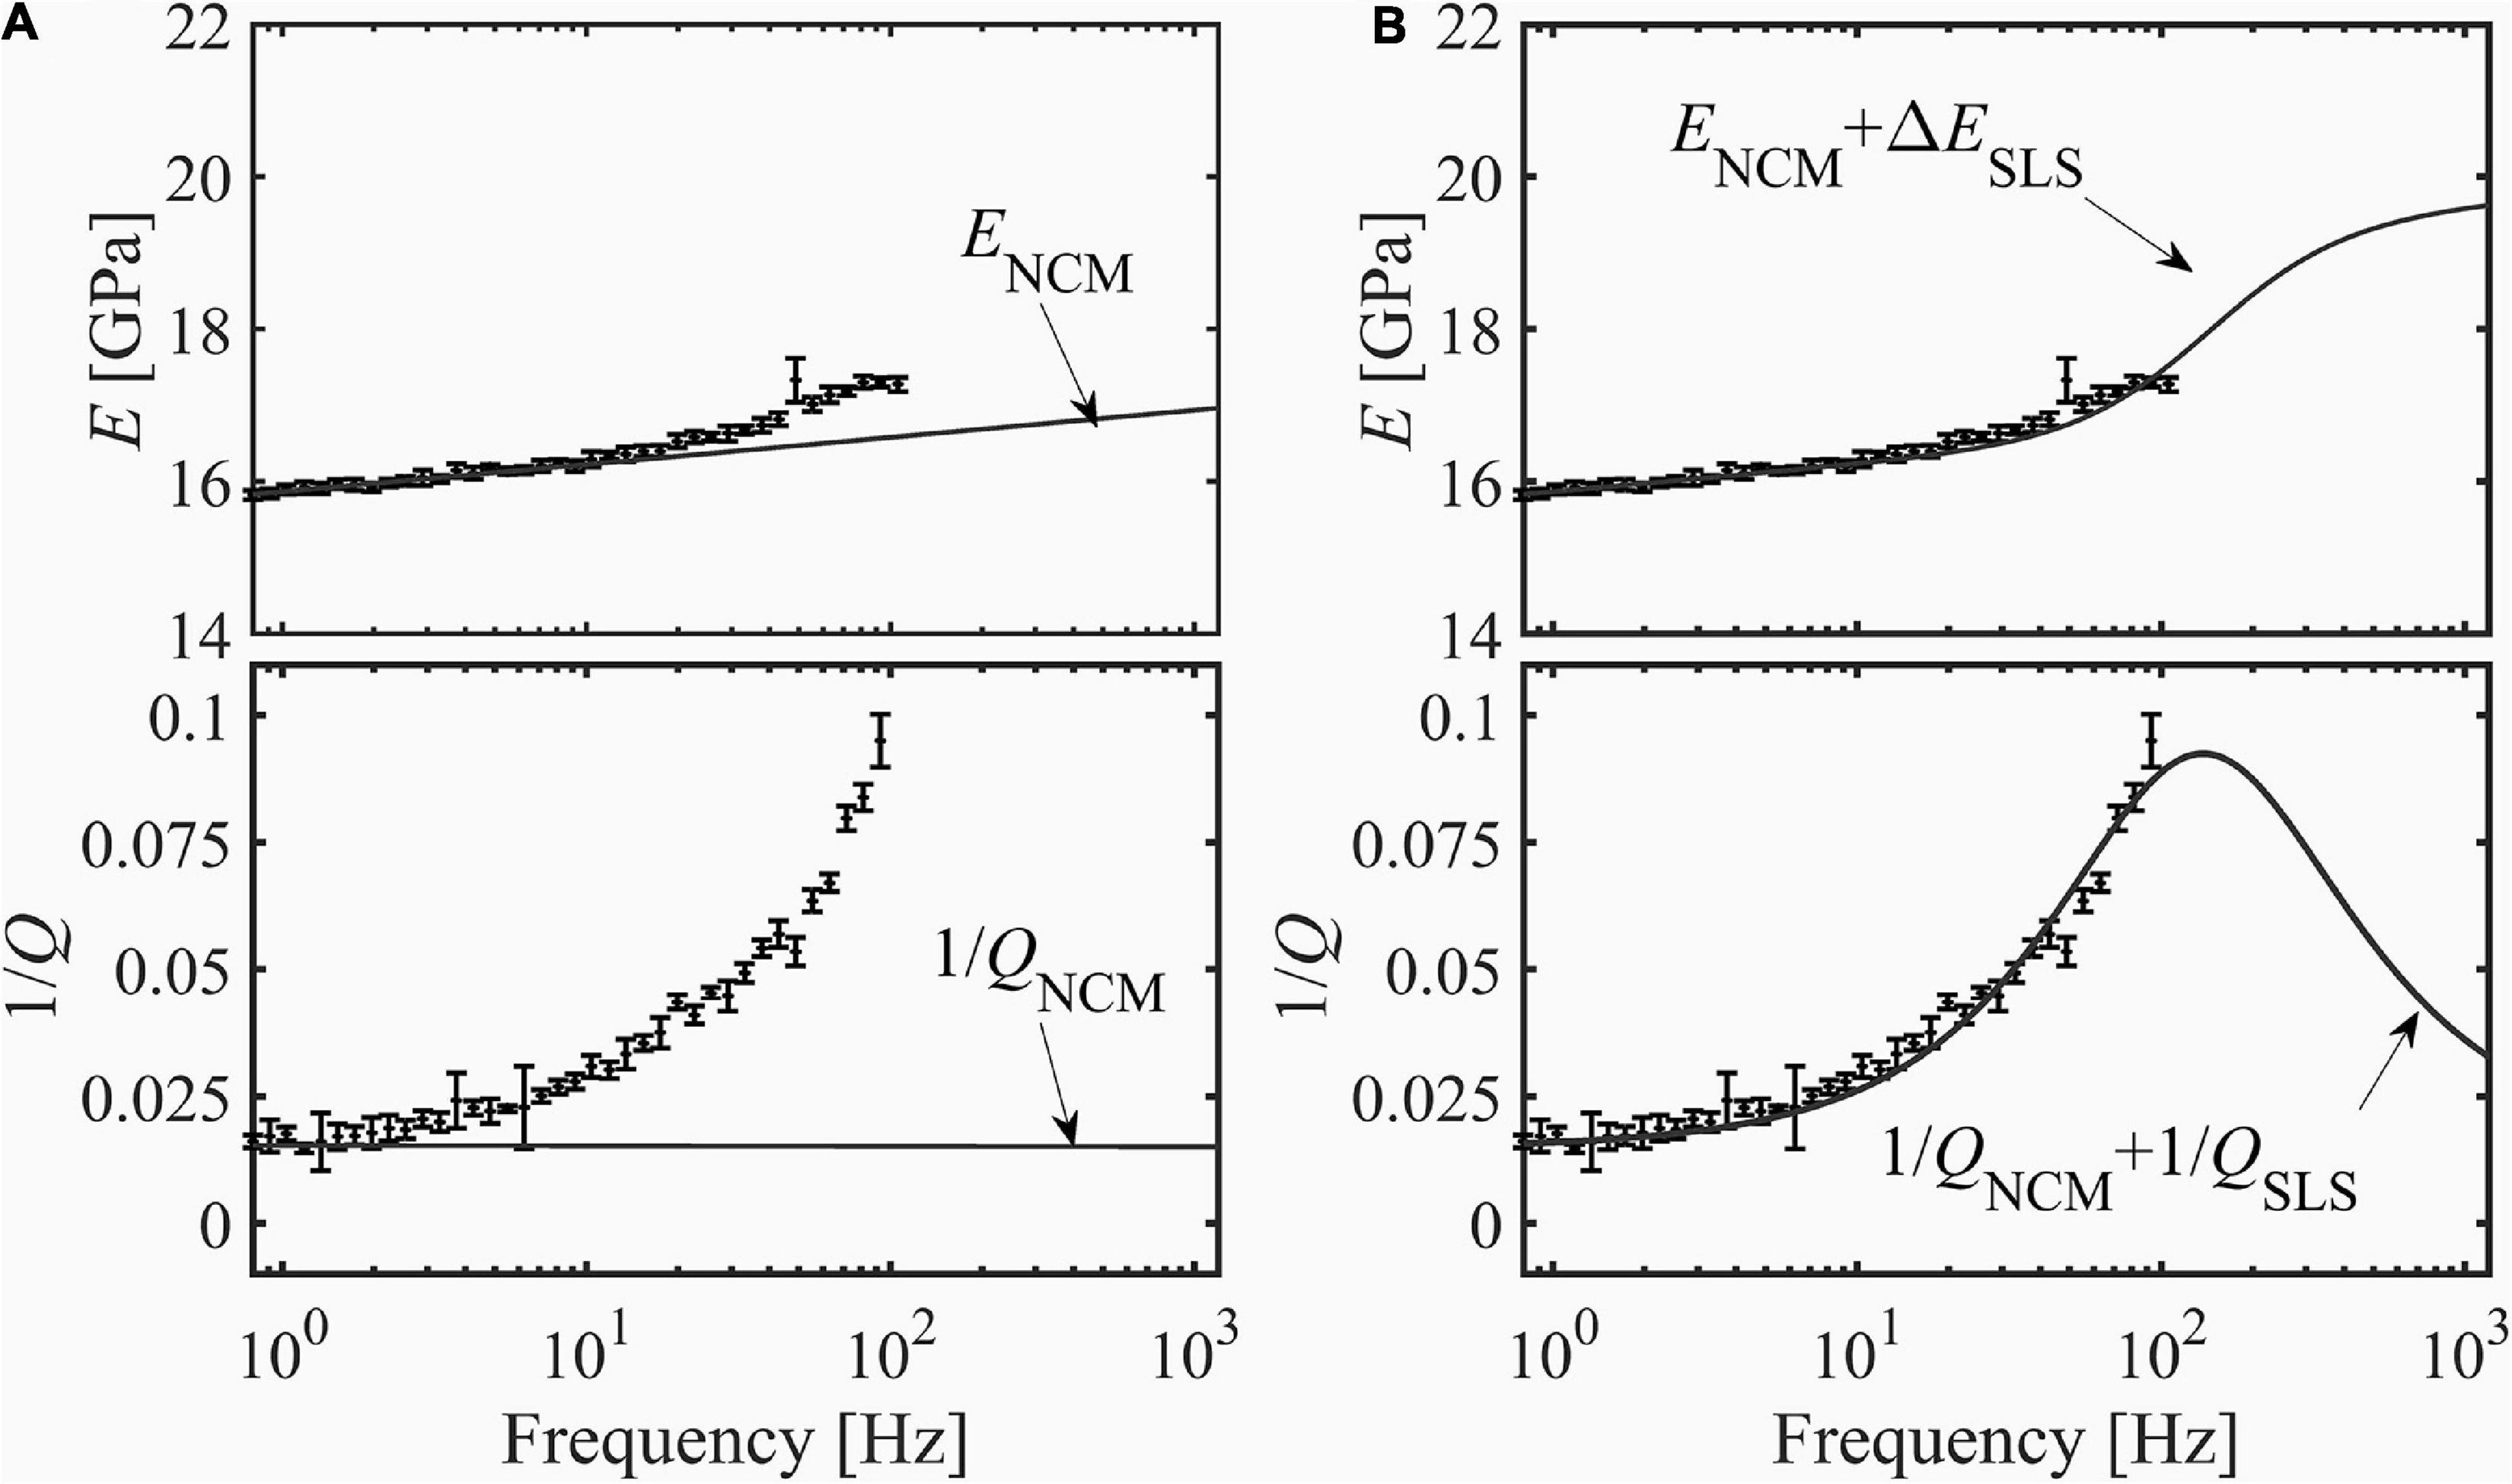
Figure 8. Close up of Figure 7 curves 4A and 4B. (A) First step of the fitting procedure. The linear increase of E and the frequency independent part of 1/Q are interpolated with the nearly constant Q model (NCM) (Liu et al., 1976). (B) Second step of the fitting procedure. The residuals between the NCM fitting and the measurements are interpolated with the standard linear solid model (SLS) (Carcione, 2007). Finally, NCM and SLS fittings are summed.
The curved face of the samples was covered with an aluminum foil, which was glued onto the rock, and a jacket made of Fluorinated Ethylene Propylene (FEP) shrink-tubing. These two layers do not affect the stiffness of the sample, isolate the sample from the confining medium (i.e., silicon oil) and avoid that the curved face of the sample acts as a free-flow boundary by limiting the saturating fluid to escape radially while the sample is dynamically stressed (Gardner, 1962; Dunn, 1986) (see Supplementary Material). In addition, the specimen end-faces were machined on a grinder to obtain a parallelism tolerance of ∼40 μm to meet the required experimental accuracy (Paffenholz and Burkhardt, 1989).
A uniaxial press, which is driven by a servo-electric uniaxial actuator, hosts the BBAV and applies the vertical stress on the sample (σ1). During testing, the stress field applied to the specimen was: σ1 = Pc+ 2.8 MPa and σ2 = σ3 = Pc. The vertical stress (σ1) was intentionally kept 2.8 MPa higher than the confining pressure to ensure good coupling between the horizontal interfaces of the sample assembly.
The low-frequency seismic wave was generated as a sinusoidal variation (σ) of the vertical stress. A piezoelectric motor, which is controlled by a high voltage amplifier, generates such a sinusoidal variation of σ1 that is necessary to estimate the complex Young’s modulus and attenuation. σ and ε are estimated for the measurements performed using a load cell and a cantilever, respectively. Calibration and additional details about the BBAV apparatus are reported in Tisato and Madonna (2012).
Longitudinal (VP) and transverse (VS) ultrasonic velocities were obtained using the pulse transmission method (Birch, 1960). VP of BS3 was measured during low-frequency testing inside the BBAV, and the stress field applied to the specimen was: σ1 = Pc+ 2.8 MPa and σ2 = σ3 = Pc. Uncertainties were estimated combining: (i) the uncertainty on picking the first arrival, (ii) the uncertainty on the delay introduced by the apparatus (26.1 ± 2 μs), (iii) the uncertainty on the sample length (1 mm), and (iv) the variability between two consecutive sets of measurements. The two sets of measurements were respectively collected for consecutive increasing and then decreasing Pc. For each confining pressure, the velocity was computed as the average between such two measurements. For each seismogram, the first arrival uncertainty was assessed by picking a minimum (tmin) and a maximum (tmax) time value to the first arrival. Such values were always around the wavelet onset, and they typically differ of ∼1 μs. The first arrival and its uncertainty were then calculated as and , respectively.
On the other hand, VP and VS of BS5s were measured employing another pressure vessel named Geneva-Rig in which the stress field applied to the specimen was hydrostatic, i.e., σ1 = σ2 = σ3 = Pc (Zappone et al., 2000; Kästner et al., 2020). We calculated uncertainties combining: (i) the uncertainty on picking the P- and S-wave arrivals, (ii) the uncertainties on the delay introduced by the apparatus (∼1.06 ± 0.4 μs and ∼10.5 ± 0.8 μs for P and S-waves, respectively) and (iii) the uncertainty on the sample length. Two tests were conducted at increasing and decreasing confining pressures between 1 and 40 MPa. The results, i.e., velocities vs confining pressure, were fit with empirical relations that are described by the following equation:
where A, B, C, and D are the best-fit parameters estimated through least square minimization (Eberhart-Phillips et al., 1989). Ultrasonic shear (μHF) and bulk (KHF) moduli were estimated as:
where HF stands for “high-frequency” and ρr is the effective sample density. For dry conditions, we refer to the ultrasonic bulk and shear modulus as: KHF (Sa = 1) and μ HF(Sa = 1), respectively; where Sa is the gas (air) saturation. Then, ultrasonic Young’s modulus (EHF) was estimated as:
Modulus dispersion and attenuation are linked through the Kramers-Kronig relation or causality (Lakes, 2009). Experimental data have been previously verified through the Kramers-Kronig relation (e.g., Mikhaltsevitch et al., 2016). Here, to verify that our results honor causality, we use two phenomenological models that obey the Kramers-Kronig relation. For frequency-independent measurements, we utilize the nearly constant Q model (NCM) (Liu et al., 1976). For frequency-dependent measurements, we use the sum of the NCM and the standard linear solid model (SLS) (Carcione, 2007) (see Supplementary Material). We assume that the sum of attenuation is an appropriate operation as Johnston et al. (1979) and Tisato and Quintal (2013) show that the frame-related attenuation and the fluid-related attenuation are independent and can be summed to obtain the total attenuation of the saturated sample. In particular, we assume that the frame related attenuation is constant, regardless of the saturation level, and the fluid-related attenuation is a function of saturation and can be represented by the SLS rheology. Such fitting is possible as wave-induced fluid flow mechanisms and SLS produce a low-frequency asymptote that scale as Q–1 ∝ f (Mueller et al., 2010).
The characteristic frequency for patchy-saturation is:
where κ is the rock permeability, Ks is the bulk modulus of the saturated rock, L is the characteristic size of the patches (White, 1975). For the present experiments, we can assume κ = 10–12 m2, L ranging between 1 and 10 cm, ηf ranging between ηW and ηGW and Ks ranging between 10 and 20 GPa. The selected range of Ks agrees with the literature, and the ultrasonic measurements will later confirm it. According to this parameter space, fpatchy ranges between ∼28 Hz and ∼63 kHz.
Jones (1986) provides a formula for the squirt-flow characteristic frequency, which is:
where α is the characteristic crack aspect ratio for the rock, and Kg is the bulk modulus of the rock frame. For the present experiments, we assume α ranging between 10–4 and 10–3 (Zimmerman, 1991), ηf ranging between ηW and ηGW and Kg = 37 GPa, as Berea sandstone is mainly composed of quartz. According to this parameter space, fsquirt ranges between ∼3 Hz and 37 kHz.
The two wave-induced-fluid-flow mechanisms operate in the bandwidth of investigation (i.e., 1–100 Hz); therefore, both are considered as potential attenuation mechanisms in our experiments. We also rule out the possibility that the observed frequency-dependent attenuation is caused by global flow as the characteristic frequency of such attenuation mechanism ranges above 30 kHz, which is well above the upper limit of the investigated bandwidth (Biot, 1956).
To further investigate the occurrence of wave-induced-fluid-flow we compared ultrasonic and low-frequency elastic properties to effective medium theories: namely Biot-Gassmann-Hill (Johnson, 2001) and Gassmann fluid substitution (Gassmann, 1951), respectively; And, we also compared the phenomenological model fittings with analytical solutions for squirt-flow and patchy-saturation (White, 1975; Dutta and Odé, 1979; Gurevich et al., 2010).
We use the model proposed by Gurevich et al. (2010) to estimate complex frequency-dependent Young’s modulus due to squirt-flow. Such a model deals with fully saturated rocks while our samples are partially saturated. Thus, we assume that squirt-flow operates only in the liquid saturated portion of the sample and that the dry portion of the sample presents negligible attenuation. Under this assumption, we approximate the imaginary part of the sample Young’s modulus by multiplying the imaginary part of the calculated Young’s modulus and the saturation. Attenuation is then computed as the ratio between the imaginary and the real part of Young’s modulus. The procedure and the equations that are used to model squirt-flow are reported in the Supplementary Material.
The model requires the knowledge of: (i) Bulk and shear modulus of the dry rock; (ii) Bulk and shear modulus of the mineral making up the rock (Kg and μg); (iii) Crack porosity (Φc); and (iv) Mean crack aspect ratio (α). For the saturating fluid, the required properties are: (i) Density (ρw or ρGW); (ii) Viscosity (ηw or ηGW); and (iii) Bulk modulus (Kw or KGW). In addition, the model needs the effective pressure at which the cracks can be considered closed (Ph) and the related rock bulk modulus (Kh).
Complex Young’s modulus and attenuation related to patchy-saturation are calculated according to the model proposed by White (1975) and Dutta and Odé (1979). To model patchy saturation, we use the Matlab code “patchw” provided by Mavko et al. (2009), and that can be downloaded at https://pangea.stanford.edu/departments/geophysics/dropbox/SRB/public/data/RPHtools.htm.
The model assumes that the rock is saturated with two fluid phases, i.e., liquid and gas. In addition to the petrophysical parameters that are listed in the previous paragraph, and with the exception of Φc, α, Ph, and Kh, the model requires (i) Rock porosity (Φ); (ii) Hydraulic permeability (κ); (iii) Gas density (ρa); (iv) Gas viscosity (ηa); (v) Gas bulk modulus (Ka); and (vi) The radius representing the average size of the liquid patches that are surrounded by air (rp).
Here, we report the measurements for seven different cases. For the sake of simplicity, we present all the measurements for case i to v but not for case vi and vii. Nevertheless, results from all the cases are available for download and used later for the modeling and discussion:
i. Sample BS3 when dry (equilibrated with room humidity);
ii. Sample BS2 saturated with 60% water (SW = 60%);
iii. Sample BS3 saturated with 53.5 ± 1.6% GWmix (SGW = 53.5%);
iv. Sample BS3 saturated with 80.2 ± 2.3% GWmix (SGW = 80.2%);
v. Sample BS3 saturated with 86.4 ± 2.5% GWmix (SGW = 86.4%);
vi. Sample BS3 saturated with 35.6 ± 1.1% GWmix (SGW = 35.6%);
vii. Sample BS3 saturated with 71.6 ± 2.1% GWmix (SGW = 71.6%).
The portion of pore volume that was not saturated with water or GWmix was saturated with air. Thus, we express air saturation as:
Where ∨ means or.
We present Young’s modulus and attenuation values for case i through v. For each case we report curves for eight different confining pressures ranging between 0 and 20 MPa. Each curve consists of 30 to 36 measurements taken at frequencies between 1 and 100 Hz. Therefore, we present ∼1440 measurements of Young’s modulus and attenuation. Each attenuation measurement is calculated as the average of five measurements acquired at the same frequency. The standard deviation of the five repetitions is used to estimate precision that is shown as half-height of the error bar.
For dry Berea sandstone (case i), attenuation is frequency-independent, and around 0.01, and Young’s modulus increases logarithmically with frequency (Figure 2). Data are in agreement with the NCM model (Figure 3).
For each test of case i, we averaged Young’s modulus and the attenuation over the frequency bandwidth. As a general trend, we observe that as confining pressure increases, the averaged E increases from ∼17 to ∼26 GPa, and 1/Q decreases from ∼0.01 to ∼0.005.
Besides, measurements performed on partially saturated samples (case ii, iii, iv, and v) show two distinct regimes:
a. At confining pressures above 14 MPa, attenuation is frequency-independent with values similar to those measured in case I (i.e., at dry conditions). Moreover, Young’s modulus increases logarithmically with frequency, which is in agreement with the NCM model;
b. At confining pressures below 14 MPa, attenuation and Young’s modulus are frequency-dependent (Figures 4–7) and can fit the sum of the NCM and SLS model (Figure 8).
SLS fitting provides an estimate for corner frequency (fc), i.e., the frequency at which attenuation is maximum. Such corner frequencies range between 114 and 579 Hz (Table 2). For example, for case ii (SW = 60%) and confining pressure 8 MPa, 1/Q increases from ∼0.01 to ∼0.08 as frequency increases from 1 to 100 Hz (Figure 4 curve 5). Similarly, measurements conducted on the samples saturated with GWmix (case iii, iv and v) are frequency-dependent, and 1/Q varies with confining pressure. For case iii (SGW = 53.5%), 1/Q values are statistically lower than those measured for case iv and v (SGW = 80.2% and 86.4%, see Figures 6–8), suggesting that the higher the saturation - in the considered range - the higher the attenuation. For each curve in Figures 4A, 5A, 6A, 7A and each curve in Figures 4B, 5B, 6B, 7B we calculate:
a. the mean value of Young’s modulus ;
b. the maximum values of attenuation [Max(1/Q)];
c. the minimum values of attenuation [Min(1/Q)].
Such values are reported in Figure 9, highlighting how increases with confining pressure and how dispersion and attenuation decrease for confining pressures > 12 MPa.
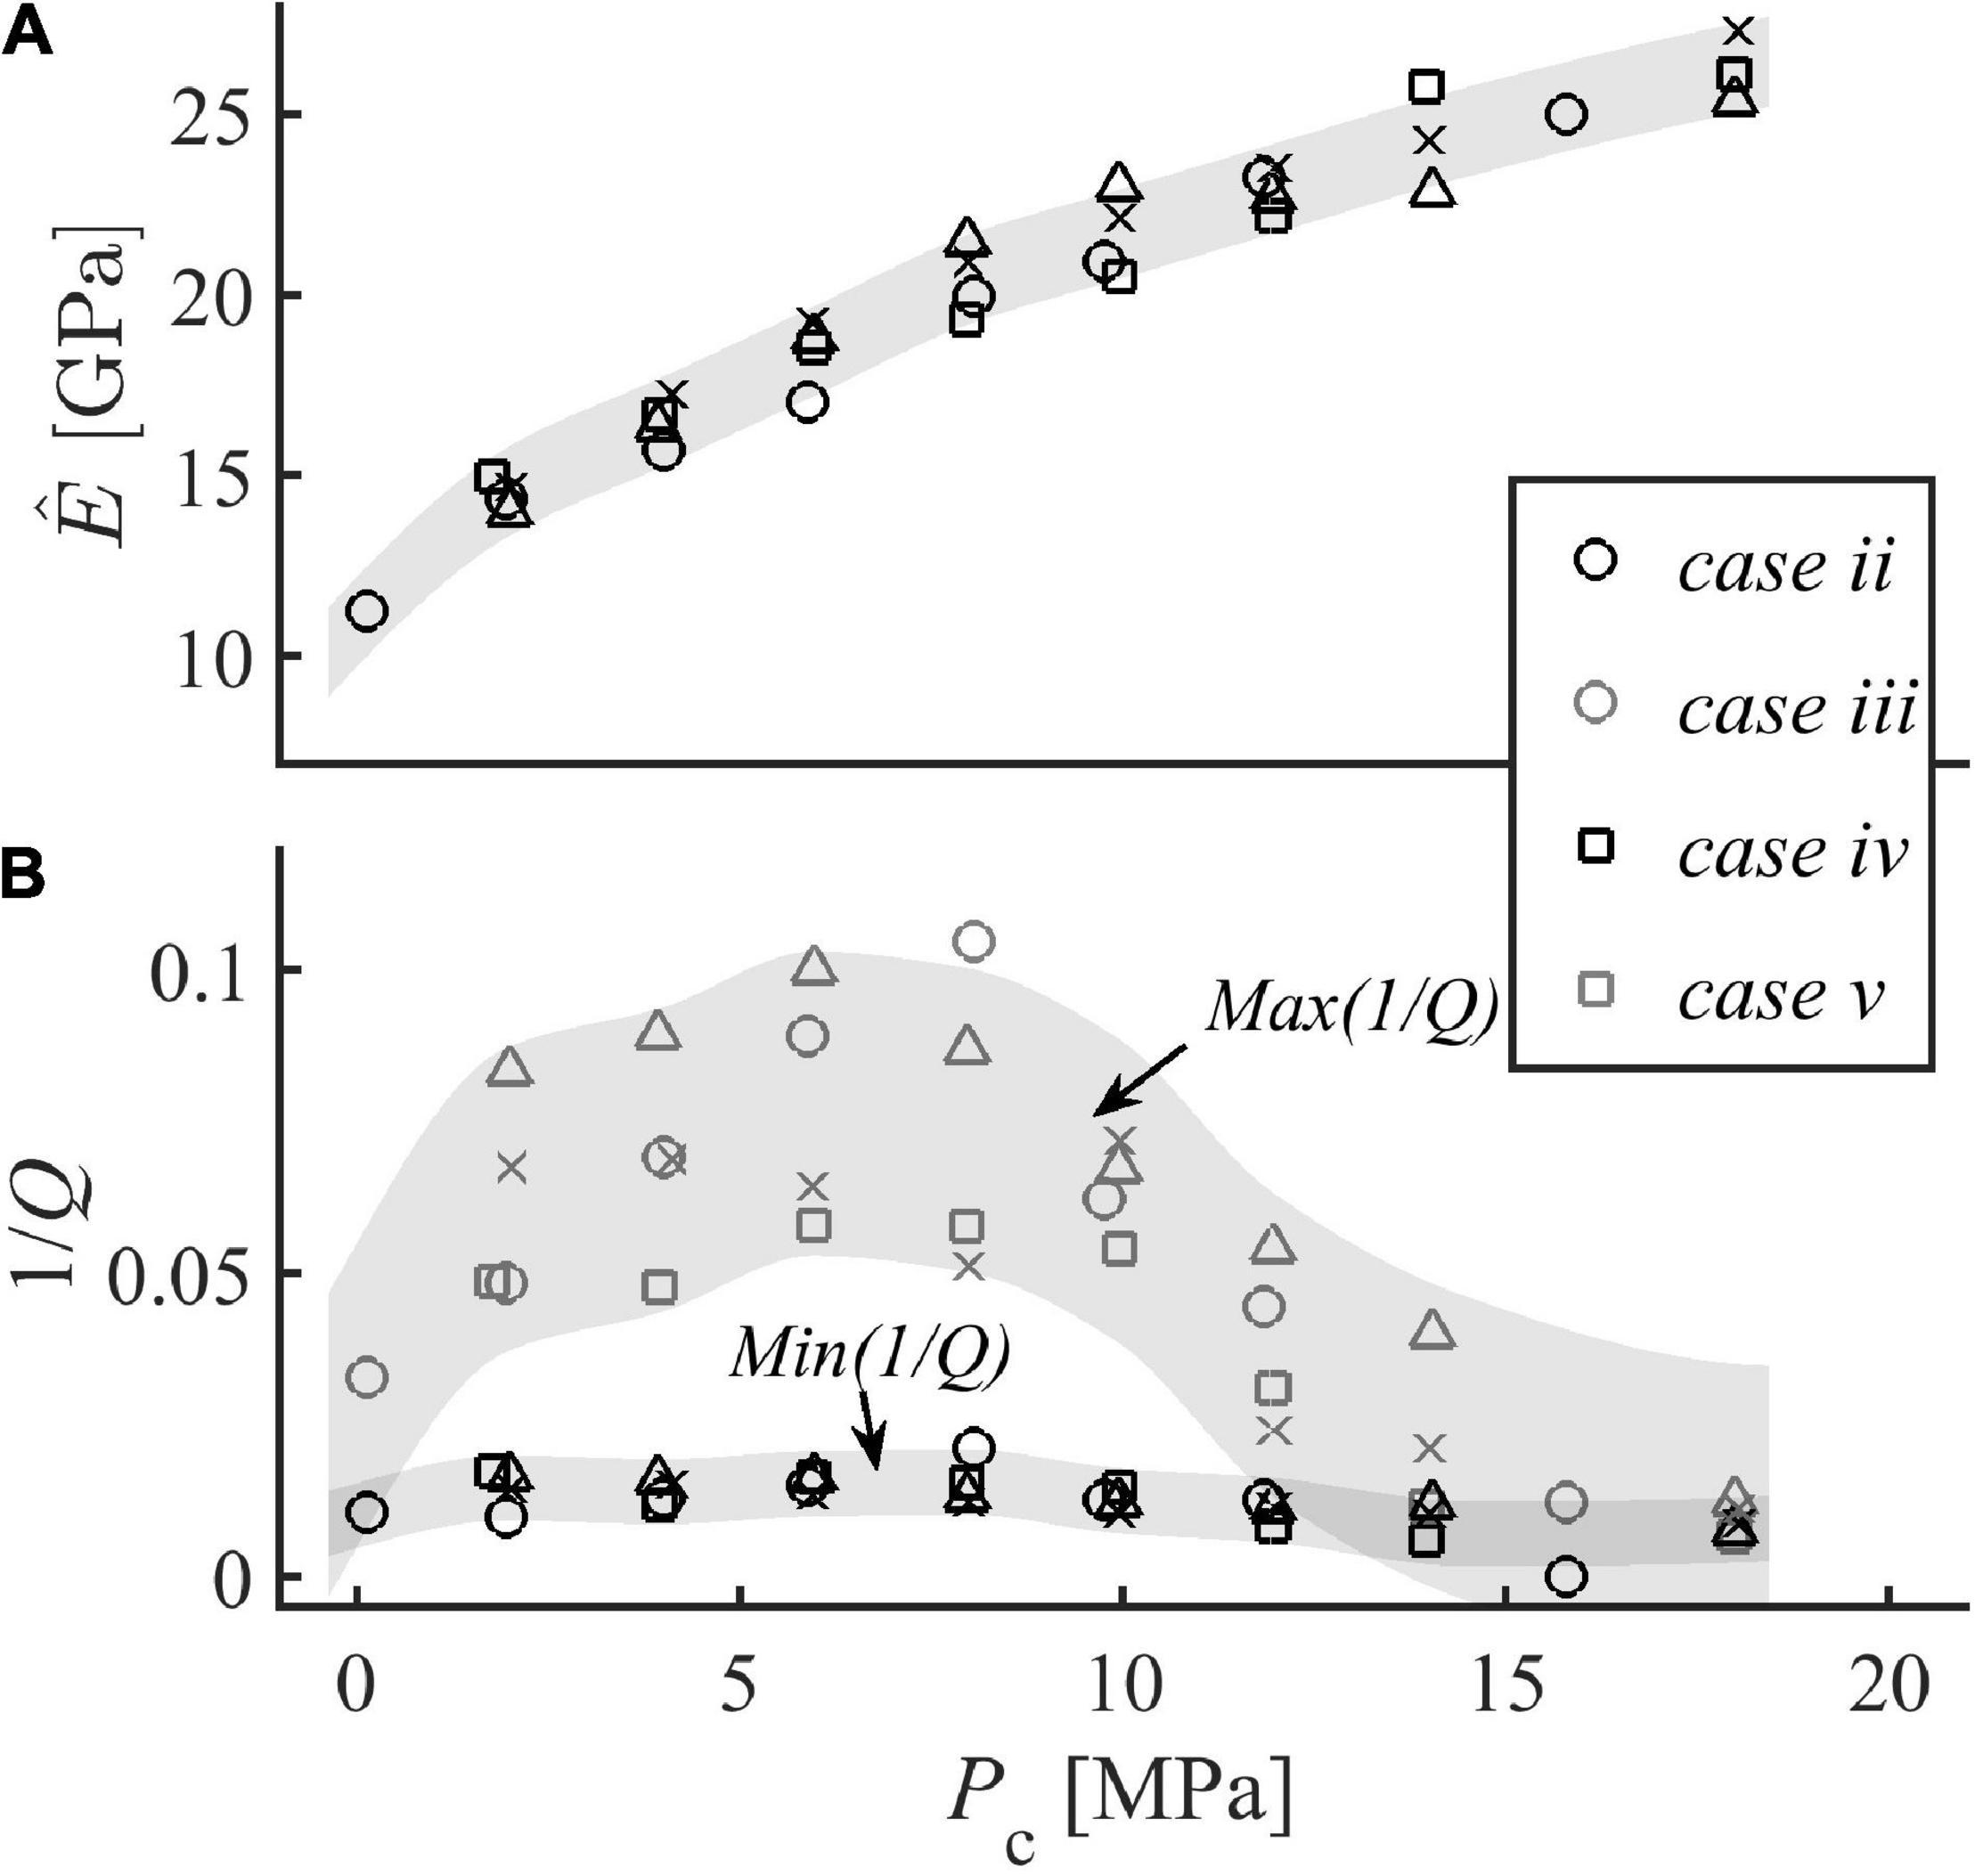
Figure 9. (A) Mean values of Young’s modulus measured in the bandwidth 1–100 Hz for case ii, iii, iv, and v. (B) Minimum [Min(1/Q)] and maximum [Max(1/Q)] values of attenuation in the bandwidth 1–100 Hz measured for case ii, iii, iv, and v.
Longitudinal (Vp) and transverse (Vs) ultrasonic velocities of dry BS5s increase with confining pressure (0 - 40 MPa) from 2426 to 3752 m/s and from 1880 to 2429 m/s, respectively. Curves that show velocities as a function of confining pressure are fit according to Eq. 4, yielding the following two equations:
Vp was also measured for sample BS3. Figure 10 shows velocities curves as a function of confining pressure for different cases. Saturated BS3 exhibits higher Vp than those measured for dry BS3. For example, for case v (SGW = 86.4%) and vi (SGW = 35.6%), and confining pressure comprised between 2 and 25 MPa, Vp ranges between 3328 and 3822 m/s and between 3073 and 3652 m/s, respectively. These results agree well with the literature (e.g, Christensen and Wang, 1985; Winkler, 1985; Prasad and Manghnani, 1997).
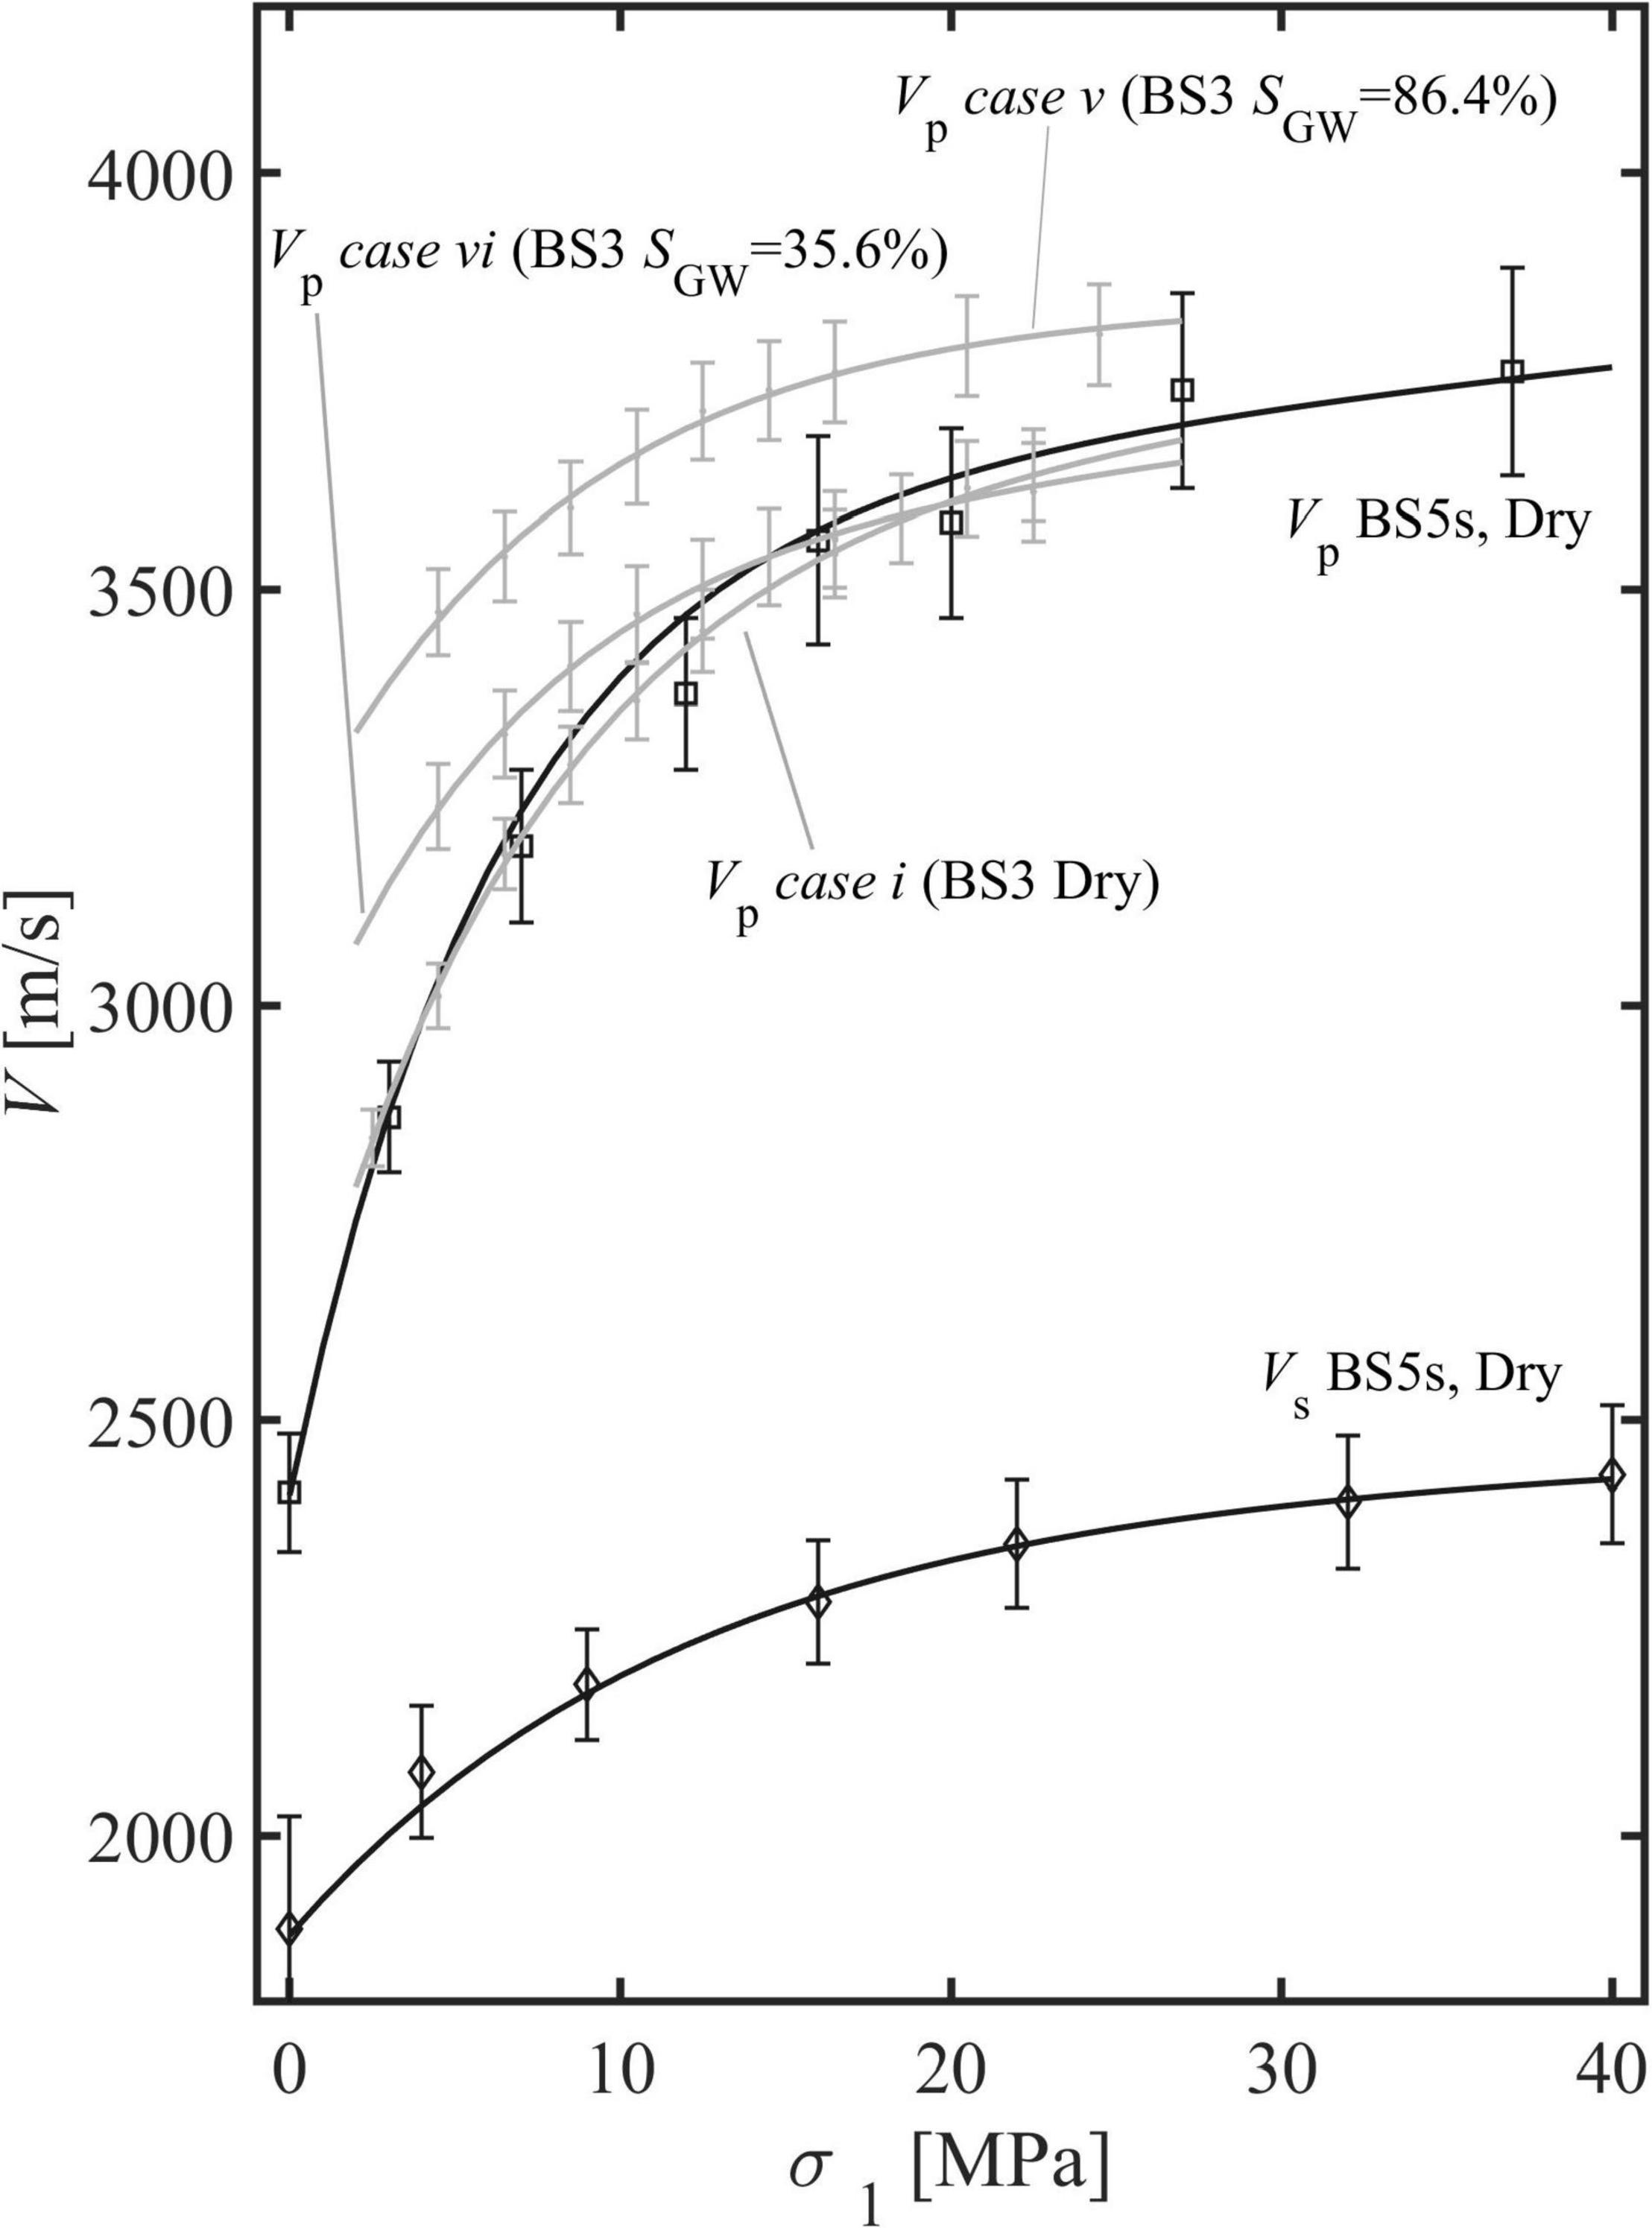
Figure 10. Longitudinal (Vp) and transverse (Vs) wave speeds measured for samples BS5s and BS3 as a function of vertical stress (σ1). Ultrasonic wave speeds were measured for all the cases except case ii. However, for the sake of visualization, we show only a few cases. Error bars are calculated based on manual-picking uncertainty, sample length uncertainty and apparatus calibration.
Frequency-independent attenuation is observed for dry samples and samples confined at Pc ≥ 14 MPa, and it could be caused by grain-to-grain friction (Walsh, 1966). Measurements show that as confining pressure increases, elastic moduli increase, and 1/Q decrease (Table 2). Similar results for ultrasonic waves were presented, for instance, by Molyneux and Schmitt (1999), Prasad and Manghnani (1997), and Toksöz et al. (1979). Elastic moduli increase as confining pressure closes cracks increasing grain-to-grain traction (Zimmerman, 1991). A decreasing 1/Q might be explained by pressure-dependent crack closure and grain-to-grain traction increment (Molyneux and Schmitt, 1999). The contact between two grains occurs only on a limited area throughout the contact of several asperities populating the grains’ surfaces (Archard, 1953). Hulikal et al. (2015) suggest that each single asperity contact rheology could be modeled by a standard linear solid exhibiting a specific relaxation time (i.e., corner frequency). Relaxation time is a function of the asperity state and the petrophysical properties of the material. A large number of asperity contacts, making up the whole population of grain-to-grain contacts of a rock sample, will eventually exhibit a broad spectrum of corner frequencies. The superposition of all the corner frequencies would eventually produce a macroscopic rheology that might be described by a nearly constant attenuation model (Liu et al., 1976). We hypothesize that a decrease in attenuation, as Pc increases, could be the result of contact stiffening and increase of the grain contacts areas (Archard, 1957). In fact, contact stiffening would change the strain partitioning between contacts and solid grains, hindering the overall viscous behavior due to contact deformation (Johnston et al., 1979).
Attenuation measurements are frequency-dependent for partially saturated Berea sandstone and confining pressure < 14 MPa. Measurements agree with the sum of the nearly constant Q model (NCM) and the standard solid model (SLS), confirming that attenuation and Young’s modulus obey the Kramers-Kronig relation (Lakes, 2009; Figures 4–7). As already suggested by Kuteynikova et al. (2014) and Tisato and Quintal (2013, 2014) in partially saturated Berea sandstone attenuation can result from the sum of frequency-independent and frequency-dependent mechanisms. Here, we assume that also in saturated samples, friction causes the frequency-independent attenuation, while patchy-saturation and/or squirt-flow cause the frequency-dependent attenuation (White, 1975; Dutta and Odé, 1979; Mavko and Jizba, 1991)(White, 1975; Dutta and Odé, 1979; Mavko and Jizba, 1991). In the next paragraphs, we will test such a hypothesis by employing some theoretical models to fit the observations. The petrophysical parameters employed in the modeling are listed in Table 3.
Patchy-saturation characteristic frequency fpatchy sets the limit between the flow or “relaxed” limit and no-flow or “unrelaxed” limit. The two limits are valid for f << fpatchy and f >>fpatchy, respectively. As already mentioned in par. 2.5, in our case patchy-saturation might operate at frequencies between 28 Hz and 63 kHz. Thus, ultrasonic measurements (EHF), which have been collected at f > 100 kHz, represent a good proxy for the “unrelaxed” limit.
The unrelaxed Young’s modulus (E_U) can be calculated as:
where K_U is the unrelaxed bulk modulus calculated according to the Biot-Gasmmann-Hill limit (Johnson, 2001):
where K_1or K_2 (i.e., K1 ∨ 2) are:
where Kf is the liquid bulk modulus, Ka is the air bulk modulus, Kdryis the dry bulk modulus measured at ultrasonic frequencies, i.e., KHF (S_a = 1).
At low frequencies, we observe the left flanks of attenuation peaks whose corner frequencies are typically above 100 Hz. Thus, ESF at f < 100 Hz represents a good proxy for the “relaxed” limit. We calculate Young’s modulus for the “relaxed” limit (ELF) by averaging ESF measurements at frequencies < 10 Hz.
The relaxed Young’s modulus (E_R) is then calculated as:
(Mavko et al., 2009), where K_Ris the relaxed bulk modulus for a specific fluid saturation (i.e., KR (S_a < 1)) and can be estimated by means of the Gassmann fluid substitution:
(Gassmann, 1951). Because we have no direct measurements of bulk modulus at low frequencies and dispersion is negligible at seismic frequency, in Eq. 17 we use Kdry. Dry Young’s modulus calculated from KHFand μHF agree very well with low frequency dry Young’s modulus indicating negligible dispersion. In Eq. 17 Kf is the effective fluid bulk modulus that can be estimated as:
where Ka and Kl are the bulk moduli of the gas and the liquid, respectively (Reuss, 1929). The liquid can be either water or GWmix.
According to Gassmann (1951) shear modulus is not affected by saturation, therefore we assume that the relaxed shear modulus μR is:
EHF and ELF at different saturations and confining pressures (i.e., 2, 6, 10, and 14 MPa) are then compared to EU and ER (Figure 11). ELF and EHF follow the two theoretical limits and the dispersion - i.e., the vertical distance between ELF and EHF decreases with increasing confining pressure, similarly, to the dispersion between ER and EU, suggesting again that the wave-induced-fluid-flow mechanism is more active at low confining pressures.
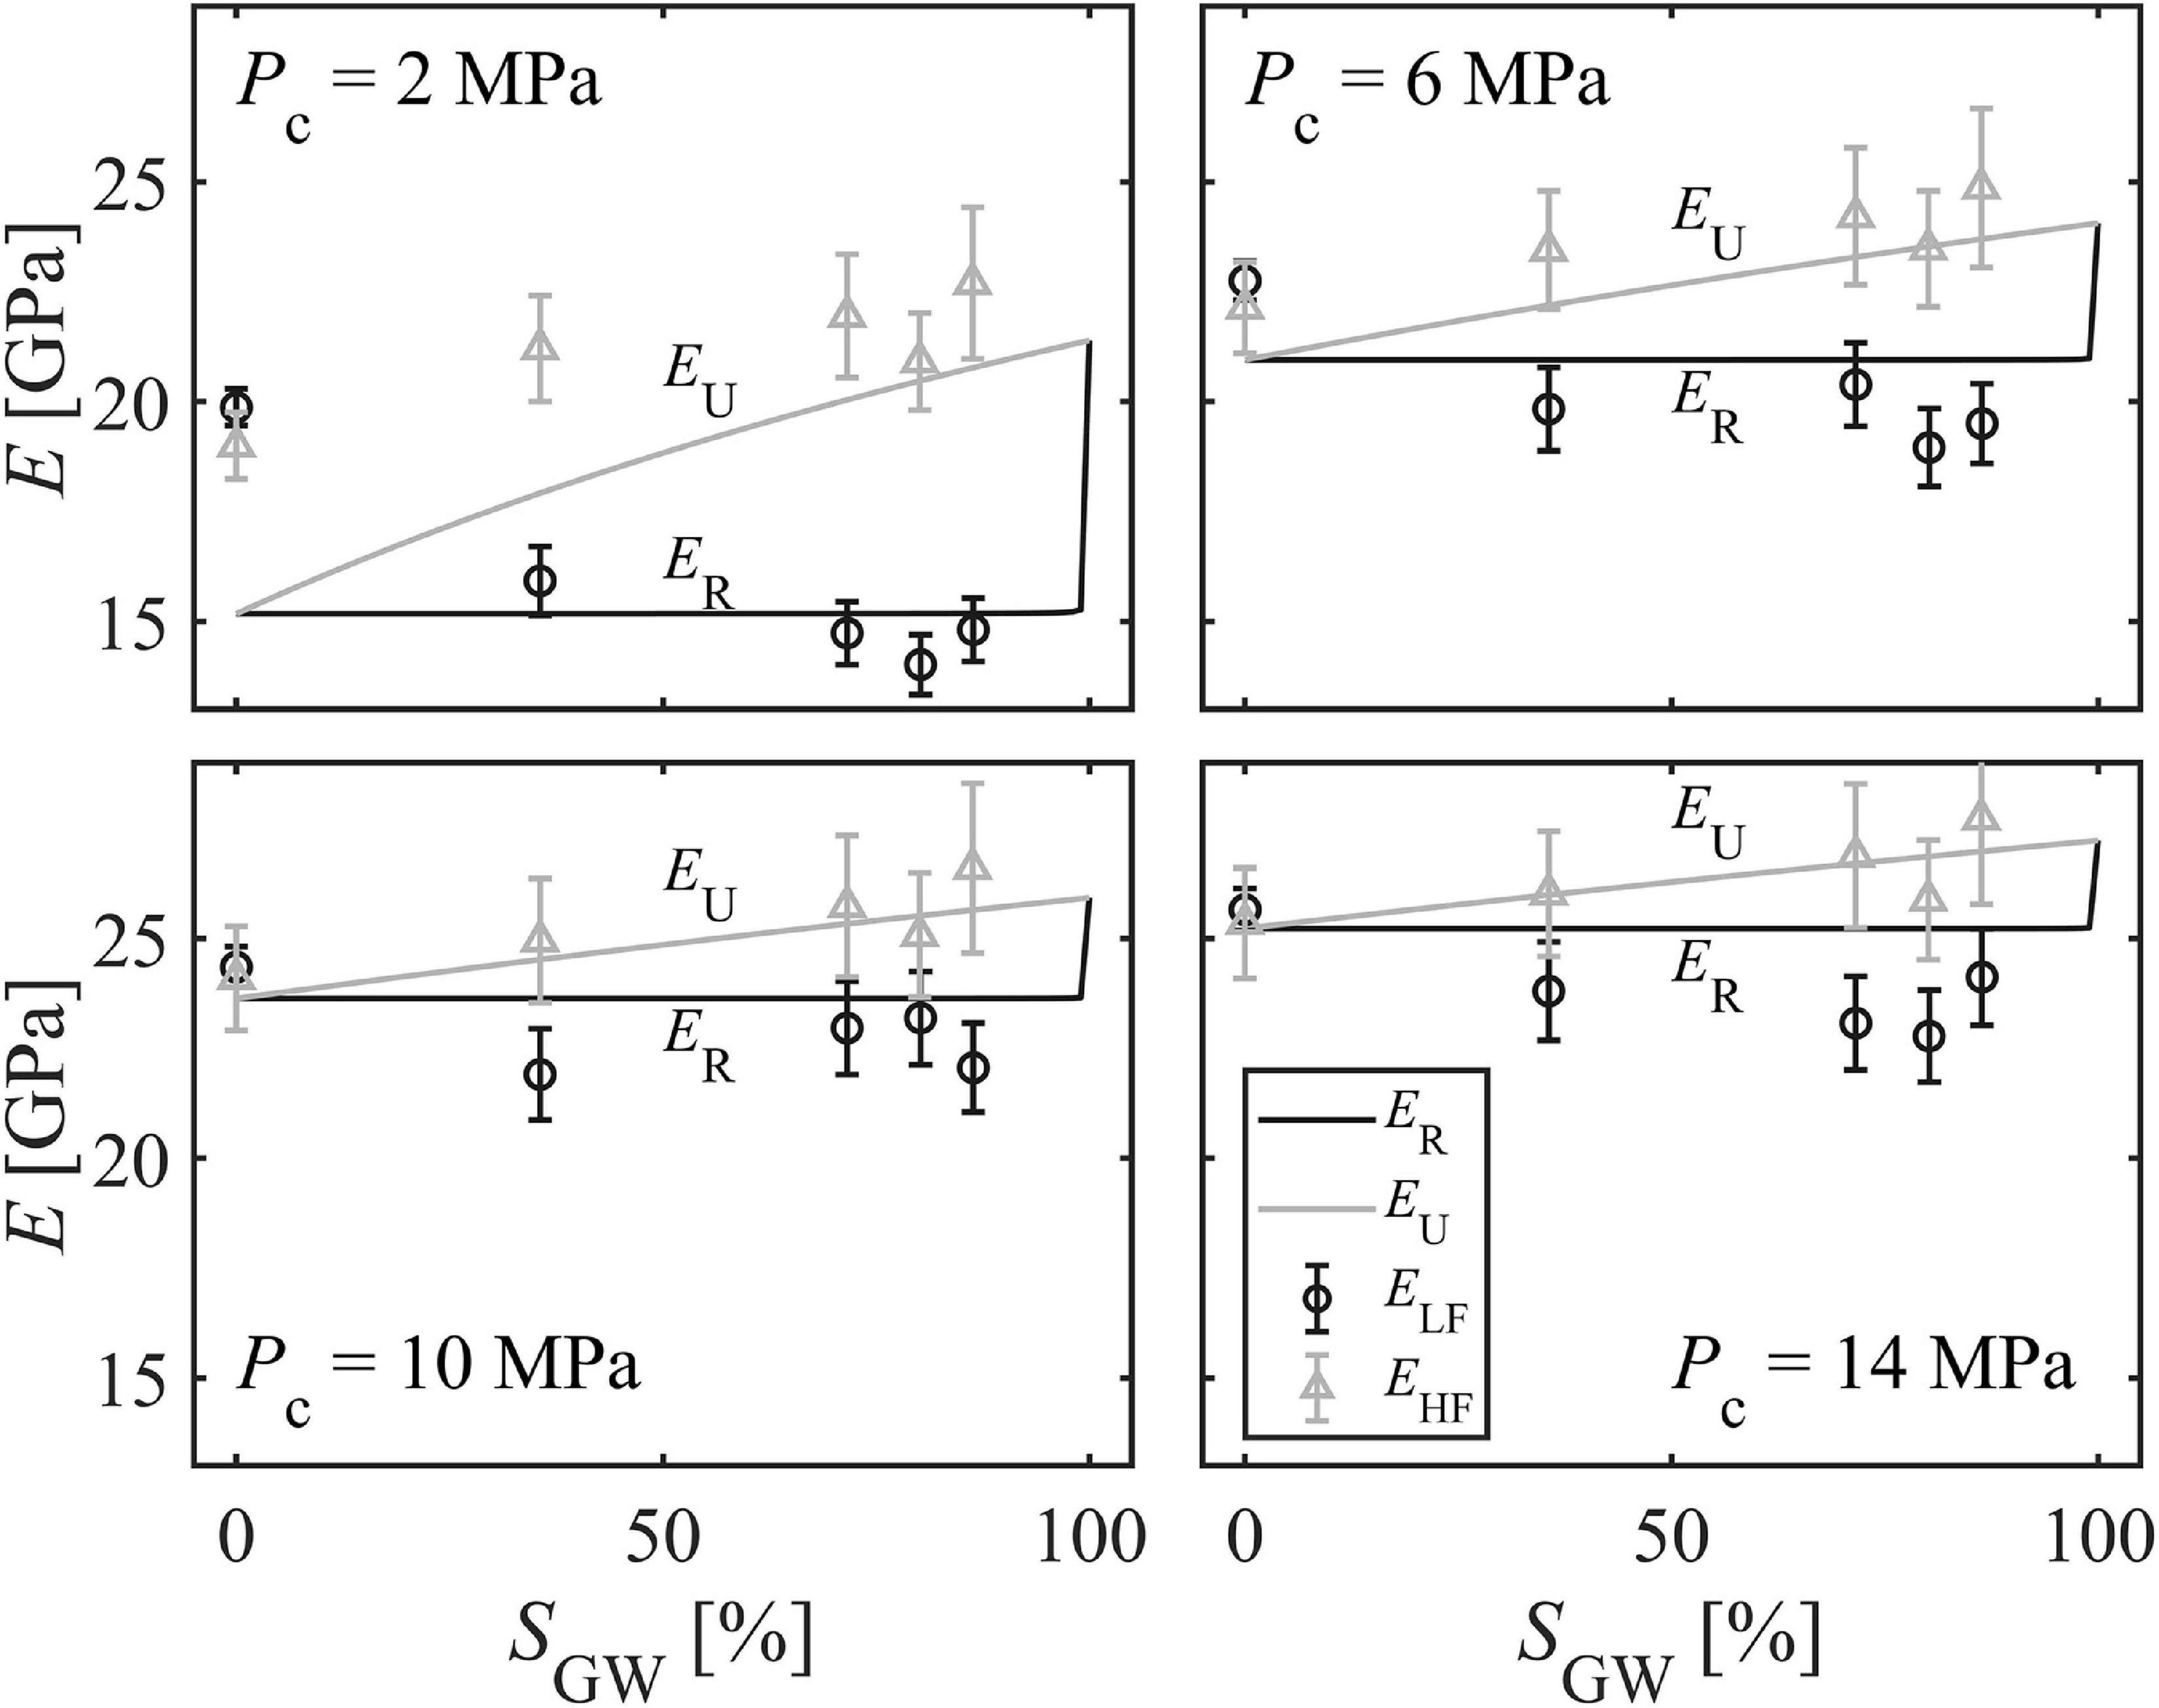
Figure 11. Young’s modulus measured at low frequencies (1–10 Hz, ELF) and at ultrasonic frequencies (0.1 MHz, EHF) compared to the Biot-Gassmann-Hill limit (EU) and the Gassmann fluid substitution (ER) (Gassmann, 1951; Johnson, 2001). The former represents a proxy for patchy-saturation model (Mavko et al., 2009).
Both theoretical limits do not predict the decrease in Young’s modulus between dry and saturated conditions. Such a behavior is common in sandstones and, according to the literature, in rocks like Berea sandstone, it could be related to the softening of the cement or the swelling of the clay minerals at grain boundaries (Cadoret, 1993).
Squirt-flow could also explain the observed frequency-dependent attenuation curves (Mavko and Jizba, 1991; Gurevich et al., 2010). Here we show that the observed corner frequencies are compatible with squirt-flow theory and typical values of crack aspect ratios for Berea sandstone. We estimate the range for crack aspect ratio by means of Eq. 9 and by substituting fsquirt with fc. This, provides a crack aspect ratio α′ ranging between ∼1.4x10⁻⁴ and ∼4.5x10⁻⁴, which is in agreement with the literature (Zimmerman, 1991).
On the other hand, ultrasonic measurements suggest that crack closure occurs at confining pressure ∼40 MPa, where ultrasonic velocities vs. confining pressure curves tend to flatten (Figure 10). Walsh (1965) indicates that elliptical cross-section cracks under plane-stress conditions close at confining pressure Pcc:
by substituting Pcc with 40 MPa and Eg with 95 GPa (i.e., quartz Young’s modulus), we obtain a value of crack aspect ratio α″ of ∼8x10⁻⁴.
The fact that α′ and α″, which are independently estimated, are similar suggests that our samples bear cracks whose geometry could have generated squirt-flow in a bandwidth close to 100 Hz.
Squirt flow and Patchy saturation have been calculated for the conditions of case ii, iii, and v and confining pressures of 2, 8 and 12 MPa, i.e., we generated nine attenuation and dispersion curves (Figure 12). Precisely, Figures 12A,B show the comparison between the modeling results and the best fitting curves from the phenomenological models.
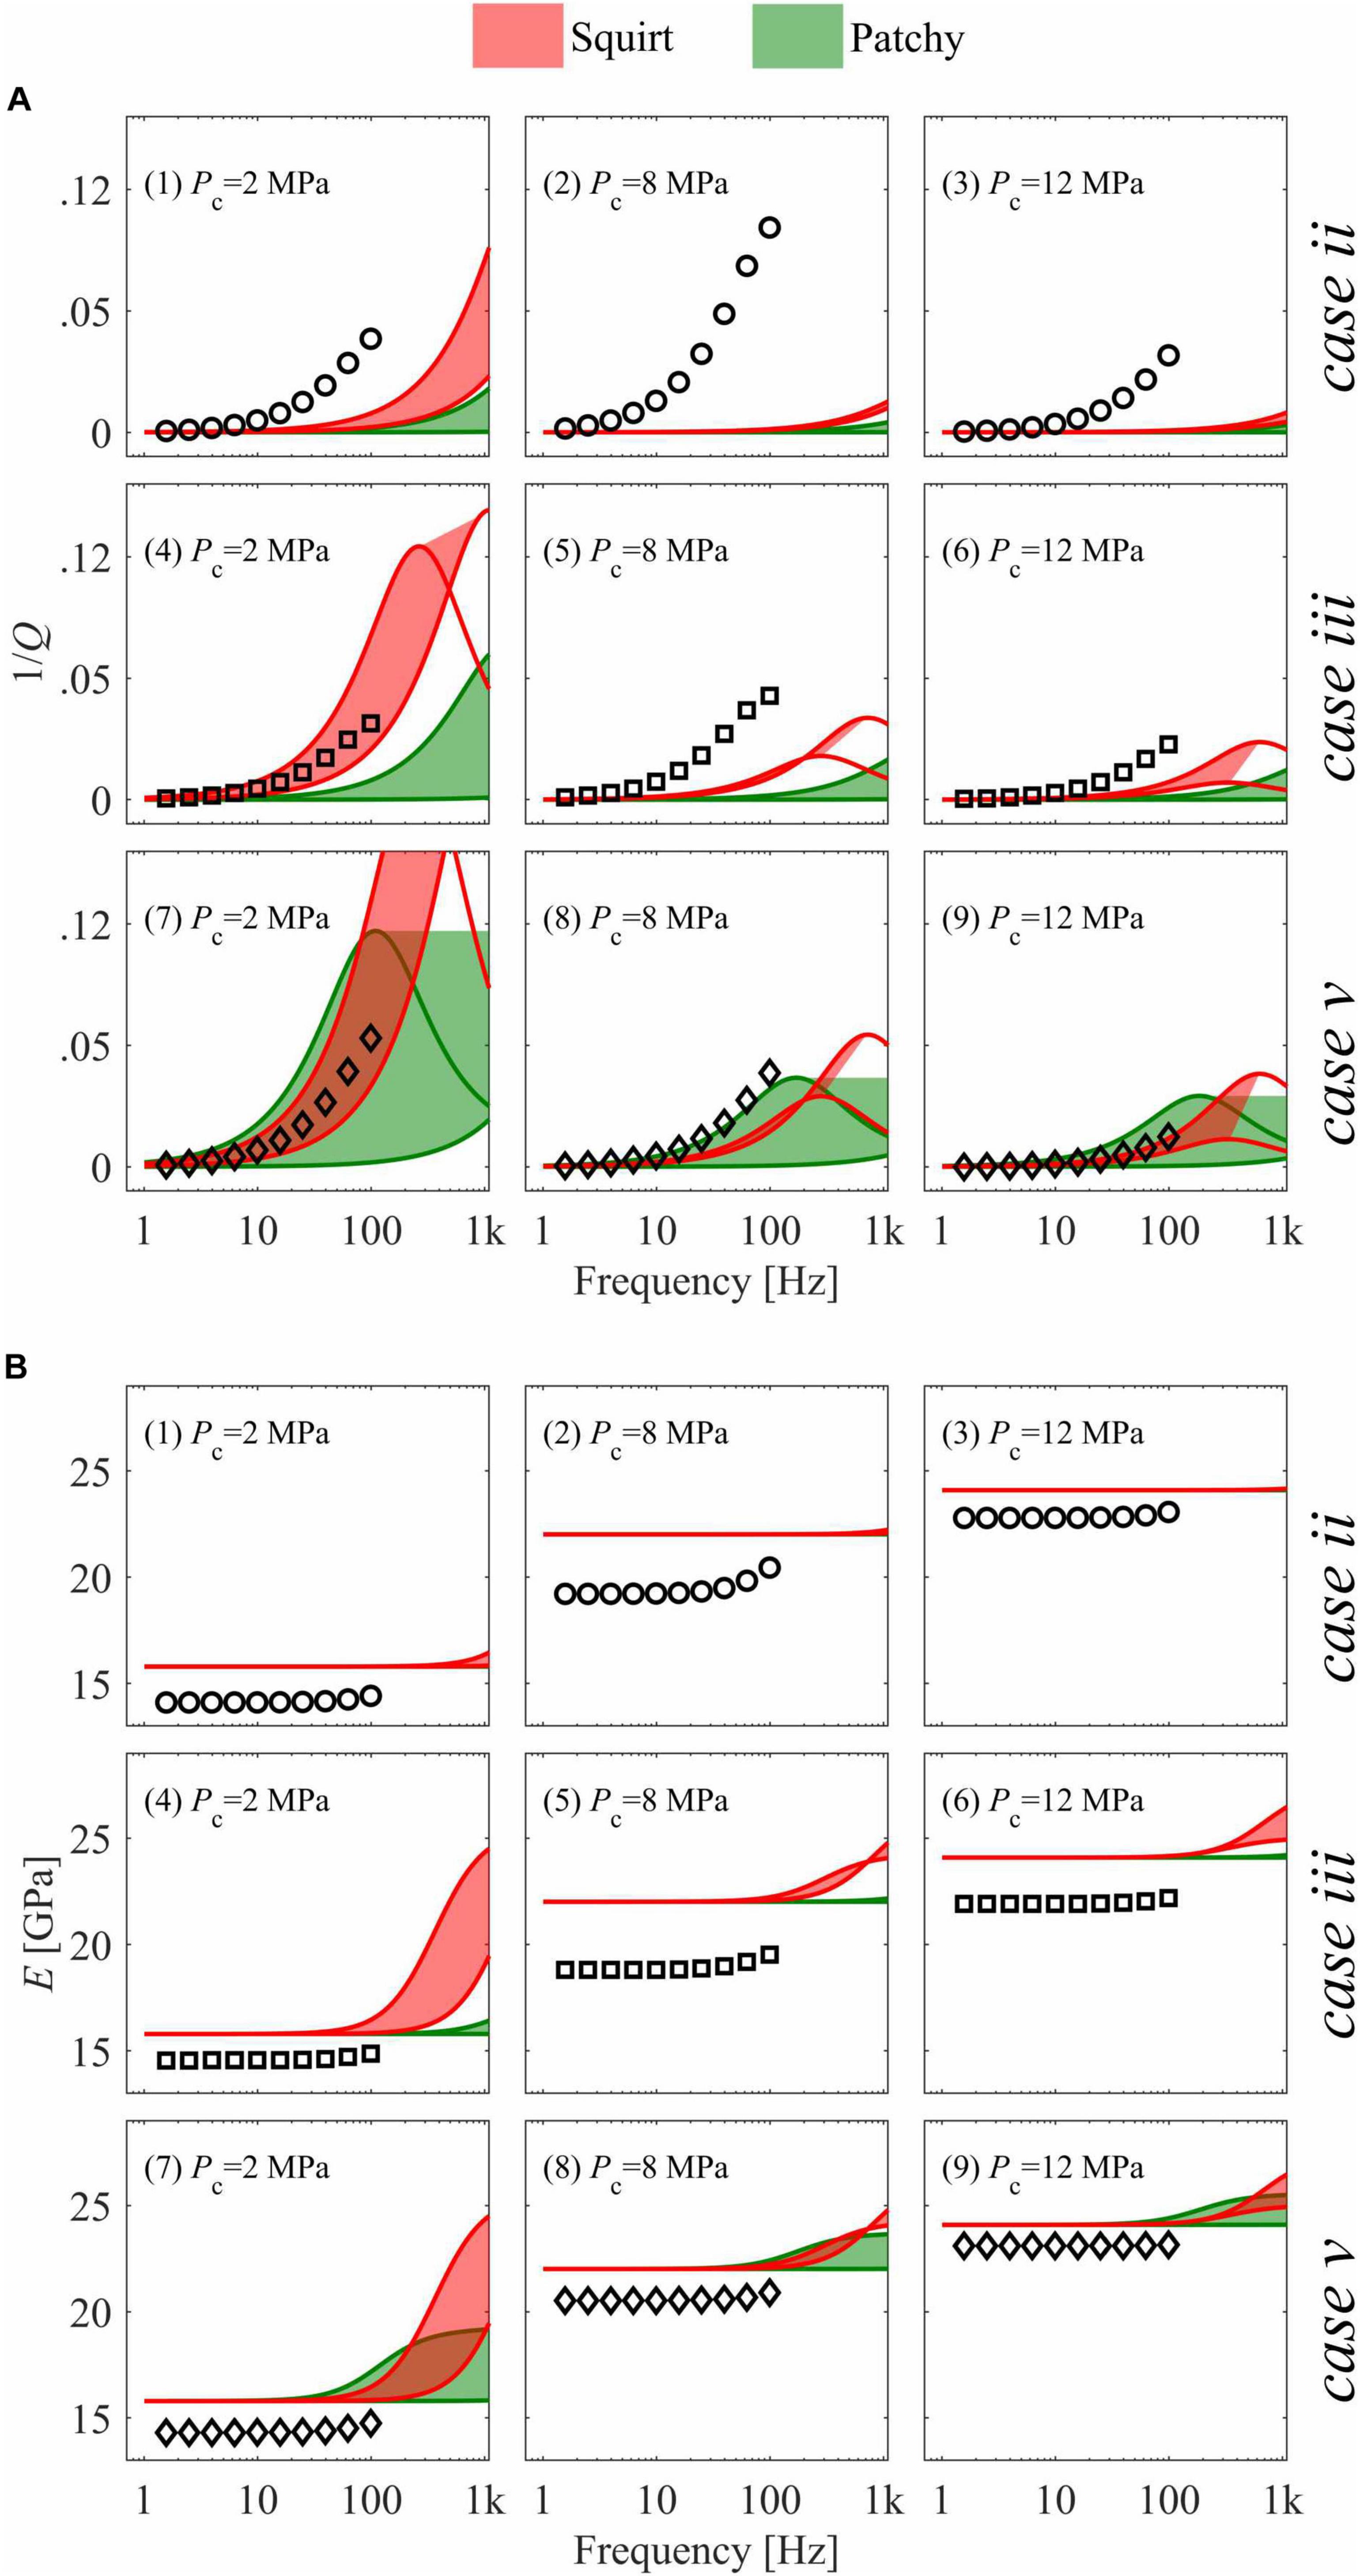
Figure 12. Comparison between (i) measured attenuation (A - symbols) and Young’s modulus (B - symbols), and (ii) calculated attenuation and Young’s modulus for squirt-flow (red) and patchy-saturation (green) models. Squirt-flow is modeled for a minimum and a maximum value of Ph, 20 and 100 MPa, respectively. Patchy saturation is modeled for a minimum and maximum value of rp of 0.003 and 0.03 m, respectively.
Patchy saturation was calculated for an interval of patchy radii comprised between 3 and 30 mm. Squirt flow was calculated for an interval of Ph comprised between 20 and 100 MPa. Such values were chosen to span an order of magnitude and according to the sample dimensions and the increase of ultrasonic wave speed as a function of confining pressure. As a consequence, in Figure 12, the modeling results appear as shaded areas where the two attenuation mechanisms operate.
From the comparison, we observe that patchy saturation accurately describes attenuation in 3 cases - Figure 12, curves 4, 7 and 9 - and slightly underestimates the measurements in one case – Figure 12, curve 8. However, in 5 cases, patchy saturation strongly underestimates the measurements presenting corner frequencies much higher than those observed in the laboratory. Similarly, squirt flow accurately describes attenuation in 3 cases - Figure 12, curves 7, 8, and 9. However, in 6 cases, squirt flow strongly underestimates the measurements presenting corner frequencies much higher than those observed in the laboratory. Although the modeled Young’s moduli overestimated the measurements of 1 to 4 GPa, the modeled increase of Young’s modulus with confining pressure is similar to the experimental results (Figure 12), suggesting a nearly constant offset between the measurements and the models.
From the present analysis, it is difficult to assess whether patchy saturation or squirt flow is more appropriate to describe the observed frequency-dependent attenuation. In particular, the largest discrepancies between modeling and experimental data occur at 8 MPa confining pressure suggesting that both the models do not accurately capture the evolution of the petrophysical parameters with confining pressure.
The models are less accurate in describing the water-saturated case than the GWmix saturated cases. In particular, they largely overestimate the corner frequencies of case ii but less those of case iii and v. For instance, although case ii and iii have similar saturation and probably patchy sizes, the models describe better case iii. This might suggest that the characteristic frequency of patchy-saturation and squirt-flow might not be a simple inverse relation with viscosity. The fluid flow of low-viscosity fluids in porous media might be turbulent, increasing the dragging forces and limiting the fluid flow (Reynolds, 1883). Such a process would result in reduced mobility (Batzle et al., 2006). Thus, we speculate that under certain conditions, wave-induced-fluid-flow might not be laminar as assumed in squirt-flow and patchy-saturation models manifesting as a nonlinear relation between corner frequencies and petrophysical parameters.
Models for both patchy-saturation and squirt-flow predict that attenuation fades as confining pressure increases. Such behavior is also present in our experimental data. Nevertheless, during experiments, the sample was deformed of a fixed strain amount. Thus, as confining pressure increases and cracks close, the strain must redistribute differently within the sample. At low confining pressures, a change in vertical stress mainly causes the splitting of vertical cracks and the closure of horizontal cracks. In contrast, at higher confining pressure, cracks tend to be closed, and a change of vertical stress causes shear strain along inclined faults (Jaeger et al., 2007). In the former case, crack deformation creates the local overpressures needed to generate the wave-induced-fluid-flow at the microscopic scale (i.e., squirt-flow). Nevertheless, we assume that overpressures generated in cracks also control the mesoscopic overpressure leading to patchy-saturation. The disappearance of frequency-dependent attenuation for Pc ≥ 14 MPa could be related to the closure of the cracks and the strain distribution variation affecting both the attenuation mechanisms analyzed.
The modeling that we present here should be furthered in future work. Petrophysical parameters could be estimated more precisely following the literature, and different models could be employed. For example, we could follow de Paula et al. (2012) to better estimate squirt-flow parameters, Buckingham (1999) to verify the hypothesis that frequency-independent attenuation in dry samples is related to grain friction, and use Vogelaar et al. (2010) to model the patchy saturation. Since the observed attenuation might result from the combination of squirt flow and patchy saturation, we could model our data using the double double-porosity model proposed by Ba et al. (2017). Besides, we could test analog materials whose physical properties could be thoroughly controlled (e.g., Xie et al., 2019). Nevertheless, results and modeling presented here suggest that in near-surface sedimentary terrains, where the effective stress is low - e.g., < 20 MPa - and partial saturation is likely to be present, attenuation and dispersion might strongly affect the propagation of seismic waves like suggested by field observations (e.g., Abercrombie, 1997).
We have measured low-frequency seismic wave attenuation and Young’s modulus, and ultrasonic wave speeds for three dry and partially saturated Berea sandstone samples. Measurements have been conducted at confining pressure between 0 and 40 MPa, and frequency ranges 1–100 Hz, and 0.1–1 MHz. Seismic wave attenuation in samples partially saturated and confined with pressures below 14 MPa are frequency-dependent and as high as 0.08. On the other hand, the dry sample and samples confined above 14 MPa exhibit negligible and frequency independent attenuation.
Low-frequency attenuation and dispersion curves obey to the Kramers-Kronig relation. Low frequency and ultrasonic Young’s moduli are compatible with effective-medium theories that are calculated for relaxed and unrelaxed conditions. This suggests that the observed frequency-dependent attenuation is caused by a wave-induced-fluid-flow type of mechanism and that attenuation could be significant in the near-surface (<∼1 km) where effective stress is low and partial saturation might be present. Nevertheless, it is not yet clear whether the observed frequency-dependent attenuation is the result of squirt-flow or patchy-saturation as analytical modeling provides similar results for these two attenuation mechanisms. Such and other aspects, like the role of non-laminar fluid-flow in controlling attenuation, are not yet clear and demand further investigation.
The full datasets including data not shown in figures can be found here: https://zenodo.org/record/4517286#.YCCtDXlMGUk.
NT conceived and performed the experiments, analyzed and modeled the results, wrote the manuscript, and prepared the figures and tables. CM assisted in preparing and performing the experiments. ES provided funding and supervised the study. All authors contributed to the article, edited the manuscript, and approved the submitted version.
This project has been partially funded by the Swiss Innovation Promotion Agency (KTI) project nr. 22701.
The authors declare that the research was conducted in the absence of any commercial or financial relationships that could be construed as a potential conflict of interest.
We want to thank Boris Gurevich, Luca Duranti, Beatriz Quintal, and Jean-Pierre Burg for providing insightful feedback. We also want to thank the editors Jing Ba and CX, and two reviewers whose comments improved the article. Robert Hofmann and Reto Seifert solved many technical issues.
The Supplementary Material for this article can be found online at: https://www.frontiersin.org/articles/10.3389/feart.2021.641177/full#supplementary-material
Abercrombie, R. E. (1997). Near-surface attenuation and site effects from comparison of surface and deep borehole recordings. Bull. Seismol. Soc. Am. 87, 731–744.
Adam, L., Batzle, M., Lewallen, K. T., and van Wijk, K. (2009). Seismic wave attenuation in carbonates. J. Geophys. Res. 114:B06208. doi: 10.1029/2008JB005890
Amalokwu, K., Best, A. I., Sothcott, J., Chapman, M., Minshull, T., and Li, X.-Y. (2014). Water saturation effects on elastic wave attenuation in porous rocks with aligned fractures. Geophys. J. Int. 197, 943–947. doi: 10.1093/gji/ggu076
Archard, J. F. (1953). Contact and rubbing of flat surfaces. J. Appl. Phys. 24:981. doi: 10.1063/1.1721448
Archard, J. F. (1957). Elastic deformation and the laws of friction. Proc. R. Soc. A Math. Phys. Eng. Sci. 243, 190–205. doi: 10.1098/rspa.1957.0214
Ba, J., Xu, W., Fu, L.-Y., Carcione, J. M., and Zhang, L. (2017). Rock anelasticity due to patchy saturation and fabric heterogeneity: a double double-porosity model of wave propagation: double double-porosity wave modeling. J. Geophys. Res. Solid Earth 122, 1949–1976. doi: 10.1002/2016JB013882
Barton, N. (2007). Rock Quality, Seismic Velocity, Attenuation and Anisotropy. London: Taylor & Francis.
Batzle, M. L., Han, D.-H., and Hofmann, R. (2006). Fluid mobility and frequency-dependent seismic velocity — direct measurements. Geophysics 71, N1–N9. doi: 10.1190/1.2159053
Biot, M. A. (1956). Theory of propagation of elastic waves in a fluid-saturated porous solid. I. Low-frequency range. J. Acoust. Soc. Am. 28:168. doi: 10.1121/1.1908239
Birch, F. (1960). The velocity of compressional waves in rocks to 10 kilobars: 1. J. Geophys. Res. 65, 1083–1102. doi: 10.1029/JZ065i004p01083
Buckingham, M. J. (1999). Theory of compressional and transverse wave propagation in consolidated porous media. J. Acoust. Soc. Am. 106, 575–581. doi: 10.1121/1.427026
Cadoret, T. (1993). Effet de la Saturation Eau-gaz Sur les Proprietes Acoustiques Des Roches. Ph.D. thesis, Université Paris Diderot–Paris 7, Paris. Available online at: http://www.theses.fr/1993PA077130 (accessed December 12, 2020).
Carcione, J. M. (2007). Wave Fields in Real Media: Wave Propagation in Anisotropic, Anelastic, Porous and Electromagnetic Media, 2nd Edn. Amsterdam: Elsevier. rev.extended.
Chapman, M., Liu, E., and Li, X.-Y. (2006). The influence of fluid-sensitive dispersion and attenuation on AVO analysis. Geophys. J. Int. 167, 89–105. doi: 10.1111/j.1365-246X.2006.02919.x
Chapman, S., Tisato, N., Quintal, B., and Holliger, K. (2016). Seismic attenuation in partially saturated Berea sandstone submitted to a range of confining pressures: seismic attenuation in berea sandstone. J. Geophys. Res. Solid Earth 121, 1664–1676. doi: 10.1002/2015JB012575
Christensen, N. I., and Wang, H. F. (1985). The Influence of pore pressure and confining pressure on dynamic elastic properties of Berea sandstone. Geophysics 50, 207–213. doi: 10.1190/1.1441910
de Paula, O. B., Pervukhina, M., Makarynska, D., and Gurevich, B. (2012). Modeling squirt dispersion and attenuation in fluid-saturated rocks using pressure dependency of dry ultrasonic velocities. Geophysics 77, WA157–WA168. doi: 10.1190/geo2011-0253.1
De Siena, L., Thomas, C., Waite, G. P., Moran, S. C., and Klemme, S. (2014). Attenuation and scattering tomography of the deep plumbing system of Mount St. Helens. J. Geophys. Res. Solid Earth 119, 8223–8238. doi: 10.1002/2014JB011372
Dunn, K.-J. (1986). Acoustic attenuation in fluid-saturated porous cylinders at low frequencies. J. Acoust. Soc. Am. 79:1709. doi: 10.1121/1.393232
Dutta, N. C., and Odé, H. (1979). Attenuation and dispersion of compressional waves in fluid-filled porous rocks with partial gas saturation (White model)—Part II: results. Geophysics 44, 1789–1805. doi: 10.1190/1.1440939
Dvorkin, J., and Nur, A. (1993). Dynamic poroelasticity: a unified model with the squirt and the Biot mechanisms. Geophysics 58, 524–533. doi: 10.1190/1.1443435
Eberhart-Phillips, D., Han, D.-H., and Zoback, M. D. (1989). Empirical relationships among seismic velocity, effective pressure, porosity, and clay content in sandstone. Geophysics 54, 82–89. doi: 10.1190/1.1442580
Gardner, G. H. F. (1962). Extensional waves in fluid-saturated porous cylinders. J. Acoust. Soc. Am. 34, 36–40. doi: 10.1121/1.1909010
Gassmann, F. (1951). Elastic waves through a packing of spheres. Geophysics 16, 673–685. doi: 10.1190/1.1437718
Green, A. E., Laws, N., and Naghdi, P. M. (1967). A linear theory of straight elastic rods. Arch. Ration. Mech. Anal. 25, 285–298. doi: 10.1007/BF00250931
Green, A. E., Naghdi, P. M., and Wenner, M. L. (1974a). On the theory of rods. I. Derivations from the three-dimensional equations. Proc. R. Soc. A Math. Phys. Eng. Sci. 337, 451–483. doi: 10.1098/rspa.1974.0061
Green, A. E., Naghdi, P. M., and Wenner, M. L. (1974b). On the theory of rods. II. Developments by direct approach. Proc. R. Soc. A Math. Phys. Eng. Sci. 337, 485–507. doi: 10.1098/rspa.1974.0062
Gurevich, B., and Lopatnikov, S. L. (1995). Velocity and attenuation of elastic waves in finely layered porous rocks. Geophys. J. Int. 121, 933–947. doi: 10.1111/j.1365-246X.1995.tb06449.x
Gurevich, B., Makarynska, D., de Paula, O. B., and Pervukhina, M. (2010). A simple model for squirt-flow dispersion and attenuation in fluid-saturated granular rocks. Geophysics 75, N109–N120. doi: 10.1190/1.3509782
Hulikal, S., Bhattacharya, K., and Lapusta, N. (2015). Collective behavior of viscoelastic asperities as a model for static and kinetic friction. J. Mech. Phys. Solids 76, 144–161. doi: 10.1016/j.jmps.2014.10.008
Jaeger, J. C., Cook, N. G. W., and Zimmerman, R. W. (2007). Fundamentals of Rock Mechanics, 4th Edn. Malden, MA: Blackwell Pub.
Jakobsen, M., and Chapman, M. (2009). Unified theory of global flow and squirt flow in cracked porous media. Geophysics 74, WA65–WA76. doi: 10.1190/1.3078404
Johnson, D. L. (2001). Theory of frequency dependent acoustics in patchy-saturated porous media. J. Acoust. Soc. Am. 110, 682–694. doi: 10.1121/1.1381021
Johnston, D. H., Toksöz, M. N., and Timur, A. (1979). Attenuation of seismic waves in dry and saturated rocks: II. Mechanisms. Geophysics 44, 691–711. doi: 10.1190/1.1440970
Jones, T. D. (1986). Pore fluids and frequency-dependent wave propagation in rocks. Geophysics 51, 1939–1953. doi: 10.1190/1.1442050
Karato, S., and Spetzler, H. A. (1990). Defect microdynamics in minerals and solid-state mechanisms of seismic wave attenuation and velocity dispersion in the mantle. Rev. Geophys. 28:399. doi: 10.1029/RG028i004p00399
Kästner, F., Pierdominici, S., Elger, J., Zappone, A., Kück, J., and Berndt, C. (2020). Correlation of core and downhole seismic velocities in high-pressure metamorphic rocks: a case study for the COSC-1 borehole, Sweden. Solid Earth 11, 607–626. doi: 10.5194/se-11-607-2020
Kuteynikova, M., Tisato, N., Jänicke, R., and Quintal, B. (2014). Numerical modeling and laboratory measurements of seismic attenuation in partially saturated rock. Geophysics 79, L13–L20. doi: 10.1190/geo2013-0020.1
Liu, H.-P., Anderson, D. L., and Kanamori, H. (1976). Velocity dispersion due to anelasticity; implications for seismology and mantle composition. Geophys. J. Int. 47, 41–58. doi: 10.1111/j.1365-246X.1976.tb01261.x
Lo, T., Coyner, K. B., and Toksöz, M. N. (1986). Experimental determination of elastic anisotropy of Berea sandstone, Chicopee shale, and Chelmsford granite. Geophysics 51, 164–171. doi: 10.1190/1.1442029
Madonna, C., and Tisato, N. (2013). A new seismic wave attenuation module to experimentally measure low-frequency attenuation in extensional mode: a seismic wave attenuation module to measure low-frequency attenuation. Geophys. Prospect. 61, 302–314. doi: 10.1111/1365-2478.12015
Mavko, G., and Jizba, D. (1991). Estimating grain-scale fluid effects on velocity dispersion in rocks. Geophysics 56, 1940–1949. doi: 10.1190/1.1443005
Mavko, G., Mukerji, T., and Dvorkin, J. (2009). The Rock Physics Handbook: Tools for Seismic Analysis of Porous Media, 2nd Edn. Cambridge: Cambridge University Press.
McCarthy, C., Takei, Y., and Hiraga, T. (2011). Experimental study of attenuation and dispersion over a broad frequency range: 2. The universal scaling of polycrystalline materials. J. Geophys. Res. 116:B09207. doi: 10.1029/2011JB008384
McKavanagh, B., and Stacey, F. D. (1974). Mechanical hysteresis in rocks at low strain amplitudes and seismic frequencies. Phys. Earth Planet. Inter. 8, 246–250. doi: 10.1016/0031-9201(74)90091-0
Mikhaltsevitch, V., Lebedev, M., and Gurevich, B. (2014a). A laboratory study of low-frequency wave dispersion and attenuation in water-saturated sandstones. Lead. Edge 33, 616–622. doi: 10.1190/tle33060616.1
Mikhaltsevitch, V., Lebedev, M., and Gurevich, B. (2014b). A laboratory study of the elastic and anelastic properties of the sandstone flooded with supercritical CO2 at seismic frequencies. Energy Proc. 63, 4289–4296. doi: 10.1016/j.egypro.2014.11.464
Mikhaltsevitch, V., Lebedev, M., and Gurevich, B. (2016). Validation of the laboratory measurements at seismic frequencies using the Kramers-Kronig relationship. Geophys. Res. Lett. 43, 4986–4991. doi: 10.1002/2016GL069269
Molyneux, J. B., and Schmitt, D. R. (1999). First-break timing: arrival onset times by direct correlation. Geophysics 64, 1492–1501. doi: 10.1190/1.1444653
Mueller, S., Llewellin, E. W., and Mader, H. M. (2010). The rheology of suspensions of solid particles. Proc. R. Soc. A Math. Phys. Eng. Sci. 466, 1201–1228. doi: 10.1098/rspa.2009.0445
Müller, T. M., Gurevich, B., and Lebedev, M. (2010). Seismic wave attenuation and dispersion resulting from wave-induced flow in porous rocks — a review. Geophysics 75, 75A147–75A164. doi: 10.1190/1.3463417
Paffenholz, J., and Burkhardt, H. (1989). Absorption and modulus measurements in the seismic frequency and strain range on partially saturated sedimentary rocks. J. Geophys. Res. 94:9493. doi: 10.1029/JB094iB07p09493
Papageorgiou, G., and Chapman, M. (2015). Multifluid squirt flow and hysteresis effects on the bulk modulus–water saturation relationship. Geophys. J. Int. 203, 814–817. doi: 10.1093/gji/ggv333
Peselnick, L., and Liu, H.-P. (1987). 2. Laboratory measurement of internal friction in rocks and minerals at seismic frequencies. Methods Exp. Phys. 24, 31–56. doi: 10.1016/S0076-695X(08)60583-9
Pimienta, L., Fortin, J., and Guéguen, Y. (2015a). Bulk modulus dispersion and attenuation in sandstones. Geophysics 80, D111–D127. doi: 10.1190/geo2014-0335.1
Pimienta, L., Fortin, J., and Guéguen, Y. (2015b). Experimental study of Young’s modulus dispersion and attenuation in fully saturated sandstones. Geophysics 80, L57–L72. doi: 10.1190/geo2014-0532.1
Prasad, M., and Manghnani, M. H. (1997). Effects of pore and differential pressure on compressional wave velocity and quality factor in Berea and Michigan sandstones. Geophysics 62, 1163–1176. doi: 10.1190/1.1444217
Pride, S. R., Berryman, J. G., and Harris, J. M. (2004). Seismic attenuation due to wave-induced flow: wave-induced flow losses. J. Geophys. Res. Solid Earth 109:B01201. doi: 10.1029/2003JB002639
Quintal, B., Steeb, H., Frehner, M., and Schmalholz, S. M. (2011). Quasi-static finite element modeling of seismic attenuation and dispersion due to wave-induced fluid flow in poroelastic media. J. Geophys. Res. 116:B01201. doi: 10.1029/2010JB007475
Reuss, A. (1929). Berechnung der fließgrenze von mischkristallen auf grund der plastizitätsbedingung für einkristalle. Z. Angew. Math. Mech. 9, 49–58. doi: 10.1002/zamm.19290090104
Reynolds, O. (1883). An experimental investigation of the circumstances which determine whether the motion of water shall be direct or sinuous, and of the law of resistance in parallel channels. Philos. Trans. R. Soc. Lond. 174, 935–982. doi: 10.1098/rstl.1883.0029
Sayers, C. M., Van Munster, J. G., and King, M. S. (1990). Stress-induced ultrasonic anisotrophy in Berea sandstone. Int. J. Rock Mech. Min. Sci. Geomech. Abstr. 27, 429–436. doi: 10.1016/0148-9062(90)92715-Q
Spencer, J. W. (2013). Viscoelasticity of ells river bitumen sand and 4D monitoring of thermal enhanced oil recovery processes. Geophysics 78, D419–D428. doi: 10.1190/geo2012-0535.1
Thakur, N. K., and Rajput, S. (2011). Exploration of Gas Hydrates: Geophysical Techniques. Heidelberg: Springer.
Tisato, N., and Madonna, C. (2012). Attenuation at low seismic frequencies in partially saturated rocks: measurements and description of a new apparatus. J. Appl. Geophys. 86, 44–53. doi: 10.1016/j.jappgeo.2012.07.008
Tisato, N., and Quintal, B. (2013). Measurements of seismic attenuation and transient fluid pressure in partially saturated Berea sandstone: evidence of fluid flow on the mesoscopic scale. Geophys. J. Int. 195, 342–351. doi: 10.1093/gji/ggt259
Tisato, N., and Quintal, B. (2014). Laboratory measurements of seismic attenuation in sandstone: strain versus fluid saturation effects. Geophysics 79, WB9–WB14. doi: 10.1190/geo2013-0419.1
Tisato, N., Quintal, B., Chapman, S., Podladchikov, Y., and Burg, J.-P. (2015). Bubbles attenuate elastic waves at seismic frequencies: first experimental evidence. Geophys. Res. Lett. 42, 3880–3887. doi: 10.1002/2015GL063538
Toksöz, M. N., Johnston, D. H., and Timur, A. (1979). Attenuation of seismic waves in dry and saturated rocks: I. Laboratory measurements. Geophysics 44, 681–690. doi: 10.1190/1.1440969
Vogelaar, B., Smeulders, D., and Harris, J. (2010). Exact expression for the effective acoustics of patchy-saturated rocks. Geophysics 75, N87–N96. doi: 10.1190/1.3463430
Walsh, J. B. (1965). The effect of cracks on the compressibility of rock. J. Geophys. Res. 70, 381–389. doi: 10.1029/JZ070i002p00381
Walsh, J. B. (1966). Seismic wave attenuation in rock due to friction. J. Geophys. Res. 71, 2591–2599. doi: 10.1029/JZ071i010p02591
White, J. E. (1975). Computed seismic speeds and attenuation in rocks with partial gas saturation. Geophysics 40, 224–232. doi: 10.1190/1.1440520
Winkler, K. W. (1985). Dispersion analysis of velocity and attenuation in Berea sandstone. J. Geophys. Res. 90:6793. doi: 10.1029/JB090iB08p06793
Winkler, K. W., and Nur, A. (1982). Seismic attenuation: effects of pore fluids and frictional-sliding. Geophysics 47, 1–15. doi: 10.1190/1.1441276
Xie, J., Cao, J., Schmitt, D. R., Di, B., Xiao, L., Wang, X., et al. (2019). Effects of kerogen content on elastic properties-based on artificial organic-rich shale (AORS). J. Geophys. Res. Solid Earth 124, 12660–12678. doi: 10.1029/2019JB017595
Yin, C.-S., Batzle, M. L., and Smith, B. J. (1992). Effects of partial liquid/gas saturation on extensional wave attenuation in Berea sandstone. Geophys. Res. Lett. 19, 1399–1402. doi: 10.1029/92GL01159
Zappone, A., Fernàndez, M., Garcıìa-Dueñas, V., and Burlini, L. (2000). Laboratory measurements of seismic P-wave velocities on rocks from the Betic chain (southern Iberian Peninsula). Tectonophysics 317, 259–272. doi: 10.1016/S0040-1951(99)00319-4
Keywords: Attenuation of seismic waves, dispersion of seismic waves, near-surface geophysics, sedimentary rocks, confining pressure, saturation
Citation: Tisato N, Madonna C and Saenger EH (2021) Attenuation of Seismic Waves in Partially Saturated Berea Sandstone as a Function of Frequency and Confining Pressure. Front. Earth Sci. 9:641177. doi: 10.3389/feart.2021.641177
Received: 13 December 2020; Accepted: 15 March 2021;
Published: 15 April 2021.
Edited by:
Chong Xu, National Institute of Natural Hazards, Ministry of Emergency Management, ChinaReviewed by:
Jianyong Xie, Chengdu University of Technology, ChinaCopyright © 2021 Tisato, Madonna and Saenger. This is an open-access article distributed under the terms of the Creative Commons Attribution License (CC BY). The use, distribution or reproduction in other forums is permitted, provided the original author(s) and the copyright owner(s) are credited and that the original publication in this journal is cited, in accordance with accepted academic practice. No use, distribution or reproduction is permitted which does not comply with these terms.
*Correspondence: Nicola Tisato, bmljb2xhLnRpc2F0b0Bqc2cudXRleGFzLmVkdQ==
Disclaimer: All claims expressed in this article are solely those of the authors and do not necessarily represent those of their affiliated organizations, or those of the publisher, the editors and the reviewers. Any product that may be evaluated in this article or claim that may be made by its manufacturer is not guaranteed or endorsed by the publisher.
Research integrity at Frontiers

Learn more about the work of our research integrity team to safeguard the quality of each article we publish.