- 1Universities Space Research Association (USRA), Columbia, MD, United States
- 2Goddard Earth Sciences Technology and Research (GESTAR), Greenbelt, MD, United States
- 3Laboratory of Hydrological Sciences, Goddard Space Flight Center, Greenbelt, MD, United States
- 4University of Maryland, College Park, MD, United States
- 5Department of Earth and Environmental Sciences, University of Michigan, Ann Arbor, MI, United States
Landslides affect nearly every country in the world each year. To better understand this global hazard, the Landslide Hazard Assessment for Situational Awareness (LHASA) model was developed previously. LHASA version 1 combines satellite precipitation estimates with a global landslide susceptibility map to produce a gridded map of potentially hazardous areas from 60° North-South every 3 h. LHASA version 1 categorizes the world’s land surface into three ratings: high, moderate, and low hazard with a single decision tree that first determines if the last seven days of rainfall were intense, then evaluates landslide susceptibility. LHASA version 2 has been developed with a data-driven approach. The global susceptibility map was replaced with a collection of explanatory variables, and two new dynamically varying quantities were added: snow and soil moisture. Along with antecedent rainfall, these variables modulated the response to current daily rainfall. In addition, the Global Landslide Catalog (GLC) was supplemented with several inventories of rainfall-triggered landslide events. These factors were incorporated into the machine-learning framework XGBoost, which was trained to predict the presence or absence of landslides over the period 2015–2018, with the years 2019–2020 reserved for model evaluation. As a result of these improvements, the new global landslide nowcast was twice as likely to predict the occurrence of historical landslides as LHASA version 1, given the same global false positive rate. Furthermore, the shift to probabilistic outputs allows users to directly manage the trade-off between false negatives and false positives, which should make the nowcast useful for a greater variety of geographic settings and applications. In a retrospective analysis, the trained model ran over a global domain for 5 years, and results for LHASA version 1 and version 2 were compared. Due to the importance of rainfall and faults in LHASA version 2, nowcasts would be issued more frequently in some tropical countries, such as Colombia and Papua New Guinea; at the same time, the new version placed less emphasis on arid regions and areas far from the Pacific Rim. LHASA version 2 provides a nearly real-time view of global landslide hazard for a variety of stakeholders.
Introduction
Landslides cause thousands of casualties and substantial socioeconomic impacts around the world every year (Kirschbaum et al., 2015a; Froude and Petley, 2018). Rainfall is the most frequent trigger of these landslide events, although earthquakes and anthropogenic impacts such as mining and construction can also be tremendously destructive. Near real-time information on the spatiotemporal distribution of potential landslide hazards may mitigate loss and improve the speed and effectiveness of disaster response and recovery. Remotely sensed data can provide a global view of this hazard to advance understanding of landslide processes and improve landslide monitoring and prediction.
At a local scale, the basic physics behind mass movements of rock and soil (herein landslides) are well understood and incorporated into the practice of geotechnical engineering. While physically based models can be difficult to apply over large areas, some practitioners have reported success with this approach (Raia et al., 2014; Hsu et al., 2018; Thomas et al., 2018). Physically based models typically require a significant amount of information about subsurface conditions and can be sensitive to small errors in these values (Iverson et al., 2015). Because accurate descriptions of the ground are rarely available for large areas, most regional landslide hazard assessment systems instead rely on an empirical approach (Guzzetti et al., 2020).
Many different empirical approaches to spatial and temporal prediction of rainfall-triggered landslides have been applied since the 1970s, with hazard assessment or early warning systems applied in many regions of the world (Guzzetti et al., 2020). Most commonly, researchers rely on thresholds that take into account both the intensity and the duration of rain storms (e.g.Gariano et al., 2015; Segoni et al., 2018), with inclusion of snow and snowmelt as a contributing factor in some models (e.g.Chleborad et al., 2008; Krøgli et al., 2018). A growing number of systems also use soil moisture as a predictor of potential instabilities (e.g.Brocca et al., 2012; Mirus et al., 2018; Felsberg et al., 2021). While snow water equivalent and soil moisture content have a straightforward connection to the saturated conditions under which many landslides occur, the same is not true of land cover. Although rarely considered as an influencing factor for landslide triggering (Guzzetti et al., 2020), land cover is often used to calculate landslide susceptibility; in turn, susceptibility is often used to predict rainfall-triggered landslides (Hong and Adler, 2007; Kirschbaum et al., 2015b; Monsieurs et al., 2019).
Although many landslide models have been developed at local and regional scales, few have characterized landslide hazard at a global scale. The National Aeronautics and Space Administration (NASA) has developed a nearly global landslide nowcasting system that locates the most hazardous conditions in near real-time. Landslide Hazard Assessment for Situational Awareness (LHASA) version 1 is a decision tree model that produces a map of potentially hazardous landslide areas between 60° North and South latitude with three categorizations: low hazard, moderate hazard, and high hazard (Kirschbaum and Stanley, 2018; Emberson et al., 2020). It combines satellite precipitation estimates with a global landslide susceptibility map that incorporates information on roads, faults, geology, forest loss, and topography (Stanley and Kirschbaum, 2017). LHASA version 1 was evaluated with landslide reports from the Global Landslide Catalog (GLC; Kirschbaum et al., 2015a), but the model structure, susceptibility analysis, and rainfall threshold were derived from literature review and expert judgment, rather than a data-fitting process. LHASA version 1 runs at NASA’s Goddard Space Flight Center and integrates a multi-satellite product developed by the Global Precipitation Measurement (GPM) mission, which merges multiple satellite precipitation estimates to produce the Integrated Multi-satellitE Retrievals for GPM (IMERG; Huffman et al., 2020). The most recent nowcast can be accessed through an ESRI REST API or viewed at https://landslides.nasa.gov/viewer/ (Figure 1).
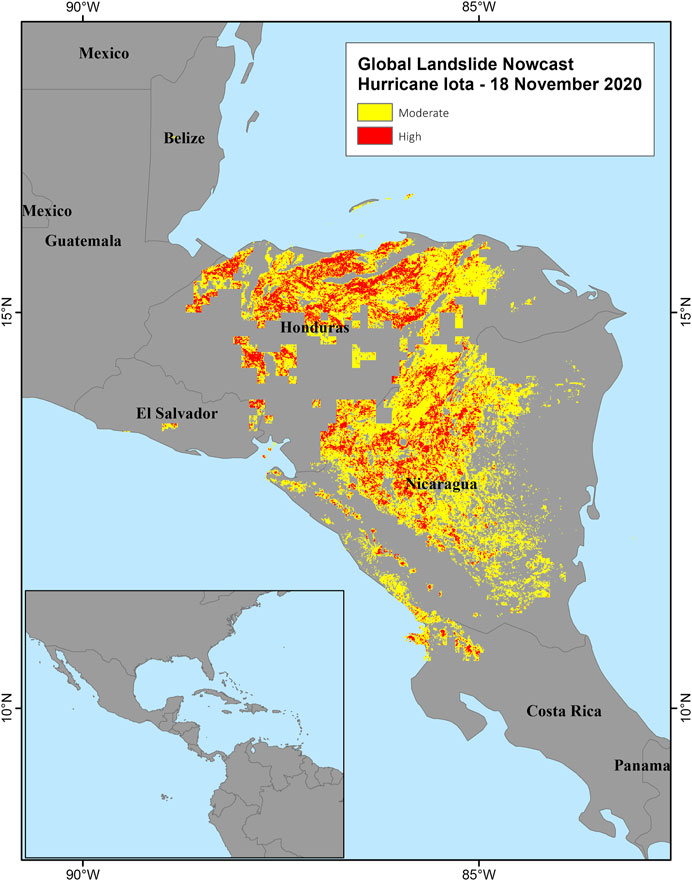
FIGURE 1. This map shows a nowcast (version 1) for November 18, 2020, during the passage of Hurricane Iota through Nicaragua and Honduras. The latest global landslide nowcast can be viewed (along with supplementary information) at https://landslides.nasa.gov/viewer/.
Although LHASA version 1 has provided nearly global situational awareness of potential landslide activity, new landslide inventories and satellite-based datasets have recently enabled the use of a data-driven approach to landslide nowcasting at the global scale. Machine learning is now widely used in landslide susceptibility mapping (Korup and Stolle, 2014; Segoni et al., 2015; Reichenbach et al., 2018), and it has been proposed for use in dynamic predictions of slope failure in some cases (van Natijne et al., 2020). Machine learning promises important benefits: improved overall accuracy and probabilistic outputs that better reflect the low but non-zero chance of landslides in flat and dry regions. However, machine learning also presents several challenges. First, the combination of numerous variables with large datasets can lead to overfitted models that are unreliable or even physically unrealistic. Second, these models are often complex to the point of inscrutability, which decreases trust in even well-founded methods. Finally, model performance is almost entirely tied to the available data, which presents a significant challenge at the global scale. Despite these limitations, recent research shows that these issues can be addressed when reasonable precautions are taken (Stanley et al., 2020).
In this work, we have outlined a data-driven approach to global rainfall-triggered landslide hazard assessment that outperforms LHASA version 1. The goal was to advance from categorical to probabilistic global nowcasts of rainfall-triggered landslide hazard, as well as substantially increase the model’s accuracy. We present the methodology for LHASA version 2 here and compare the performance of both versions over the period 2015–2020 with new landslide inventories. These nowcasts are intended to facilitate disaster planning and response at regional to global scales by a broad range of stakeholders such as governments, relief agencies, emergency responders, and insurers.
Materials and Methods
Explanatory Variables
Several globally extensive datasets were considered for use as predictive variables (predictors) in LHASA. These included the variables previously used to generate the global landslide susceptibility map (Stanley and Kirschbaum, 2017) and to run LHASA version 1 (Kirschbaum and Stanley, 2018). In addition, several new variables with the potential for explaining the variability in landslide occurrence were tested. The predictors retained were those with an obvious relevance to landslide occurrence and were used in one or more decision trees during model training. These variables are snow mass, soil moisture, slope, distance to faults, lithologic strength, antecedent rainfall, and current daily rainfall (Table 1).

TABLE 1. Explanatory variables were chosen for their relevance, diversity, and contribution to predictive strength of the model.
Slope is a strong predictor of landslides because it can identify areas too flat for most landslides to occur. A key component of the existing global susceptibility map, this variable was calculated by first deriving the slope for each 90 m grid cell in the Viewfinder Panoramas digital elevation model (de Ferranti, 2014), then aggregating these values by selecting the maximum value within each 30-arcsecond grid cell. The maximum value was used in order to avoid omitting generally flat regions in which some hazardous locations may still exist.
The primary rationale for using distance to active faults as a landslide predictor is that earthquakes trigger landsliding, while also rendering landscapes more landslide-prone for years following (Marc et al., 2015). From a long-term perspective, faults are the site of tectonic activity, which often involves mountain building and high erosion rates, including mass wasting. The distance to the nearest active fault exhibits a strong empirical association with landslide occurrence, as will be shown in A Data-Driven Nowcast. This variable was derived from a global database of active faults that is not complete but covers most of the world’s land surface (GEM Hazard Team, 2019).
The physical properties of earth materials control whether and how landslides occur under forcing conditions such as intense rainfall and seismic shaking. Although detailed properties of the soil and rock profile are not globally available, use of regional geologic maps improves landslide susceptibility determinations (Amatya et al., 2019). Even simplified groups based on rock type are useful for modulating rainfall thresholds at the regional scale (Peruccacci et al., 2012). The release of open data sets such as the global lithologic map used in this work (Hartmann and Moosdorf, 2012) should enhance landslide research at the global scale. The map contains 16 major lithologic classes, which we use to inform models of landslide occurrence by broadly representing geotechnical properties based on weathering susceptibility that are independent of topography and seismicity. In A Global Lithologic Rating, we describe how this map was converted into a lithologic strength rating.
Antecedent soil moisture can reduce the rainfall necessary to induce slope failure (Ponziani et al., 2012; Zhao et al., 2019). In situ sensors provide good estimates of soil moisture fluctuations in hilly terrain (Thomas et al., 2019), but are not globally available as a dense network with rapid reporting. Both models and satellites can offer this global coverage, albeit at a coarse spatial resolution. The Soil Moisture Active Passive Level 4 (SMAP L4) product (Reichle et al., 2018) combines a hydrologic model with satellite observations to produce a high-quality product with continuous coverage. Bessette-Kirton et al. (2019) found that wet areas identified by SMAP L4 were associated with areas of dense landslide occurrence in Puerto Rico and Felsberg et al. (2021) found that SMAP data performed well relative to other global measurements of soil moisture. However, SMAP L4 has a latency of roughly 2.5 days, which means that it can only be used in a real-time product as an antecedent contributing factor, not the proximate cause of slope failure. SMAP L4 includes several variables related to soil moisture. LHASA version 2 uses “total profile soil wetness,” a dimensionless measure of the soil water content between the ground surface and bedrock. Values range from 0, indicating no water content, to 1, indicating complete soil saturation. Unlike the volumetric soil moisture, this variable represents a locally standardized quantity, obviating any data transformation by the nowcast algorithm.
The presence of snowpack can be an important factor that increases the severity of rainfall-triggered landslide events in some regions (Chleborad, 2000; Sarikhan et al., 2008; Musselman et al., 2018; Vega et al., 2020). Falling rain can melt snow, which increases the total volume of water available to infiltrate and increase subsurface pore pressures. Although a few variables related to snow are available in the SMAP L4 product, only snow mass was chosen to avoid inclusion of highly correlated model inputs and to reduce processing time. The snow mass variable is measured in kilograms per square meter and is not normalized by LHASA version 2. The inclusion of snow mass enables the global landslide nowcast to reflect the potential for melting snow to run off or flow into groundwater, combining with the total from rainfall.
Precipitation is the fundamental triggering variable considered in this model. Consistent with LHASA version 1, IMERG is used to identify conditions under which landslide triggering is more likely. IMERG provides high-quality, low-latency estimates of precipitation (Huffman, 2016; Huffman et al., 2020) and has been used in landslide modeling at multiple scales (Kirschbaum et al., 2015b; Kirschbaum and Stanley, 2018; Hartke et al., 2020). For this study, we use IMERG version 06B, which encompasses data from both the Tropical Rainfall Measuring Mission (TRMM) and the GPM mission, because it provides a nearly 20 years record of precipitation from June 2000 to present. IMERG provides three latencies of products to support different user groups: early (∼4 h latency), late (∼12–14 h latency), and final (3.5 months latency). In this model, we use the IMERG Early Product, which is available at a 0.1 degree, 30 min spatiotemporal resolution at https://gpm.nasa.gov/data/imerg. In addition to estimating precipitation depth, IMERG estimates the probability that precipitation will be in liquid phase. This is determined with reference to the wet-bulb surface temperature from numerical weather predictions, which is the key variable for separating precipitation phases (Sims and Liu, 2015). (Wet-bulb temperatures combine temperature with humidity to account for the effects of evaporation). Because falling snow and freezing rain are unlikely to trigger rapid snowmelt or landslides, LHASA version 2 uses liquid precipitation, referred to as “rain” or “rainfall” in this manuscript. For this study, daily data were used to develop the global landslide nowcast because the exact time of occurrence is not available for most historical landslide events.
Landslide Data
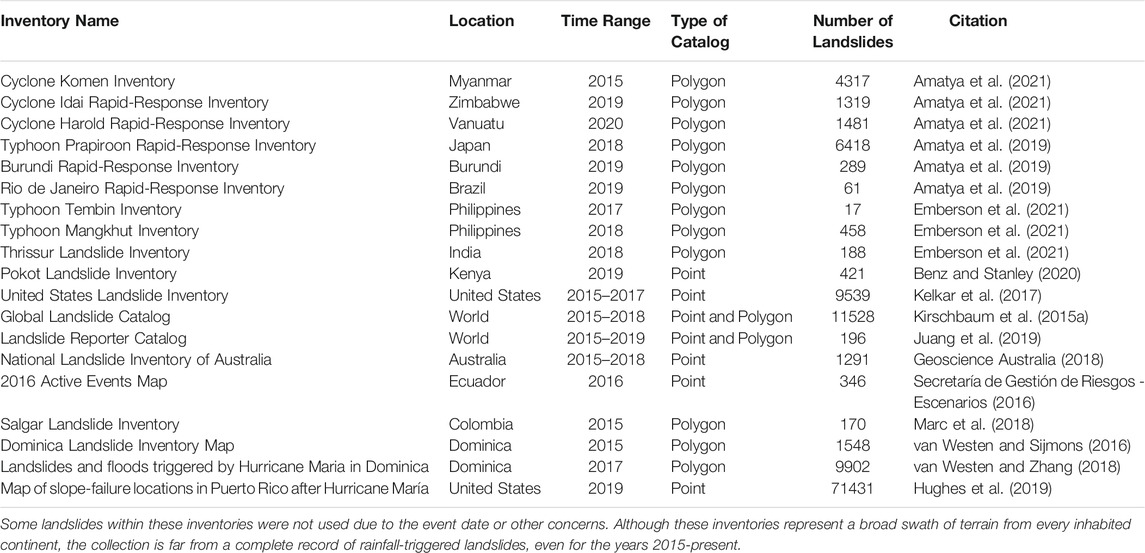
In order to represent the spatiotemporal distribution of rainfall-triggered landslides, dozens of published landslide inventories were compiled with a few privately held landslide inventories. Original published landslide datasets were retrieved from university research articles, government agencies, and professional contacts within the landslide research community. From these, we chose inventories for use in model development (Table 2) that were authoritative, well-documented, or from a trusted source. In addition to previously developed inventories, the NASA landslides team developed an additional set of event-based inventories triggered primarily by major rainfall events using a semi-automatic landslide detection method described below.
Manual mapping of landslides after a major triggering event can be extremely time consuming. Amatya et al. (2021) presents an open-source tool for rapid mapping of landslides from high resolution optical imagery using semi-automated techniques. The Semi-Automatic Landslide Detection (SALaD) system relies on object-based image analysis and machine learning to create polygon representations of landslides. This tool has been applied after several disasters, including events in Zimbabwe and Vanuatu (Table 2). It was also applied retrospectively to map landslides triggered by Cyclone Komen in Myanmar. Similar inventories were produced with commercial software for events in Burundi, Brazil, and Japan (Amatya et al., 2019). In addition, landslide outlines were hand mapped from optical satellite imagery for events in the Philippines and India (Emberson et al., 2021). Finally, an inventory of landslide initiation points in Pokot, Kenya was manually mapped from a Sentinel-2 satellite image (Benz and Stanley, 2020).
In addition to these event-based landslide inventories, NASA has maintained the GLC, a multitemporal inventory of rainfall-triggered landslides. This database contains over 11,000 landslide reports (Table 2), which have been obtained primarily from news media (Kirschbaum et al., 2010; Kirschbaum et al., 2015a). The GLC has been completed for the years 2007–2017, and the first half of 2018 is also complete. Some linguistic and economic biases are known to affect the GLC, which are outlined in Kirschbaum et al. (2010) and (2015). Nevertheless, it is an invaluable resource for research at the global scale because it represents far more individual landslide events than are available as event-based landslide inventories. The GLC has recently been supplemented by the Landslide Reporter Catalog (LRC), an inventory of landslides reported by citizen scientists (Juang et al., 2019). Although it is much smaller than the GLC, the quality of reports in the LRC appears to be comparable to those in the GLC. In addition, the spatiotemporal distribution of points in the LRC is somewhat different from the GLC, so it may help correct some limitations of the GLC. Both catalogs can be viewed and downloaded at https://landslides.nasa.gov/viewer. As part of the National Climate Assessment, landslide inventories from across the United States of America were compiled into a single database of rainfall-triggered landslides with known dates (Kelkar et al., 2017). Although these multitemporal inventories contain many independent landslide events, most reports are not within the temporal window considered for this analysis, which starts in 2015, or lack the necessary spatial precision for model training.
Several datasets from other researchers were also used for developing a global landslide nowcast. The Australian government has published a long-term national record of landslides (Geoscience Australia, 2018), while Ecuador has published many landslides that occurred during the year 2016 (Secretaría de Gestión de Riesgos - Escenarios, 2016). Inventories of landslides triggered by major rainfall events in Colombia (Marc et al., 2018), Dominica (van Westen and Sijmons, 2016; van Westen and Zhang, 2018), and Puerto Rico (Hughes et al., 2019) enriched the coverage of the Americas. Taken together, the combined inventories from NASA and other researchers provide a much more extensive view of landslide occurrence than is available from any single dataset.
Data Preparation
A Climatic Correction Factor
The rainfall necessary to initiate slope failure varies geographically (Baum and Godt, 2009), due to topographic, lithological (Peruccacci et al., 2012), and climatic factors (Wilson and Jayko, 1997). With respect to climate, normalizing model precipitation thresholds by mean annual precipitation alone is unlikely to succeed over large areas because it fails to consider the frequency and intensity of the rainfall events that compose annual totals (Wilson, 2000). Instead, geographic variations can be accounted for by evaluating real-time precipitation relative to extreme events. In LHASA version 2, we use the 99th percentile to represent relatively extreme events, and divide daily rainfall totals at each pixel by that amount. To calculate the historical 99th percentile rainfall at each grid cell, a set of empirical observations for each 0.1° grid cell in the area from 60°N to 60°S was generated from the final IMERG daily rainfall totals for the years 2000–2018. For each grid cell, a synthetic log-normal distribution was fitted to the data with the SciPy python library (Virtanen et al., 2020), because the log-normal distribution fits satellite rainfall data well (Cho et al., 2004). Moreover, the log-normal distribution is not as sensitive to the skewness of rainfall data when compared with the gamma distribution, which means the estimation of extreme values using synthetic fits is less influenced by outliers in the empirical data. A global 0.1° raster that represented the 99th percentile rainfall was generated from the log-normal distributions defined for each grid cell.
A Global Lithologic Rating
The global lithologic map (GLiM; Hartmann and Moosdorf, 2012) was converted to a lithologic strength rating by using maximum topographic slope as an indicator of material strength. This analysis relies on the physical assumption that stronger rocks will, on average, support steeper slopes in mountainous terrain (Schmidt and Montgomery, 1995). For each lithologic unit, we extracted the distribution of maximum slope values at 1 km2 resolution. The average of this maximum slope distribution was calculated for each lithologic category, from which a ranked order of lithology was determined (Table 3). For this analysis, we excluded low-relief areas (maximum slope < 25°) because much of the world’s terrain lacks relief for reasons other than lithologic strength. This choice of slope threshold was subjective but balanced the size of the area observed with the need to focus on mountain belts.
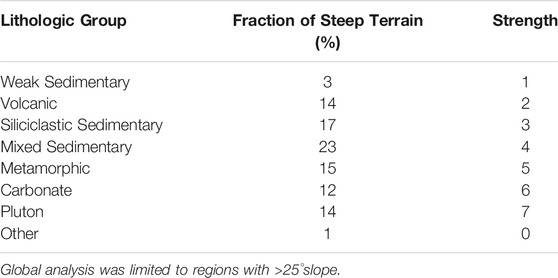
TABLE 3. A global lithologic map was converted into a material strength ranking by merging lithologic categories into groups and ranking the groups based on the average of maximum slope angles from 1 km bins.
Some units from the GLiM database were combined and others were excluded. Combining units with similar slope distributions but small spatial extents avoided spurious results and produced a classification where most lithologic groups had similar spatial representation in our analysis of between 12 and 24% of the total analyzed area (Table 3). For example, volcanic rocks and plutonic rocks of variable chemistry were merged into two categories, respectively. The exception to these roughly equal-extent categories was “weak sedimentary rocks,” which is represented by evaporites and unconsolidated sediments and covers just 3% of the analyzed area. GLiM categories of “no-data,” water bodies, and ice were excluded from the slope analysis and assigned a lithologic rating of zero.
The resulting ranking by slope largely follows weathering susceptibility of primary rock forming minerals (e.g.Wilson, 2004), with the exception of weak sedimentary materials where lithification likely plays a dominant role. Although this rating was constructed with a small portion of the global slope dataset, it represents an independent and physically meaningful quantity. It is worth noting that this classification relies on lithology alone, and therefore lacks consideration of rock age used by other proposed lithology ranking schemes for landslide susceptibility (e.g.Nadim et al., 2006). We favor use of GLiM because the map resolution is much higher than other global datasets that include rock age. We also recognize that soil cover is highly variable and contributes to landslide susceptibility that is not considered by our analysis. This approach also avoids the use of landslide data as a means of determining the relative strength of lithologic units, which would pose problems related to the small number of landslides recorded in some lithologic units, confounding variables, and the independence of the validation data. A recent global analysis of erodibility used similar methods and data to produce a series of lithologic ratings that resemble but are not identical to that in Table 3 (Ott, 2020).
A Global Gridded Landslide Inventory
In order to reflect the diversity of landslides triggered by rainfall, numerous landslide inventories were obtained (Table 2). These data spanned a gamut of spatial, tabular, and text formats. Each inventory was stored in a geodatabase if basic information such as the spatial coordinate reference system could be ascertained. Events without an associated date were omitted from the geodatabase. Landslides that occurred before the availability of SMAP data in 2015 were removed, as were landslides with spatial uncertainty worse than 1 km, and landslides caused by triggers other than rainfall (e.g. earthquakes). Some specific types of mass wasting were also removed, if known: rock falls, topples, creeps, riverbank collapses, and snow avalanches. The map of landslides triggered by Hurricane Maria in Dominica identified the parts of landslides, so only source areas were incorporated into the global gridded landslide inventory. Unfortunately, this information was not available for other inventories, although the Pokot inventory does represent landslide initiation points. The merged inventory was then converted to a grid with a 30-arcsecond daily resolution by counting the number of landslides in each grid cell. (In the case of polygons that extended over multiple grid cells, the polygon centroid was used to assign the landslide’s location.) These counts may contain some redundant reports of the same landslide from multiple inventories, but any redundancy does not affect the modeling results because LHASA version 2 simply attempts to predict the presence or absence of landslides, not the number. A version of this gridded global landslide inventory (with open datasets only) can be downloaded from landslides.nasa.gov. This gridded global landslide inventory was crucial for training the landslide nowcast model.
A Data-Driven Nowcast
In order to achieve the full potential of machine learning, we employed XGBoost, a widely used framework (Chen and Guestrin, 2016). Due to its accuracy and speed, XGBoost has been applied to numerous problems, including landslide research (Zhao et al., 2018; Chakraborty et al., 2019; Sahin, 2020; Stanley et al., 2020). This algorithm builds an ensemble of trees by creating a single tree at each iteration. Each successive tree corrects the deficiencies of the existing ensemble. These trees are often called “weak learners” because they are poorly predictive as individuals but can be extremely powerful as a collective. XGBoost can be applied in other ways, but LHASA version 2 has been structured as a binary classification problem in which the algorithm was trained to predict the presence or absence of landslides. In addition to speed and accuracy, XGBoost offers several additional benefits that led to its use in the global landslide nowcast. It has a large user community, extensive documentation, and access via multiple programming languages. XGBoost also offers features that can make the trained model more realistic and reliable. Interaction constraints control which variables can be included in the same tree. Monotonicity constraints limit the direction in which each variable contributes to the final output, but the weight of that contribution is still determined empirically. The latter is an important tool to prevent overfitting (Stanley et al., 2020). Finally, the structural similarity between its trees and the tree structure of LHASA version 1 (Kirschbaum and Stanley, 2018) should help users to make the switch. For these reasons, the new global landslide nowcast was created by training a model with the XGBoost library.
In LHASA version 2, information from a variety of time scales is merged to produce a map of landslide hazard for the current moment. The model incorporates slowly changing or static variables, such as topography and lithologic strength, as well as time variant ones including rainfall and soil moisture (Table 1). LHASA version 2 incorporates the most recent daily rainfall available in IMERG, which has a 4 h latency (Figure 2). The possible contribution of melting snowpack to runoff and groundwater is represented by the variable snow mass from SMAP L4. The full profile soil wetness from SMAP L4 represents the state of surficial ground water prior to the current rainfall. Because SMAP L4 has a latency of about 3 days, the gap between antecedent soil wetness and current daily rainfall must be filled by an antecedent rainfall metric (Figure 2). In LHASA version 2, the antecedent rainfall is simply summed over the most recent 2 day period. This combination of data from multiple time periods was intended to succinctly represent processes that contribute to landslide hazard over a range of time scales.
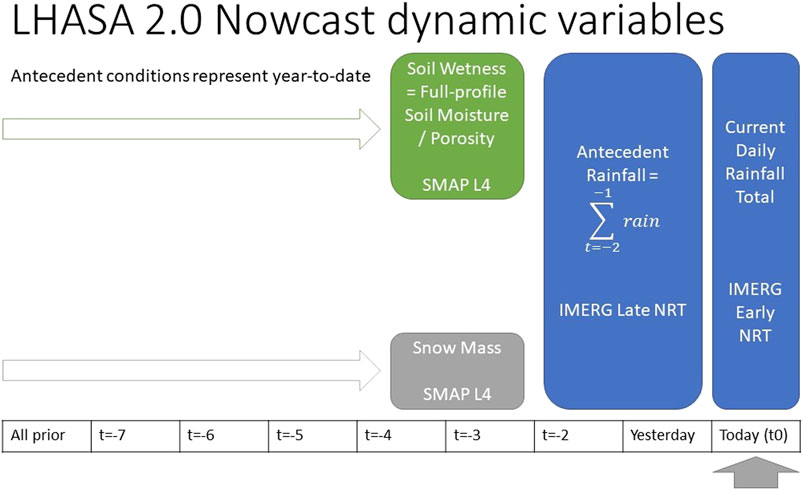
FIGURE 2. Four dynamic predictors, derived from satellite remote sensing, are used to produce the global landslide nowcast. The full-profile soil wetness and snow mass variables from the SMAP level 4 have a latency greater than 2 days. Therefore, 2 days of antecedent rainfall are used to fill the gap between these variables and the most recent rainfall.
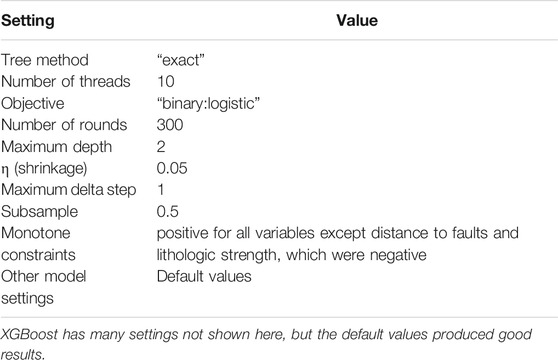
These variables were translated to a probability of landslide occurrence with XGBoost by using the gridded global landslide inventory as a target dataset with a daily 30-arcsecond resolution. (All predictors were regridded to this resolution with the nearest-neighbor method.) The nowcast model was trained with data from the period April 3, 2015 to December 31, 2018. (Any incomplete data points were removed.) This dataset included 9,700 landslide grid cells and over 1 million grid cells randomly selected across space and time to represent the non-occurrence of terrestrial landslides. Each class was split randomly into a training dataset that contained 80% of the available grid cells and a testing dataset that contained the remaining 20%. This testing dataset was used only for model development; landslide inventories from the years 2019 and 2020 were retained for model evaluation, as described below. An ensemble of 1,000 trees was trained, but performance on the test dataset declined after 300 iterations. Therefore, only the first 300 trees were retained for subsequent predictions, including model validation. Table 4 summarizes the model settings. Model depth was limited to a maximum of 2, in order to enable a specific arrangement of interaction constraints. A rarely used feature of XGBoost, interaction constraints control which variables can be included in the same model tree. In this scheme, all variables were forced to interact with rainfall, but other interactions were disabled. This arrangement was intended to represent the effects of all other preconditions on the rescaled daily rainfall necessary to trigger landslides. This model design parallels the “trigger-cause” framework proposed by Bogaard and Greco (2018), although its intellectual origins lie with the recent-antecedent rainfall thresholds for the city of Seattle in the western United States of America (Chleborad, 2000; Scheevel et al., 2017). Relatively few changes to other model settings were required (Table 4).
The trained model relies most heavily on the current daily rainfall to determine whether landslides are probable, as indicated by standard metrics of variable importance: gain, coverage, and frequency (Table 5). Gain represents the information obtained from the average split on that variable, coverage represents the portion of data points for which a variable impacts the model outputs, and frequency indicates the number of times XGBoost makes a split on a variable. Due to the design of the interaction constraints, rainfall would be expected to show a high frequency—but the high gain and coverage indicate a strong empirical relationship between current daily rainfall and landslide occurrence. The same pattern can be seen in an example tree (Figure 3), but the other variables occupy a large proportion of the nodes in other trees. These variables were retained in the final model because they may be important in scenarios such as rain-on-snow events, even if the overall weight is less than for rainfall.
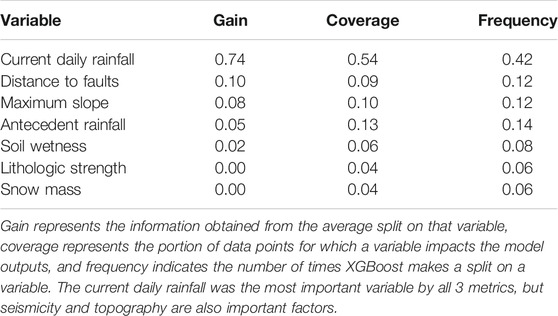
TABLE 5. XGBoost provides default metrics of variable importance; the values shown here have been rescaled to sum to 1.
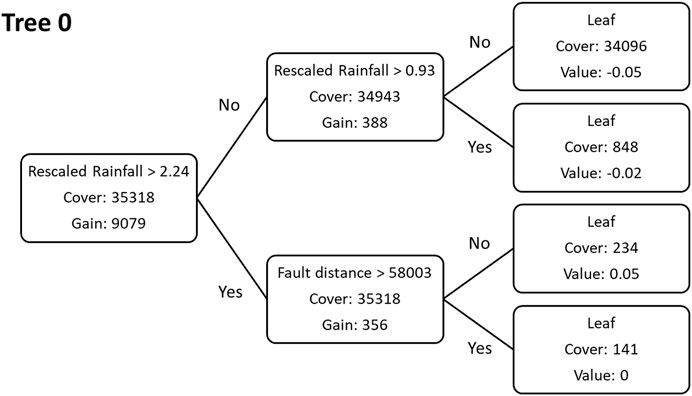
FIGURE 3. The 1st of 300 trees in the XGBoost ensemble uses current rainfall and distance to faults (m). This indicates that hazard is highest when rainfall is high and distance to faults is low. Other trees in the model have a similar structure but may split these or other variables at different numerical values.
Data preprocessing and model training occurred on a virtual machine with ten central processing units, 120 gigabytes of memory, and a Linux operating system. It took approximately 8 min to produce a global nowcast for 1 day. Input-output operations were more significant to system performance than the machine-learning model itself, which requires less than a minute to process the entire world for 1 day. In order to speed up processing, the retrospective model run was divided across multiple virtual machines, each handling 1 year of data. These resources were provided by the Advanced Data Analytics Platform at the NASA Center for Climate Simulation (https://www.nccs.nasa.gov/systems/ADAPT).
Evaluation Across Inventories
The model was applied to data from May 2015 to April 2020 based on the length of the SMAP L4 archive. As in model training, incomplete data points were dropped; these were typically coastal pixels masked in SMAP L4. The resulting daily maps of landslide probability were limited to the zone between 60° North and South. In order to evaluate the model’s performance against the discrete outputs of LHASA version 1 (Emberson et al., 2020), a threshold of 0.12 was applied to the probabilistic outputs of LHASA version 2; this ensured that the discretized nowcasts would have the same false positive rate (FPR). This threshold is solely intended for comparison and is not necessarily optimal for any specific use. An operational system should consider multiple goals prior to the selection of one or more probability thresholds to determine landslide hazard levels.
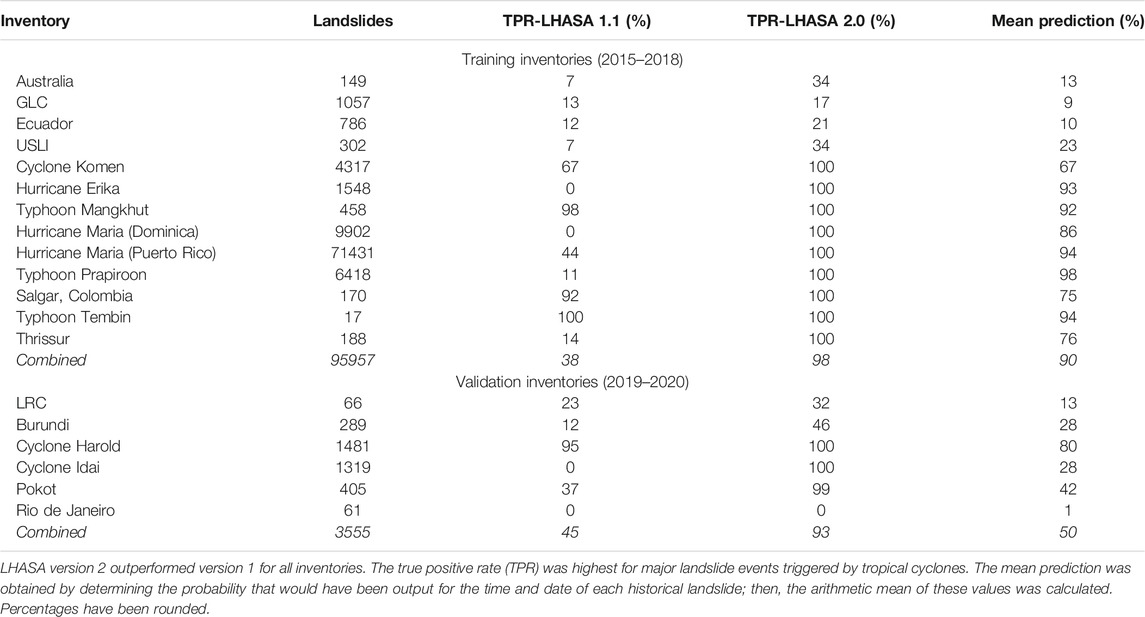
Temporal separation of training and validation data has been recommended for hydrological modeling (KlemeŠ, 1986) and machine learning (Galvez et al., 2019), because the use of random train-test splits or cross-validation can reduce the independence of the validation dataset by using data from the same event for both model development and evaluation. In keeping with this practice, landslide inventories collected for rainfall events in the years 2019 and 2020 were used to evaluate the model. Then, the predicted probability for the date and location of each landslide was extracted. For comparison, the LHASA version 1 high-hazard nowcast was also extracted for each landslide. Landslides with probabilities higher than the threshold were considered true positives, and the others were considered false negatives. With these values, a true positive rate (TPR) was calculated for each validation inventory, as well as the combined meta-inventory.
Results
LHASA version 2 outperformed version 1 for all landslide inventories evaluated (Table 6). Overall results were excellent for both the training and validation data. However, LHASA version 2 failed to predict a probability greater than 0.12 for the majority of landslides in several inventories: the GLC, LRC, USLI, and the databases for Australia, Burundi, and Rio de Janeiro. With the exceptions of Burundi and Rio de Janeiro, high probabilities of landslide occurrence were obtained for all the event-based landslide inventories (Figure 4). Possible reasons for these failures are discussed below.
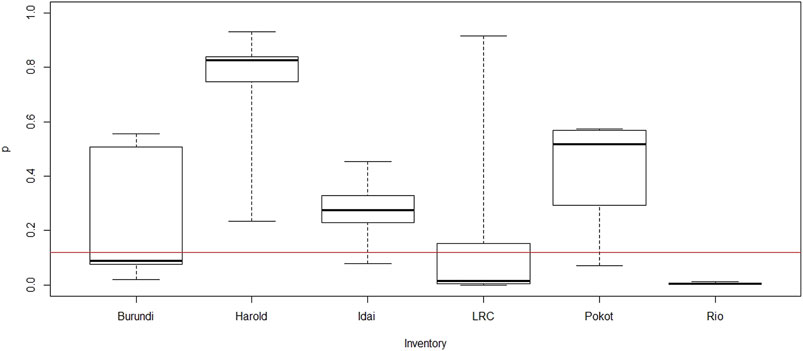
FIGURE 4. Predictions made by LHASA version 2 at individual landslides in the validation inventories range from 0 to 93%. The red line indicates the probability threshold of 0.12 that represents an equivalent global false positive rate (FPR) to the LHASA version 1 nowcast. If this threshold were raised, both the true positive rate (TPR) and FPR would be reduced. Likewise, lowering the threshold would increase both TPR and FPR.
Given a threshold of 0.12, LHASA version 2 produced nowcasts most frequently in landslide hotspots (Figure 5). We assume that the frequency of nowcasts serves as an approximation of the true false alarm rate, because landslide events are quite rare in most locations. The most notable hotspots were in the nations of Colombia, Indonesia, and Papua New Guinea, where nowcasts were produced more than 10% of the time in small areas. However, LHASA version 2 would have produced nowcasts quite rarely in most of the world (Figure 5), and even large mountainous regions would have a false alarm rate less than 1%. In contrast, LHASA version 1 produces nowcasts at a relatively consistent rate in susceptible zones because it uses a percentile-based threshold (Kirschbaum and Stanley, 2018). A few of these nowcasts represent landslide events, but most are not associated with reported landslides.
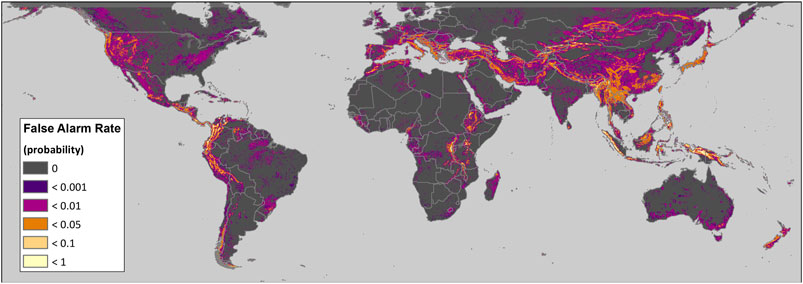
FIGURE 5. The false alarm rate for the time period May 1, 2015 to April 30, 2020 would have been very low in most locations. However, small hotspots in New Guinea and the northern Andes would have experienced nowcasts more than 10% of the time.
In addition to evaluating the model’s performance relative to the existing global nowcasts, the predictions can provide some insight into patterns of landslide hazard—although the 5 years timeframe precludes the detection of long-term trends or climate patterns. The mean daily probability of landslide occurrence for each 30-arcsecond grid cell shows the relative hazard across the world’s temperate and tropical regions. This average is very low in flat or dry regions such as the Sahara Desert and the Australian Outback (Figure 6). Like the global landslide susceptibility map (Stanley and Kirschbaum, 2017), this map highlights the major mountain ranges and the Pacific Rim. However, the importance in LHASA version 2 of rainfall and proximity to active faults (Table 5) has reduced the emphasis on certain areas, such as eastern North America, coastal Brazil, and Tibet, relative to the susceptibility map. This retrospective analysis also identified a few locations with unusually high probabilities of landslide occurrence: the Northern Andes, the Indonesian archipelago, and the East African Rift (Figure 6). The distribution of hazard across the latter region largely corresponded to that shown in a data-based landslide susceptibility map of Africa (Broeckx et al., 2018), but LHASA version 2 places relatively less emphasis on other African regions. Figure 6 shows greater differences with a map of precipitation-triggered landslide hazard for Indonesia (Cepeda et al., 2010), which placed a higher emphasis on the islands of Sulawesi, Borneo, and Flores. Despite some changes in emphasis, the overall geographic distribution of landslide hazard identified by LHASA version 2 generally corresponds with findings from prior landslide research.
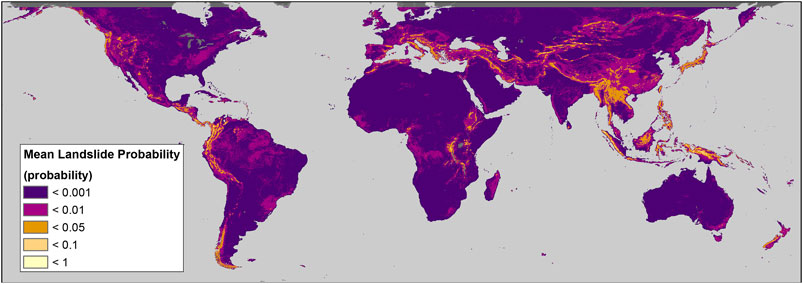
FIGURE 6. The mean prediction over the time period May 1, 2015 to April 30, 2020 was lowest in many of the world’s deserts and highest in small areas of the Northern Andes and New Guinea.
Discussion
Comparison of the results for different inventories shows a remarkable divergence in accuracy (Table 6). One explanation could be the predominance of landslides triggered by tropical cyclones within the training data. In this hypothesis, the model is well-calibrated to predicting major cyclonic events but not isolated landslides. However, we believe this is not the sole—or even the primary—cause of the divergence. Some important false negatives, such as the February 6, 2019 landslides in Rio de Janeiro (Figure 4) and the Regent landslide in Sierra Leone, were not predicted due to the absence of heavy rainfall shown by IMERG. IMERG tends to underestimate the intensity of some mesoscale convective systems (Cui et al., 2020) because the orbiting passive microwave sensors within the IMERG constellation can miss short, intense peaks in precipitation if there is not a recent overpass. However, underestimation of peak rain rates should be less important for the IMERG Early product (Maranan et al., 2020). In contrast, IMERG estimates heavy rainfall from tropical cyclones well (Omranian et al., 2018; Huang et al., 2019). Recent object-based analysis also found that IMERG performs better with large, intense storms, although it often underestimates peak precipitation rates (Li et al., 2020). These known errors may limit the resolution of short but intense convective events that can form and dissipate quickly, causing localized landslides and flashfloods. Although LHASA version 2 may miss some of these events, the IMERG algorithm team is working to better resolve extreme precipitation events, which should improve the model’s future performance.
In addition to errors in precipitation estimates, the divergence could be explained by anthropogenic factors. The multitemporal inventories, such as the GLC and USLI, contain many landslides in anthropogenically modified terrain, such as along roads and in mines. These sites may have required far less rain to trigger landslides than the relatively natural areas covered by much of the event-based inventories. The performance of the model on the LRC data points suggests that these submissions are of comparable quality to the GLC and other report-based inventories; thus, future models could be trained with these data. This should not be too surprising, since all points in the LRC are reviewed by NASA staff prior to publication (Juang et al., 2019). LHASA version 2 does not incorporate any measures of anthropogenic disturbance, which limits its ability to predict many life-threatening landslides. Deforestation is one mechanism through which humans alter the environment and increase landslide hazard. This factor was not included in LHASA version 2, but it may be possible to detect the effects of deforestation on landslide hazard at the global scale. Future work can also address the challenge of anthropogenic impact by considering one or more indices of disturbance that could be added to the model as explanatory variables.
Although incorporation of SMAP data in LHASA version 2 provides valuable information on antecedent conditions, it also limits the nowcast to a specific spatiotemporal domain. SMAP’s land mask excludes some small coastal areas such as the delta north of Balubuk, Indonesia, but these are very small in comparison to the earth’s total land mass. More significantly, the SMAP L4 product does not cover dates prior to the Spring of 2015. This limits the applicability of LHASA version 2 to long-term analyses of climate and landslide hazard, as well as the length of the model calibration period. However, it is still possible to train the global landslide nowcast with the available data, and the inclusion of both snow mass and soil moisture in some decision trees (Table 5) indicates that these variables are acting to reduce errors. In addition to the limited domain, using the SMAP product introduces a second limitation to the model’s real-time implementation to the prior potential for interruptions to IMERG data production and transfer. These interruptions are expected to be rare, but one such outage coincided with the passage of Hurricane Iota through Central America in November 2020 with the result that nowcast publication was delayed by one day. Nevertheless, based on the model evaluation, the benefits of incorporating antecedent conditions from the SMAP L4 product outweigh the challenges. Future iterations of the LHASA version 2 model may consider additional soil moisture products or integrate information from upcoming missions.
The most labor-intensive task in developing LHASA version 2 was compiling the gridded global landslide inventory. The lack of standardized file formats, schema, and publication methods prevented the use of fully automated methods for filtering and merging data from a wide variety of institutions. Even locating openly available landslide inventories required substantial effort. The United States Geological Survey hosts a repository of earthquake-triggered landslide inventories that has achieved a relatively high level of participation by the research community (Schmitt et al., 2017), which facilitates finding and obtaining the relevant data. Unfortunately, no comprehensive collection of rainfall-triggered landslides has achieved comparable success. A few researchers have shared data through NASA’s Cooperative Online Landslide Repository1, but most data on that portal was produced by NASA. We hope that the new LandAware effort will help to coordinate data sharing across a diverse research community (Calvello et al., 2020).
Machine learning has a reputation for producing “black box” models that cannot be easily understood. Although this might be true for recurrent neural networks, tree-based models like XGBoost are much easier to interpret. The contents of each tree can be shown in human readable format and reviewed individually for plausibility. Even for ensembles with hundreds of trees, this effort could be completed in finite time by a human reviewer. In the development of LHASA version 2, we took additional measures to build trust and enhance model interpretability. The use of monotonicity constraints, interaction constraints, and a tree depth limit of 2 forced the model into a simple and consistent structure. Not coincidentally, this structure parallels that of LHASA version 1, with its division into triggering rainfall and contributing factors. This familiarity should help end users transition between model versions. These practices not only facilitated model interpretation, but also prevented overfitting. We consider this ease of interpretation a crucial strength of LHASA version 2, and one that should more easily allow regulators and other stakeholders to trust the model results.
In addition to building trust, model interpretability may enhance scientific research by illuminating which known physical processes have acted most frequently, most strongly, or in specific instances. Sensitivity analysis, scenario analysis, and visualization can also be important tools for this purpose. In evaluating the model, we produced numerous diagrams in which two factors were systematically varied from historical conditions. Figure 7 shows one example of this process in which the relative contributions of current and antecedent rainfall can be seen in one historical scenario. The contour shape and spacing shows that the rescaled daily rainfall variable has a strong influence on model outputs, while the antecedent rainfall has a lesser but still substantial influence. Since standard validation metrics can be misleading (Steger et al., 2016), we recommend checks like these to all empirical landslide modelers.
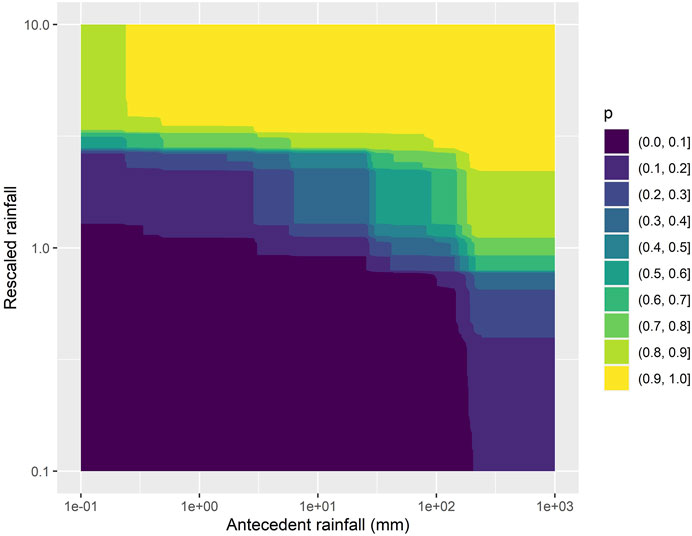
FIGURE 7. Contours from an analysis in which the current day’s rainfall (rescaled at each grid cell) and antecedent rainfall were varied over a wide range of potential inputs, while keeping all other variables consistent with historical conditions on December 16, 2015 in Eastern Luzon, Philippines (122.3542, 16.73756). Dark blue indicates low probability of landslide occurrence, while yellow indicates high probabilities. The shape and spacing of the contours indicate that both variables play an important role in landslide hazard, but the tighter spacing of the contours along the y axis suggests that the model weights current daily rainfall more heavily than prior rainfall.
The shift from LHASA version 1 to version 2 doubled the accuracy of the global landslide nowcast for the inventories evaluated. Furthermore, the new version produces a continuous output that facilitates use cases with a wider variety of trade-offs between false positives and false negatives. The model succeeded at identifying landslides triggered by major tropical cyclones, but missed a majority of landslides contained in national and global multitemporal inventories, which tend to contain more isolated and anthropogenically influenced landslides. Nevertheless, LHASA version 2 outperforms the existing product on these inventories as well. NASA Goddard Space Flight Center has begun publishing the new global landslide nowcast, which should be available by the middle of 2021. To enable other institutions to run the model, the source code will be published at https://github.com/nasa/LHASA.
Future research should be directed toward locating and quantifying the effects of anthropogenic slope modification, given the underestimates of landslide hazard in disturbed terrain. In addition, the dynamic effects of wildfire, earthquakes, and forest loss have not been fully captured by the variables used in this model; more research must be done to incorporate these into LHASA. Finally, more work needs to be done to convert these results into real-time estimates of global landslide risk. We anticipate that with greater sharing of landslide inventories, vulnerability estimates, and other information across the global communities of scientific research and disaster response, these goals may be achieved. LHASA version 2 advances our understanding of landslide hazard and could help to identify populations and infrastructure at risk from landslides around the world.
Data Availability Statement
The raw data supporting the conclusions of this article will be made available by the authors, without undue reservation.
Author Contributions
DK was responsible for the strategic vision and stakeholder interactions. MC designed the global lithologic rating, and WM prototyped this variable. RE calculated the statistical distribution of IMERG rainfall estimates and manually mapped landslides. PA mapped landslides with a semi-automatic object-based approach. GB searched for landslide inventories and converted all inventories into a standard format for ingest into LHASA. TS developed the LHASA version 2 model and performed all other tasks.
Funding
This research was supported by NASA’s Disasters program through the solicitation for Earth Science Applications: Disaster Risk Reduction and Response (NNH18ZDA001N).
Conflict of Interest
The authors declare that the research was conducted in the absence of any commercial or financial relationships that could be construed as a potential conflict of interest.
Acknowledgments
We thank Gabrielle de Lannoy and Anne Felsberg for their advice on global soil moisture estimates, as well as Cees van Westen, Odin Marc, and other members of the landslide research community who shared landslide inventories or related information.
Supplementary Material
The Supplementary Material for this article can be found online at: https://www.frontiersin.org/articles/10.3389/feart.2021.640043/full#supplementary-material
Footnotes
References
Amatya, P., Kirschbaum, D., and Stanley, T. (2019). Use of Very High-Resolution Optical Data for Landslide Mapping and Susceptibility Analysis along the Karnali Highway, Nepal. Remote Sensing 11, 2284. doi:10.3390/rs11192284
Amatya, P., Kirschbaum, D., Stanley, T., and Tanyas, H. (2021). Landslide Mapping Using Object-Based Image Analysis and Open Source Tools. Eng. Geology 282, 106000. doi:10.1016/j.enggeo.2021.106000
Baum, R. L., and Godt, J. W. (2009). Early Warning of Rainfall-Induced Shallow Landslides and Debris Flows in the USA. Landslides 7, 259–272. doi:10.1007/s10346-009-0177-0
Bessette-Kirton, E. K., Cerovski-Darriau, C., Schulz, W. H., Coe, J. A., Kean, J. W., Godt, J. W., et al. (2019). Landslides Triggered by Hurricane Maria: Assessment of an Extreme Event in Puerto Rico. GSA Today 29, 4-10. doi:10.1130/GSATG383A.1
Bogaard, T., and Greco, R. (2018). Invited Perspectives: Hydrological Perspectives on Precipitation Intensity-Duration Thresholds for Landslide Initiation: Proposing Hydro-Meteorological Thresholds. Nat. Hazards Earth Syst. Sci. 18, 31–39. doi:10.5194/nhess-18-31-2018
Brocca, L., Ponziani, F., Moramarco, T., Melone, F., Berni, N., and Wagner, W. (2012). Improving Landslide Forecasting Using ASCAT-Derived Soil Moisture Data: A Case Study of the Torgiovannetto Landslide in Central Italy. Remote Sensing 4, 1232–1244. doi:10.3390/rs4051232
Broeckx, J., Vanmaercke, M., Duchateau, R., and Poesen, J. (2018). A Data-Based Landslide Susceptibility Map of Africa. Earth-Science Rev. 185, 102–121. doi:10.1016/j.earscirev.2018.05.002
Calvello, M., Devoli, G., Freeborough, K., Gariano, S. L., Guzzetti, F., Kirschbaum, D., et al. (2020). LandAware: a New International Network on Landslide Early Warning Systems. Landslides 17, 2699–2702. doi:10.1007/s10346-020-01548-7
Cepeda, J., Smebye, H., Vangelsten, B., Nadim, F., and Muslim, D. (2010). Landslide Risk in Indonesia. Geneva, Switzerland: ISDR.
Chakraborty, T., Alam, M. S., and Islam, M. D. (2019). “Landslide Susceptibility Mapping Using XGBoost Model in Chittagong District, Bangladesh,” in Proceedings, International Conference on Disaster Risk Management, Dhaka, Bangladesh, January 12-14, 2019, 431–434. Available at: https://jidpus.buet.ac.bd/ICDRM2019/resources/proceedings-papers/73_ICDRM_2019_Proceedings.pdf.
Chen, T., and Guestrin, C. (2016). “XGBoost: A Scalable Tree Boosting System,” in Proceedings of the 22nd ACM SIGKDD International Conference on Knowledge Discovery and Data Mining - San Francisco, California, USA August, (2016), 785–794. doi:10.1145/2939672.2939785
Chleborad, A. F., Baum, R. L., Godt, J. W., and Powers, P. S. (2008). “A Prototype System for Forecasting Landslides in the Seattle, Washington, Area,” in Reviews in Engineering Geology. Editors R. L. Baum, J. W. Godt, and L. M. Highland (Boulder, Colorado USA: Geological Society of America), 103–120. doi:10.1130/2008.4020(06)
Chleborad, A. F. (2000). Preliminary Method for Anticipating the Occurrence of Precipitation-Induced Landslides in Seattle, Washington. US Department of the Interior, US Geological Survey, 2000. doi:10.3133/ofr00469
Cho, H.-K., Bowman, K. P., and North, G. R. (2004). A Comparison of Gamma and Lognormal Distributions for Characterizing Satellite Rain Rates from the Tropical Rainfall Measuring Mission. J. Appl. Meteorol. 43, 1586–1597. doi:10.1175/JAM2165.1
Cui, W., Dong, X., Xi, B., Feng, Z., and Fan, J. (2020). Can the GPM IMERG Final Product Accurately Represent MCSs' Precipitation Characteristics over the Central and Eastern United States? J. Hydrometeorol. 21, 39–57. doi:10.1175/JHM-D-19-0123.1
de Ferranti, J. (2014). Digital Elevation Data - with SRTM Voids Filled Using Accurate Topographic Mapping. Viewfind. Panoramas. Available at: http://www.viewfinderpanoramas.org/dem3.html (Accessed November 17, 2015).
Emberson, R., Kirschbaum, D., and Stanley, T. (2020). New global characterisation of landslide exposure. Nat. Hazards Earth Syst. Sci. 20, 3413–3424. doi:10.5194/nhess-20-3413-2020
Emberson, R., Kirschbaum, D., Amatya, P., Tanyas, H., and Marc, O. (2021). Topographic characteristics of rainfall-induced landslides. in EGU General Assembly 2021 (online). doi:10.5194/egusphere-egu21-12335
Felsberg, A., De Lannoy, G. J. M., Girotto, M., Poesen, J., Reichle, R. H., and Stanley, T. (2021). Global Soil Water Estimates as Landslide Predictor: the Effectiveness of SMOS, SMAP and GRACE Observations, Land Surface Simulations and Data Assimilation. J. Hydrometeorol. 22, 1065–1084. doi:10.1175/JHM-D-20-0228
Froude, M. J., and Petley, D. N. (2018). Global Fatal Landslide Occurrence from 2004 to 2016. Nat. Hazards Earth Syst. Sci. 18, 2161–2181. doi:10.5194/nhess-18-2161-2018
Galvez, R., Fouhey, D. F., Jin, M., Szenicer, A., Muñoz-Jaramillo, A., Cheung, M. C. M., et al. (2019). A Machine-Learning Data Set Prepared from the NASA Solar Dynamics Observatory Mission. ApJS 242, 7. doi:10.3847/1538-4365/ab1005
Gariano, S. L., Brunetti, M. T., Iovine, G., Melillo, M., Peruccacci, S., Terranova, O., et al. (2015). Calibration and Validation of Rainfall Thresholds for Shallow Landslide Forecasting in Sicily, Southern Italy. Geomorphology 228, 653–665. doi:10.1016/j.geomorph.2014.10.019
GEM Hazard Team (2019). GEM Global Active Faults. Available at: https://github.com/GEMScienceTools/gem-global-active-faults/tree/master/geopackage (Accessed July 19, 2019).
Geoscience Australia (2018). Landslide Search. Available at: http://pid.geoscience.gov.au/dataset/ga/74273 (Accessed July 4, 2020).
Guzzetti, F., Gariano, S. L., Peruccacci, S., Brunetti, M. T., Marchesini, I., Rossi, M., et al. (2020). Geographical Landslide Early Warning Systems. Earth-Science Rev. 200, 102973. doi:10.1016/j.earscirev.2019.102973
Hartke, S. H., Wright, D. B., Kirschbaum, D. B., Stanley, T. A., and Li, Z. (2020). Incorporation of Satellite Precipitation Uncertainty in a Landslide Hazard Nowcasting System. J. Hydrometeorol. 21, 1741–1759. doi:10.1175/JHM-D-19-0295.1
Hartmann, J., and Moosdorf, N. (2012). The New Global Lithological Map Database GLiM: A Representation of Rock Properties at the Earth Surface. Geochem. Geophys. Geosyst. 13. doi:10.1029/2012GC004370
Hong, Y., and Adler, R. F. (2007). Towards an Early‐warning System for Global Landslides Triggered by Rainfall and Earthquake. Int. J. Remote Sensing 28, 3713–3719. doi:10.1080/01431160701311242
Hsu, Y.-C., Chang, Y.-L., Chang, C.-H., Yang, J.-C., and Tung, Y.-K. (2018). Physical-based Rainfall-Triggered Shallow Landslide Forecasting. Smart Water 3, 3. doi:10.1186/s40713-018-0011-8
Huang, C., Hu, J., Chen, S., Zhang, A., Liang, Z., Tong, X., et al. (2019). How Well Can IMERG Products Capture Typhoon Extreme Precipitation Events over Southern China? Remote Sensing 11, 70. doi:10.3390/rs11010070
Huffman, G. J., Bolvin, D. T., Braithwaite, D., Hsu, K.-L., Joyce, R. J., Kidd, C., et al. (2020). “Integrated Multi-Satellite Retrievals for the Global Precipitation Measurement (GPM) Mission (IMERG),” in Advances in Global Change Research (Springer), 343–353. doi:10.1007/978-3-030-24568-9_19
Huffman, G. J. (2016). GPM (IMERG) Late Precipitation L3 1 Day 0.1 Degree X 0.1 Degree V06B. Available at: ftp://jsimpson.pps.eosdis.nasa.gov/. (Accessed May 24, 2016). doi:10.5194/amt-2015-372-rc2
Hughes, K. S., Bayouth García, D., Martínez Milian, G. O., Schulz, W. H., and Baum, R. L. (2019). Map of Slope-Failure Locations in Puerto Rico after Hurricane María. Denver, CO, USA. Geologic Hazards Science Center, USGS. doi:10.5066/P9BVMD74
Iverson, R. M., George, D. L., Allstadt, K., Reid, M. E., Collins, B. D., Vallance, J. W., et al. (2015). Landslide Mobility and Hazards: Implications of the 2014 Oso Disaster. Earth Planet. Sci. Lett. 412, 197–208. doi:10.1016/j.epsl.2014.12.020
Juang, C. S., Stanley, T. A., and Kirschbaum, D. B. (2019). Using Citizen Science to Expand the Global Map of Landslides: Introducing the Cooperative Open Online Landslide Repository (COOLR). PLoS One 14, e0218657. doi:10.1371/journal.pone.0218657
Kelkar, K., Kirschbaum, D., Kirschbaum, D., and Stanley, T. (2017). “Constructing a Comprehensive Database for Rainfall-Triggered Landslides in the United States,” in Abstracts with Programs (Geological Society of America). doi:10.1130/abs/2017AM-304216
Kirschbaum, D., and Stanley, T. (2018). Satellite-Based Assessment of Rainfall-Triggered Landslide Hazard for Situational Awareness. Earth's Future 6, 505–523. doi:10.1002/2017EF000715
Kirschbaum, D. B., Adler, R., Hong, Y., Hill, S., and Lerner-Lam, A. (2010). A Global Landslide Catalog for Hazard Applications: Method, Results, and Limitations. Nat. Hazards 52, 561–575. doi:10.1007/s11069-009-9401-4
Kirschbaum, D., Stanley, T., and Zhou, Y. (2015a). Spatial and Temporal Analysis of a Global Landslide Catalog. Geomorphology 249, 4–15. doi:10.1016/j.geomorph.2015.03.016
Kirschbaum, D. B., Stanley, T., and Simmons, J. (2015b). A Dynamic Landslide Hazard Assessment System for Central America and Hispaniola. Nat. Hazards Earth Syst. Sci. 15, 2257–2272. doi:10.5194/nhess-15-2257-2015
KlemeŠ, V. (1986). Operational Testing of Hydrological Simulation Models. Hydrol. Sci. J. 31, 13–24. doi:10.1080/02626668609491024
Korup, O., and Stolle, A. (2014). Landslide Prediction from Machine Learning. Geology. Today 30, 26–33. doi:10.1111/gto.12034
Krøgli, I. K., Devoli, G., Colleuille, H., Boje, S., Sund, M., and Engen, I. K. (2018). The Norwegian Forecasting and Warning Service for Rainfall- and Snowmelt-Induced Landslides. Nat. Hazards Earth Syst. Sci. 18, 1427–1450. doi:10.5194/nhess-18-1427-2018
Li, Z., Wright, D. B., Zhang, S. Q., Kirschbaum, D. B., and Hartke, S. H. (2020). Object-Based Comparison of Data-Driven and Physics-Driven Satellite Estimates of Extreme Rainfall. J. Hydrometeorol. 21, 2759–2776. doi:10.1175/JHM-D-20-0041.1
Maranan, M., Fink, A. H., Knippertz, P., Amekudzi, L. K., Atiah, W. A., and Stengel, M. (2020). A Process-Based Validation of Gpm Imerg and its Sources Using a Mesoscale Rain Gauge Network in the West African Forest Zone. J. Hydrometeorol. 21, 729–749. doi:10.1175/JHM-D-19-0257.1
Marc, O., Hovius, N., Meunier, P., Uchida, T., and Hayashi, S. (2015). Transient Changes of Landslide Rates after Earthquakes. Geology 43, 883–886. doi:10.1130/G36961.1
Marc, O., Stumpf, A., Malet, J.-P., Gosset, M., Uchida, T., and Chiang, S.-H. (2018). Initial Insights from a Global Database of Rainfall-Induced Landslide Inventories: The Weak Influence of Slope and Strong Influence of Total Storm Rainfall. Earth Surf. Dynam. 6, 903–922. doi:10.5194/esurf-6-903-2018
Mirus, B. B., Becker, R. E., Baum, R. L., and Smith, J. B. (2018). Integrating Real-Time Subsurface Hydrologic Monitoring with Empirical Rainfall Thresholds to Improve Landslide Early Warning. Landslides 15, 1909–1919. doi:10.1007/s10346-018-0995-z
Monsieurs, E., Dewitte, O., Depicker, A., and Demoulin, A. (2019). Towards a Transferable Antecedent Rainfall-Susceptibility Threshold Approach for Landsliding. Water 11, 2202. doi:10.3390/W11112202
Musselman, K. N., Lehner, F., Ikeda, K., Clark, M. P., Prein, A. F., Liu, C., et al. (2018). Projected Increases and Shifts in Rain-On-Snow Flood Risk over Western North America. Nat. Clim Change 8, 808–812. doi:10.1038/s41558-018-0236-4
Nadim, F., Kjekstad, O., Peduzzi, P., Herold, C., and Jaedicke, C. (2006). Global Landslide and Avalanche Hotspots. Landslides 3, 159–173. doi:10.1007/s10346-006-0036-1
Omranian, E., Sharif, H., and Tavakoly, A. (2018). How Well Can Global Precipitation Measurement (GPM) Capture Hurricanes? Case Study: Hurricane Harvey. Remote Sensing 10, 1150. doi:10.3390/rs10071150
Ott, R. F. (2020). How Lithology Impacts Global Topography, Vegetation, and Animal Biodiversity: A Global‐Scale Analysis of Mountainous Regions. Geophys. Res. Lett. 47. doi:10.1029/2020GL088649
Peruccacci, S., Brunetti, M. T., Luciani, S., Vennari, C., and Guzzetti, F. (2012). Lithological and Seasonal Control on Rainfall Thresholds for the Possible Initiation of Landslides in Central Italy. Geomorphology 139–140, 79–90. doi:10.1016/j.geomorph.2011.10.005
Ponziani, F., Pandolfo, C., Stelluti, M., Berni, N., Brocca, L., and Moramarco, T. (2012). Assessment of Rainfall Thresholds and Soil Moisture Modeling for Operational Hydrogeological Risk Prevention in the Umbria Region (Central Italy). Landslides 9, 229–237. doi:10.1007/s10346-011-0287-3
Raia, S., Alvioli, M., Rossi, M., Baum, R. L., Godt, J. W., and Guzzetti, F. (2014). Improving Predictive Power of Physically Based Rainfall-Induced Shallow Landslide Models: a Probabilistic Approach. Geosci. Model. Dev. 7, 495–514. doi:10.5194/gmd-7-495-2014
Reichenbach, P., Rossi, M., Malamud, B. D., Mihir, M., and Guzzetti, F. (2018). A Review of Statistically-Based Landslide Susceptibility Models. Earth-Science Rev. 180, 60–91. doi:10.1016/j.earscirev.2018.03.001
Reichle, R., Lannoy, G., Koster, R. D., Crow, W. T., Kimball, J. S., and Liu, Q. (2018). SMAP L4 Global 3-hourly 9 Km EASE-Grid Surface and Root Zone Soil Moisture Geophysical Data. Boulder, Colorado USA. NASA National Snow and Ice Data Center Distributed Active Archive Center. Version 4. doi:10.5067/KPJNN2GI1DQR
Sahin, E. K. (2020). Assessing the Predictive Capability of Ensemble Tree Methods for Landslide Susceptibility Mapping Using XGBoost, Gradient Boosting Machine, and Random Forest. SN Appl. Sci. 2, 1308. doi:10.1007/s42452-020-3060-1
Sarikhan, I. Y., Stanton, K. D., Contreras, T. A., Polenz, M., Powell, J., Walsh, T. J., et al. (2008). Landslide Reconnaissance Following the Storm Event of December 1–3, 2007, in Western Washington. Available at: http://file.dnr.wa.gov/publications/ger_ofr2008-5_dec2007_landslides.pdf (Accessed December 23, 2016).
Scheevel, C. R., Baum, R. L., Mirus, B. B., and Smith, J. B. (2017). Precipitation Thresholds for Landslide Occurrence Near Seattle, Mukilteo, and Everett. Washington: U.S. Geological Survey Open-File Report, 2017–1039. doi:10.3133/ofr20171039
Schmidt, K. M., and Montgomery, D. R. (1995). Limits to Relief. Science 270 (5236), 617–620. doi:10.1126/science.270.5236.617
Schmitt, R. G., Tanyas, H., Nowicki Jessee, M. A., Zhu, J., Biegel, K. M., Allstadt, K. E., et al. (2017). An Open Repository of Earthquake-Triggered Ground-Failure Inventories. Denver, CO, USA. US Geological Survey. doi:10.3133/ds1064
Secretaría de Gestión de Riesgos - Escenarios (2016). 2016 Active Events. Available at: https://sgr-ecuador.carto.com/datasets (Accessed November 3, 2020).
Segoni, S., Lagomarsino, D., Fanti, R., Moretti, S., and Casagli, N. (2015). Integration of Rainfall Thresholds and Susceptibility Maps in the Emilia Romagna (Italy) Regional-Scale Landslide Warning System. Landslides 12, 773–785. doi:10.1007/s10346-014-0502-0
Segoni, S., Piciullo, L., and Gariano, S. L. (2018). A Review of the Recent Literature on Rainfall Thresholds for Landslide Occurrence. Landslides 15, 1483–1501. doi:10.1007/s10346-018-0966-4
Sims, E. M., and Liu, G. (2015). A Parameterization of the Probability of Snow-Rain Transition. J. Hydrometeorol. 16, 1466–1477. doi:10.1175/JHM-D-14-0211.1
Stanley, T., and Kirschbaum, D. B. (2017). A Heuristic Approach to Global Landslide Susceptibility Mapping. Nat. Hazards 87, 145–164. doi:10.1007/s11069-017-2757-y
Stanley, T. A., Kirschbaum, D. B., Sobieszczyk, S., Jasinski, M. F., Borak, J. S., and Slaughter, S. L. (2020). Building a Landslide Hazard Indicator with Machine Learning and Land Surface Models. Environ. Model. Softw. 129, 104692. doi:10.1016/j.envsoft.2020.104692
Steger, S., Brenning, A., Bell, R., Petschko, H., and Glade, T. (2016). Exploring Discrepancies between Quantitative Validation Results and the Geomorphic Plausibility of Statistical Landslide Susceptibility Maps. Geomorphology 262, 8–23. doi:10.1016/j.geomorph.2016.03.015
Thomas, M. A., Mirus, B. B., and Collins, B. D. (2018). Identifying Physics-Based Thresholds for Rainfall-Induced Landsliding. Geophys. Res. Lett. 45, 9651–9661. doi:10.1029/2018GL079662
Thomas, M. A., Collins, B. D., and Mirus, B. B. (2019). Assessing the Feasibility of Satellite‐Based Thresholds for Hydrologically Driven Landsliding. Water Resour. Res. 55, 9006–9023. doi:10.1029/2019WR025577
van Natijne, A. L., Lindenbergh, R. C., and Bogaard, T. A. (2020). Machine Learning: New Potential for Local and Regional Deep-Seated Landslide Nowcasting. Sensors 20, 1425. doi:10.3390/s20051425
van Westen, C. J., and Sijmons, K. (2016). Dominica Landslide Inventory. Available at: http://charim-geonode.net/layers/geonode:landslides_1#more (Accessed November 12, 2019).
van Westen, C. J., and Zhang, J. (2018). Landslides and Floods Triggered by Hurricane Maria (18 September, 2017) in Dominica. Available at: http://www.unitar.org/unosat/node/44/2762. Accessed November 12, 2019.
Vega, S. P., Williams, C. J., Brooks, E. S., Pierson, F. B., Strand, E. K., Robichaud, P. R., et al. (2020). Interaction of Wind and Cold‐season Hydrologic Processes on Erosion from Complex Topography Following Wildfire in Sagebrush Steppe. Earth Surf. Process. Landforms 45, 841–861. doi:10.1002/esp.4778
Virtanen, P., Gommers, R., Oliphant, T. E., Haberland, M., Reddy, T., et al. (2020). SciPy 1.0: Fundamental Algorithms for Scientific Computing in Python. Nat. Methods 17, 261–272. doi:10.1038/s41592-019-0686-2
Wilson, R. C., and Jayko, A. S. (1997). Preliminary Maps Showing Rainfall Thresholds for Debris- Flow Activity, San Francisco Bay Region, California. Available at: https://pubs.usgs.gov/of/1997/of97-745/sfbr-rt-dbdesc.pdf (Accessed August 27, 2015). doi:10.3133/ofr97745f
Wilson, R. C. (2000). “Climatic Variations in Rainfall Thresholds for Debris-Flow Activity,” in Proc. 1st Plinius Conf. On Mediterranean Storms. Editors P. Claps, F. Siccardi,. Maratea, Italy. European Geophysical Society. 415–424.
Wilson, M. J. (2004). Weathering of the Primary Rock-Forming Minerals: Processes, Products and Rates. Clay miner. 39, 233–266. doi:10.1180/0009855043930133
Zhao, J., Liu, Y., and Hu, M. (2018). Optimisation Algorithm for Decision Trees and the Prediction of Horizon Displacement of Landslides Monitoring. J. Eng. 2018, 1698–1703. doi:10.1049/joe.2018.8305
Keywords: XGBoost, machine learning, IMERG, SMAP, GPM, situational awareness, antecedent rainfall, tropical cyclone
Citation: Stanley TA, Kirschbaum DB, Benz G, Emberson RA, Amatya PM, Medwedeff W and Clark MK (2021) Data-Driven Landslide Nowcasting at the Global Scale. Front. Earth Sci. 9:640043. doi: 10.3389/feart.2021.640043
Received: 10 December 2020; Accepted: 30 April 2021;
Published: 26 May 2021.
Edited by:
Lei Wang, Institute of Remote Sensing and Digital Earth (CAS), ChinaReviewed by:
Qiang Dai, Nanjing Normal University, ChinaSamuele Segoni, University of Florence, Italy
Copyright © 2021 Stanley, Kirschbaum, Benz, Emberson, Amatya, Medwedeff and Clark. This is an open-access article distributed under the terms of the Creative Commons Attribution License (CC BY). The use, distribution or reproduction in other forums is permitted, provided the original author(s) and the copyright owner(s) are credited and that the original publication in this journal is cited, in accordance with accepted academic practice. No use, distribution or reproduction is permitted which does not comply with these terms.
*Correspondence: Thomas A. Stanley, dGhvbWFzLmEuc3RhbmxleUBuYXNhLmdvdg==
 Thomas A. Stanley
 Dalia B. Kirschbaum3
 Pukar M. Amatya
 William Medwedeff