 Awali Priyono1
 Andri Dian Nugraha1,2*
 Muzli Muzli3,4
 Ardianto Ardianto5Atin Nur Aulia6
 Billy Sugiartono Prabowo7
 Zulfakriza Zulfakriza1,2
 Shindy Rosalia1,2
 Annisa T. Sasmi5
 Haunan Afif8
 David P. Sahara1,2
 Sri Widiyantoro1,2,9
 Shengji Wei4,10Yayan M. Husni7
 Achmad Fajar Narotama Sarjan5
- 1Global Geophysics Research Group, Faculty of Mining and Petroleum Engineering, Institut Teknologi Bandung, Bandung, Indonesia
- 2Center for Earthquake Science and Technology, Institut Teknologi Bandung, Bandung, Indonesia
- 3Indonesian Meteorological, Climatological, and Geophysical Agency, Jakarta, Indonesia
- 4Earth Observatory of Singapore, Nanyang Technological University, Singapore, Singapore
- 5Geophysical Engineering, Faculty of Mining and Petroleum Engineering, Institut Teknologi Bandung, Bandung, Indonesia
- 6Indonesian Institute of Sciences, Bandung, Indonesia
- 7Volcanology and Geothermal Laboratory, Geophysical Engineering Department, Faculty of Mining and Petroleum Engineering, Institut Teknologi Bandung, Bandung, Indonesia
- 8Center for Volcanology and Geological Hazard Mitigation, Bandung, Indonesia
- 9Faculty of Engineering, Maranatha Christian University, Bandung, Indonesia
- 10Asian School of the Environment, Nanyang Technological University, Singapore, Singapore
Local earthquake data was used to determine a three-dimensional (3D) seismic attenuation structure around the aftershock source region of the 2018 Lombok earthquake in Indonesia. The aftershocks were recorded by 13 seismic stations from August 4 to September 9, 2018. The selected data consist of 6,281 P-wave t∗ values from 914 events, which had good t∗ quality in at least four stations. Our results show that the two aftershock clusters northwest and northeast of Lombok Island have different attenuation characteristics. A low P-wave quality factor (low-Qp), low P-wave velocity (Vp), and high ratio of P-wave velocity and S-wave velocity (Vp/Vs), which coincide with a shallower earthquake (<20 km) northwest of Lombok Island, might be associated with a brittle area of basal and imbricated faults influenced by high fluid content. At the same time, the high-Qp, low Vp, and low Vp/Vs, which coincide with a deeper earthquake (>20 km) northeast of Lombok Island, might be associated with an area that lacks fluid content. The difference in fluid content between the northwest and northeast regions might be the cause of the early generation of aftershocks in the northwest area. The significant earthquake that happened on August 5, 2018, took place in a region with moderate Qp, close to the contrast of high and low-Qp and high Vp, which suggests that the earthquake started in a strong material before triggering the shallower aftershocks occurring in an area affected by fluid content. We also identified an old intrusive body on the northeast flank of the Rinjani volcano, which was characterized by a high-Qp, high-velocity, and a high Bouguer anomaly.
Introduction
Lombok Island is located in West Nusa Tenggara and is part of the Sunda Arc, Indonesia, which is controlled by the subduction of the Indo-Australian Oceanic Plate beneath the Eurasian Plate with a relative motion of 70 ± 1.0 mm/year to the north (Koulali et al., 2016). The tectonic activity in this region forms the Flores Back-arc Thrust (FBT), which lies north of Flores, Sumbawa, and Bali (Hamilton, 1979; Silver et al., 1983). The term FBT, was first used by Silver et al. (1983) to map the forwardmost thrust to reach the surface above the decollement of the zone of the back-arc thrust north of Flores Island. According to the interpretation of 2D seismic reflection profiles (Silver et al., 1983; Yang et al., 2020), the complicated geological structure in the FBT is expressed by low-angle main basal faults and high-angle imbricate thrusts and its associated faults.
Two major geological structures significantly control the seismicity of Lombok Island (Figure 1): the megathrust in the south due to the subduction of the Indo-Australian Plate beneath the Eurasian Plate (Hamilton, 1979) and the FBT north of Lombok Island which dips to the south (Hamilton, 1979; Silver et al., 1983; Irsyam et al., 2017). The FBT occurs because of the accommodation of energy from the megathrust (Irsyam et al., 2017) which extends in an east-west direction with an estimated convergence rate of around 5.6–6.0 mm/year (Susilo et al., 2018). FBT extends from the north of central Flores Island to the northern part of Sumbawa Island (Hamilton, 1979). However, further research conducted by Silver et al. (1983) using seismic reflection data shows that this thrust extends further west to the Bali Basin.
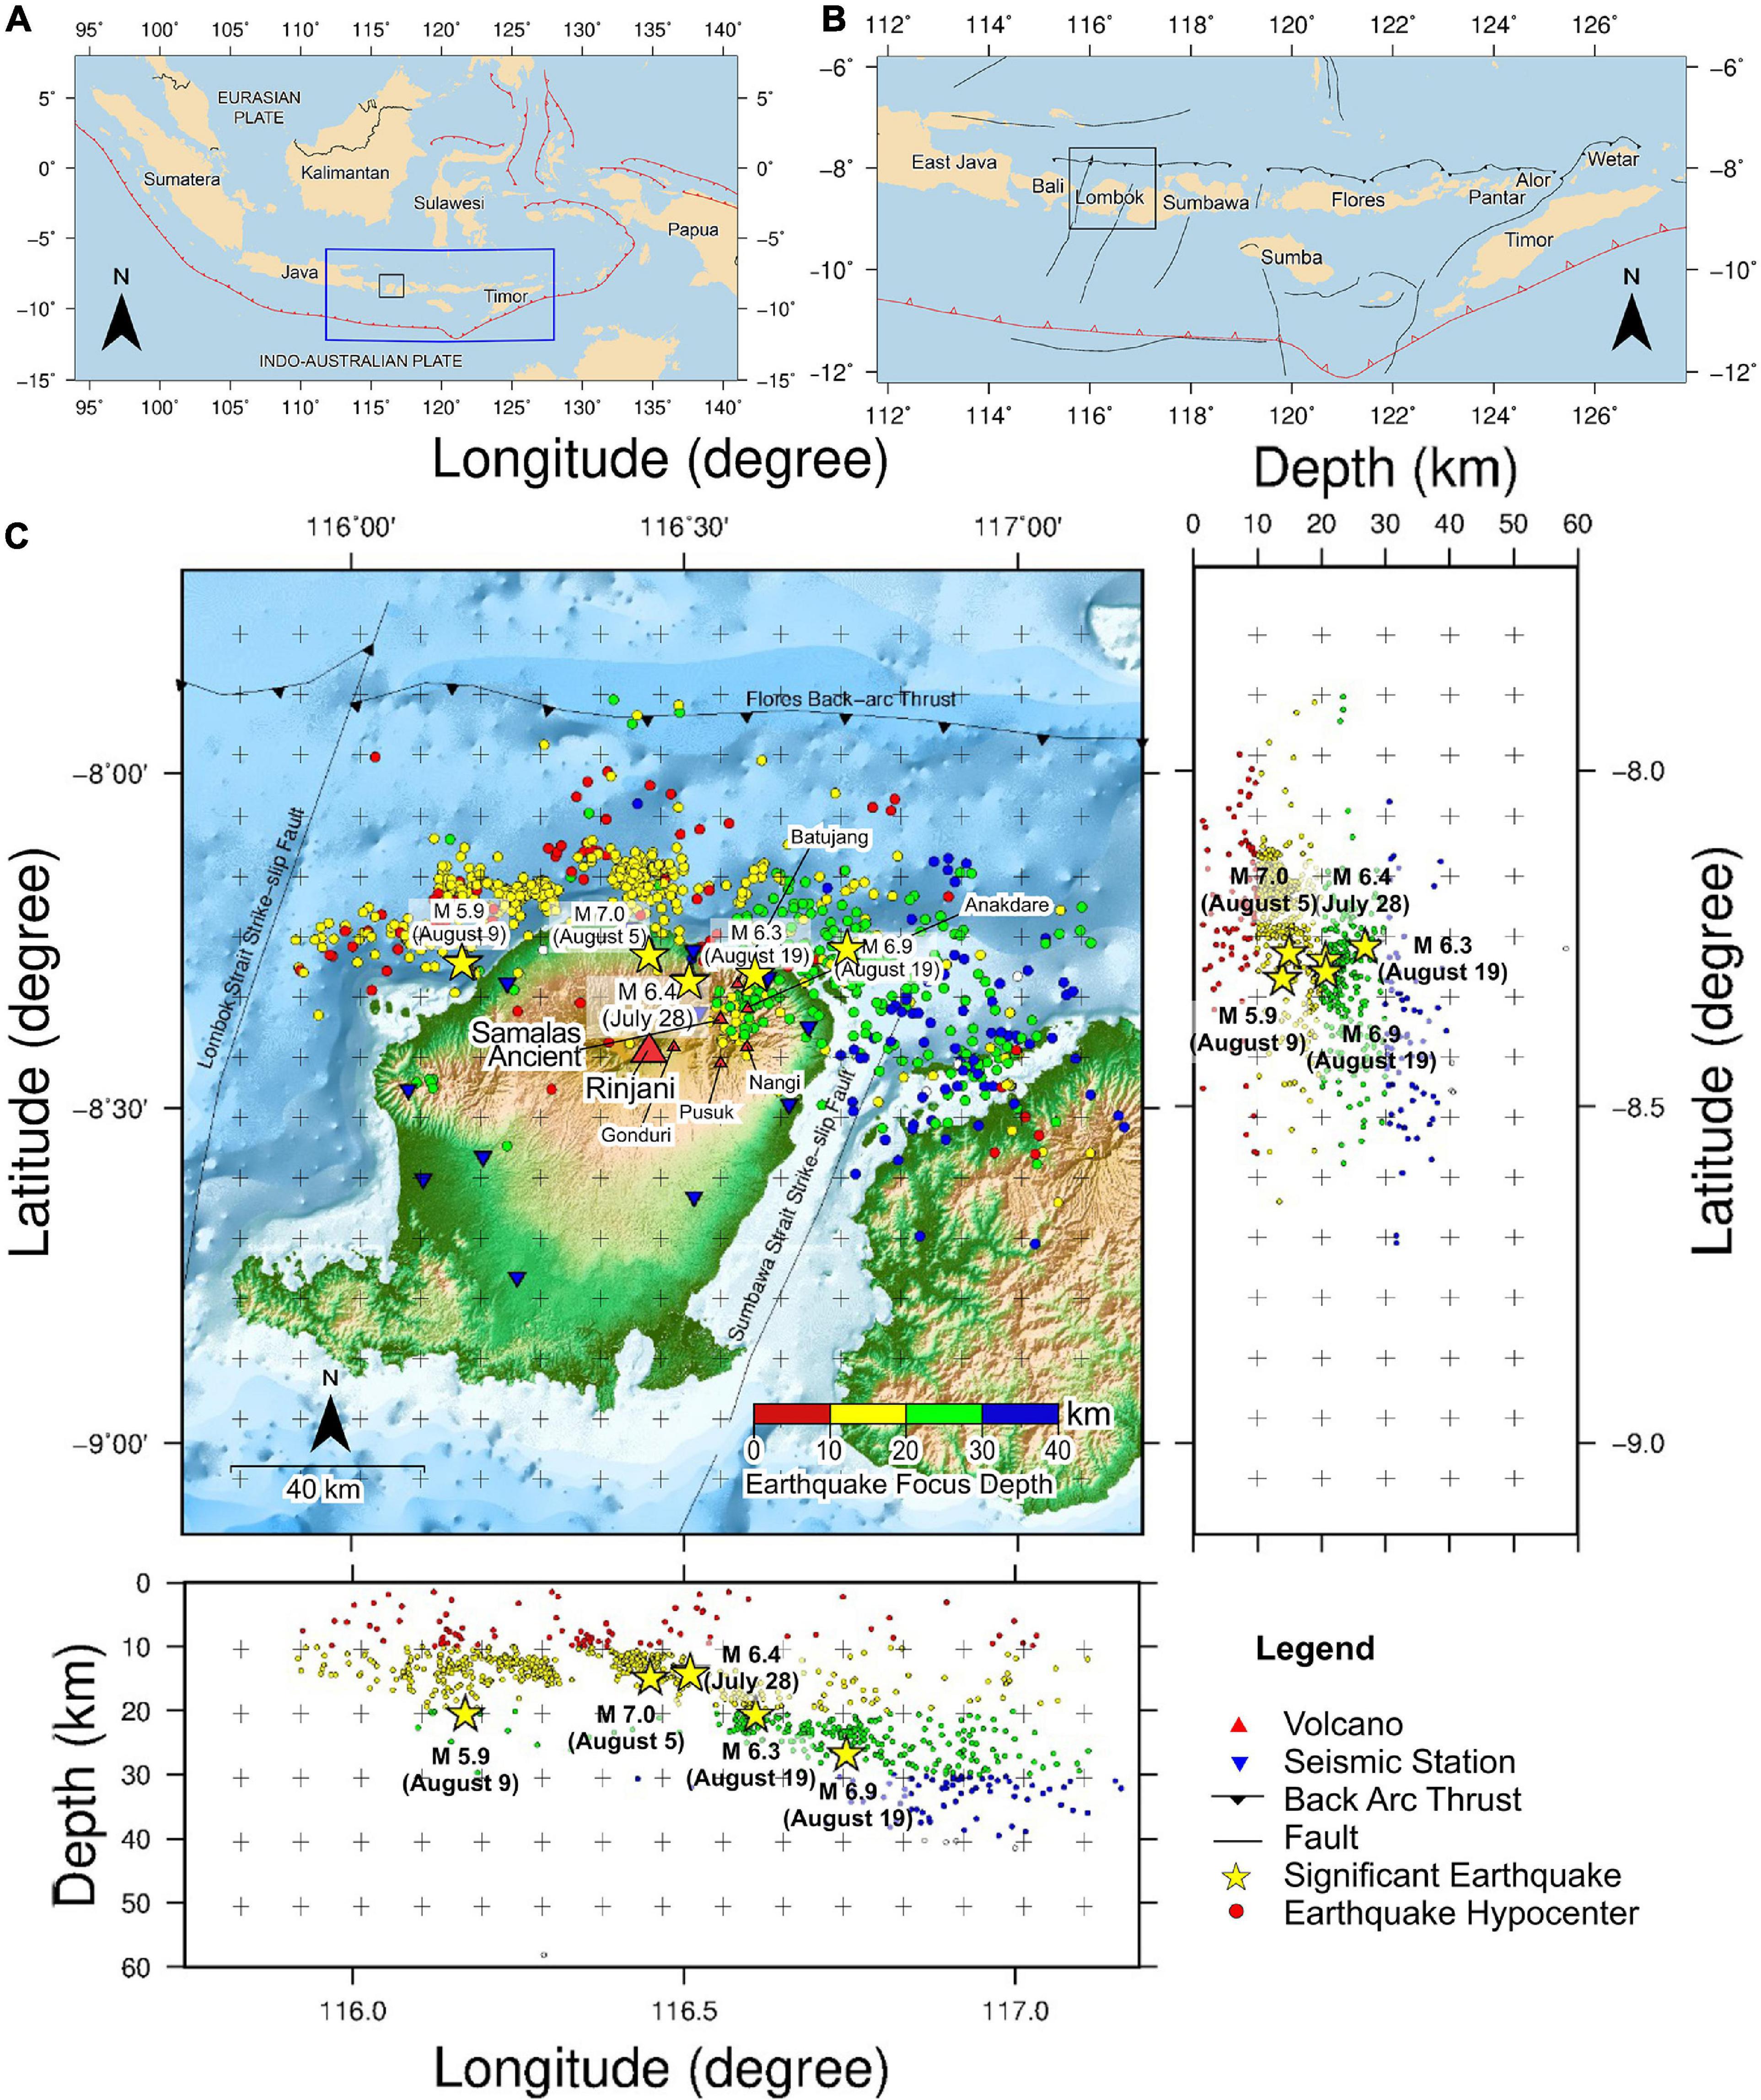
Figure 1. (A) Map showing the major tectonic boundaries of Indonesia. The blue rectangle denotes the Lesser Sunda Islands and the black rectangle denotes the Lombok Island. The red jagged line denotes the subduction zone. (B) Map showing the Lesser Sunda Islands (from west to east): Bali, Lombok, Sumbawa, Flores, Sumba, Pantar, Alor, and Timor Island. The black jagged lines denote the back-arc thrust in the north of the islands and the black lines denote the faults (Irsyam et al., 2017; Afif et al., 2020). (C) Map of Lombok Island and the surrounding area which shows the distribution of the initial hypocenters from Afif et al. (2020). The hypocenters plotted here are the selected hypocenters from the spectral fitting process. The colored circle shows the depth of the earthquakes. The blue inverted triangles are the seismic stations, the big red triangle is the Rinjani volcano, the small red triangles are a group of volcanoes that are no longer active, and the yellow stars are the significant earthquakes.
A series of major earthquakes in 2018 occurred in the northern part of Lombok Island which caused severe damage to the Lombok region. On July 28, 2018, at 22:47 (UTC), the first earthquake (Mw 6.4) struck the island and on August 5, 2018, at 11:46 (UTC) a second, more massive earthquake (Mw 7.0) took place west of the first event with both epicenters located north of Rinjani volcano (Figure 1). These earthquakes were followed by light to moderate aftershocks for several days (≤Mw 5.5); they extended northwest and induced a moderate event (Mw 5.9) on August 9, 2018, at 05:25 (UTC). On August 19, 2018, other two strong earthquakes struck Lombok Island; however, the epicenters were located northeast of the island. The first earthquake occurring on August 19, 2018 (Mw 6.3), took place at 04:10 (UTC), and the second earthquake (Mw 6.9) took place at 14:56 (UTC). After these earthquakes, aftershock activities extended northeast and further south. In the previous study of Sasmi et al. (2020), a total of 3,259 aftershock events have been identified with magnitudes ranging from Mw 1.7 to 6.7 and the depth between 5 and 25 km. The focal mechanism solutions from the Global Centroid Moment Tensor revealed that the Lombok earthquakes have a reverse fault mechanism with the strike generally oriented in an east-west direction parallel to the FBT (Sasmi et al., 2020).
The source area of the series of earthquakes occurring north of Lombok Island is an interesting study area as it produced a series of large earthquakes in a short amount of time (less than a month). Some studies have been conducted in this area; e.g., a study of the hypocenter and magnitude analysis of the 2018 Lombok aftershock, which suggests that spatial and temporal clustering of the seismicity may be linked to the segmentation of the Flores oceanic crust (FOC) (Sasmi et al., 2020). A body-wave travel time tomography study using a local network has also been done, which provide information about the characteristics of the mainshock and aftershock source regions (Afif et al., 2020). The recent study by Lythgoe et al. (2021) shows the influence of thermal squeezing in controlling the rupture in the Lombok seismogenic zone.
In this study, we applied seismic attenuation tomography to further investigate the characteristics of the source region. Seismic attenuation is the amplitude decrease of propagating waves due to the inelasticity and the inhomogeneities of the Earth, which are then parameterized using the dimensionless quality factor Q (Eberhart-Phillips, 2002; De Siena et al., 2010). This parameter primarily depends on temperature and fluid content (Karato, 2004; Wang et al., 2017); hence, seismic attenuation tomography is suitable for investigating very heterogeneous regions such as volcano, fault, and subduction zones (Eberhart-Phillips, 2002; Liu and Zhao, 2015; Wang et al., 2017). Several studies on attenuation tomography have been carried out to understand the physical state of fluids in a porous medium and reveal new details about the geometry of faults (Rietbrock, 2001; Hauksson and Shearer, 2006; Chiarabba et al., 2009; Muksin et al., 2013; Liu and Zhao, 2015; Komatsu et al., 2017; Wang et al., 2017). An attenuation tomography study of the southern California crust shows that the transition between high and low attenuation zones coincides with a major Late Quaternary fault (Hauksson and Shearer, 2006). The attenuation study done in the Southwest Japan Arc by Liu and Zhao (2015) shows that a high attenuation anomaly could be identified in or around the active faults. Previous attenuation studies were also successfully carried out to further investigate in detail the source zone of the Mw 7.3 2016 Kumamoto earthquake, Japan (Komatsu et al., 2017; Wang et al., 2017). Wang et al. (2017) estimated the attenuation model of the source zone of this earthquake and found that the mainshock occurred in a low attenuation and high-velocity zone in the upper crust underlain by high attenuation and low-velocity anomalies.
In this study, we estimate the Qp structures beneath the source region of the 2018 Lombok earthquakes using the same local network as Sasmi et al. (2020) and Afif et al. (2020). We aim to reveal the generation of the destructive earthquakes, the causes of spatial clustering of the seismicity in the 2018 Lombok earthquake, and any other geological features that could be identified using attenuation results. The integration of Qp structures and the P- and S-wave velocity structure from Afif et al. (2020) could give a better understanding of the source region.
Previous Geological and Geophysical Studies
The interpretation of the seismic profile north of Lombok Island by Yang et al. (2020) reveals that there are three principal stratigraphic units (from deep to shallow levels): the basement, the Upper Miocene limestone, and Pliocene to present-day young sediments. The basement depth is relatively deep in the western part, which implies that the accumulated sediment in the west is thicker than the accumulated sediment in the east. The active basal fault and imbricate fault in the western part are in the sediment layer, while the active fault intersects the basement in the east (Yang et al., 2020). Two strike-slip faults were also identified in the western and eastern parts of Lombok Island, which extend in a south-north direction: the Lombok Strait Strike-Slip Fault in the western part of Lombok Island which crosses the FBT, and the Sumbawa Strait Strike-Slip Fault in the eastern part of Lombok Island (Irsyam et al., 2017).
The currently active Rinjani volcano is located in the northern part of Lombok Island. The Rinjani caldera that can be seen today is the result of the paroxysmal eruption of the Samalas volcano. The AD 1257 Samalas volcanic eruption was one of the most massive, explosive Holocene eruptions and released a large amount of volcanic sulfur into the atmosphere globally (Lavigne et al., 2013). Based on the volcanic activity report from the Center for Volcanology and Geological Hazard Mitigation Indonesia the Rinjani volcano has not shown a significant increase in volcanic activity after this series of earthquakes and the last eruption occurred in 2016 (Global Volcanism Program, 2018).
Several geophysical studies have been conducted around the Lombok Islands. Based on the 1978 Flores earthquake and gravity data, McCaffrey and Nabelek (1984) found evidence of a 30° dipping southward active thrusting of the FOC beneath Lombok, which also confirmed by seismic velocity tomography of Widiyantoro et al. (2011). From the gravity regional study done on Lombok Island, a high Bouguer gravity anomaly of around 140 mGal was found northeast of the Rinjani volcano, which can be interpreted as the expression of an igneous rock or magmatic conduit (Sukardi, 1979; Zubaidah et al., 2010).
Afif et al. (2020) in their recent tomographic velocity study revealed that most of the significant earthquakes occurred at the edge of a high-velocity region where the stress concentration is expected to be the highest. The following aftershock is clustered in a low velocity and high-Vp/Vs zone. Afif et al. (2020) interpreted this zone as a highly fractured fault zone with a large amount of fluid. They suggest that the presence of fluid might accommodate the slip by lubricating and reducing the friction on the fault. After initiating some significant earthquakes, the relaxation of the stress in the subducting oceanic crust caused the generation of further events in areas where fluid infiltration had weakened the crust. They also interpreted a low velocity and high-Vp/Vs region located beneath the Rinjani volcano as caused by the presence of high temperatures and/or magma. A high-velocity and low-Vp/Vs on the eastern flank of Rinjani are interpreted as a cooled intrusive complex supported by a high Bouguer anomaly (Sukardi, 1979).
Data and Method
In this study, we use a temporary station network installed one week after the first large event of the 2018 Lombok earthquake sequence that occurred on July 29, 2018. Thirteen stations were deployed from August 4 to September 9, 2018, with the main purpose to monitor the aftershocks pattern and to obtain the subsurface image around the source zone. The coordinates of the stations are provided in Supplementary Table 1. We used aftershock data from the previous study done by Afif et al. (2020). We calculated the path-averaged attenuation factor (t∗) as a function of the travel time and dimensionless quality factor using the spectrum-fitting analysis before performing the tomography inversion.
Determining t∗
The attenuation structure can be estimated based on the amplitude decay of seismic waves which can be quantified through the t∗ parameter. The observed amplitude spectrum Aij(f) from event i to station j can be described as (Scherbaum, 1990; Muksin et al., 2013):
where f denotes the frequency, Rj(f) the site response, Ij(f) the instrumental response, and Bij(f) the absorption spectrum. The far-field source spectrum Si(f) can be expressed by the following equation (Muksin et al., 2013):
where Ω0i is the long-period spectral level including geometrical spreading factor (Hauksson and Shearer, 2006) and fci is the source corner frequency. The high-frequency decay factor γ is assumed to be 2; hence, Eq. 3 is equivalent to a Brune type ω2 source model (Brune, 1970). In terms of the whole path attenuation, the absorption spectrum Bij(f) is given by Haberland and Rietbrock (2001) as:
with tij denoting travel time. The site response Rj(f) is described by a station correction operator (Haberland and Rietbrock, 2001):
The operator is estimated simultaneously with the attenuation inversion as a travel time station correction in velocity inversion tomography (Nugraha et al., 2010). In addition, we set the transfer function of the seismometer to 1 since we only model the observed amplitude spectra in the passband of the seismometer and we are not using the absolute amplitudes (Haberland and Rietbrock, 2001). Using Eqs 1–4, the observed amplitude spectrum Aij(f) can be expressed as (Eberhart-Phillips, 2002; Muksin et al., 2013):
The term is often described by the station-dependent κ parameter (Anderson and Hough, 1984). Based on numerical tests and observations by Rietbrock (2001) and Shearer et al. (2006), assuming γ is 2 and Q is frequency independent, this provides a good fit for the observed amplitude spectra (Hauksson and Shearer, 2006):
We apply the spectrum-fitting procedure from Nugraha et al. (2010) using a grid search technique to estimate the above-mentioned attenuation parameters in Eq. 6. In evaluatingt*, the velocity recorded in the time domain is transformed into velocity amplitude spectrum in the frequency domain using Fast Fourier Transform (FFT). The P-wave spectrum is calculated from the vertical component of the seismogram in a window length of 2.56 s (0.56 s before and 2 s after the P-wave arrival) while the noise spectrum was taken 3.06 s before the arrival time of P-waves with the same window length (Figure 2) to calculate the signal-to-noise ratio (SNR).
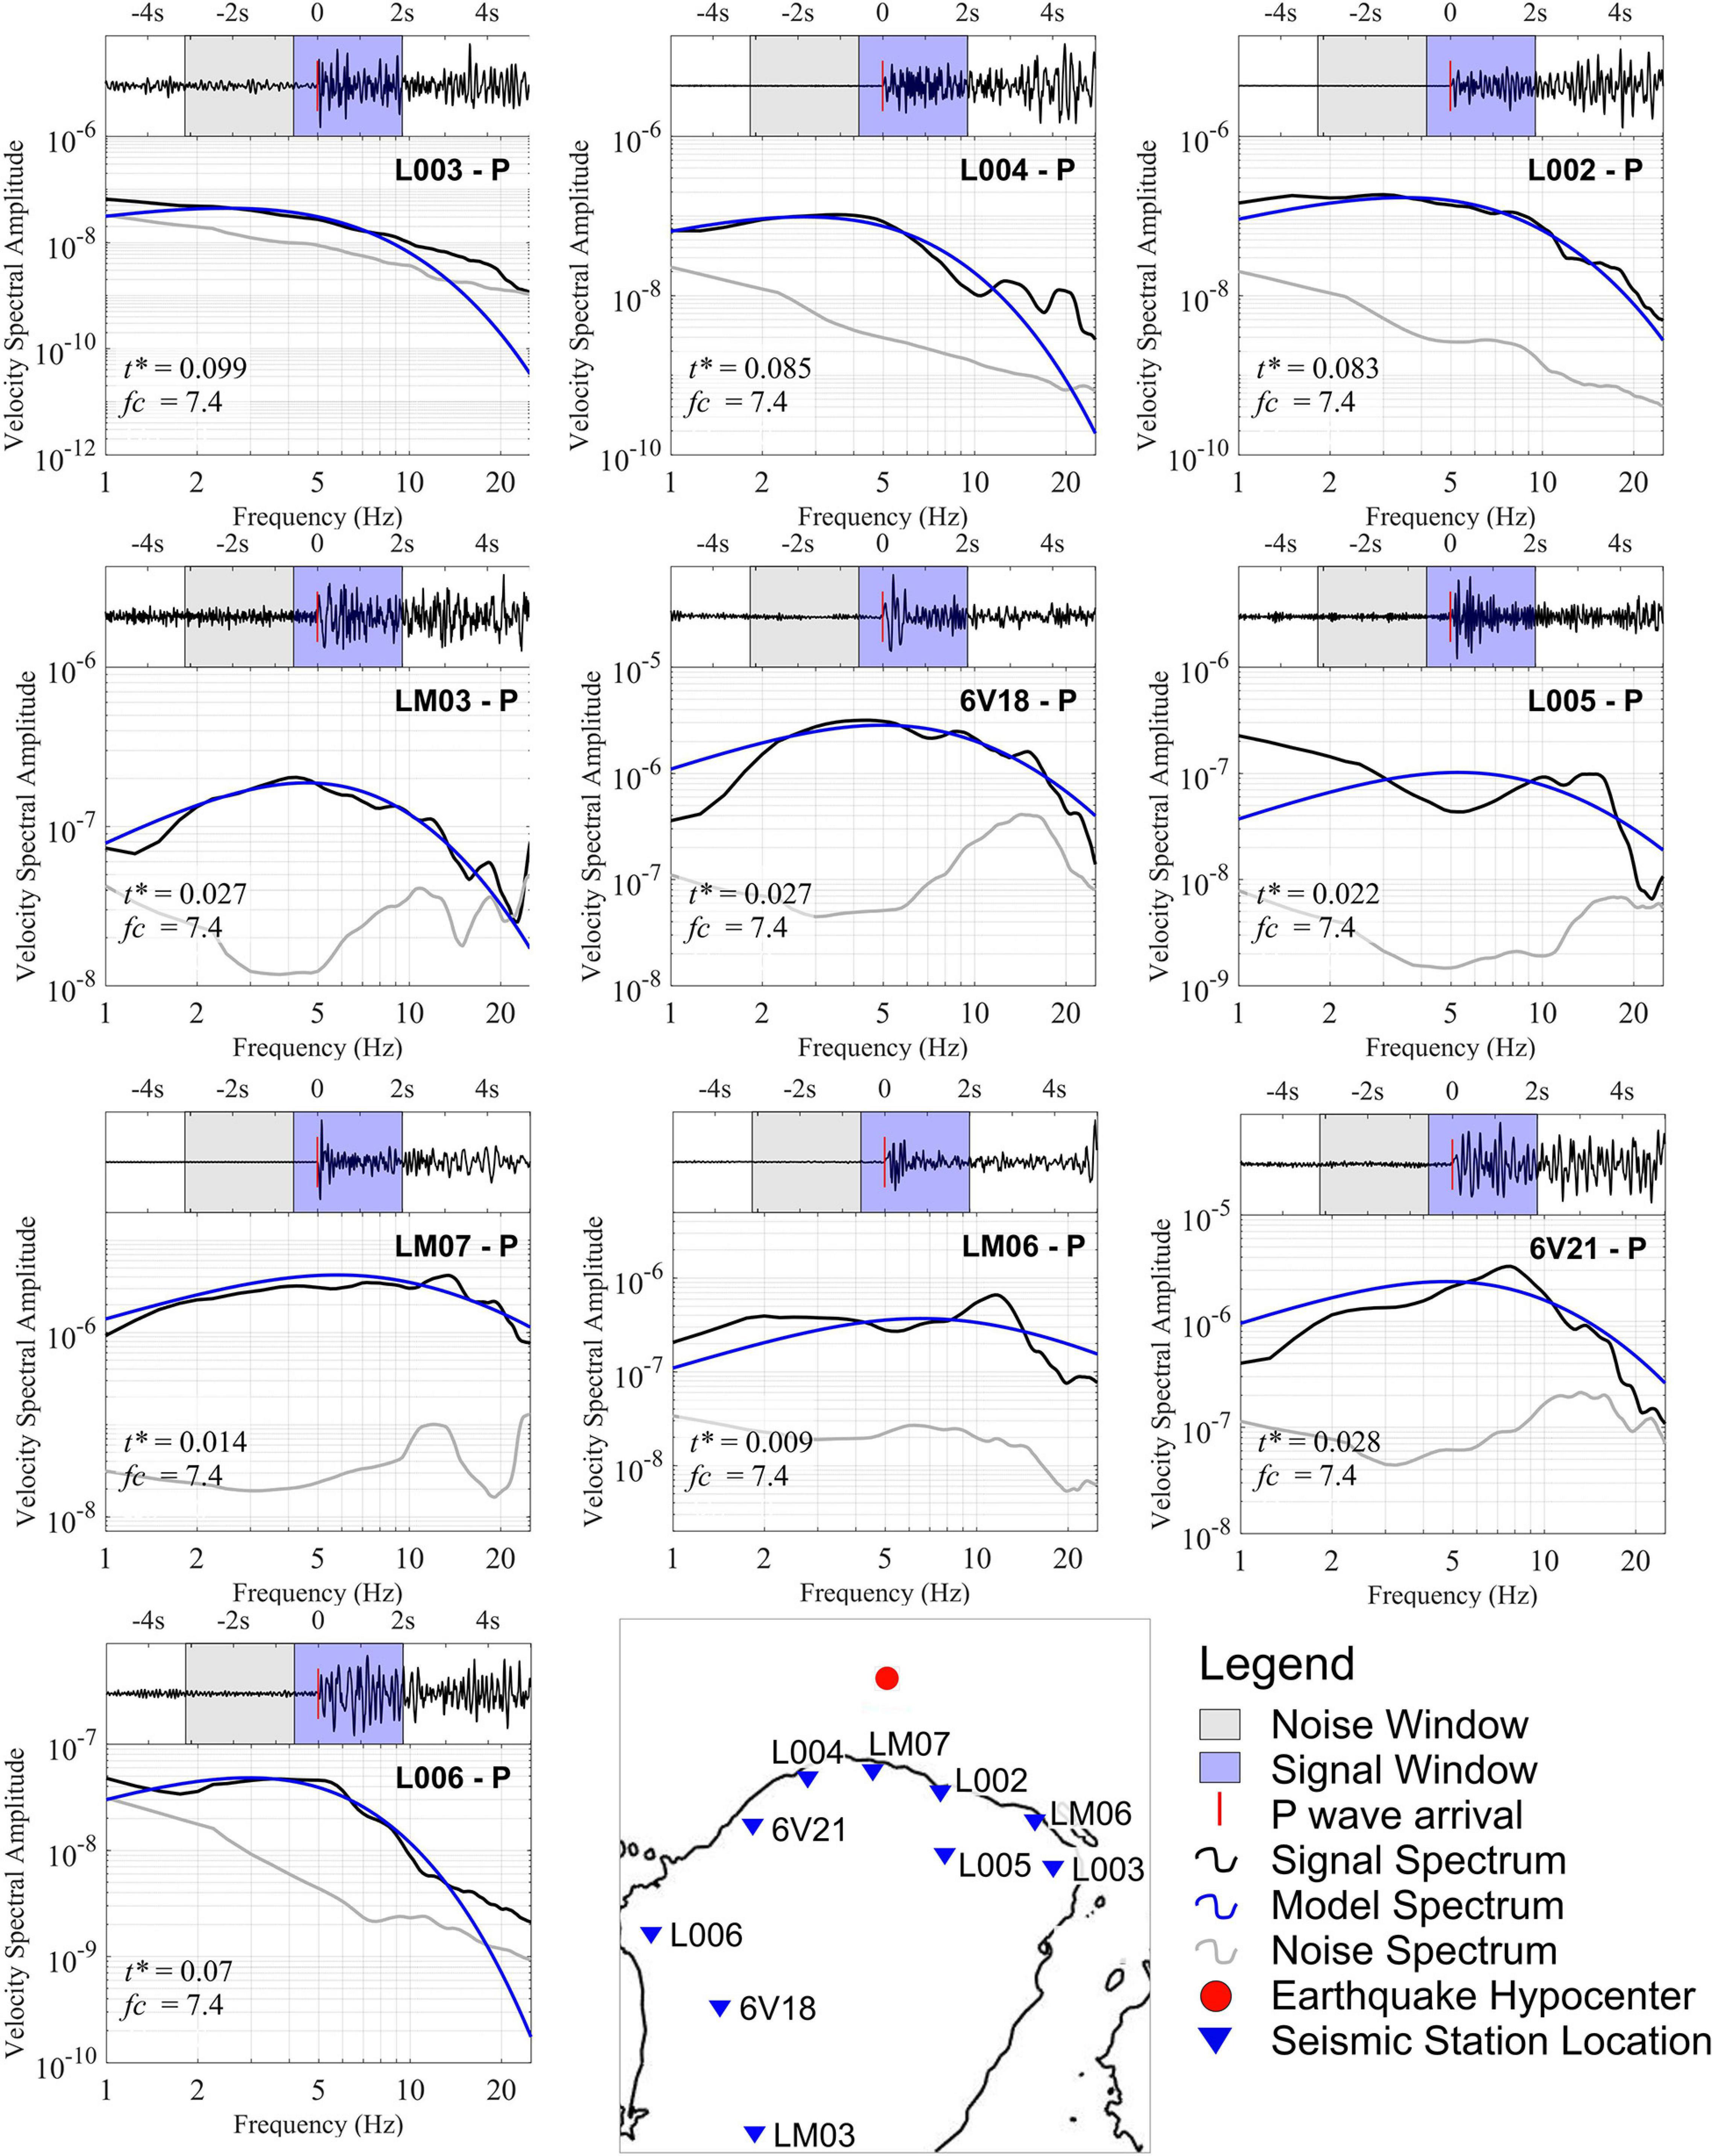
Figure 2. Example of spectral amplitude fitting of one earthquake in ten stations (location is shown by inset map). For each plot, we show the normalized time-series waveform data of the vertical component (top panel) and the signal and noise spectra (bottom panel). The window used in the analysis is 2.56 s (0.56 s before the arrival time and 2 s after the arrival time). The signal used in the study is within the blue-shaded windows, and the noise is within the gray-shaded windows. The gray line is the noise spectrum, the black line is the signal spectrum, and the blue line is the model (calculated) spectrum.
We first determine the average frequency corner f_c for each event before calculating t∗ since there is a trade-off between f_c and t∗ (Scherbaum, 1990). We obtained f_c ranging from 0.2 to 13.3 Hz. The Ω0 and t∗ are determined for a frequency range of 1–25 Hz by fitting Eq. 6 to the P-wave observed spectrum using previously calculated f_c. Two selection criteria were applied to ensure reliable estimation of t∗; each event needs to have at least four t∗ values and have SNR above 2-decibel (dB). We obtained 6,244 t∗ data from 914 events for P spectra (Figure 2). Since there are certain event criteria used in the data set, the number of earthquakes used for tomography attenuation differs from the velocity tomography of Afif et al. (2020). The minimum and maximum t∗ values used in the inversion are 0.001 and 0.1, which are similar to the values in the Southern California attenuation study done by Hauksson and Shearer (2006) and the Northern and Central California study by Lin (2014).
Attenuation Tomography
The relationship between the attenuation operator , quality factor Q, and velocity V can be expressed in the following equation:
where ds is the distance along the ray path from hypocenter i to station j. Given the a priori velocity model, only depends on the Q−1 values along the ray path; hence, Eq. 1 is similar to travel time tomography with known origin time and travel times (Haberland and Rietbrock, 2001).
We apply the SIMULPS2000 code by Thurber and Eberhart-Phillips (1999) to obtain a 3D frequency-independent Q_p structure from the values. The SIMULPS2000 code has been widely used in research on attenuation, such as in studies on the southern California crust (Hauksson and Shearer, 2006), the western Japan subduction zone (Nugraha et al., 2010), the Tarutung geothermal fields (Muksin et al., 2013), and Kilauea volcano (Lin et al., 2015). For the model parameterization, we used a similar grid size as the 3D velocity model of Afif et al. (2020) with a horizontal spacing of 10 km and vertical spacing of 10 km from 0 to 60 km depth (Figure 3). We also use the hypocenter location and origin times determined simultaneously with the 3D velocity inversion of Afif et al. (2020) using Simulps12 (Evans et al., 1994).
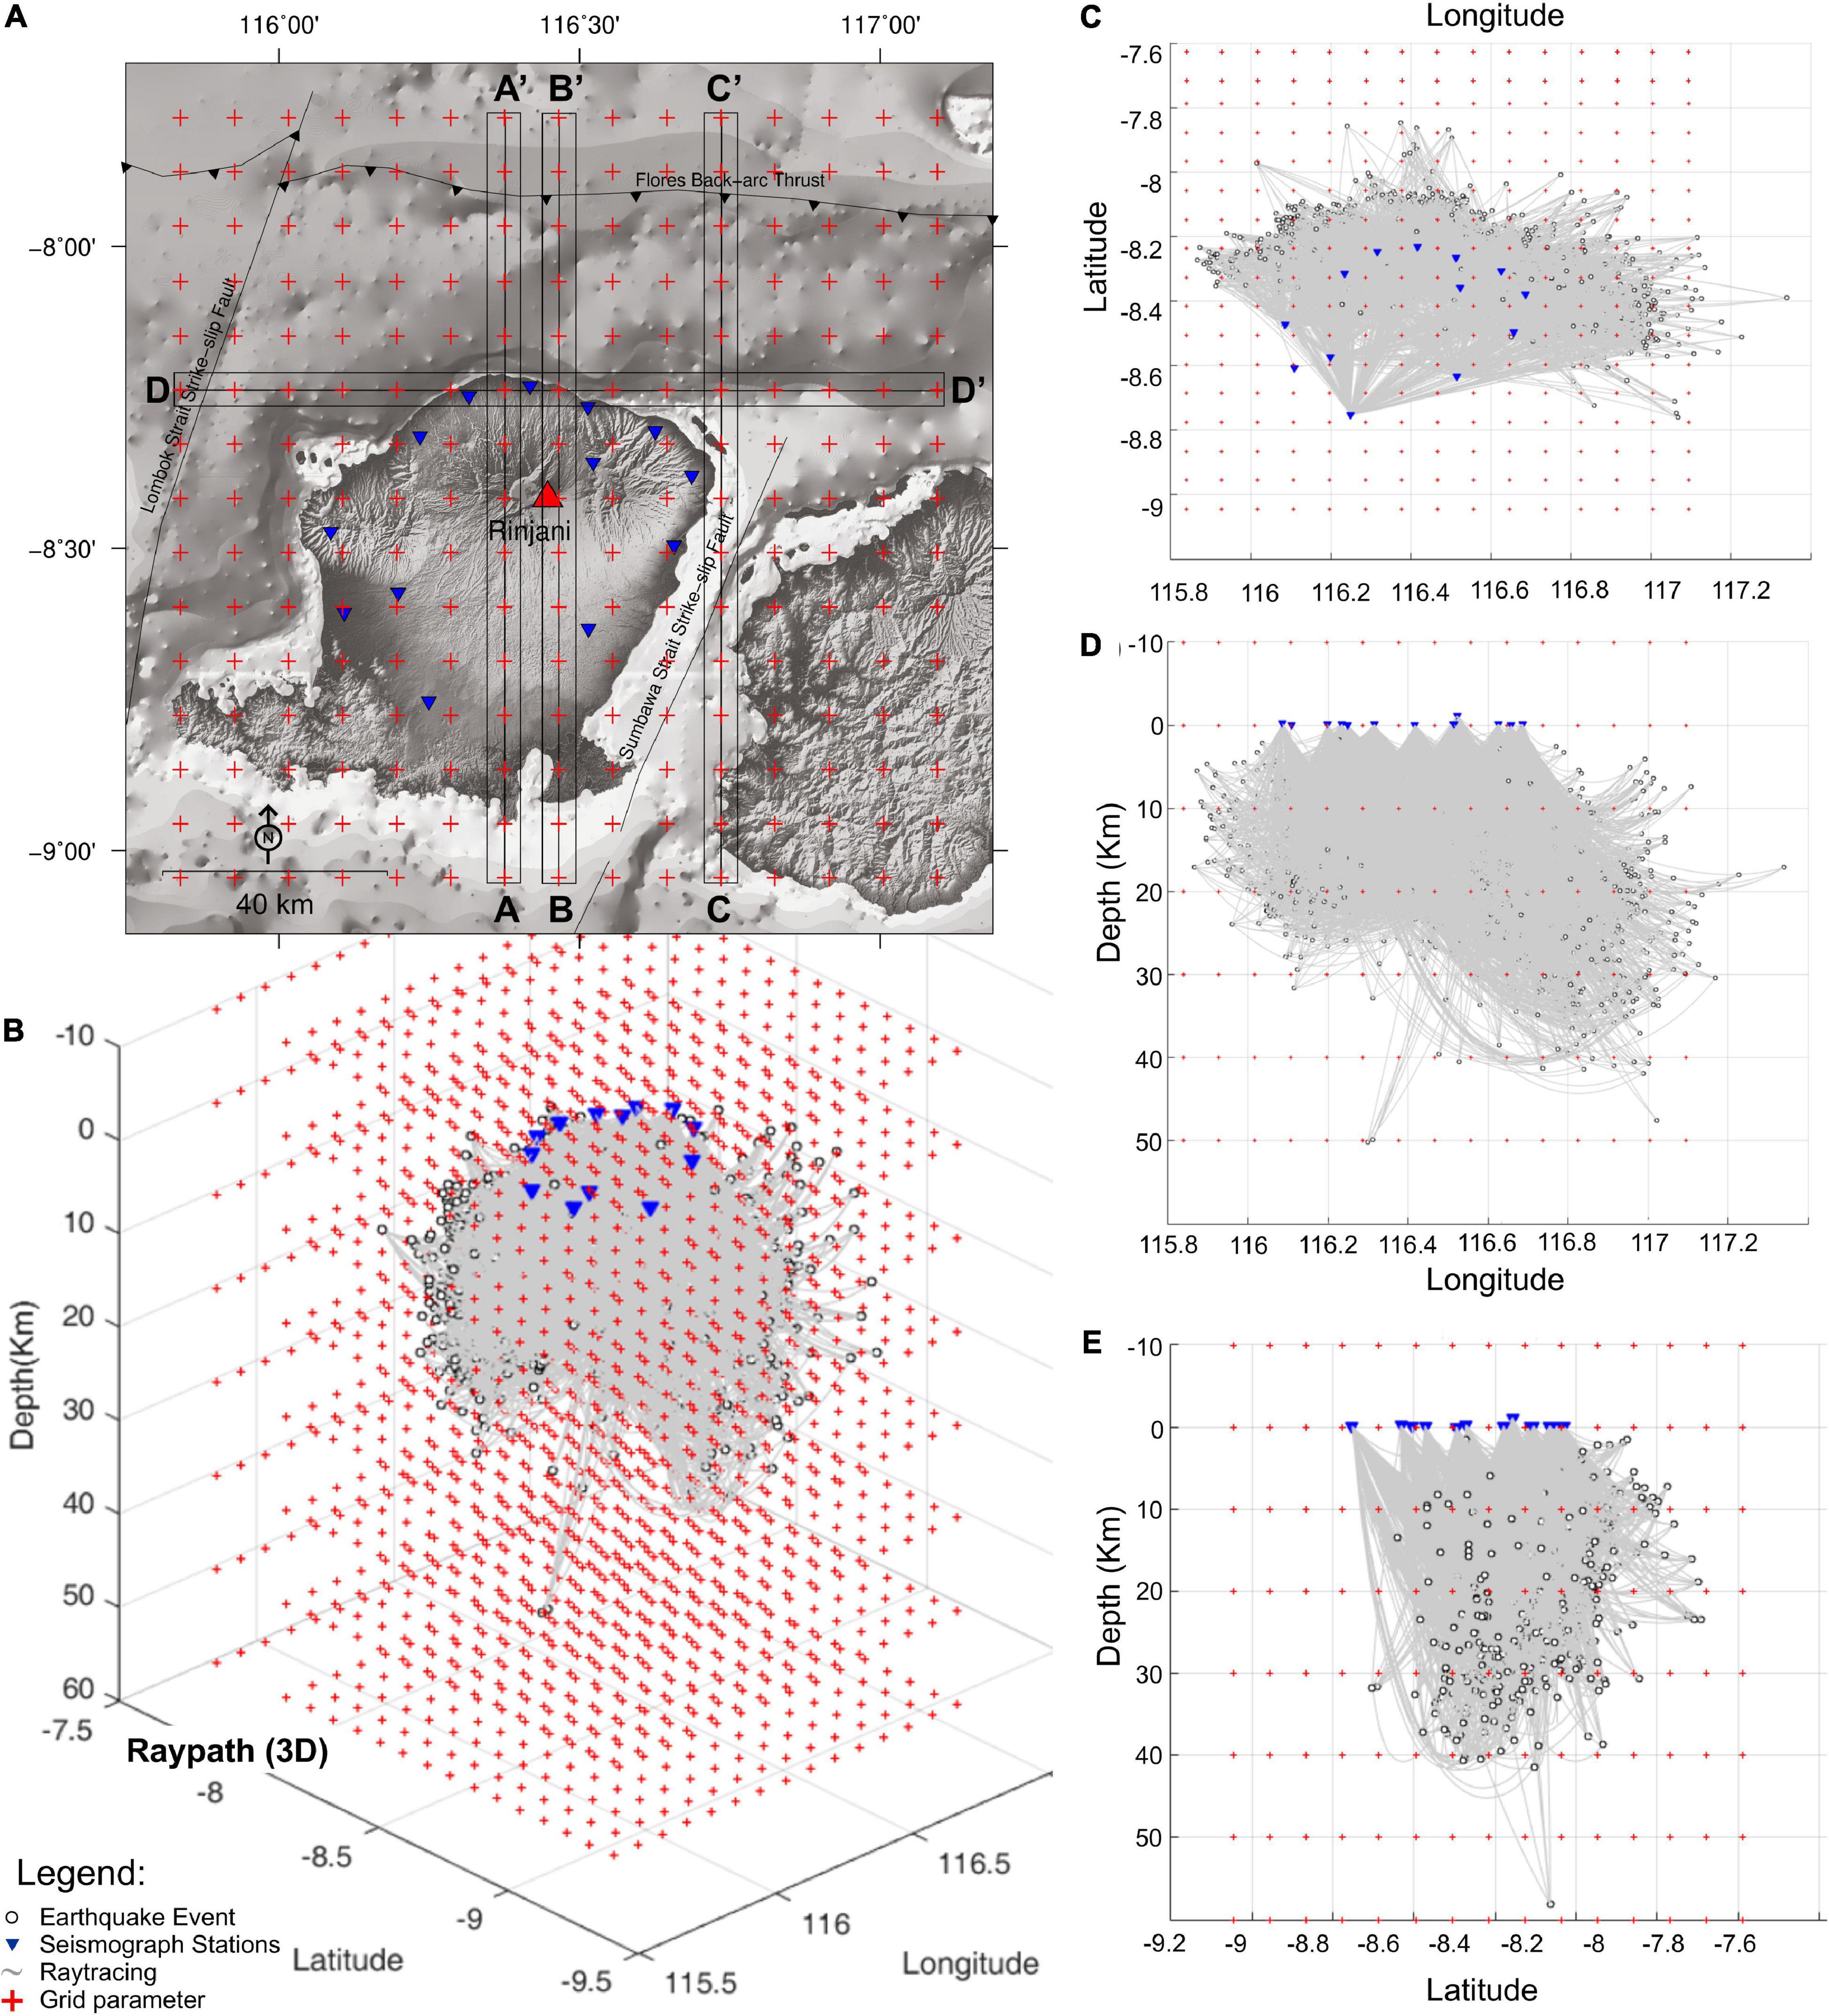
Figure 3. (A) The vertical cross-section positions (AA′, BB′, CC′, and DD′ lines) relative to grid node; the earthquakes plotted in the cross-sections are located within the areas indicated by the black rectangles (6 km in width); (B) the ray paths on 3D grid node; (C) the map view of ray paths; (D) the east-west cross-section of ray paths; (E) the northeast cross-section of ray paths. The inverted blue triangles indicate the stations; the gray lines indicate the ray paths; the open circles indicate hypocenters; the red plus marks indicate the grid nodes, the red triangle is the active volcano of Rinjani, the black lines are active faults, and the jagged black line is the FBT based on Irsyam et al. (2017).
Inversion usually depends on the initial models; hence, to obtain a robust Q_p model, we searched for an optimal homogenous 1D Q_p for the initial model. We ran a series of single-iteration inversions with Q_p values varying from 100 to 700 and chose Q_pwhich gives the minimum data misfit. As shown in Figure 4A, the Q_p value of 300 gives the minimum root-mean-square (RMS) of data misfit and the RMS varies from 0.01999 to 0.02628 s.
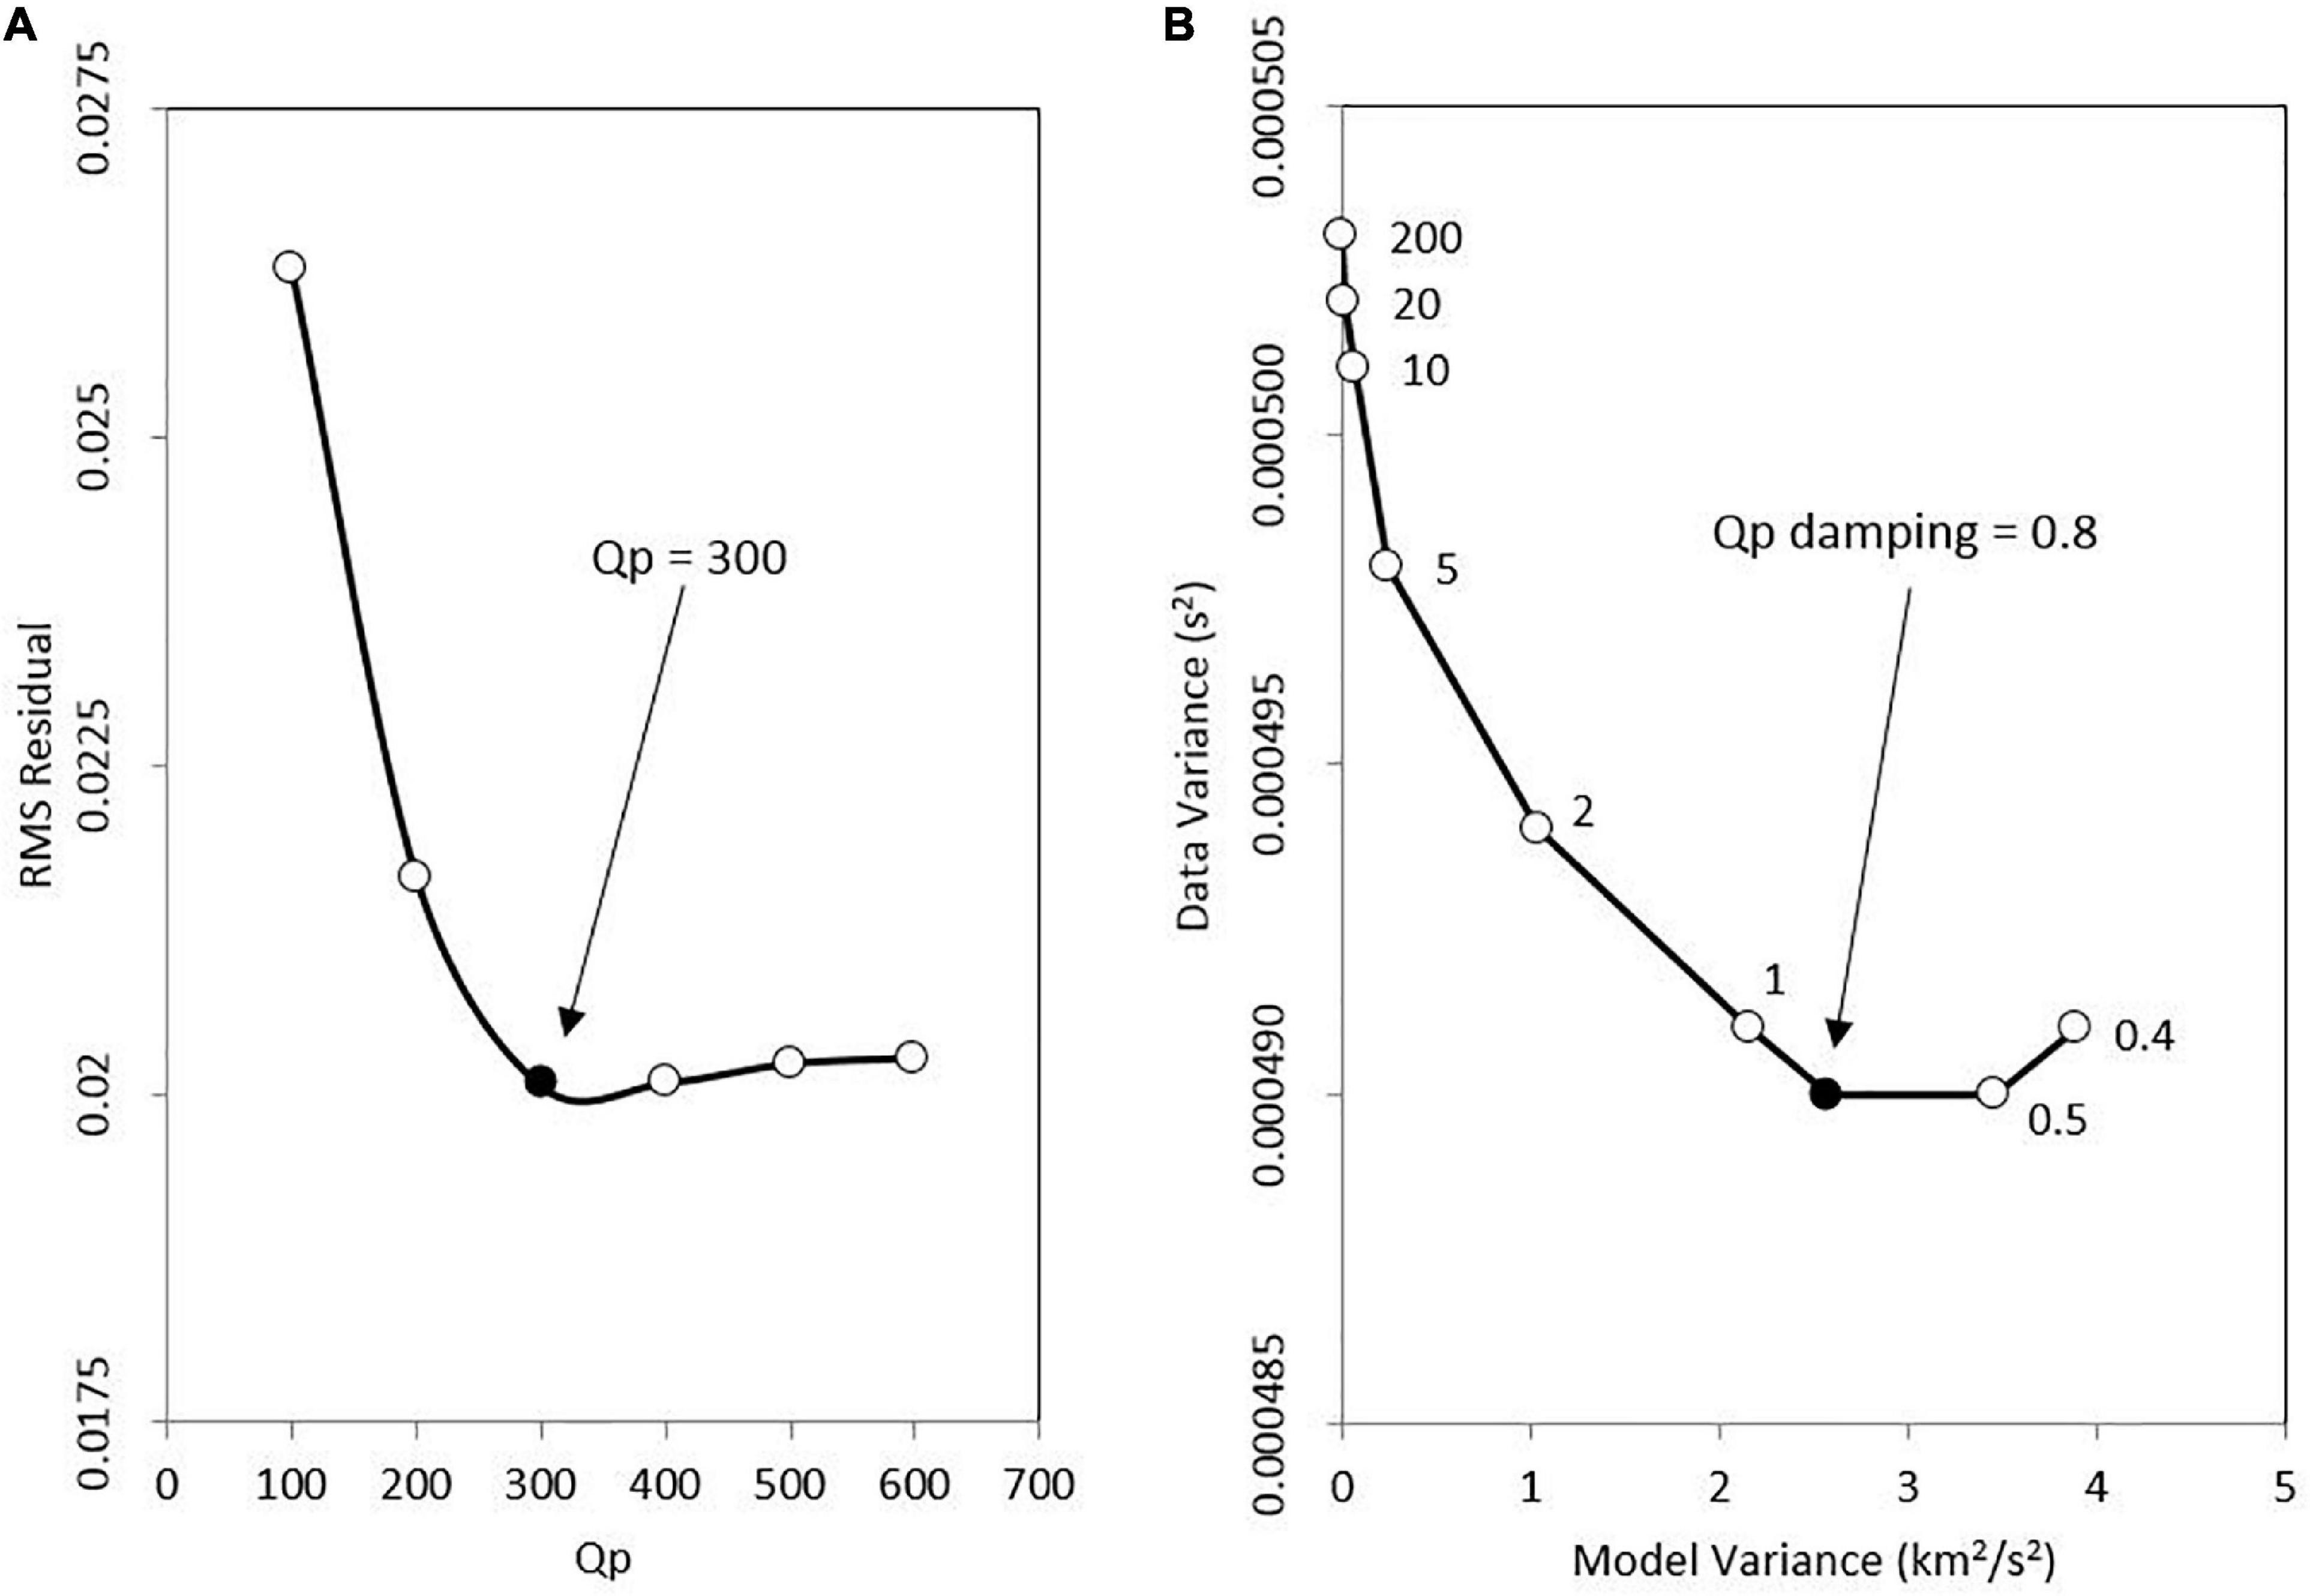
Figure 4. (A) Initial constant Qp determined by the RMS of the attenuation operator t∗ residual. The RMS reaches the minimum value at Qp = 300. (B) Trade-off curve between data misfit and model variance for attenuation inversion. The optimal damping parameter for Qp inversion is 0.8.
In a tomographic inversion, damping parameters are needed to define how quickly the perturbation of the model can change (Lanza et al., 2020). The optimum values were determined from a trade-off curve between model variance and data variance by running a series of iteration inversions with a broad range of damping values (0.4–200), shown in Figure 4B, similar to the approach applied to the velocity model inversion (Lin, 2014). The inversion results show that the damping parameter of 200 has a very low Q_p perturbation value (maximum perturbation of 0.1). At damping values 0.4 to 2, the results of the Q_p anomaly pattern are similar, but with different perturbation values. Our results show that the smaller the damping, the stronger the perturbation of Qp so that each pattern shows an increasingly intense color. For Q_p inversion here, we choose a damping parameter of 0.8 which produces an optimal compromise between minimizing the data variance versus increasing the model variance in the trade-off curve (Figure 4B). We also provide the Q_p inversion result using a damping parameter of 1 in the Supplementary Figure 1 which shows similar results to the damping parameter of 0.8.
Model Resolution
The quality of the Q model was evaluated using three different methods: Diagonal Resolution Elements (DRE) (Menke, 2018), Derivative Weight Sum (DWS) (Toomey and Foulger, 1989), and Ray Hit Count (RHC), which are calculated during the inversion. The DWS measures the ray coverage of the data by estimating the total ray length that samples a node. The DRE provides a better estimation of the model resolution for each node since it measures the relative contribution of the hypothetical “true” model value to the estimated value. The best solution corresponds to a DRE value of 1; whereas, zero represents no resolution.
The quality of model resolution is shown by horizontal and vertical cross-sections which depict well-resolved parts of the study area. Figures 5, 6 show all three-resolution models. DRE for each profile has a range for values 0–0.8, while RHC has a range of values 0–2000, and DWS has a range of values between 0 and 900,000. We determined the well-resolved area quantitatively with the DRE value >0.1 (Lanza et al., 2020) bounded by the dashed line. All the resolution tests show that the area with good quality is located at 0 km down to a depth of 20 km where the largest well-resolved area appears at a depth of 10 km (Figure 5). However, at depth of 30 km, we observed that in the northwest area the DRE, DWS, and RHC still give resolution due to the deeper earthquake depth.
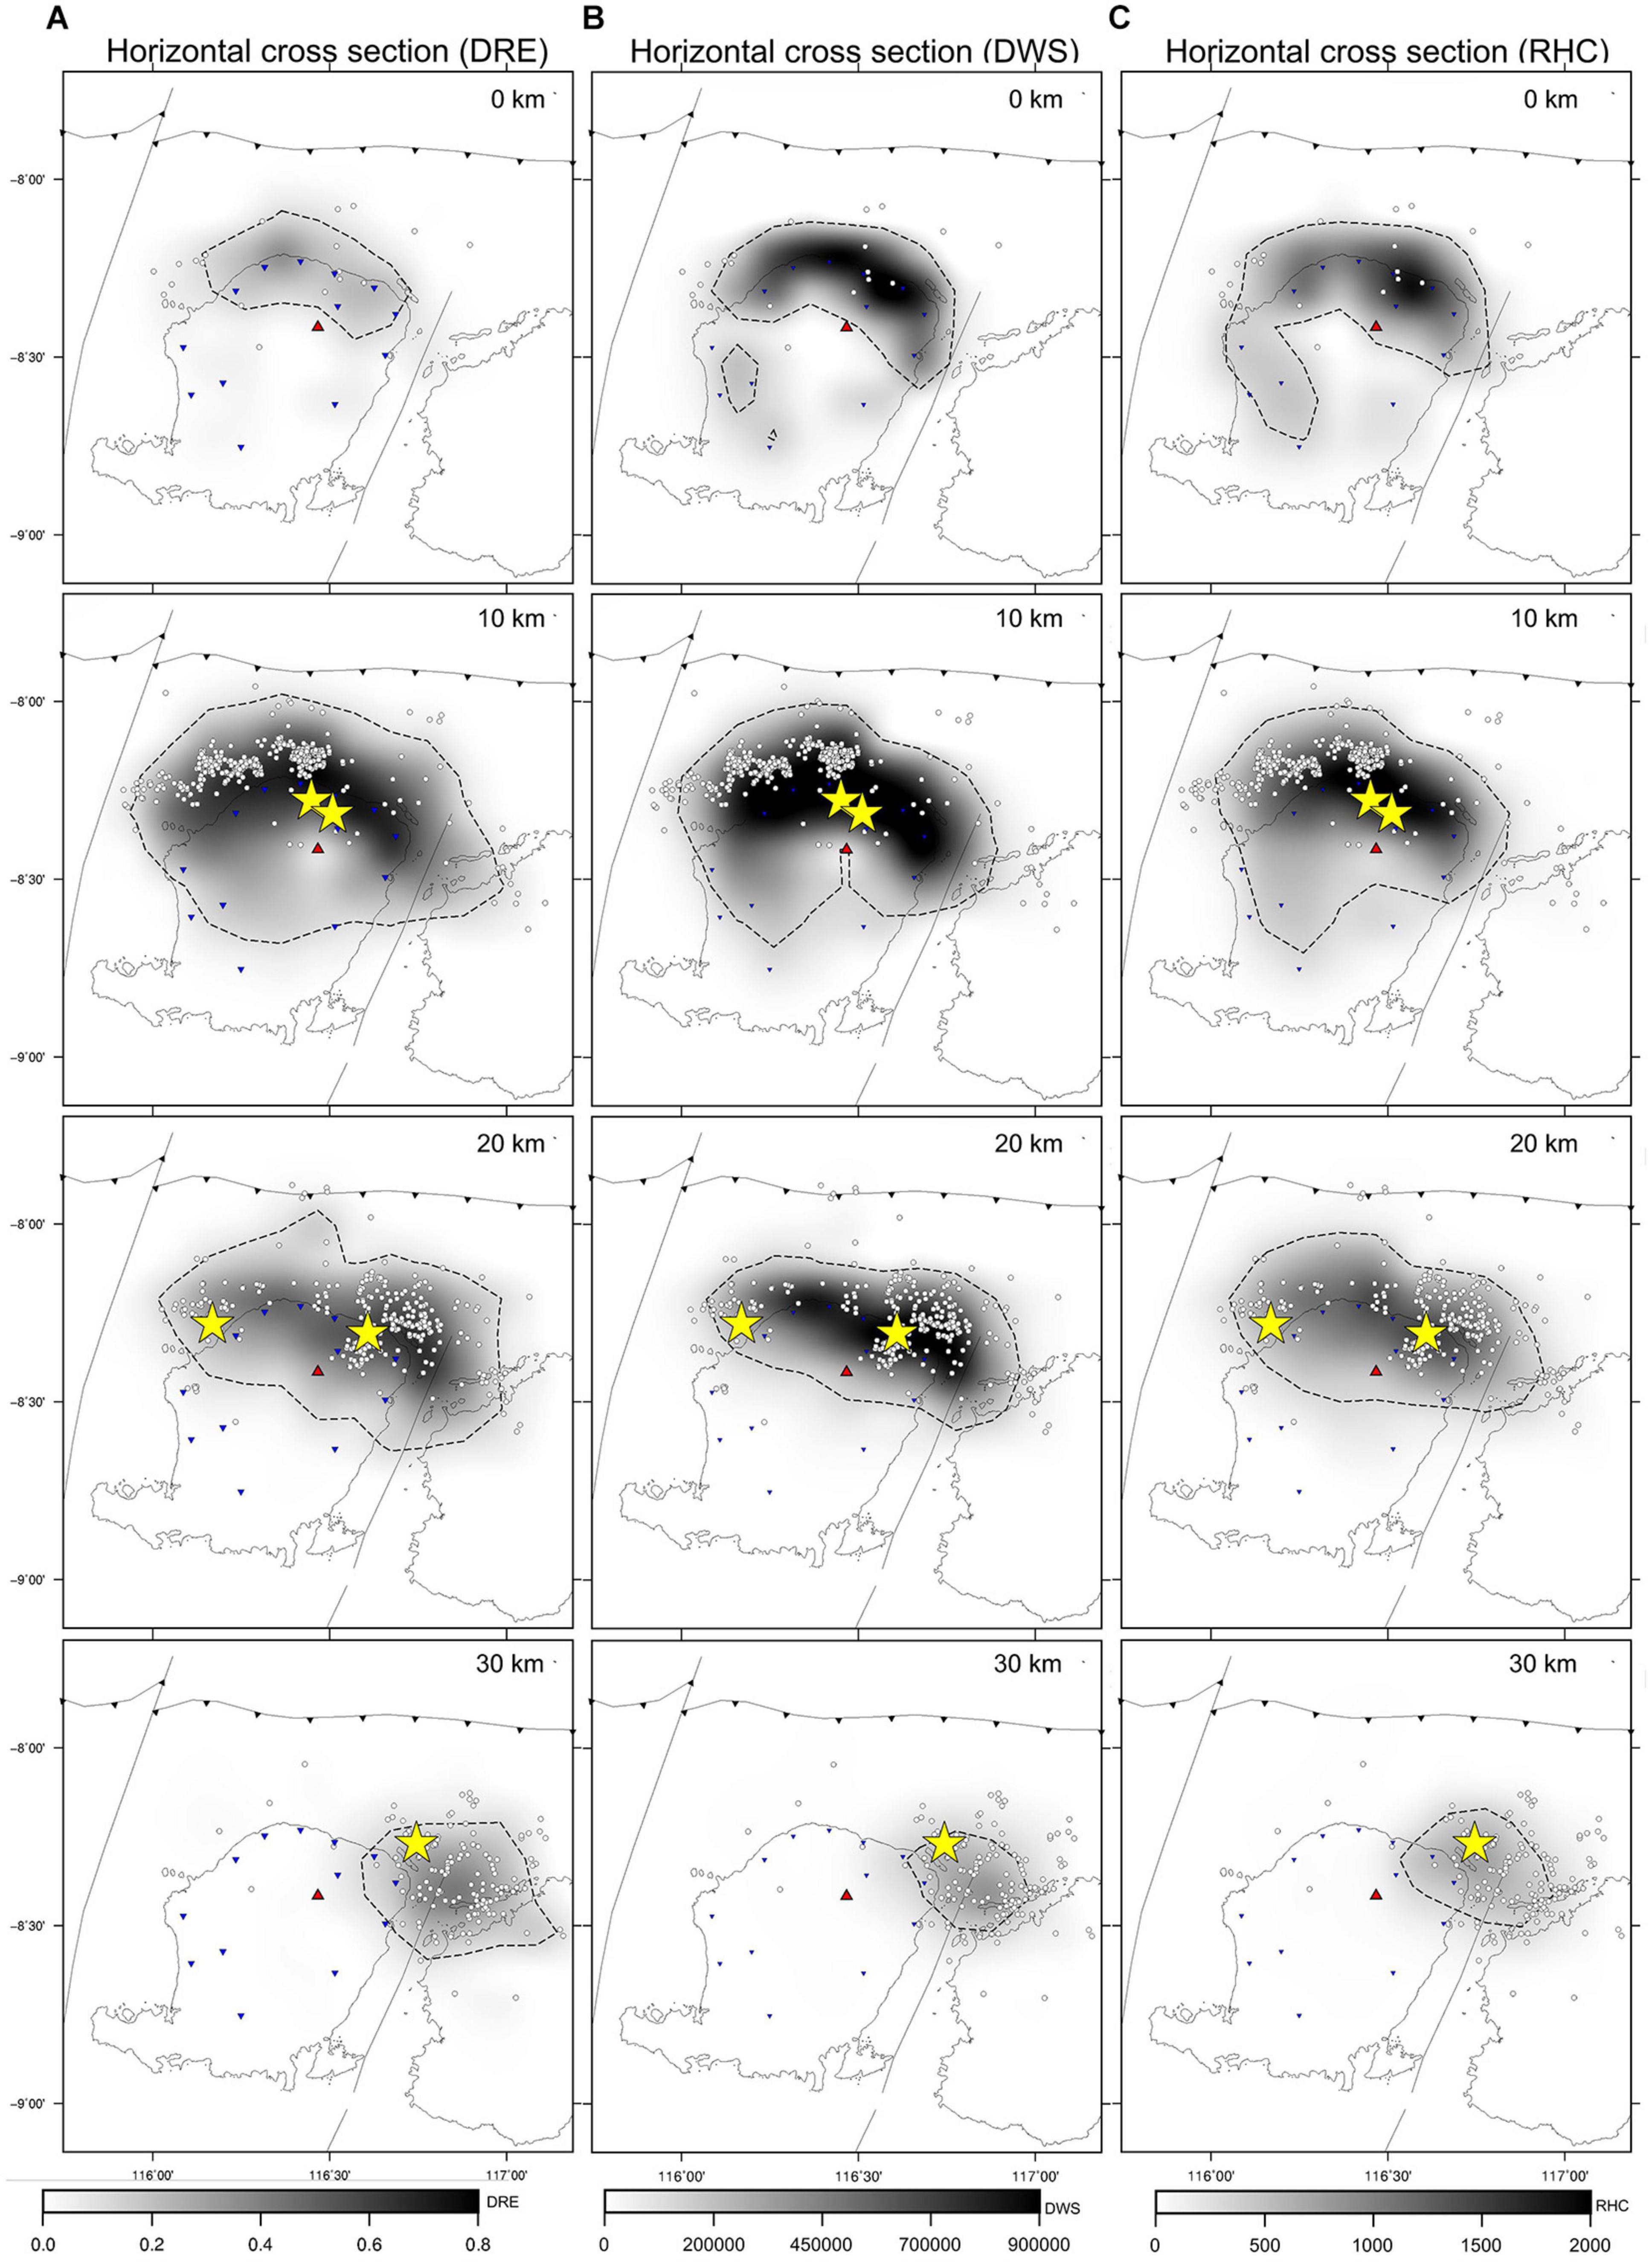
Figure 5. Horizontal slice at 0, 10, 20, and 30 km depth for (A) Diagonal Resolution Element (DRE), (B) Derivative Weight Sum (DWS), and (C) Ray Hit Count (RHC) of Qp. Black and white colors indicate high and low values; white circles are the hypocenters.
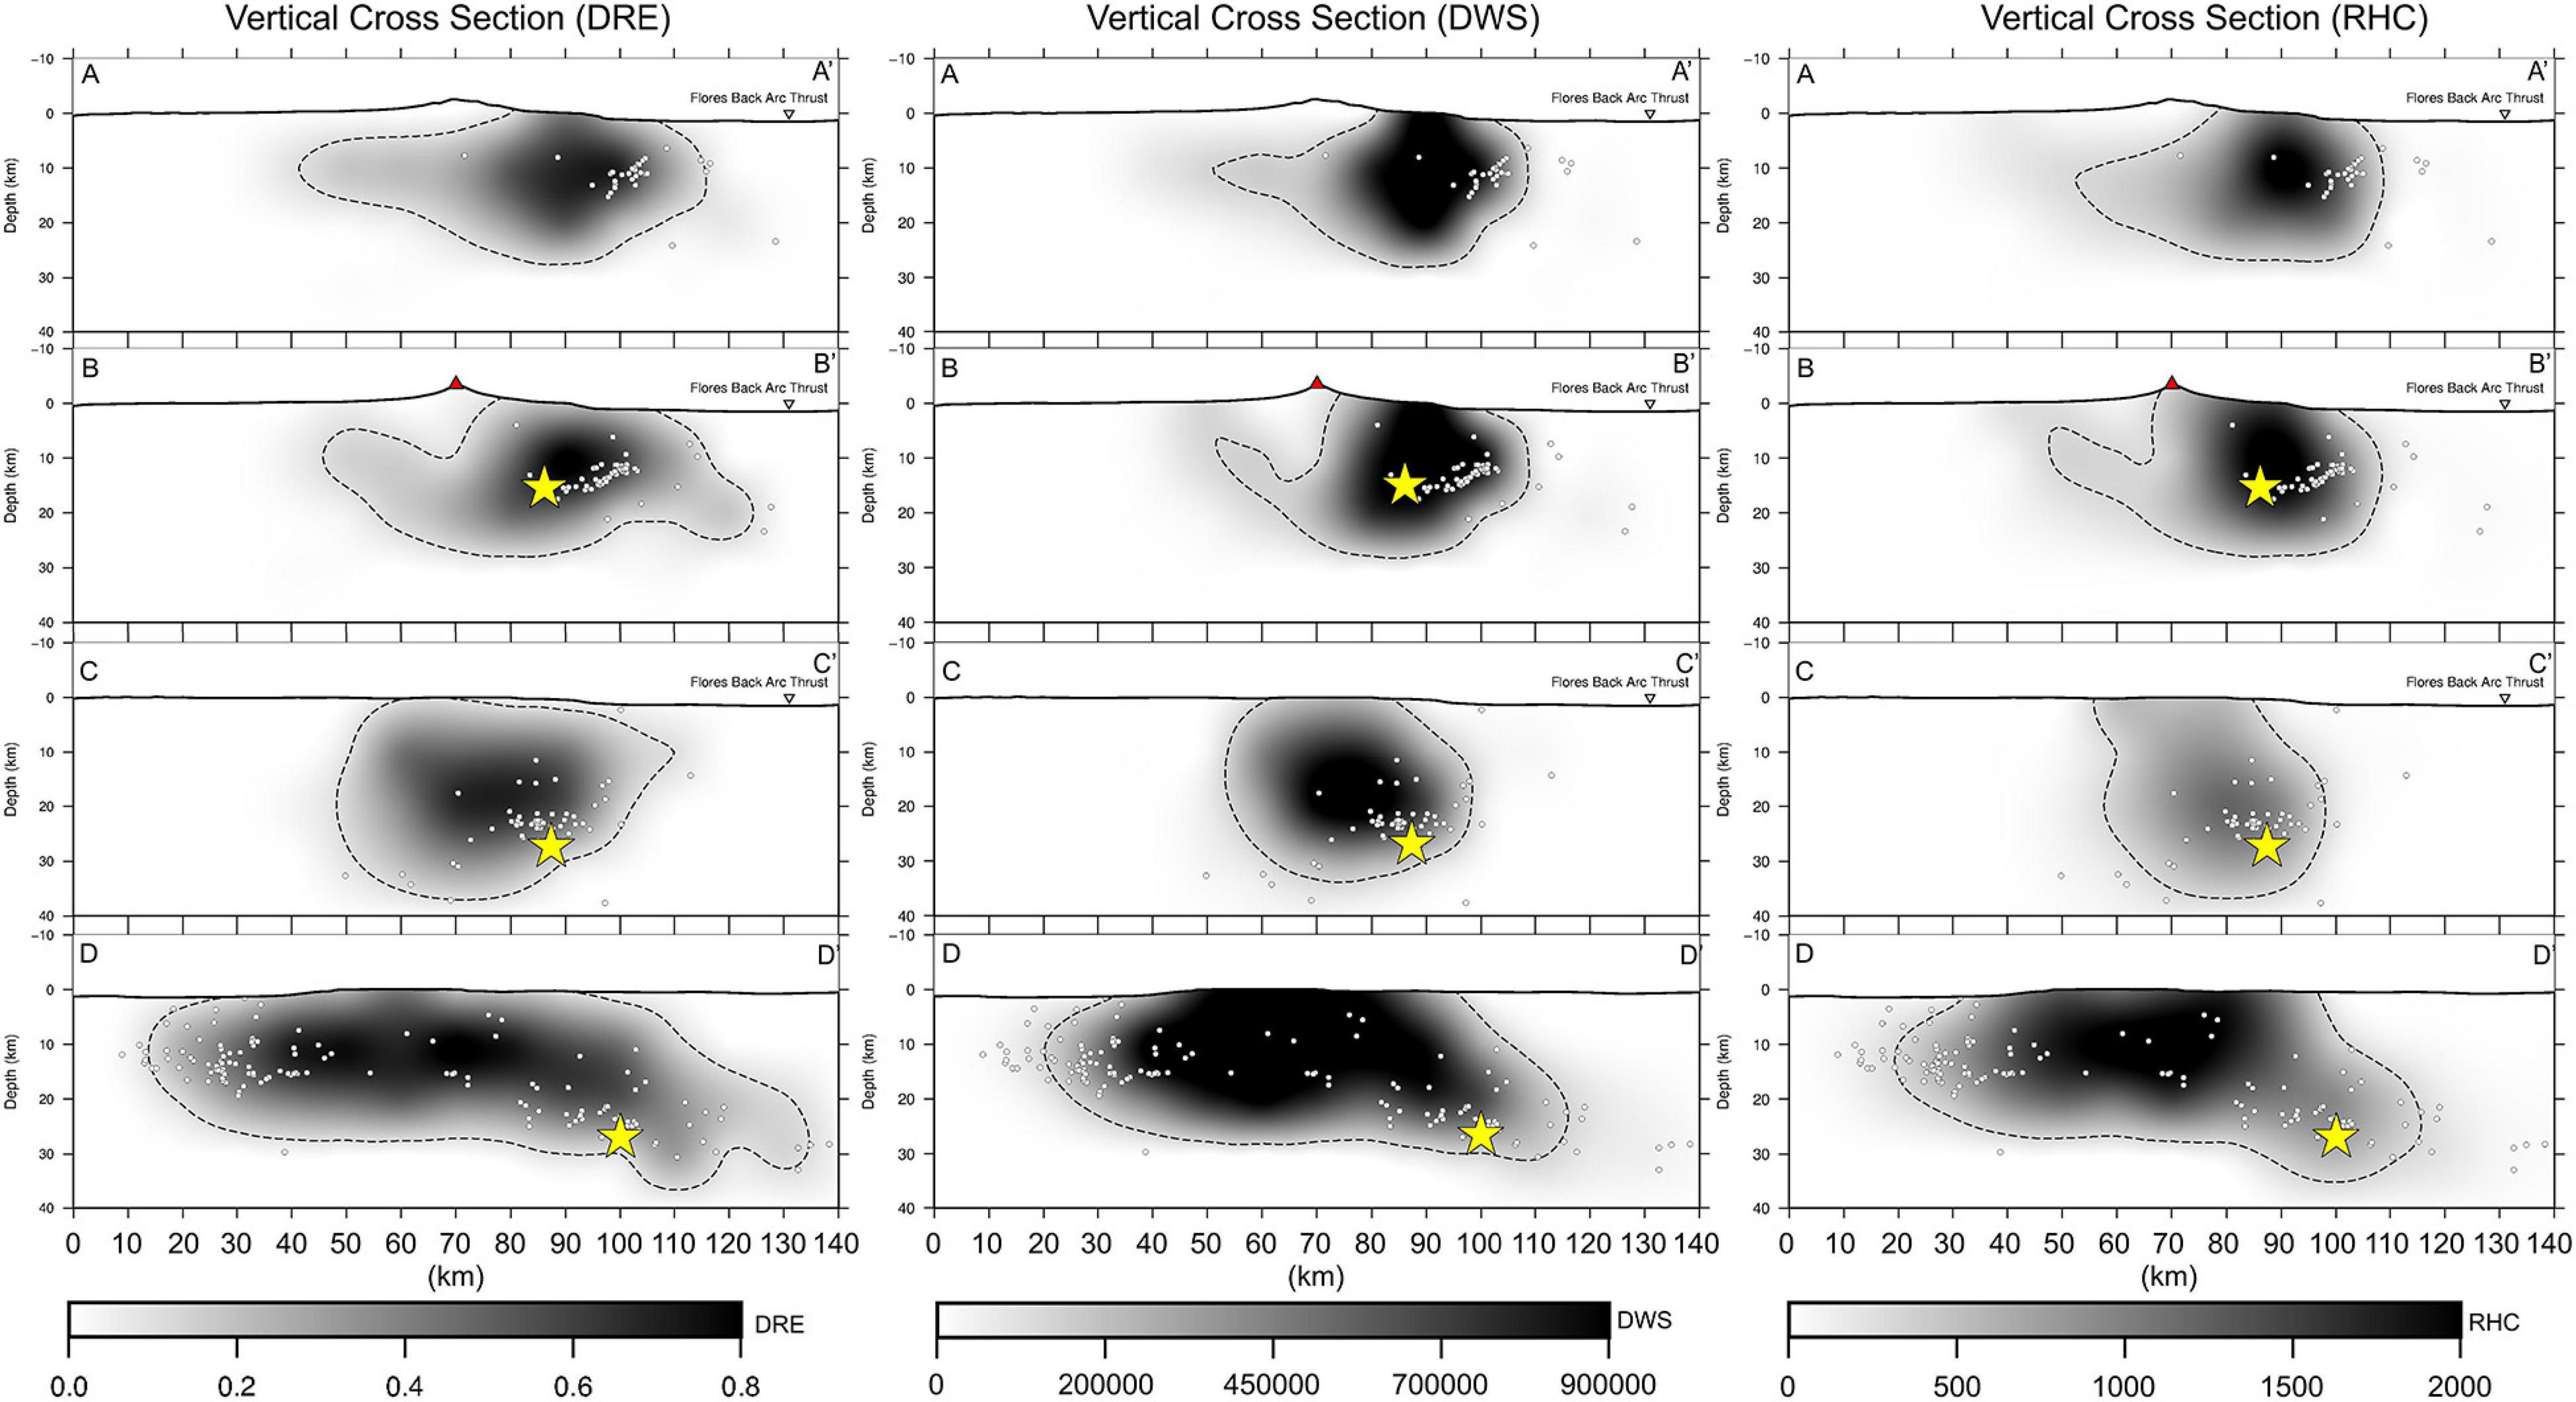
Figure 6. Resolution test results along cross-sections AA′, BB′, CC′ to DD′ (see Figure 3A) of the Diagonal Resolution Element (DRE), Derivative Weight Sum (DWS) and, Ray Hit Count (RHC) for Qp. Black and white colors indicate high and low values; white circles are the hypocenters.
Results and Discussion
The tomographic attenuation results are shown in Figure 7 for the horizontal map at different depths and Figure 8 for the vertical cross-sections (AA′, BB′, CC′ to DD′ marked in Figure 3A). In these figures, P-wave velocity (Vp) is plotted as percent velocity perturbation relative to the 1D initial velocity model, Vp/Vs are plotted as absolute values, and Qp is plotted as an absolute value. The blue and red colors represent the higher and lower values, respectively, for the Vp, Vp/Vs, and Qp. The results of the data analysis and the model resolution quality (Figures 5, 6) show a good resolution structure in some regions of Lombok Island and around the Rinjani volcano.
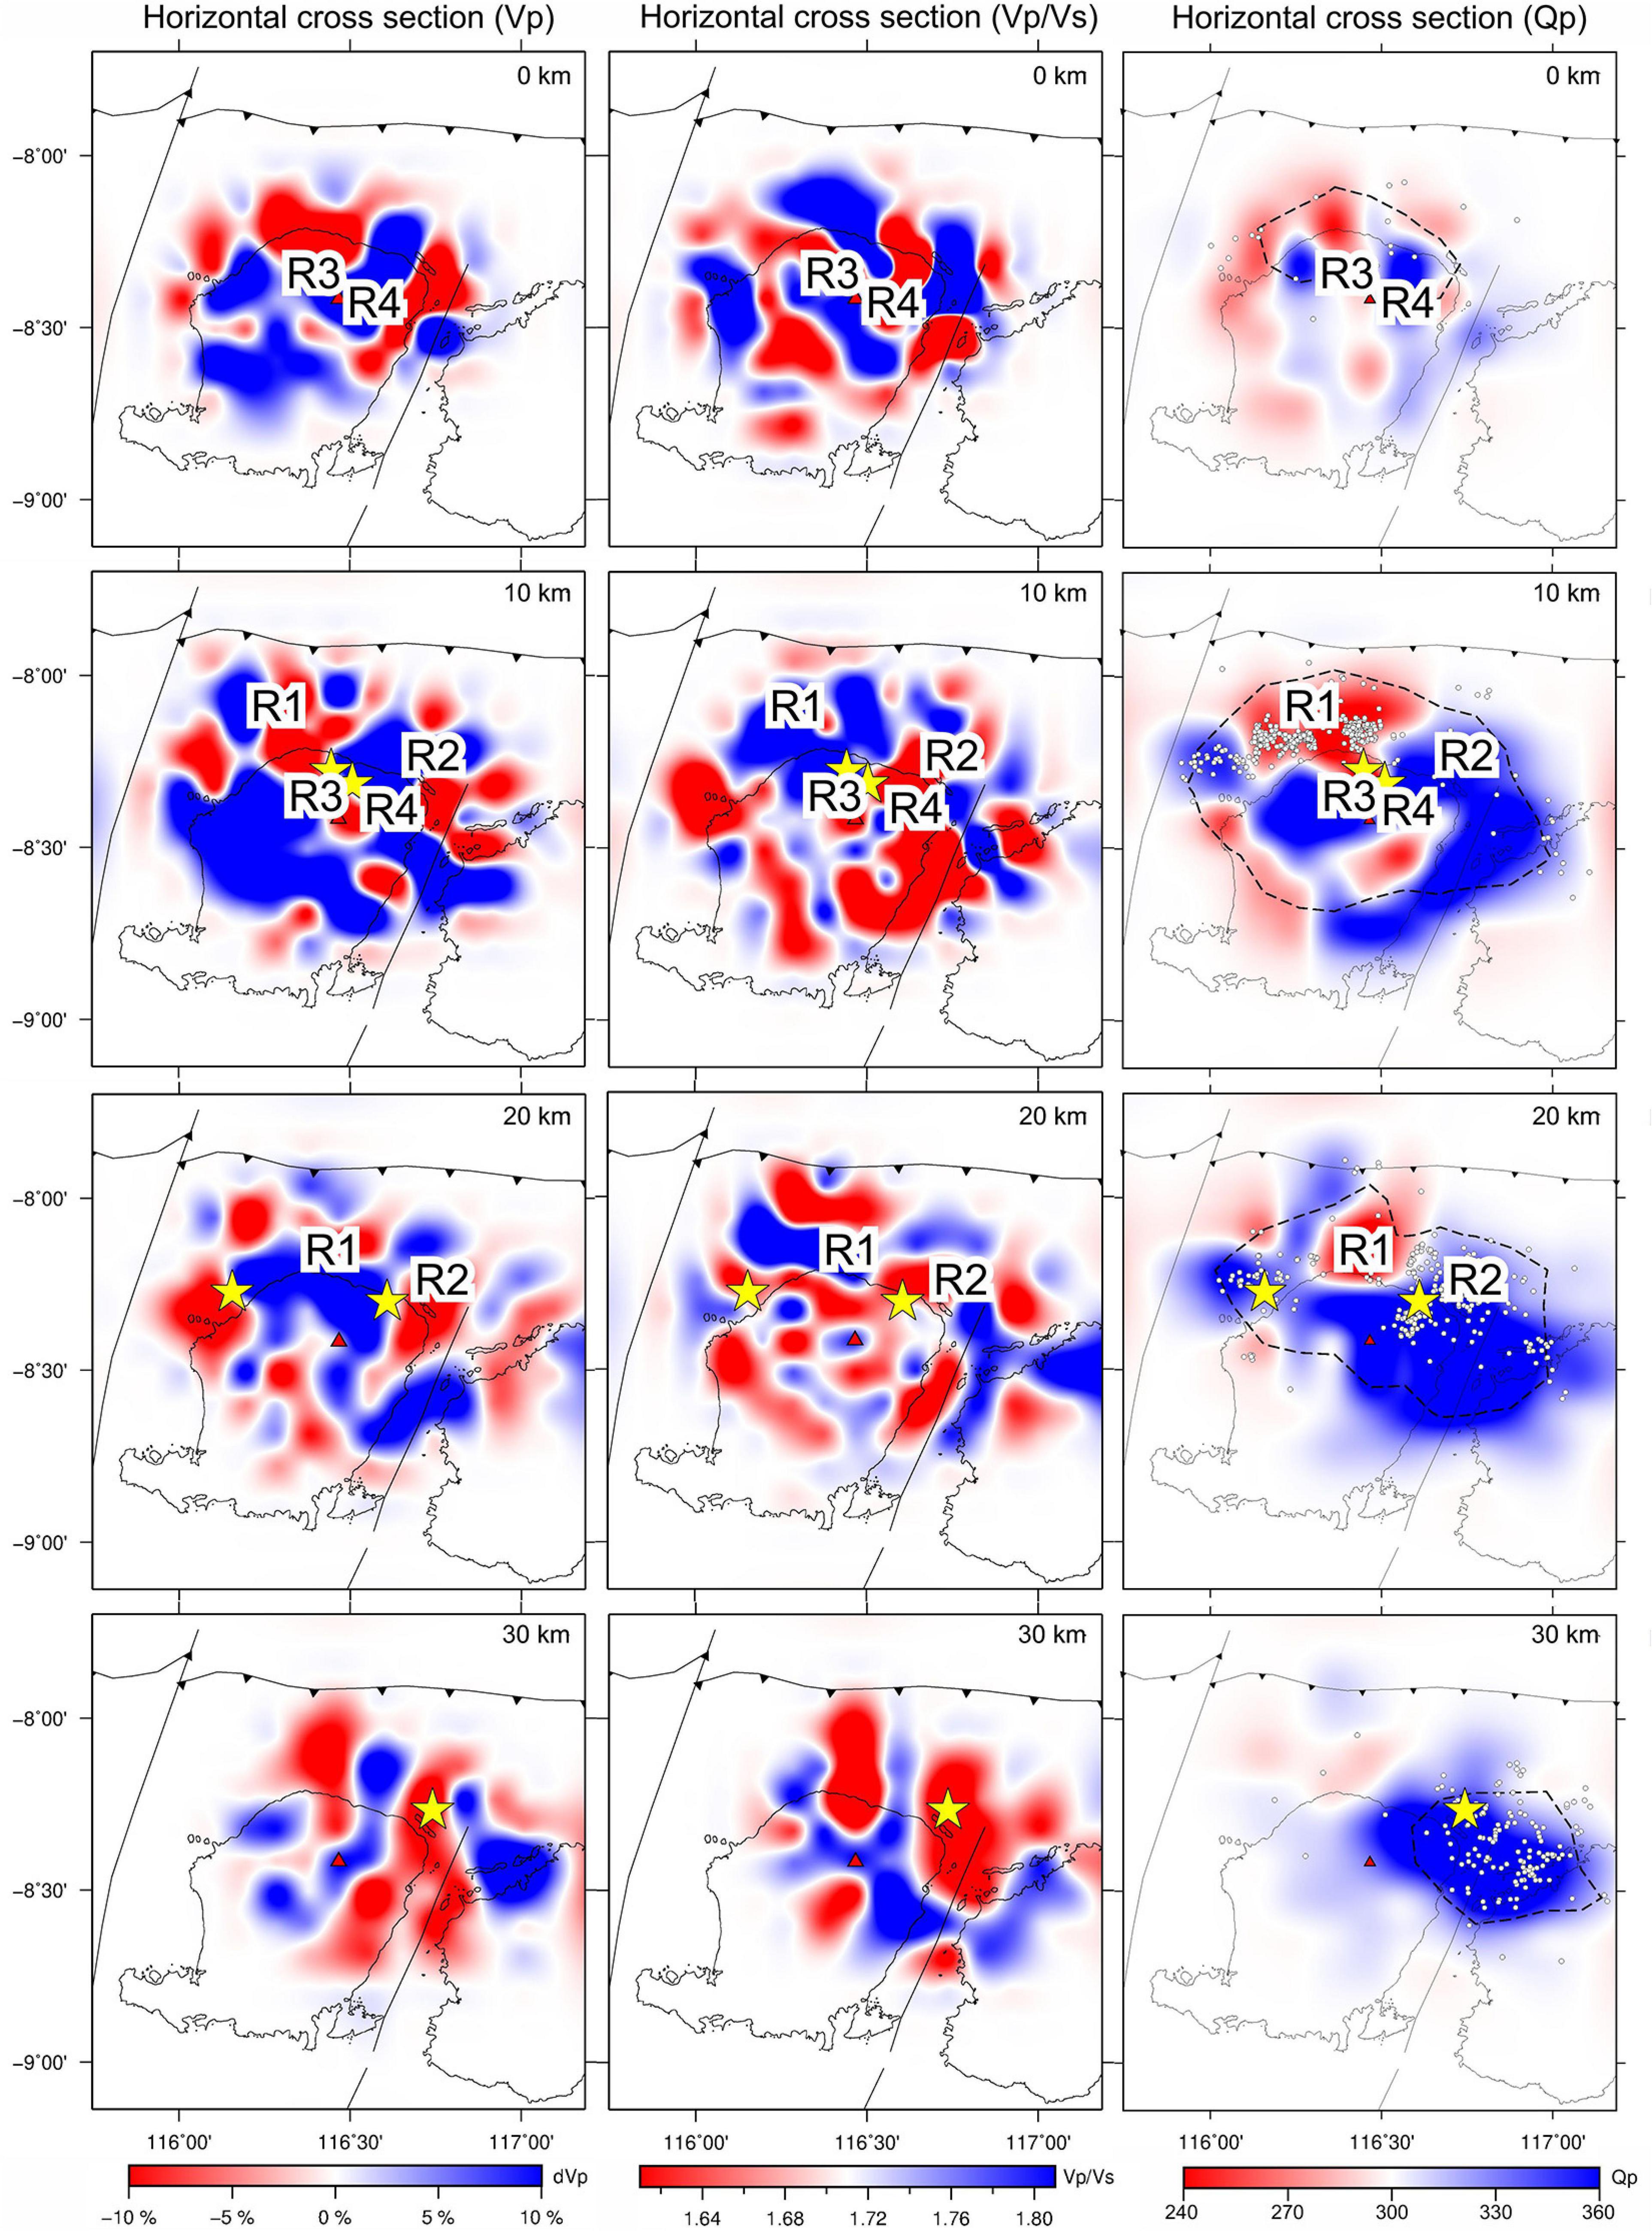
Figure 7. Depth slices showing seismic velocity structure Vp (first column) and Vp/Vs ratio (middle column) from Afif et al. (2020), and Qp (right column) at depth of 0, 10, 20, and 30 km. The color bar shows the variations in Vp, Vp/Vs, and Qp. The Vp are plotted as percent perturbations relative to the 1D initial velocity model, and Vp/Vs are plotted as an absolute value. Blue and red colors represent higher and lower values. The black dashed line in the Qp tomogram indicates well-resolved areas based on DRE (>0.1). The yellow stars represent the hypocenters of the significant event; white dots indicate aftershock hypocenters; the red triangle is the Rinjani volcano. The captions listing R1, R2, R3, and R4 are the regions interpreted in this work.
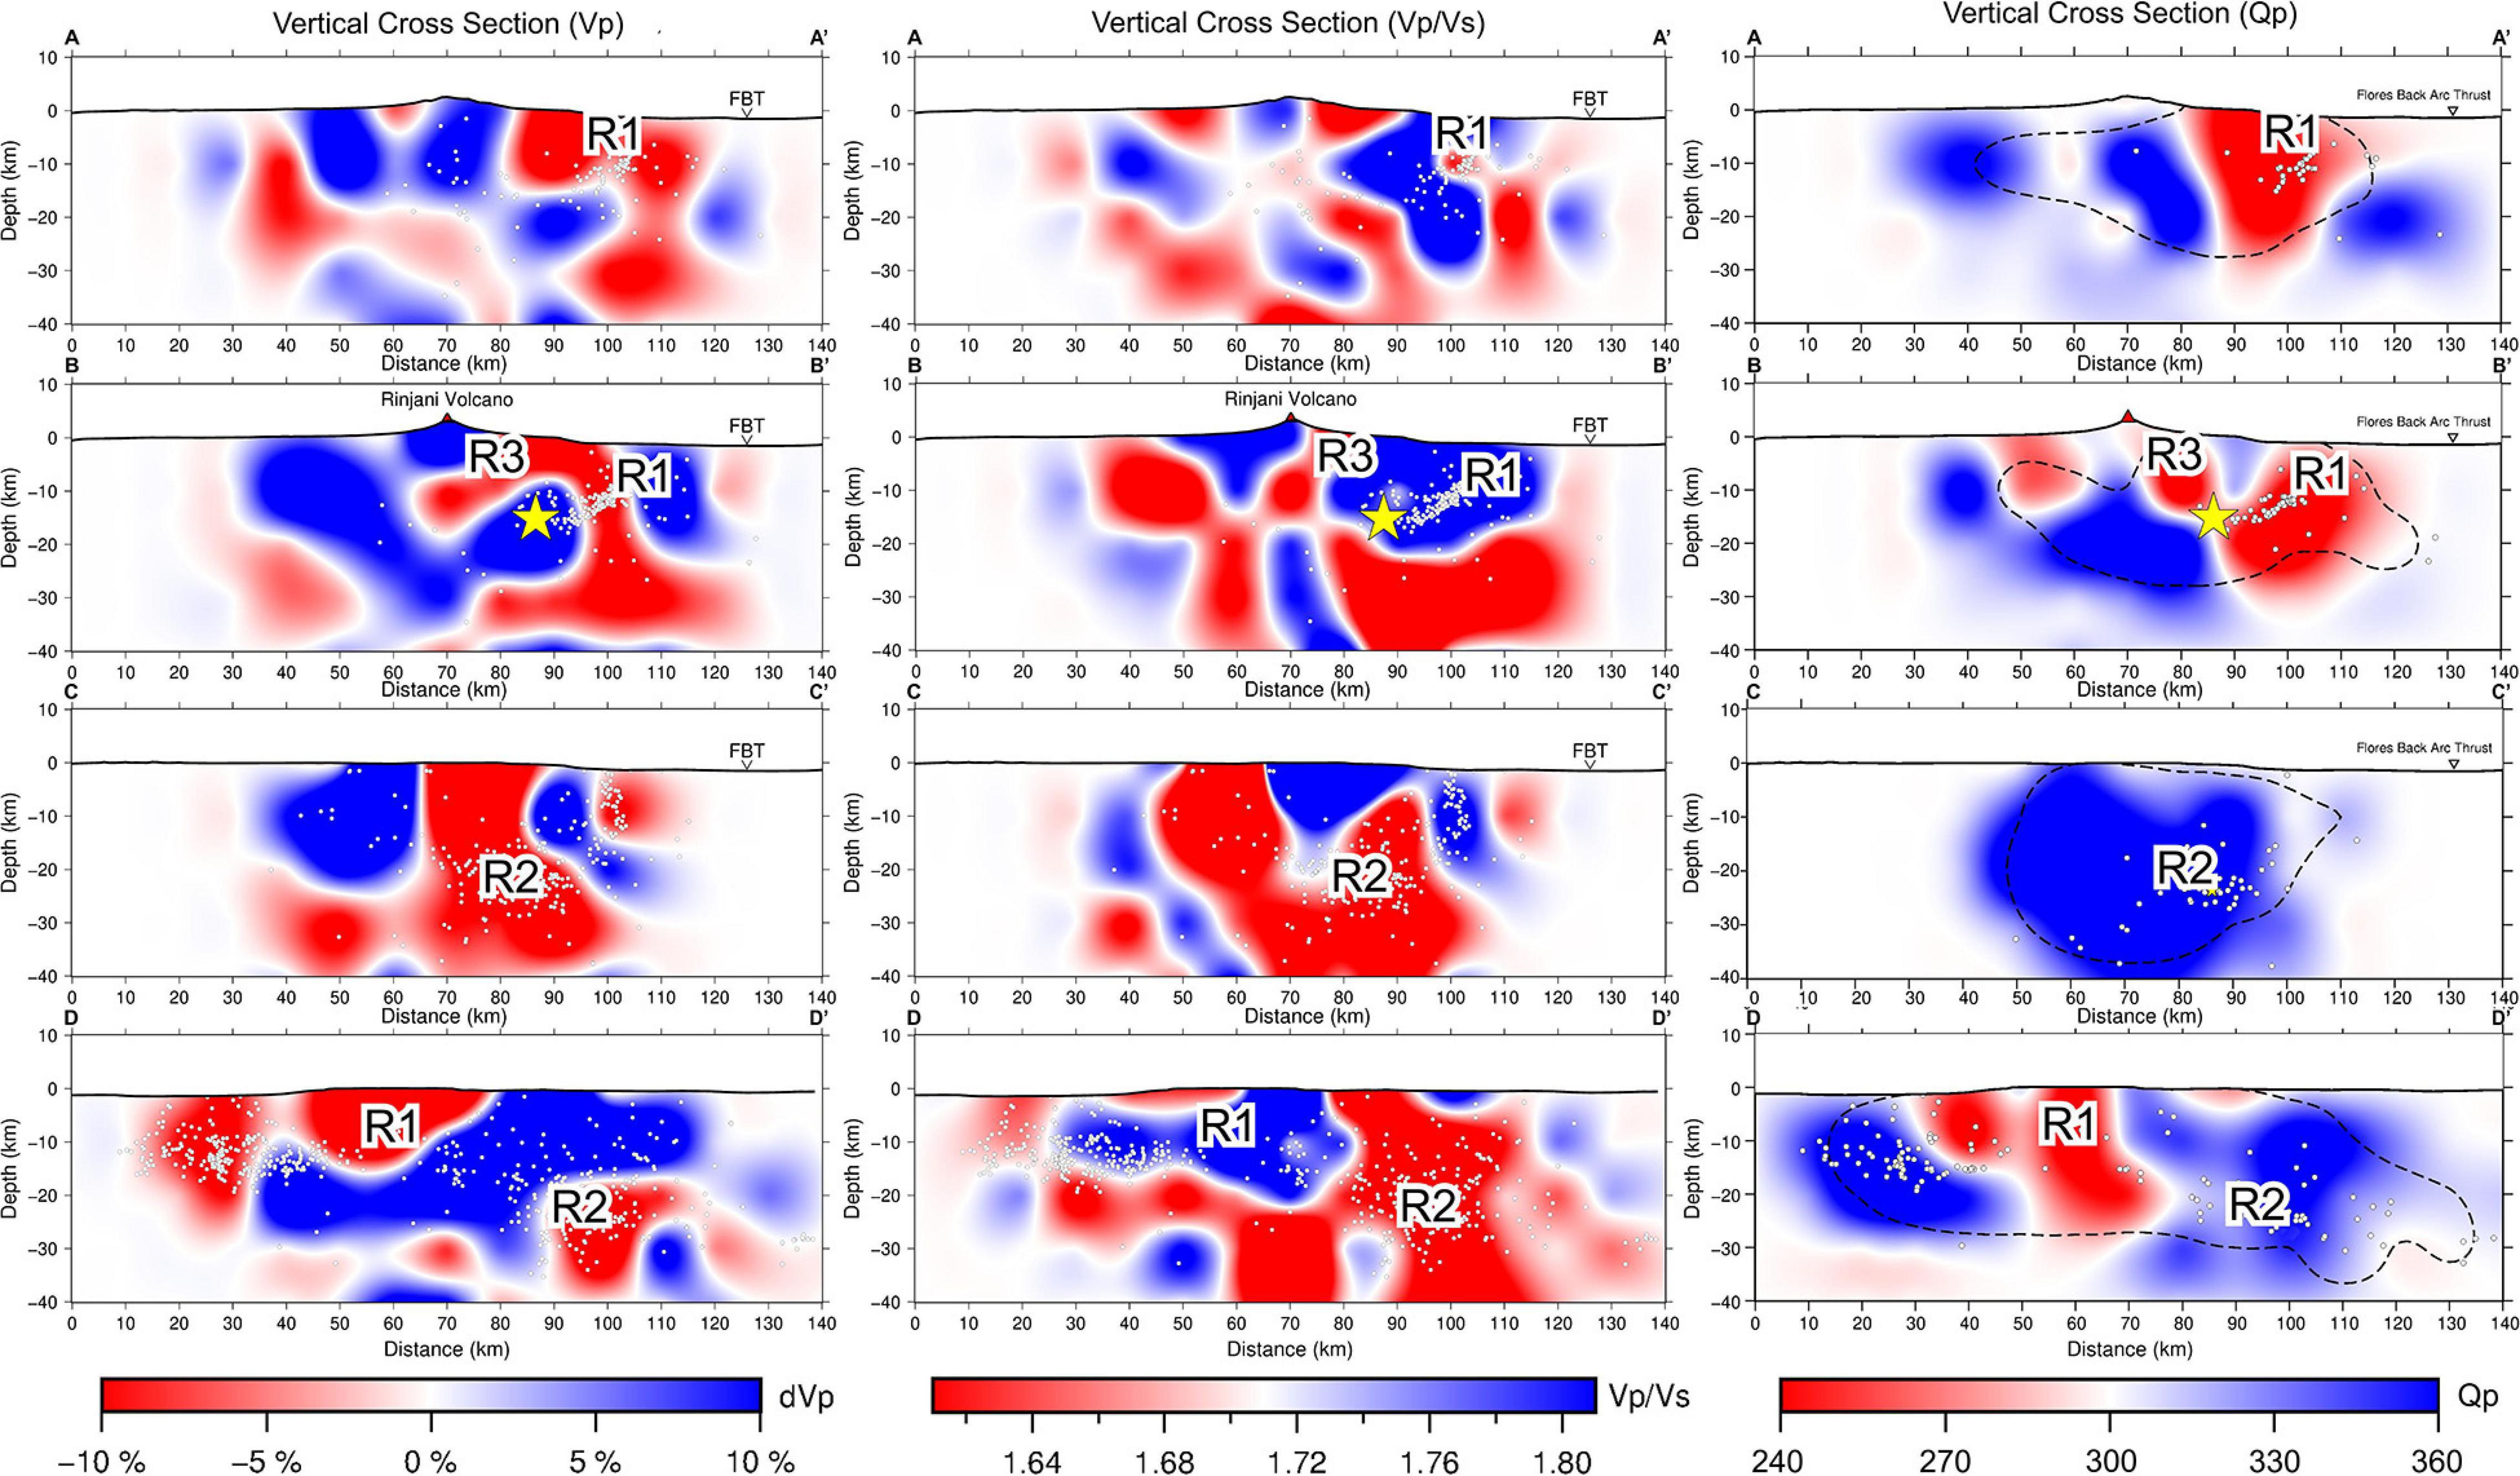
Figure 8. The vertical cross-sections AA′, BB′, CC′ to DD′ (see Figure 3A), which show the seismic velocity structure for Vp (left column), Vp/Vs ratio (middle column), from Afif et al. (2020) and Qp (right column). The color bar shows the variations in Vp, Vp/Vs, and Qp. Vp plotted as percent perturbation relative to the 1D initial velocity model and Vp/Vs and Qp are plotted as absolute values. The blue and red colors represent higher and lower values. The black dashed line in the Qp tomogram indicates the well-resolved area based on DRE (>0.1). The white dots indicate the locations of hypocenters with a radius of 3 km from the centerline. The yellow stars represent the hypocenters of the significant events. The captions listing R1, R2, R3, and R4 are the regions interpreted in this work.
From the tomographic results and the hypocenters location, we observe four interesting anomalies (R1–R4 as shown in Figures 7, 8) that we consider to be the most significant with acceptable resolution.
1. R1 in the northwest part of the island parallel to FBT which coincides with the southward dipping aftershock cluster (section AA′-BB′). This region is characterized by low P-wave quality factor (low-Qp) (∼ 250 to 270), low-Vp (∼−6 to −10%), and high-Vp/Vs (∼ 1.78 to 1.81).
2. R2 in the northeast part of the island (section CC′–DD′). R2 is characterized by high-Qp (∼350), low-Vp (∼−8 to −10%), and low-Vp/Vs (∼ 1.60 to 1.64). The seismicity in this region corresponds to the August 19, 2018 mainshock and the following aftershocks with a deeper depth than most of the events in R1.
3. R3 in the north of Rinjani volcano at a depth ∼0–15 km (section BB′). This region is characterized by low-Qp (∼230), low-Vp (∼−6 to −10%), and high-Vp/Vs (∼ 1.78 to 1.80). We observe only a few events that occur in this region.
4. R4 in the area northeast flank of Rinjani volcano at a depth ∼0–20 km (Figure 7) which has high-Qp (∼340), high-Vp (∼ 7 to 10%), and low-Vp/Vs (1.60 to 1.64) values.
In order to interpret the velocity and attenuation tomography of the island of Lombok, a wide range of physical properties must be considered. In this region, we not only observe the subduction of the Indo-Australian plate in the south, but also the subduction of FOC beneath the Lombok Island which causes back-arc thrust faults in the north. Not far from the thrust faults zone (∼ 50 km), there is also the Rinjani volcano which is still active today. These geological settings cause the crustal conditions in this area to be unique and complex. Besides typical fractured and saturated rocks, there may be zones of partial melt with various melt percentages, accumulations of magma with various sizes, zones of hydrothermal alteration, zones with dense fracture, zones with high temperature, or other possibilities. Each of these crustal conditions has its own effect on seismic wave propagation. In general, a low-Qp together with high Vp/Vs anomaly have been interpreted as the existence of high temperature, partial melting, magma, or increase in fracture concentration in saturated rock (Sanders et al., 1995).
Many studies that examined the relationship between seismic wave properties and temperature at both high and low frequencies show similar results where the velocity and Q of seismic waves decrease with increasing temperature (Mizutani and Kanamori, 1964; Murase and McBirney, 1973; Kampfmann and Berckhemer, 1985; Christensen and Wepfer, 1989). Murase and McBirney (1973) measured rock properties on four igneous rocks (basalt, andesite, rhyolite, and tholeiite) over a range of temperatures including their melting interval at 100 kHz. They found that Vp decreased by about 50% and Qp decreased continuously from about 3000 to less than 10 from the solid temperature to melting temperature. Mizutani and Kanamori (1964) measured the physical properties of metal alloy and also found that Qp was about 90% lower in liquid compared to solid alloy.
The presence of fractures or pores in dry rock causes Vp and Vs to decrease where the reduction in Vp is greater than Vs so that Vp/Vs decreases (O’Connell and Budiansky, 1974). However, in saturated rock conditions, the existence of these fractures and pores will result in a decrease in Vp and Vs where the decrease in Vs is greater, hence, Vp/Vs becomes high (O’Connell and Budiansky, 1974; Moos and Zoback, 1983). Laboratory experiments by Mavko and Nur (1979) show that small amounts of water in fractured rocks can significantly increase attenuation. They also found that the low aspect ratio (i.e., flat) will cause relatively greater attenuation than more spheroidal porosity, therefore fractures have a relatively greater effect than pores.
Attenuation in the Source Area
The aftershock pattern of the 2018 Lombok earthquake could be divided into two clusters: the northwest cluster shallower than 20 km; the events of July 29, August 5, and August 9, 2018, took place in this area; and the northeast cluster which has a depth greater than 20 km and is the area where the August 19, 2018 events took place, as shown in Figure 1. The aftershocks are first concentrated in the northwest cluster (starting from August 4) before moving to the northeast cluster (starting from August 19), as also shown by previous study of Lythgoe et al. (2021).
In this study, we suggest that two factors could play an essential role in the 2018 Lombok earthquake sequence. The first factor that we suggest is the influence of fluid content which is similar to the 2016 Kumamoto, Japan earthquake (Komatsu et al., 2017; Wang et al., 2017) and the Tohoku, Japan earthquake (Liu et al., 2014). Based on experimental studies, Tenthorey et al. (2003) confirm that fluids could significantly affect the frictional strength and the stability of faults. From Figures 7, 8, our results show that the August 5, 2018 earthquake (Mw 7) is located in a region of moderate Qp (∼ 285), close to the contrast of high and low-Qp. This area also corresponds with the high-Vp anomaly. Most of the aftershocks that follow the major earthquake are at a shallower depth of 20 km, which is characterized by low-Qp and low Vp anomaly (Figure 8). Based on these properties, we suggest that the August 5, 2018 earthquake (Mw 7) was generated in a strong material layer of subducted FOC. However, the rupture area, identified by the aftershock distribution which has low-Qp and low Vp, might be affected by fluids, thus reducing fault friction, and could be the main cause of the aftershocks in this area (Tenthorey et al., 2003; Wang et al., 2017). Our attenuation structure findings support the previous seismic velocity study done by Afif et al. (2020) who state that large earthquakes take place in the boundaries of a strong material or at the barriers of the fluid content where stress has accumulated. The second factor that we suggest could play an essential role in this earthquake is the influence of thermal gradient. The recent study of Lythgoe et al. (2021) stated that there is an effect of thermal gradient from the deep magmatic system underlying Rinjani volcano and it controlled the rupture in the seismogenic zone.
We observe a significant low-Qp (∼ 270) anomaly at a depth between 0 and 10 km in the northwest cluster (indicated by R1 in Figures 7, 8). The low-Qp in R1 corresponds with the low-Vp anomaly and high-Vp/Vs (excluded the eastern portion of it). We suggest that at shallow depths (∼ 0 km), the low-Qp is correlated with sedimentary deposits in the Back-arc Basin. Sedimentary deposits are well known to be one of the causes of high attenuation (Hauksson and Shearer, 2006; Li et al., 2006; Bohm et al., 2013; Muksin et al., 2013). Bohm et al. (2013) found high attenuation in Kendeng Basin in Central Java. Muksin et al. (2013) found high attenuation in the Tarutung Basin, North Sumatra. The thick sedimentary deposit in R1 is formed by upper Miocene limestone overlain by the Pliocene to present-day young sediments with a depth range of 1–5.5 s two-way travel time from mean sea level (Yang et al., 2020). For the deeper depths (∼ 10 km), we suggest that the low-Qp (∼ 250) is associated with a brittle area; this is based on the evidence of basal and imbricated thrust fault from the 2D seismic profile north of Lombok Island found by Yang et al. (2020). This strong low-Qp anomaly is also associated with low-Vp anomaly and high-Vp/Vs as well as high seismicity. It corresponds to the anomaly caused by the presence of fractures in saturated rock based on laboratory experiments (O’Connell and Budiansky, 1974; Moos and Zoback, 1983). They found that in saturated rock conditions, the existence of fractures reduce Vp and Vs values where the decrease in Vs is greater, hence, Vp/Vs becomes high (O’Connell and Budiansky, 1974; Moos and Zoback, 1983). The fluid content in fractured rock provides a significant reduction in Q (Mavko and Nur, 1979). Once liberated, these fluids may drain through the active high angle imbricate thrust fault or migrate along the basal detachment fault (Ranero et al., 2008). Alternatively, the fluids could originate from the FOC dehydration beneath the Lombok Islands (Silver et al., 1983). This fluid might act as a driving factor for a smooth fault which then triggers seismicity.
The low-Vp, high-Vp/Vs, and low-Qp anomaly in R1 does not extend further to the east; based on the attenuation results (Figure 7), the anomaly has differing properties between the shallower earthquake cluster northwest and the deeper earthquake cluster to the northeast. In the northeast, the deeper earthquake cluster (indicated as R2 in Figures 7, 8) revealed high-Qp anomalies that correspond with low-Vp and low-Vp/Vs from ∼10 km onward. The low-Vp/Vs can be caused by fractures in the dry rock. The fractures reduce both Vp and Vs, but Vp is reduced more than Vs so that Vp/Vs has a low value (O’Connell and Budiansky, 1974). The high-Qp also supports the idea that fluids do not play a role in this zone. Thus, we suggest that the difference in Vp/Vs and the attenuation structure between R1 and R2 is mainly due to differences in the fluid content. Besides, we also argue that the difference in the fluid content between the northwest and northeast is causing the generation of aftershocks, primarily in the northwest. The presence of fluid can cause pressure to move first in the northwest area, before triggering earthquakes in the northeast due to the differences in pore pressure. Alternatively, the differences in attenuation characteristics and aftershocks distribution in R1 and R2 are probably due to the thermal gradient associated with the presence of the Rinjani volcano as stated in Lythgoe et al. (2021). The presence of a squeezing zone generated by a thermal push from the volcanic heat in the R1 might raise the seismogenic zone to the shallower crust so that the aftershocks in R1 (northwest area) are shallower than the aftershocks in R2 (northeast area).
Other Geological Features
The area north of the Rinjani volcano (indicated as R3 in Figures 7–9) at a depth of 0–15 km has a low-Vp, moderate to high-Vp/Vs, and low-Qp (∼ 230) at the depth ∼ 0–20 km. The Q value in this area is the lowest of all the areas. Seismicity in this area is relatively low and does not relate to clustered earthquakes in the north of the island (R1). Based on the previous studies by Supendi et al. (2020) and Yang et al. (2020) this area is composed of intensely deformed rock containing dense fractures. These dense fractures cause both Vp and Vs to be low (O’Connell and Budiansky, 1974). The low-Qp and high-Vp/Vs suggest that this area also contains fluids. In saturated conditions, the decrease in Vs is greater than Vp, so that Vp/Vs becomes high (O’Connell and Budiansky, 1974; Moos and Zoback, 1983). The small amounts of fluids distributed in thin fractures can also significantly cause Q to decrease (Mavko and Nur, 1979). In addition, we suggest that the high temperature also plays a role in causing this area to have the lowest Q. The indication of the presence of the high temperature is supported by the existence of thermal manifestations and surface alteration in the northern part of the Rinjani volcano (Sundhoro et al., 2000; Hadi et al., 2007). Thermal manifestations that appear on the surface are hot springs with temperatures up to 70°C (i.e., Sebau, Kukusan, Kalak, Segara Anakan I, Segara Anakan II, Segara Anakan III, and Segara Anakan IV) (Sundhoro et al., 2000; Hadi et al., 2007). Based on the velocity and attenuation characteristics and also an indication of high temperature, this region might contain fluids: either high temperature water-filled or melts (Nakajima and Hasegawa, 2006; Ramdhan et al., 2019). We suggest that the dense fractures at a depth of ∼ 0–20 km with high permeability may be the pathway for hot water to rise to the surface.
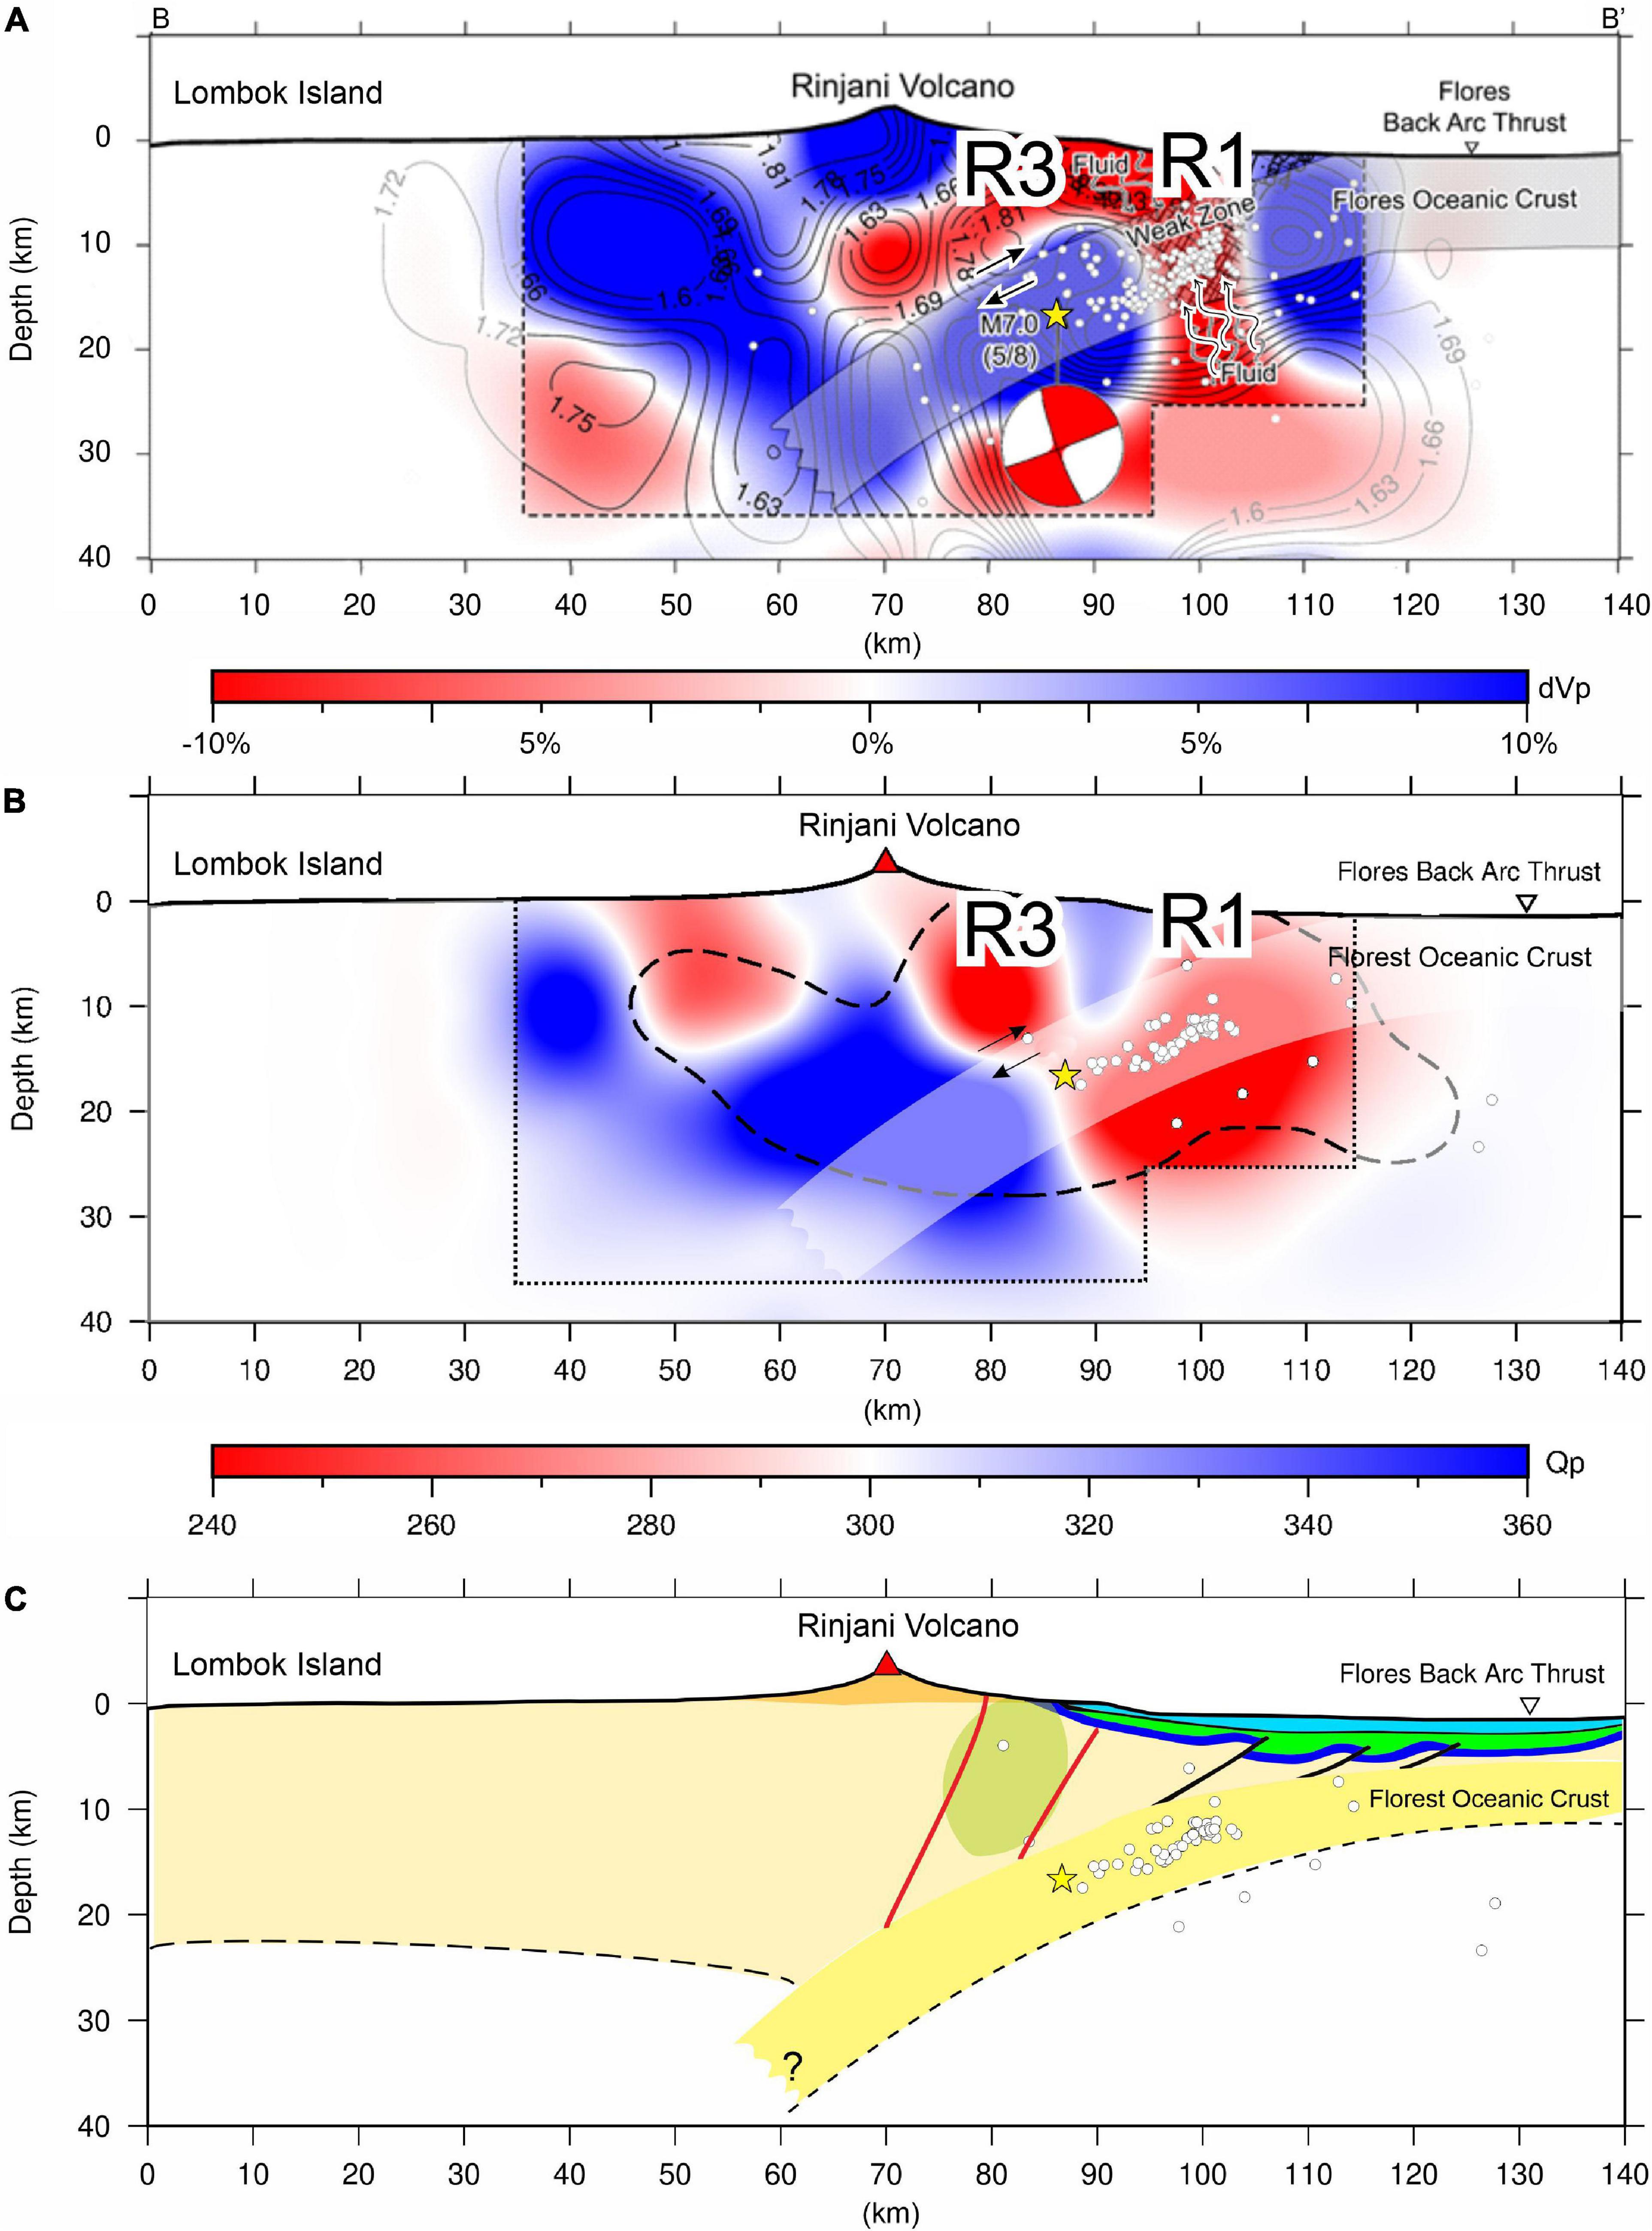
Figure 9. Tectonic model of the Lombok based on seismicity, velocity, and attenuation tomography; (A) 2D interpretation of the crust beneath around Lombok based on the Vp model along section BB’ (Afif et al., 2020); (B) 2D interpretation for the crust beneath around Lombok based on the Qp model along section BB′; (C) schematic diagram around Lombok Island. An inverted triangle marks the surface fault location based on Irsyam et al. (2017). The yellow star denotes the M 7.0 (August 5, 2018) which has a thrusting fault mechanism (Global CMT Catalogue). The white dots indicate the locations of hypocenters with a radius of 3 km from the centerline. The red lines indicate the faults from Supendi et al. (2020) and the black lines indicate the faults from Yang et al. (2020). The green area near the red lines (faults) indicates the high-temperature fluid content. The dark blue sediment layer represents the UpperMiocene limestone, the green sediment layer represents the Pliocene to present young sediment, and the light blue layer represents the ocean. Note that the difference in the number of hypocenters is due to the difference in the number of events before the spectral fitting procedure (A) and after spectral fitting procedure (B,C).
R4 is located in the eastern flank of the Rinjani volcano and is characterized by a high-Vp, low-Vp/Vs, and high-Qp anomaly at a depth of 0–10 km (Figures 7, 8). This region also correlates with a high Bouguer anomaly (Sukardi, 1979) and a high-Vs anomaly based on ambient noise tomography (Sarjan et al., unpublished). Indrastuti et al. (2019) found a similar velocity anomaly beneath the Sinabung volcano using data from before the 2013 eruption; they suggest that the anomaly is related to old, cold intrusive deposits from the previous eruption. Other previous studies that found high-Vp anomalies around volcanoes also interpreted these as older intrusive bodies (Laigle et al., 2000; Tanaka et al., 2002; Syracuse et al., 2011). In line with this study, we interpret the R4 anomaly as the seismic expression of an old intrusive body which relates to the ancient Samalas volcano on the northeast flank of the Rinjani volcano. According to the geological map of the Sembalun Bumbung area (Sundhoro et al., 2000; Hadi et al., 2007), the modern presence of the Samalas volcano is marked by a group of volcanoes that are no longer active in this region (i.e., the Gonduri, Pusuk, Nangi, Anakdare, and Batujang volcano) (Figure 1).
Conclusion
We successfully estimate the 3D Qp structures around the source region of the 2018 Lombok earthquake sequence. The interpretations of the Qp structures in this study are supported by the Vp and Vp/Vs structures from a previous study (Afif et al., 2020) and the 2D seismic profiles north of Lombok Island (Yang et al., 2020). The main findings of this study are summarized as follows:
1. The clustered northwest and northeast earthquakes have different velocity and attenuation properties. The low-Qp supported by low-Vp and high-Vp/Vs in the northwest area might be associated with the high fluid saturation in this area. Conversely, the high-Qp, low-Vp, and low-Vp/Vs in the northeast area might be associated with the lack of fluids. We also suggest that the existence of fluid content might be the cause of aftershocks that happened in the northwest area before moving northeast.
2. The significant Lombok earthquake on August 5, 2018 is located in a moderate-Qp and associated with a high-Vp zone. This feature indicates that the Lombok earthquake sequence first ruptured in a strong material of the subducted FOC and triggered shallower aftershocks in areas with fluid contents.
3. The low-Qp, low-Vp, and high-Vp/Vs anomaly beneath the northern area of the Rinjani volcano indicates high-temperature fluids.
4. The high-Qp, high-Vp, and low-Vp/Vs anomaly at the northeast flank of the Rinjani volcano is considered to be an old intrusive body related to the ancient Samalas volcano.
Data Availability Statement
The raw data supporting the conclusions of this article will be made available by the authors, without undue reservation.
Author Contributions
ZZ, AN, ShW, DS, and MM conceived the survey and seismic study on AP, AN, AAu, BP, SR, HA, contributed to the writing of the manuscript. All authors contributed to the preparation of the manuscript. All authors have read and approved the final manuscript.
Funding
This study was supported by “Riset P3MI ITB 2020” awarded to AP. This study was partially supported by “Riset Penelitian Dasar Unggulan Perguruan Tinggi (PDUPT) BP-PTNBH Kemristek/BRIN 2019-2020,” World Class Research Kemristek/BRIN 2021-2022 awarded to AN, and was also partially supported by Center for Earthquake Science and Technology, Research Center for Disaster Mitigation, Institut Teknologi Bandung (CEST, PPMB, ITB).
Conflict of Interest
The authors declare that the research was conducted in the absence of any commercial or financial relationships that could be construed as a potential conflict of interest.
Acknowledgments
This study was a collaboration between our colleagues at the Institut Teknologi Bandung (ITB), the Earth Observatory Singapore (EOS)-Nanyang Technological University (NTU) Singapore, the Agency for Meteorology, Climatology, and Geophysics of Indonesia (BMKG), and the Center for Volcanology and Geological Hazard Mitigation of Indonesia (PVMBG). We used topography data from the Shuttle Radar Topography Mission (SRTM) 30 Plus (Becker et al., 2009) and all figures were plotted using Generic Mapping Tools (Wessel and Smith, 1998). We would also like to thank all the members of the Volcanology and Geothermal Laboratory and the Global Geophysics Research Group of the Faculty of Mining and Petroleum Engineering, ITB.
Supplementary Material
The Supplementary Material for this article can be found online at: https://www.frontiersin.org/articles/10.3389/feart.2021.639692/full#supplementary-material
References
Afif, H., Nugraha, A. D., Muzli, M., Widiyantoro, S., Zulfakriza, Z., Wei, S., et al. (2020). Local earthquake tomography of the source region of the 2018 Lombok earthquake sequence, Indonesia. Geophys. J. Int. (in press).
Anderson, J. G., and Hough, S. E. (1984). A model for the shape of the fourier amplitude spectrum of acceleration at high frequencies. Bull. Seismol. Soc. Am. 74, 1969–1993.
Becker, J. J., Sandwell, D. T., Smith, W. H. F., Braud, J., Binder, B., Depner, J., et al. (2009). Global bathymetry and elevation data at 30 arc seconds resolution: SRTM30_PLUS. Marine Geodesy 32, 355–371. doi: 10.1080/01490410903297766
Bohm, M., Haberland, C., and Asch, G. (2013). Imaging fluid-related subduction processes beneath Central Java (Indonesia) using seismic attenuation tomography. Tectonophysics 590, 175–188. doi: 10.1016/j.tecto.2013.01.021
Brune, J. N. (1970). Tectonic stress and the spectra of seismic shear waves from earthquakes. J. Geophys. Res. 75, 4997–5009. doi: 10.1029/jb075i026p04997
Chiarabba, C., Piccinini, D., and de Gori, P. (2009). Velocity and attenuation tomography of the Umbria Marche 1997 fault system: evidence of a fluid-governed seismic sequence. Tectonophysics 476, 73–84. doi: 10.1016/j.tecto.2009.04.004
Christensen, N. I., and Wepfer, W. W. (1989). Laboratory techniques for determining seismic velocities and attenuations, with applications to the continental lithosphere. Mem. Geol. Soc. Am. 172, 91–102. doi: 10.1130/MEM172-p91
De Siena, L., Del Pezzo, E., and Bianco, F. (2010). Seismic attenuation imaging of Campi Flegrei: evidence of gas reservoirs, hydrothermal basins, and feeding systems. J. Geophys. Res. Solid Earth 115:B09312. doi: 10.1029/2009JB006938
Eberhart-Phillips, D. (2002). Three-dimensional attenuation model of the shallow Hikurangi subduction zone in the Raukumara Peninsula, New Zealand. J. Geophys. Res. 107, ESE3–1–ESE3–15. doi: 10.1029/2000jb000046 ESE 3-1-ESE 3-15,
Evans, J. R., Eberhart-Phillips, D., and Thurber, C. H. (1994). User’s manual for SIMULPS 12 for imaging Vp and Vp/Vs: a derivative of the Thurber tomographic in version SIMUL3 for local earthquakes and explosion. Open File Rep. 9:101.
Global Volcanism Program (2018). “Report on rinjani (Indonesia),” in Weekly Volcanic Activity Report, 25 July-31 July 2018, ed. S. K. Sennert (Washington, DC: Smithsonian Institution).
Haberland, C., and Rietbrock, A. (2001). Attenuation tomography in the western central Andes: a detailed insight into the structure of a magmatic arc. J. Geophys. Res. Solid Earth 106, 11151–11200. doi: 10.1029/2000jb900472
Hadi, M. N., Yushantarti, A., Suhanto, E., and Sundhoro, H. (2007). “Survei panas bumi terpadu (Geologi, Geokimia Dan Geofisika) daerah sembalun, kabupaten lombok timur – NTB,” in Proceeding Pemaparan Hasil Kegiatan Lapangan dan Non Lapangan Tahun 2007 Pusat Sumber Daya Geologi, Vol. 33, Bandung, 6–19. doi: 10.7498/aps.62.084101
Hamilton, W. (1979). Tectonics of the indonesian region. Geol. Soc. Malays. Bull. 6, 3–10. doi: 10.7186/bgsm06197301
Hauksson, E., and Shearer, P. M. (2006). Attenuation models (Qp and Qs) in three dimensions of the southern California crust: inferred fluid saturation at seismogenic depths. J. Geophys. Res. Solid Earth 111:B05302. doi: 10.1029/2005JB003947
Indrastuti, N., Nugraha, A. D., McCausland, W. A., Hendrasto, M., Gunawan, H., Kusnandar, R., et al. (2019). 3-D Seismic tomographic study of Sinabung Volcano, Northern Sumatra, Indonesia, during the inter-eruptive period October 2010–July 2013. J. Volcanol. Geotherm. Res. 382, 197–209. doi: 10.1016/j.jvolgeores.2019.03.001
Irsyam, M., Widiyantoro, S., Natawidjaja, D. H., Meilano, I., Rudyanto, A., Hidayati, S., et al. (2017). Buku Peta Gempa 2017. Bandung: Badan Penelitian dan Pengembangan Kementerian Pekerjaan Umum dan Perumahan Rakyat.
Karato, S. I. (2004). Mapping water content in the upper mantle. Geophys. Monogr. 138, 1–18. doi: 10.1029/138GM08
Kampfmann, W., and Berckhemer, H. (1985). High temperature experiments on the elastic and anelastic behavior of magmatic rocks. Phys. Earth Planet. Inter. 40, 223–247. doi: 10.1016/0031-9201(85)90132-3
Komatsu, M., Takenaka, H., and Oda, H. (2017). Three-dimensional P- and S-wave attenuation structures around the source region of the 2016 Kumamoto earthquakes 4. Seismol. Earth Planets Space 69, 1–9. doi: 10.1186/s40623-017-0683-6
Koulali, A., Susilo, S., McClusky, S., Meilano, I., Cummins, P., Tregoning, P., et al. (2016). Crustal strain partitioning and the associated earthquake hazard in the eastern Sunda-Banda Arc. Geophys. Res. Lett. 43, 1943–1949. doi: 10.1002/2016GL067941
Laigle, M., Hirn, A., Sapin, M., Lépine, J. C., Diaz, J., Gallart, J., et al. (2000). Mount Etna dense array local earthquake P and S tomography and implications for volcanic plumbing. J. Geophys. Res. 105, 21633–21646. doi: 10.1029/2000jb900190
Lanza, F., Thurber, C. H., Syracuse, E. M., Power, J. A., and Ghosh, A. (2020). Seismic tomography of compressional wave velocity and attenuation structure for Makushin Volcano, Alaska. J. Volcanol. Geotherm. Res. 393:106804. doi: 10.1016/j.jvolgeores.2020.106804
Lavigne, F., Degeai, J. P., Komorowski, J. C., Guillet, S., Robert, V., Lahitte, P., et al. (2013). Source of the great A.D. 1257 mystery eruption unveiled, Samalas volcano, Rinjani Volcanic Complex, Indonesia. Proc. Natl. Acad. Sci. U.S.A. 110, 16742–16747. doi: 10.1073/pnas.1307520110
Li, Q., Wilcock, W. S. D., Pratt, T. L., Snelson, C. M., and Brocher, T. M. (2006). Seismic attenuation structure of the Seattle basin, Washington state, from explosive-source refraction data. Bull. Seismol. Soc. Am. 96, 553–571. doi: 10.1785/0120040164
Lin, G. (2014). Three-dimensional compressional wave attenuation tomography for the crust and uppermost mantle of Northern and central California. J. Geophys. Res. 119, 3462–3477. doi: 10.1002/2013JB010621
Lin, G., Shearer, P. M., Amelung, F., and Okubo, P. G. (2015). Seismic tomography of compressional wave attenuation structure for Ki–lauea Volcano, Hawai’i. J. Geophys. Res. 120, 2510–2524. doi: 10.1002/2014JB011594
Liu, X., and Zhao, D. (2015). Seismic attenuation tomography of the Southwest Japan arc: new insight into subduction dynamics. Geophys. J. Int. 201, 135–156. doi: 10.1093/gji/ggv007
Liu, X., Zhao, D., and Li, S. (2014). Seismic attenuation tomography of the Northeast Japan arc: insight into the 2011 Tohoku earthquake (Mw9.0) and subduction dynamics. J. Geophys. Res. 119, 1094–1118. doi: 10.1002/2013JB010591
Lythgoe, K., Muzli, M., Bradley, K., Wang, T., Nugraha, A. D., Zulfakriza, Z., et al. (2021). Thermal squeezing of the seismogenic zone-controlled rupture of the volcano-rooted Flores Thrust. Sci. Adv. 7:eabe2348. doi: 10.1126/sciadv.abe2348
Mavko, G. M., and Nur, A. (1979). Wave attenuation in partially saturated rocks. Geophysics 44, 161–178. doi: 10.1190/1.1440958
McCaffrey, R., and Nabelek, J. (1984). The geometry of back-arc thrusting along the eastern Sunda Arc, Indonesia: constraints from earthquake and gravity data. J. Geophys. Res. 89, 6171–6179. doi: 10.1029/JB089iB07p06171
Menke, W. (2018). Geophysical data analysis: discrete inverse theory. Tectonophysics 124, 366–367. doi: 10.1016/0040-1951(86)90212-x
Mizutani, H., and Kanamori, H. (1964). Variation of elastic wave velocity and attenuation property near the melting temperature. J. Phys. Earth 12, 43–49. doi: 10.4294/jpe1952.12.43
Moos, D., and Zoback, M. D. (1983). In situ studies of velocity in fractured crystalline rocks. J. Geophys. Res. 88, 2345–2358. doi: 10.1029/JB088iB03p02345
Muksin, U., Haberland, C., Bauer, K., and Weber, M. (2013). Three-dimensional upper crustal structure of the geothermal system in Tarutung (North Sumatra, Indonesia) revealed by seismic attenuation tomography. Geophys. J. Int. 195, 2037–2049. doi: 10.1093/gji/ggt383
Murase, T., and McBirney, A. R. (1973). Properties of some common igneous rocks and their melts at high temperatures. Geol. Soc. Am. Bull. 84, 3563–3592.
Nakajima, J., and Hasegawa, A. (2006). Anomalous low-velocity zone and linear alignment of seismicity along it in the subducted Pacific slab beneath Kanto, Japan: Reactivation of subducted fracture zone? Geophys. Res. Lett. 33:L16309. doi: 10.1029/2006GL026773
Nugraha, A. D., Mori, J., and Ohmi, S. (2010). Thermal structure of the subduction zone in western Japan derived from seismic attenuation data. Geophys. Res. Lett. 37:L06310. doi: 10.1029/2009GL041522
O’Connell, R. J., and Budiansky, B. (1974). Seismic velocities in dry and saturated cracked solids. J. Geophys. Res. 79, 5412–5426. doi: 10.1029/JB079i035p05412
Ramdhan, M., Widiyantoro, S., Nugraha, A. D., Métaxian, J. P., Rawlinson, N., Saepuloh, A., et al. (2019). Detailed seismic imaging of Merapi volcano, Indonesia, from local earthquake travel-time tomography. J. Asian Earth Sci. 177, 134–145. doi: 10.1016/j.jseaes.2019.03.018
Ranero, C. R., Grevemeyer, I., Sahling, H., Barckhausen, U., Hensen, C., Wallmann, K., et al. (2008). Hydrogeological system of erosional convergent margins and its influence on tectonics and interplate seismogenesis. Geochem. Geophys. Geosystems. 9:Q03S04. doi: 10.1029/2007GC001679
Rietbrock, A. (2001). P wave attenuation structure in the fault area of the 1995 Kobe earthquake. J. Geophys. Res. 106, 4141–4154. doi: 10.1029/2000JB900234
Sanders, C. O., Ponko, S. C., Nixon, L. D., and Schwartz, E. A. (1995). Seismological evidence for magmatic and hydrothermal structure in Long Valley caldera from local earthquake attenuation and velocity tomography. J. Geophys. Res 100, 8311–8326. doi: 10.1029/95JB00152
Sasmi, A. T., Nugraha, A. D., Muzli, M., Widiyantoro, S., Zulfakriza, Z., Wei, S., et al. (2020). Hypocenter and magnitude analysis of aftershocks of the 2018 Lombok, Indonesia, earthquakes using local seismographic networks. Seismol. Res. Lett. 91, 2152–2162. doi: 10.1785/0220190348
Scherbaum, F. (1990). Combined inversion for the three-dimensional Q structure and source parameters using microearthquake spectra. J. Geophys. Res. 95, 12423–12438. doi: 10.1029/jb095ib08p12423
Shearer, P. M., Prieto, G., and Hauksson, E. (2006). Comprehensive analysis of earthquake source spectra in southern California. J. Geophys. Res. 111:B06303. doi: 10.1029/2005JB003979
Silver, E. A., Reed, D., and McCaffrey, R. (1983). Back-arc thrusting in the E Sunda arc, Indonesia: a consequence of arc-continent collision. J. Geophys. Res. 88, 7429–7448. doi: 10.1029/JB088iB09p07429
Sukardi, S. (1979). Bouguer Anomaly Map of the Lombok Quadrangle, NUSA Tenggara. Bandung: Geological Research and Development Centre. (Unpublished Report).
Sundhoro, H., Nasution, A., and Simanjuntak, J. (2000). “Sembalun Bumbung geothermal area, Lombok Island, West Nusatenggara, Indonesia: an integrated exploration,” in Proceedings World Geothermal Congress 2000. Corpus ID: 195732099, Kyushu.
Supendi, P., Nugraha, A. D., Widiyantoro, S., Pesicek, J. D., Thurber, C. H., Abdullah, C. I., et al. (2020). Relocated aftershocks and background seismicity in eastern Indonesia shed light on the 2018 Lombok and Palu earthquake sequences. Geophys. J. Int 221, 1845–1855. doi: 10.1093/gji/ggaa118
Susilo, S., Wijanarto, A. B., Wibowo, S., Kautsar, M. A., Basuki, A. Y., Abidin, H. Z., et al. (2018). GPS / GNSS Analysis on Lombok Earthquakes: Co-Seismic Deformation. Cibinong: Badan Informasi Geospasial, doi: 10.13140/RG.2.2.34871.78242
Syracuse, E. M., Thurber, C. H., and Power, J. A. (2011). The Augustine magmatic system as revealed by seismic tomography and relocated earthquake hypocenters from 1994 through 2009. J. Geophys. Res. 116:B09306. doi: 10.1029/2010JB008129
Tanaka, S., Hamaguchi, H., Nishimura, T., Yamawaki, T., Ueki, S., Nakamichi, H., et al. (2002). Three-dimensional P-wave velocity structure of Iwate volcano, Japan from active seismic survey. Geophys. Res. Lett. 29, 59–51. doi: 10.1029/2002gl014983 59-1-59-4,
Tenthorey, E., Cox, S. F., and Todd, H. F. (2003). Evolution of strength recovery and permeability during fluid-rock reaction in experimental fault zones. Earth Planet. Sci. Lett. 206, 161–172. doi: 10.1016/S0012-821X(02)01082-8
Thurber, C., and Eberhart-Phillips, D. (1999). Local earthquake tomography with flexible gridding. Comput. Geosci. 25, 809–818. doi: 10.1016/S0098-3004(99)00007-2
Toomey, D. R., and Foulger, G. R. (1989). Tomographic inversion of local earthquake data from the Hengill- Grensdalur central volcano complex, Iceland. J. Geophys. Res. 94, 17497–17510. doi: 10.1029/jb094ib12p17497
Wang, Z., Zhao, D., Liu, X., and Li, X. (2017). Seismic attenuation tomography of the source zone of the 2016 Kumamoto earthquake (M 7.3). J. Geophys. Res. Solid Earth 122, 2988–3007. doi: 10.1002/2016JB013704
Wessel, P., and Smith, W. H. F. (1998). New, improved version of generic mapping tools released. Eos Trans. Am. Geophys. Union 79, 579–579. doi: 10.1029/98EO00426
Widiyantoro, S., Pesicek, J. D., and Thurber, C. H. (2011). Subducting slab structure below the eastern Sunda arc inferred from non-linear seismic tomographic imaging. Geol. Soc. Spec. Publ. 355:139. doi: 10.1144/SP355.7
Yang, X., Singh, S. C., and Tripathi, A. (2020). Did the Flores backarc thrust rupture offshore during the 2018 Lombok earthquake sequence in Indonesia? Geophys. J. Int. 221, 758–768. doi: 10.1093/gji/ggaa018
Keywords: Lombok earthquake 2018, aftershock, temporary station, spectral fitting, P-wave attenuation tomography
Citation: Priyono A, Nugraha AD, Muzli M, Ardianto A, Aulia AN, Prabowo BS, Zulfakriza Z, Rosalia S, Sasmi AT, Afif H, Sahara DP, Widiyantoro S, Wei S, Husni YM and Sarjan AFN (2021) Seismic Attenuation Tomography From 2018 Lombok Earthquakes, Indonesia. Front. Earth Sci. 9:639692. doi: 10.3389/feart.2021.639692
Received: 09 December 2020; Accepted: 02 March 2021;
Published: 29 March 2021.
Edited by:
Yudi Rosandi, Universitas Padjadjaran, IndonesiaReviewed by:
Chiara Civiero, Dublin Institute for Advanced Studies (DIAS), IrelandHerbert Urbassek, University of Kaiserslautern, Germany
Copyright © 2021 Priyono, Nugraha, Muzli, Ardianto, Aulia, Prabowo, Zulfakriza, Rosalia, Sasmi, Afif, Sahara, Widiyantoro, Wei, Husni and Sarjan. This is an open-access article distributed under the terms of the Creative Commons Attribution License (CC BY). The use, distribution or reproduction in other forums is permitted, provided the original author(s) and the copyright owner(s) are credited and that the original publication in this journal is cited, in accordance with accepted academic practice. No use, distribution or reproduction is permitted which does not comply with these terms.
*Correspondence: Andri Dian Nugraha, bnVncmFoYUBnZi5pdGIuYWMuaWQ=; YW5kcmlkbjEwNEBnbWFpbC5jb20=