 Alessandro Bonaccorso
 Marco Aloisi
95% of researchers rate our articles as excellent or good
Learn more about the work of our research integrity team to safeguard the quality of each article we publish.
Find out more
ORIGINAL RESEARCH article
Front. Earth Sci. , 16 March 2021
Sec. Volcanology
Volume 9 - 2021 | https://doi.org/10.3389/feart.2021.638742
This article is part of the Research Topic Pre- and Syn-Eruptive Conditions in Volcanic Systems View all 9 articles
A key issue on active volcanoes is to investigate the position and characteristics of the magma reservoirs over time. The aim is to better understand the crustal magma transfer, therefore also to define the volcanic hazard and plan the mitigation strategies. Mt. Etna volcano is characterized by a lively eruptive activity with frequent major flank eruptions that can be both purely effusive and explosive-effusive. This volcano has been monitored over 40 years by ground deformation measurements. The studies and modeling of the eruptive processes through these data have mainly concerned single eruptions and the recharge phases that preceded them. In this study, for the first time, we present four decades of numerous recharge periods modeled over time by using the same typology of measurements (geodetic baselines) and the same modeling method. This uniform approach enables tracking the location of magma storage in a robust and unambiguous way during its recharging, which causes the volcano to inflate. In particular, the recharging periods that preceded the main eruptive activities were investigated. The tracking of the source positions contributes to update the representation of the shallow-intermediate plumbing system (last 10 km). Moreover, as a new result, we highlight that the recharges preceding the explosive eruptions are accompanied by a deepening over time of the centroid of the pressure source. This result opens up new scenarios on the relationship between the position of the recharging storage and the subsequent eruptive style.
The arrival of new magma from depth and its storage in the plumbing system within intermediate-shallow reservoirs characterize the recharge phases that precede the eruptions of many volcanoes. This process can be revealed by measurements of the inflation the volcano undergoes in response to the accumulation of magma and the overpressures in these storages. Over the past decades, terrestrial and spatial deformation measurements were used by applying models to constrain the geometry and the pressure/volume change of the recharge magma storage, in literature also called magma reservoir (for a general review see Dzurisin, 2007). Volcano geodesy allows inferring the position, geometry, and volume change of the source with applications to numerous volcanoes around the world (i.e., Battaglia et al., 2003; Lu et al., 2003, 2010; Sturkell et al., 2006; Dzurisin et al., 2009; Chang et al., 2010; Newman et al., 2012). The most used analytic models are those of pressurized sources embedded in a homogeneous half-space from simple spherical (Mogi, 1958; McTigue, 1987) to ellipsoidal (Davis, 1986) or prolate (Yang et al., 1988) sources. To take into consideration the effects of additional complexity such as topography, corrections can be added to these models (Williams and Wadge, 2000). Numerical models such as the finite element method (FEM) can be used to consider the additional effects of the medium heterogeneity (i.e., Trasatti et al., 2003; Bonaccorso et al., 2005; Aloisi et al., 2011), and also to evaluate the effects of other rheologies around the magma storage such as visco-elastic or plastic (i.e., Newman et al., 2001, 2006; Pulvirenti et al., 2017).
Similarly to the applications in numerous other volcanoes, at Etna the simple spherical model gives a good first-order solution regarding the estimation of the centroid position of the pressure source and the change in its volume. Bonaccorso et al. (2005) compared simple analytical models and FEM numerical models, including topography and heterogeneity, showing that the latter improve the fit essentially in the summit area of the volcano but the depth of the centroid of the different models remains approximately the same. By adding visco-elastic (Del Negro et al., 2009) and elasto-plastic rheologies (Currenti et al., 2010), the numerical models show that they improve the estimate of the overpressure by providing lower and more realistic values, but do not significantly alter the position and volume change of the source.
Although mainly effusive, basaltic volcanoes can exhibit explosive behavior at the beginning of the eruptions and also during their course. Effusive eruptions usually allow time enough to adopt actions of hazard mitigation from the lava invasion (i.e., Bonaccorso et al., 2015b; Solana et al., 2017). Instead, explosive eruptions can become very critical for the dramatic consequences they can cause in a short time. Certainly, the most eloquent recent case is that of the well-known eruption of the Icelandic volcano Eyjafjallajökull, which during 2010 was able to paralyze air traffic on a continental scale. In general, the problem of being able to better understand, and if possible, foresee the eruptive style of an impending eruption, is a crucial aspect and an intriguing challenge.
Mt. Etna is one of the best monitored and studied active volcanoes in the world. Its frequent eruptions make it an ideal natural laboratory for observing and understanding the processes of magma recharge and the final intrusions (for an overview see Bonaccorso et al., 2004). In particular, during the last 40 years the monitoring of ground deformation has been implemented and improved over time, providing a powerful tool to monitor the final intrusions accompanying the numerous eruptions (for a review see Bonaccorso, 2001; Bonaccorso et al., 2004; Allard et al., 2006; Bonforte et al., 2008; Aloisi et al., 2018) and also detect the phases of recharging before the eruptions and discharging during their course.
In principle, the longer the recharge periods, the more likely the eruption will be powerful, having undergone a more prolonged and intense recharge (i.e., Bebbington, 2014). However, the choice of long period for analysis is conditioned by the frequent eruptions that clearly end the recharge phase. Also for this reason, the majority of source modeling studies in the past have focused on the numerous single eruptive episodes by carrying out short-term analyses related to the period astride the single eruptions (for a review see Bonaccorso, 2001; Bonaccorso et al., 2004; Allard et al., 2006; Bonforte et al., 2008; Aloisi et al., 2018).
The explosive activity of Etna volcano has also created serious concerns. The major effusive-explosive eruptions in 2001 and 2002–2003 paralyzed the air traffic of Catania international airport for weeks and months, respectively, and caused serious damage to infrastructure and human activities in the territory of Eastern Sicily. During 2011–2015, there were several explosive eruptive phases on Etna characterized by dozens of lava fountains (i.e., Bonaccorso et al., 2013; Calvari et al., 2018). These explosive episodes, although lasting a few hours and as single episodes not as considerable as major eruptions, again led to difficulties for air traffic and also substantial damage to infrastructures. In this period, during the recharging periods before the eruptive activity and those of discharging during the lava fountain activity, an interesting aspect was investigated by Aloisi et al. (2018). The authors highlighted that the position of the centroid of the recharge source (pre-eruption inflation) was deeper than that of the subsequent discharge source (deflation during the lava fountain phases), testifying to a separation between the positions of the inflation and deflation sources, respectively acting before and during the eruption. Moreover, a further element of interest is that for the 2009–2010 period, the one preceding the start of the long explosive phase with over 50 lava fountains in 2011–2015, Aloisi et al. (2009) modeled a deepening over time of the centroid of the charging source that caused the inflation of the volcano edifice.
From these previous results, a crucial and intriguing question arises, namely whether during the recharging phase the source position is stable or if there is a possible deepening, and whether it can be related to the explosiveness degree of the subsequent eruption. We have investigated this issue, which could have relevant implications for predicting and evaluating the type of expected eruption style. To undertake this investigation, we reviewed the medium-long term periods that preceded the main flank eruptions of the last millennium and the beginning of the current one. In our study, we have considered several recharge phases, marked by the volcano inflation, over a 40-year window by using geodetic measurements. We focused on the two main periods, namely 1987–1991, which preceded the typically effusive major eruption of 1991–1993, and 1994–2000, which preceded the two major effusive-explosive eruptions in 2001 and 2002–2003 characterized by a powerful explosive component throughout the course of these events. These two different classes of eruptions represent two useful end-members (i.e., the purely effusive eruption and the effusive also accompanied by violent explosive activity, respectively). These main eruptions can provide indications on the validity of the hypothesis formulated in this investigation and, therefore, make the study an absolute novelty.
Our approach was also verified on two other recent recharging periods, (1) 2009–2010, which preceded the explosive activity of lava fountains mainly concentrated in 2011–2013 and (2) that of 2016–2018, which preceded the brief flank eruption of December 2018. The results confirm that the proposed approach provides a useful predictive tool to characterize the possible explosive behavior before an eruption.
In the following sections, we first give an overview of the main eruptive activity of Etna in the last 40 years and describe the deformation measurement networks that have enabled monitoring the behavior of the volcano also in terms of main recharge periods and associated inflation (see section “Etna 1980 – 2018 Main Eruptive Activity and Deformation Measurements”). We then describe the method used to constrain the parameters of the source over time according to a uniform approach by applying the same simple, but effective, pressure source model for the representation of the process (see section “Recharge Source Modeling and Position Tracking”). Finally, in section “Discussion,” we discuss the results obtained that provide new information on the possible moving of the magma storage and the characterization of the subsequent eruption.
Since the 1970s, Etna has shown a particularly high rate of the eruptive activity (i.e., Branca and Del Carlo, 2004; Allard et al., 2006), and in particular the last 40 years represent an extraordinary period in terms of number of eruptions and volumes of erupted magma (Harris et al., 2011; Bonaccorso and Calvari, 2013; De Beni et al., 2015). In Table 1 we report a temporal scheme of the major eruptions occurring from 1980 until the period of this study (2018). An improvement of the monitoring systems began in the 1980s (for a review see Bonaccorso et al., 2004), with a key role in the monitoring being played by the ground deformation measurements. At the end of the 1970s, the first trilateration networks measured with Electro-optical Distance Measurements (EDM) were installed, measured on an annual basis and repeated until 2007 (Bonaccorso et al., 1995). By using this technique, the measurements of the distances between benchmarks have an accuracy of 5 mm plus one part per million of the measured length. At the beginning of the 1990s, the first GPS measurements began with repetitions of the campaigns always on a near-annual basis (i.e., Puglisi et al., 2004; Palano et al., 2008). Finally, from the mid-1990s, the installations of the first permanent GPS stations with continuous acquisition (CGPS) started; these currently cover the volcano with about 36 permanent stations (Bruno et al., 2012). A complete map of the benchmarks of the EDM measurements, periodic GPS measurements and GPS permanent stations is shown in Figure 1.
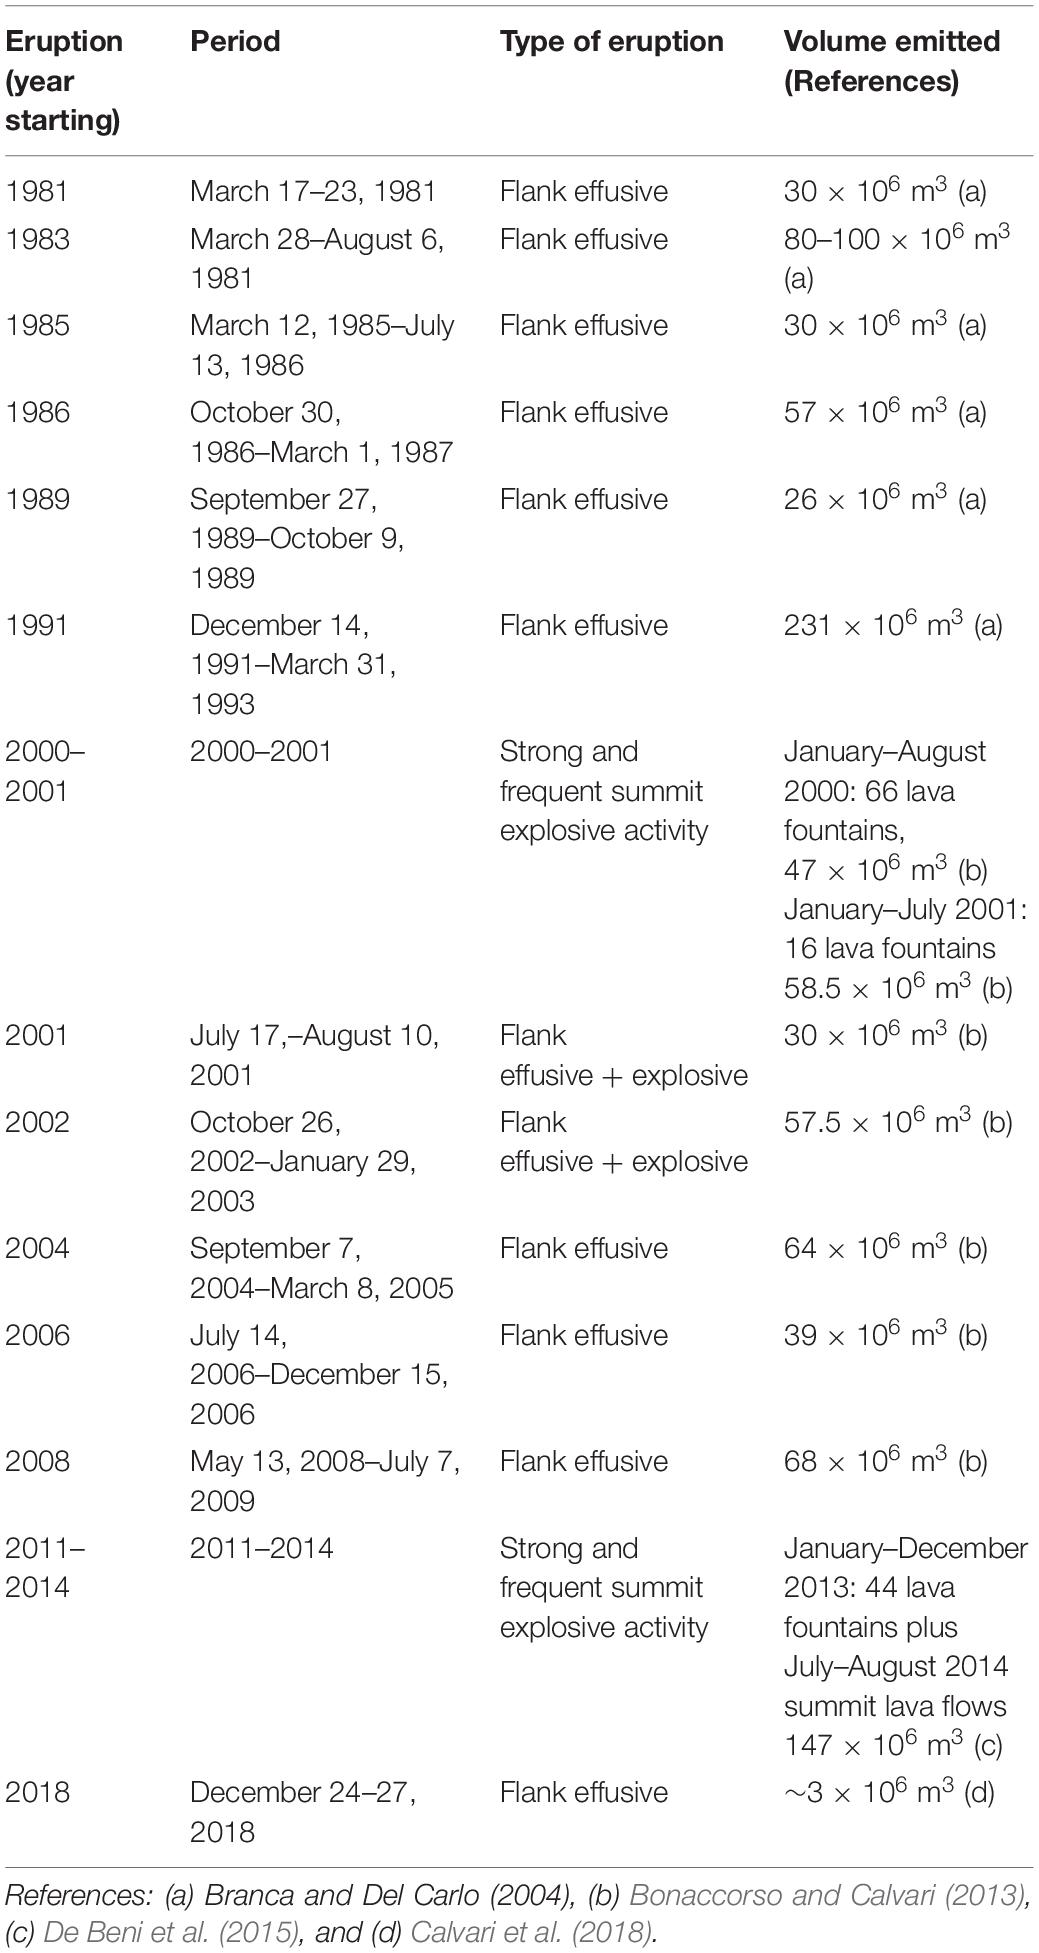
Table 1. Main flank eruptions and prolonged strong explosive periods from 1981 to 2018 emitting large lava volumes.
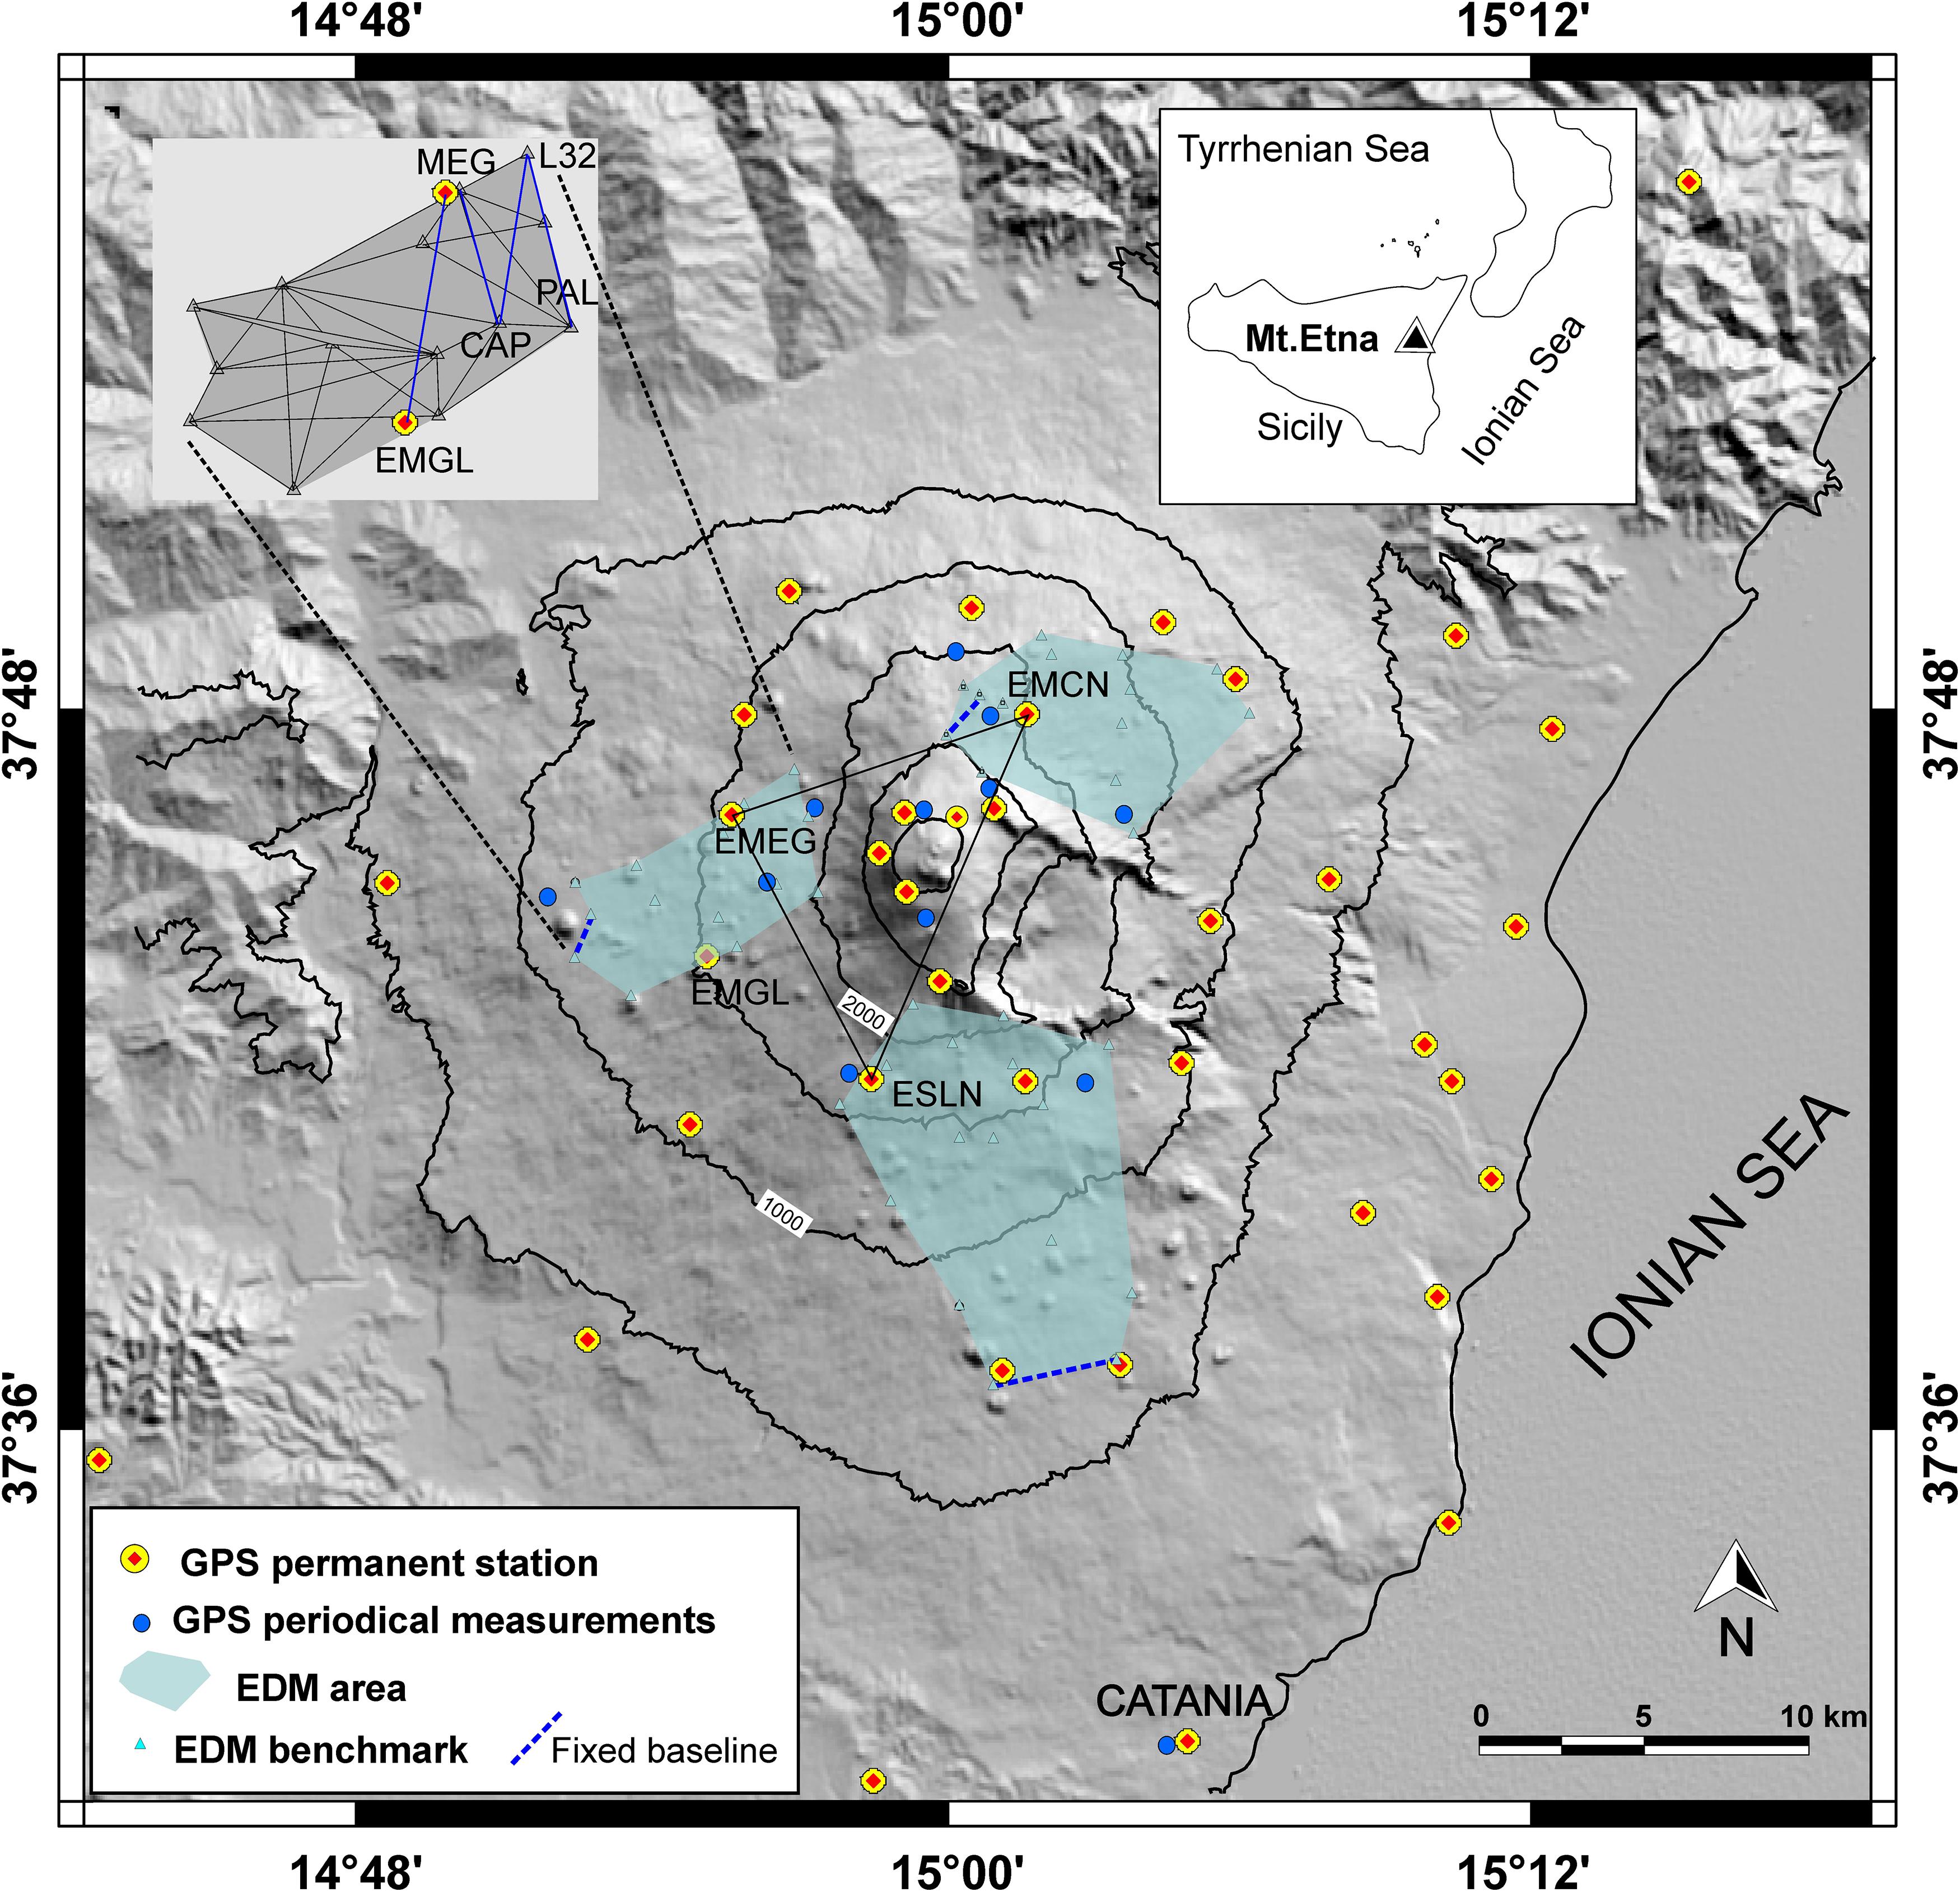
Figure 1. Etna map with the different geodetic monitoring networks: the three networks covered by Electro-optical Distance Measurements (EDM), the GPS benchmarks periodically measured (blue circles) and the permanent stations of the continuous GPS (CGPS) (yellow-red circles).
After the brief flank eruption associated with the powerful intrusion of the March 1981 eruption (Bonaccorso, 1999) and the 1983 flank eruption (Murray and Pullen, 1984), the deformation of the volcano underwent a continuous trend of inflation from 1983 until 1987, interrupted by short phases of deflation associated with the flank eruptions of 1985 and 1986 (Bonaccorso and Davis, 2004). By using only EDM measurements, absolute displacements cannot be determined since the network is not tied to an external fixed reference. However, the redundant baselines of the networks allow calculating the relative motion of the benchmarks with respect to an arbitrarily fixed baseline (i.e., fixing two benchmarks of the network) (Prescott, 1981). This solution removes both translational and rotational ambiguities, but it can introduce some distortions with respect to the real movements because a baseline of the network is constrained. However, the displacements provide a useful relative pattern. A clear picture of the expansion of the edifice during the 1983–1987 period is shown by the relative displacement vectors deduced by the EDM baseline changes (Figure 2A). During this phase, also a marked sliding of the E flank is well evidenced by the displacement vectors, as already shown in Alparone et al. (2013). This approach provides a very effective relative pattern especially if the different benchmarks of the network show marked changes with respect of the fixed baseline. This mainly occurs for sources such as dike intrusions and a shallow magma chamber as for the 1983–1987 case.
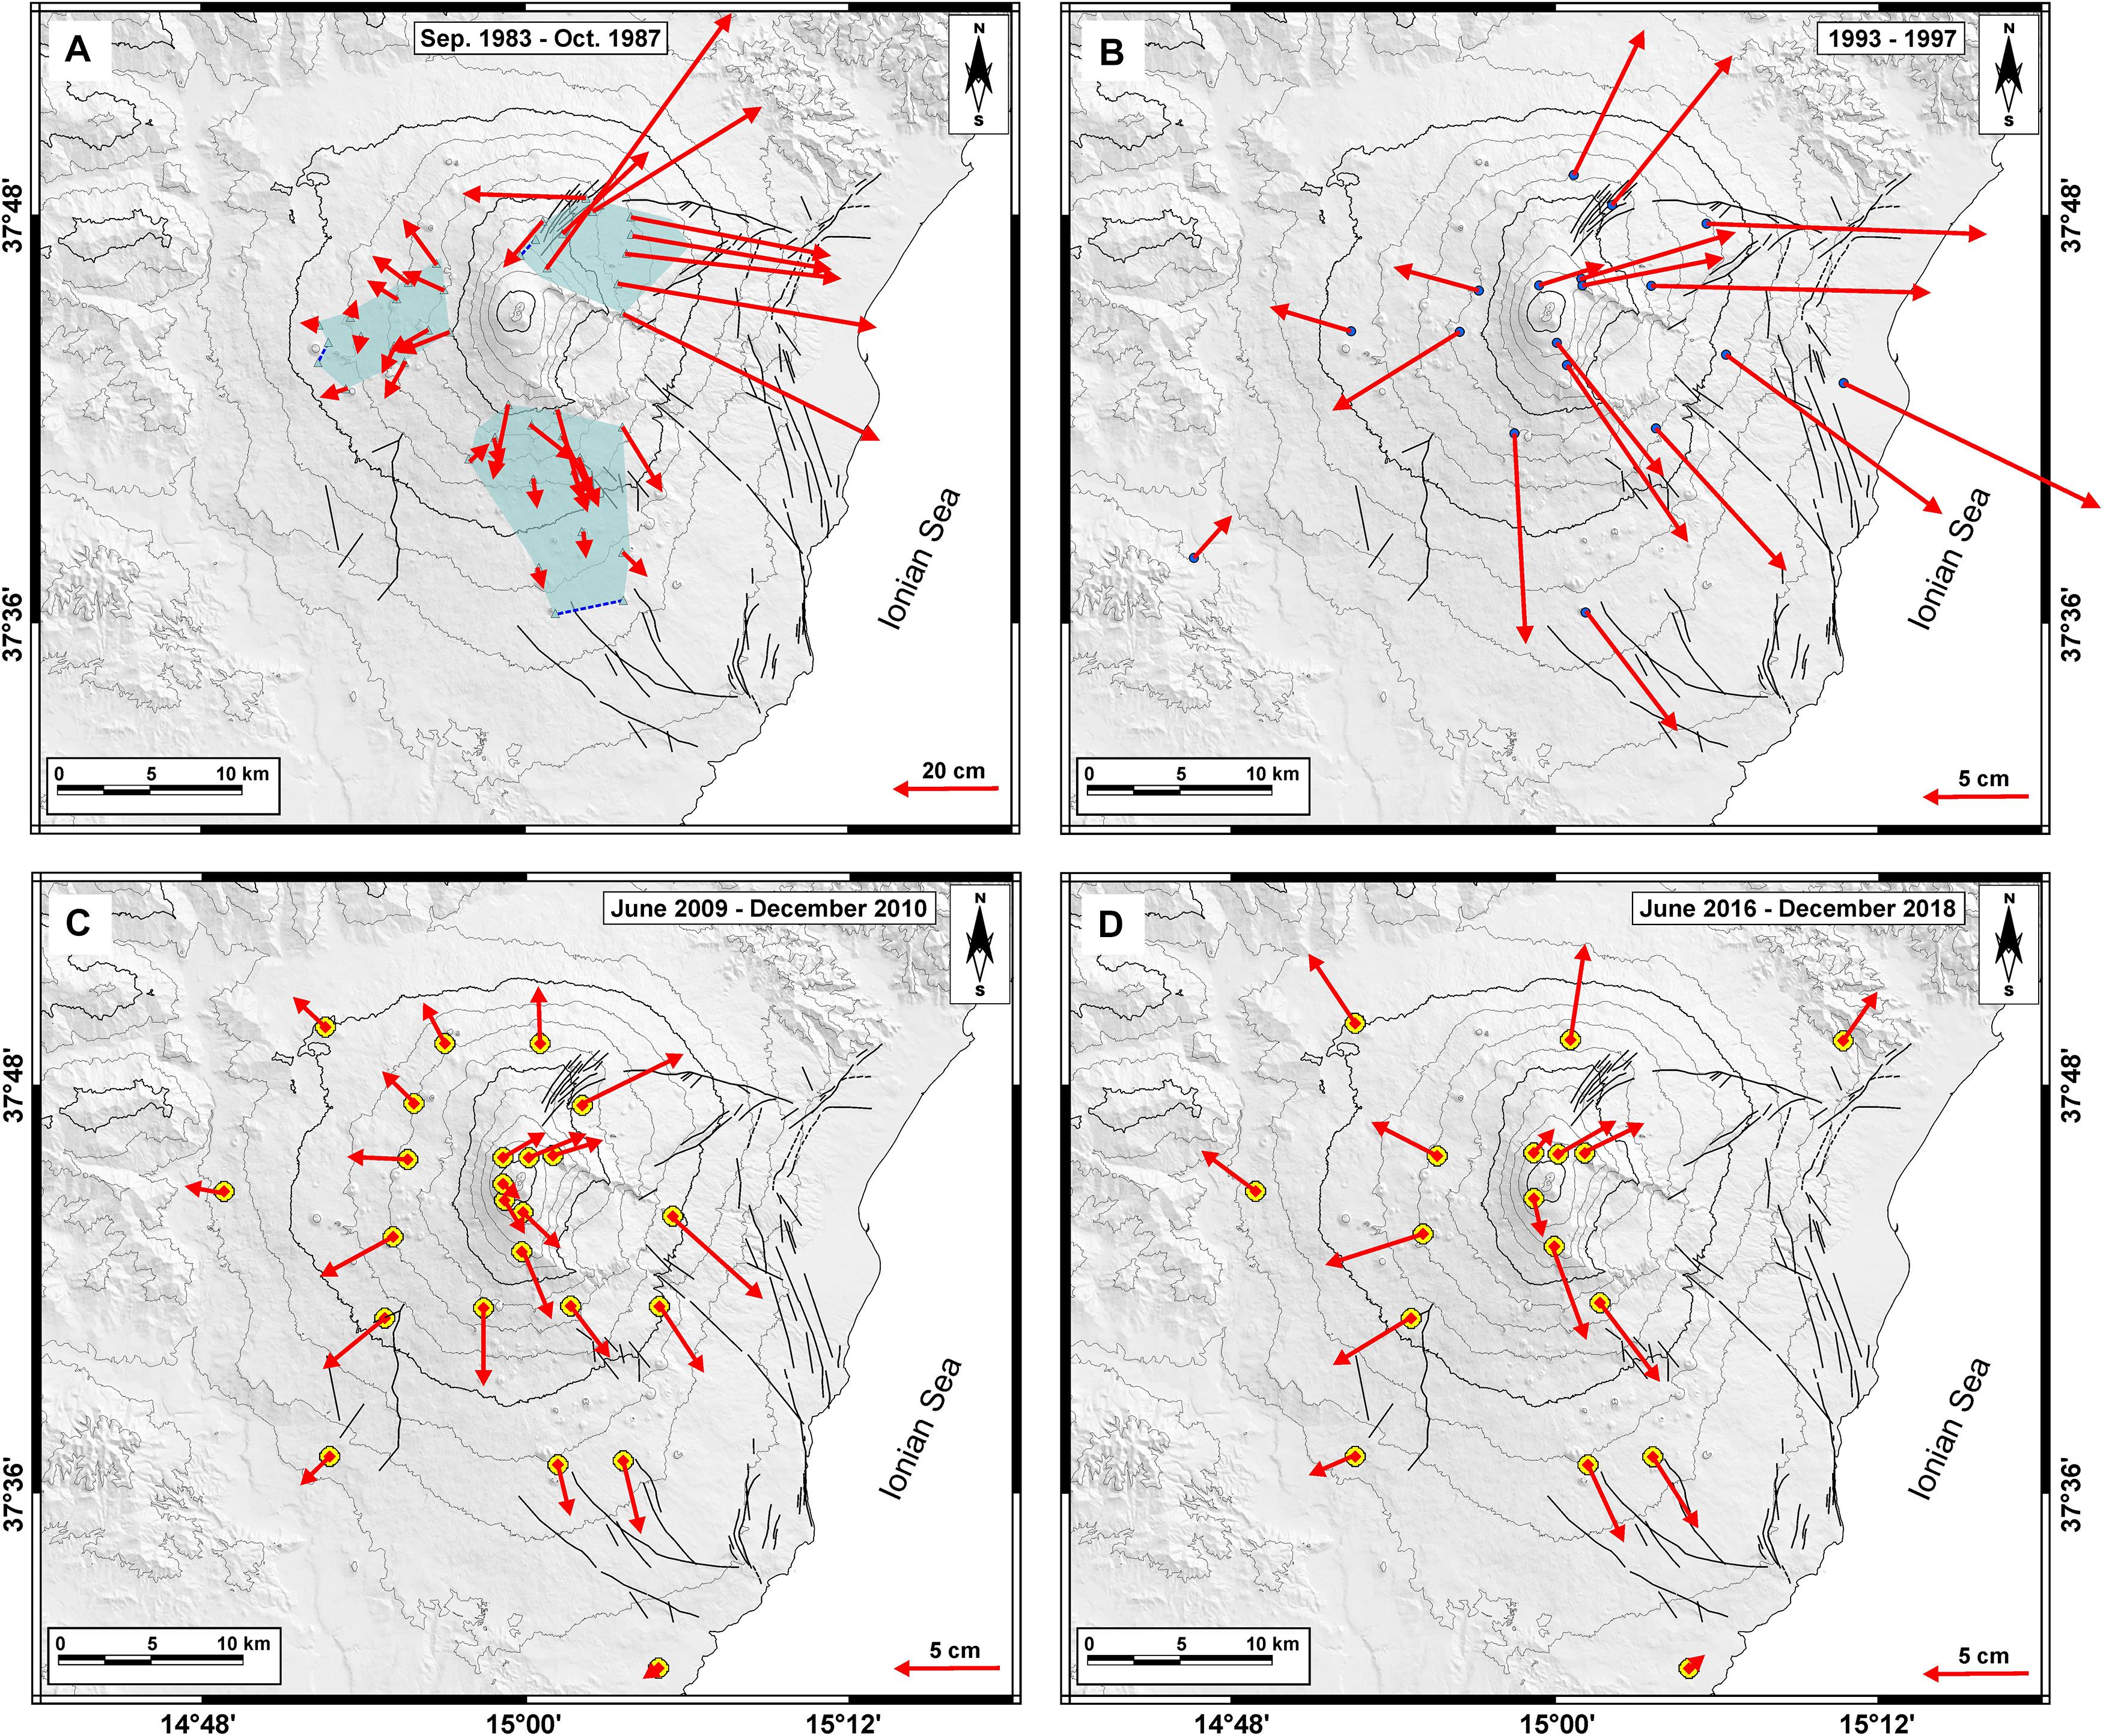
Figure 2. Displacement vector patterns of inflation phases in different periods obtained by deformation geodetic monitoring networks. (A) 1983–1987 inflation and dominant eastern flank sliding from EDM measurements. (B) 1993–1997 inflation from GPS periodical measurements. (C) 2008–2009 and (D) 2016–2018 inflation from continuous GPS permanent network (CGPS).
The 1987–1991 recharge period preceded the major effusive eruption of 1991–1993, which for duration (473 days) and volumes emitted (∼240 × 106 m3) was the biggest of the last four centuries.
The 1991–1993 effusive eruption was accompanied by a re-equilibrium deflation phase (Bonaccorso, 1996), and after its end a new medium-long term recharging phase began and continued until 2001. This recharge phase from 1998 was also accompanied both by numerous summit and minor explosive eruptions (i.e., hundreds of modest lava fountains) and also by minor effusive eruptions, that is, modest lava flows from the summit crater area. The 1993–2001 recharging phase preceded the two closest major explosive-effusive eruptions of 2001 (24 days duration) and 2002–2003 (95 days duration), which erupted in total 30 × 106 m3 and 57.5 × 10⁶m3, respectively, of magma volumes of effusive-explosive activity (Allard et al., 2006; Tanguy et al., 2007; Bonaccorso and Calvari, 2013). A clear idea of the expansion of the edifice during this recharge phase is given by the displacement vectors deduced by the GPS discrete networks (Figure 2B) as noted in Bonaccorso et al. (2005) and Alparone et al. (2013).
The intrusion into the eastern flank of the 2002–2003 eruption also triggered a strong acceleration toward the east of the eastern sector which is subject to its own flank instability (i.e., Bonaccorso et al., 2006; Solaro et al., 2010). After the end of this eruption, three effusive flank eruptions occurred in 2004, 2006, and 2008–2009, each preceded by a short-term recharge/inflation phase, very modest for the 2008–2009 case (Bruno et al., 2012), and a subsequent deflation during their effusive course (Bonaccorso et al., 2006; Bonforte et al., 2008). These close eruptions occurred during the 2004–2008 period with a dominant marked sliding of the E flank (Bruno et al., 2012), and were interpreted as belonging to a single long-term re-equilibrium phase spanning from 2001 to 2010 following the long-term 1993–2001 recharge period (Bonaccorso et al., 2015a).
After the phase of mainly effusive eruptions from 2004 to 2009, during 2009–2010 there was another shorter, but marked recharging phase (Figure 2C), which preceded an extraordinary frequent explosive activity that in 2011–2015 was characterized by over 50 episodes of powerful lava fountains. Despite a mean average duration of a few hours for each episode, this phase produced a powerful explosive eruptive activity with associated lava flows generating an average volume of 2.5 × 10⁶ m3 emitted for each lava fountain. This activity formed a new main cone in the summit crater area, and in the period 2011–2014 it emitted a total volume (pyroclastic plus lava flows) of about 147.5 × 10⁶ m3 (De Beni et al., 2015). It is interesting to note that this erupted volume, despite being produced by the activity of about 50 episodes of short lava fountains over 3 years, is of the same order of magnitude as that emitted by the major flank effusive eruptions.
After this phase of strong explosiveness in 2016–2018 there was another recharge phase (Figure 2D) that preceded the short but powerful eruption in December 2018 (Calvari et al., 2020), which in particular with its intrusion promoted a new reprise of the acceleration of the sliding of the eastern flank (i.e., De Novellis et al., 2019; Aloisi et al., 2020; Mattia et al., 2020).
In general, during the inflation/deflation phases the average behavior of the volcano is well reflected in the deformation response of the western flank. This sector is the most representative since it is not involved in the large-scale flank instability that affects the SE and E flanks (i.e., Bonaccorso et al., 2004; Bruno et al., 2012). In this sector, baselines with a near N-S orientation are those that are most affected by the dilatation of the area during the inflation/deflation phases. In fact, under the action of an internal pressure source, the benchmarks moving in a near radial direction will generate extensions during inflation and contractions during deflation in the lines with near N-S direction, respectively. A graph of selected baseline of the SW network is reported in Figure 3.
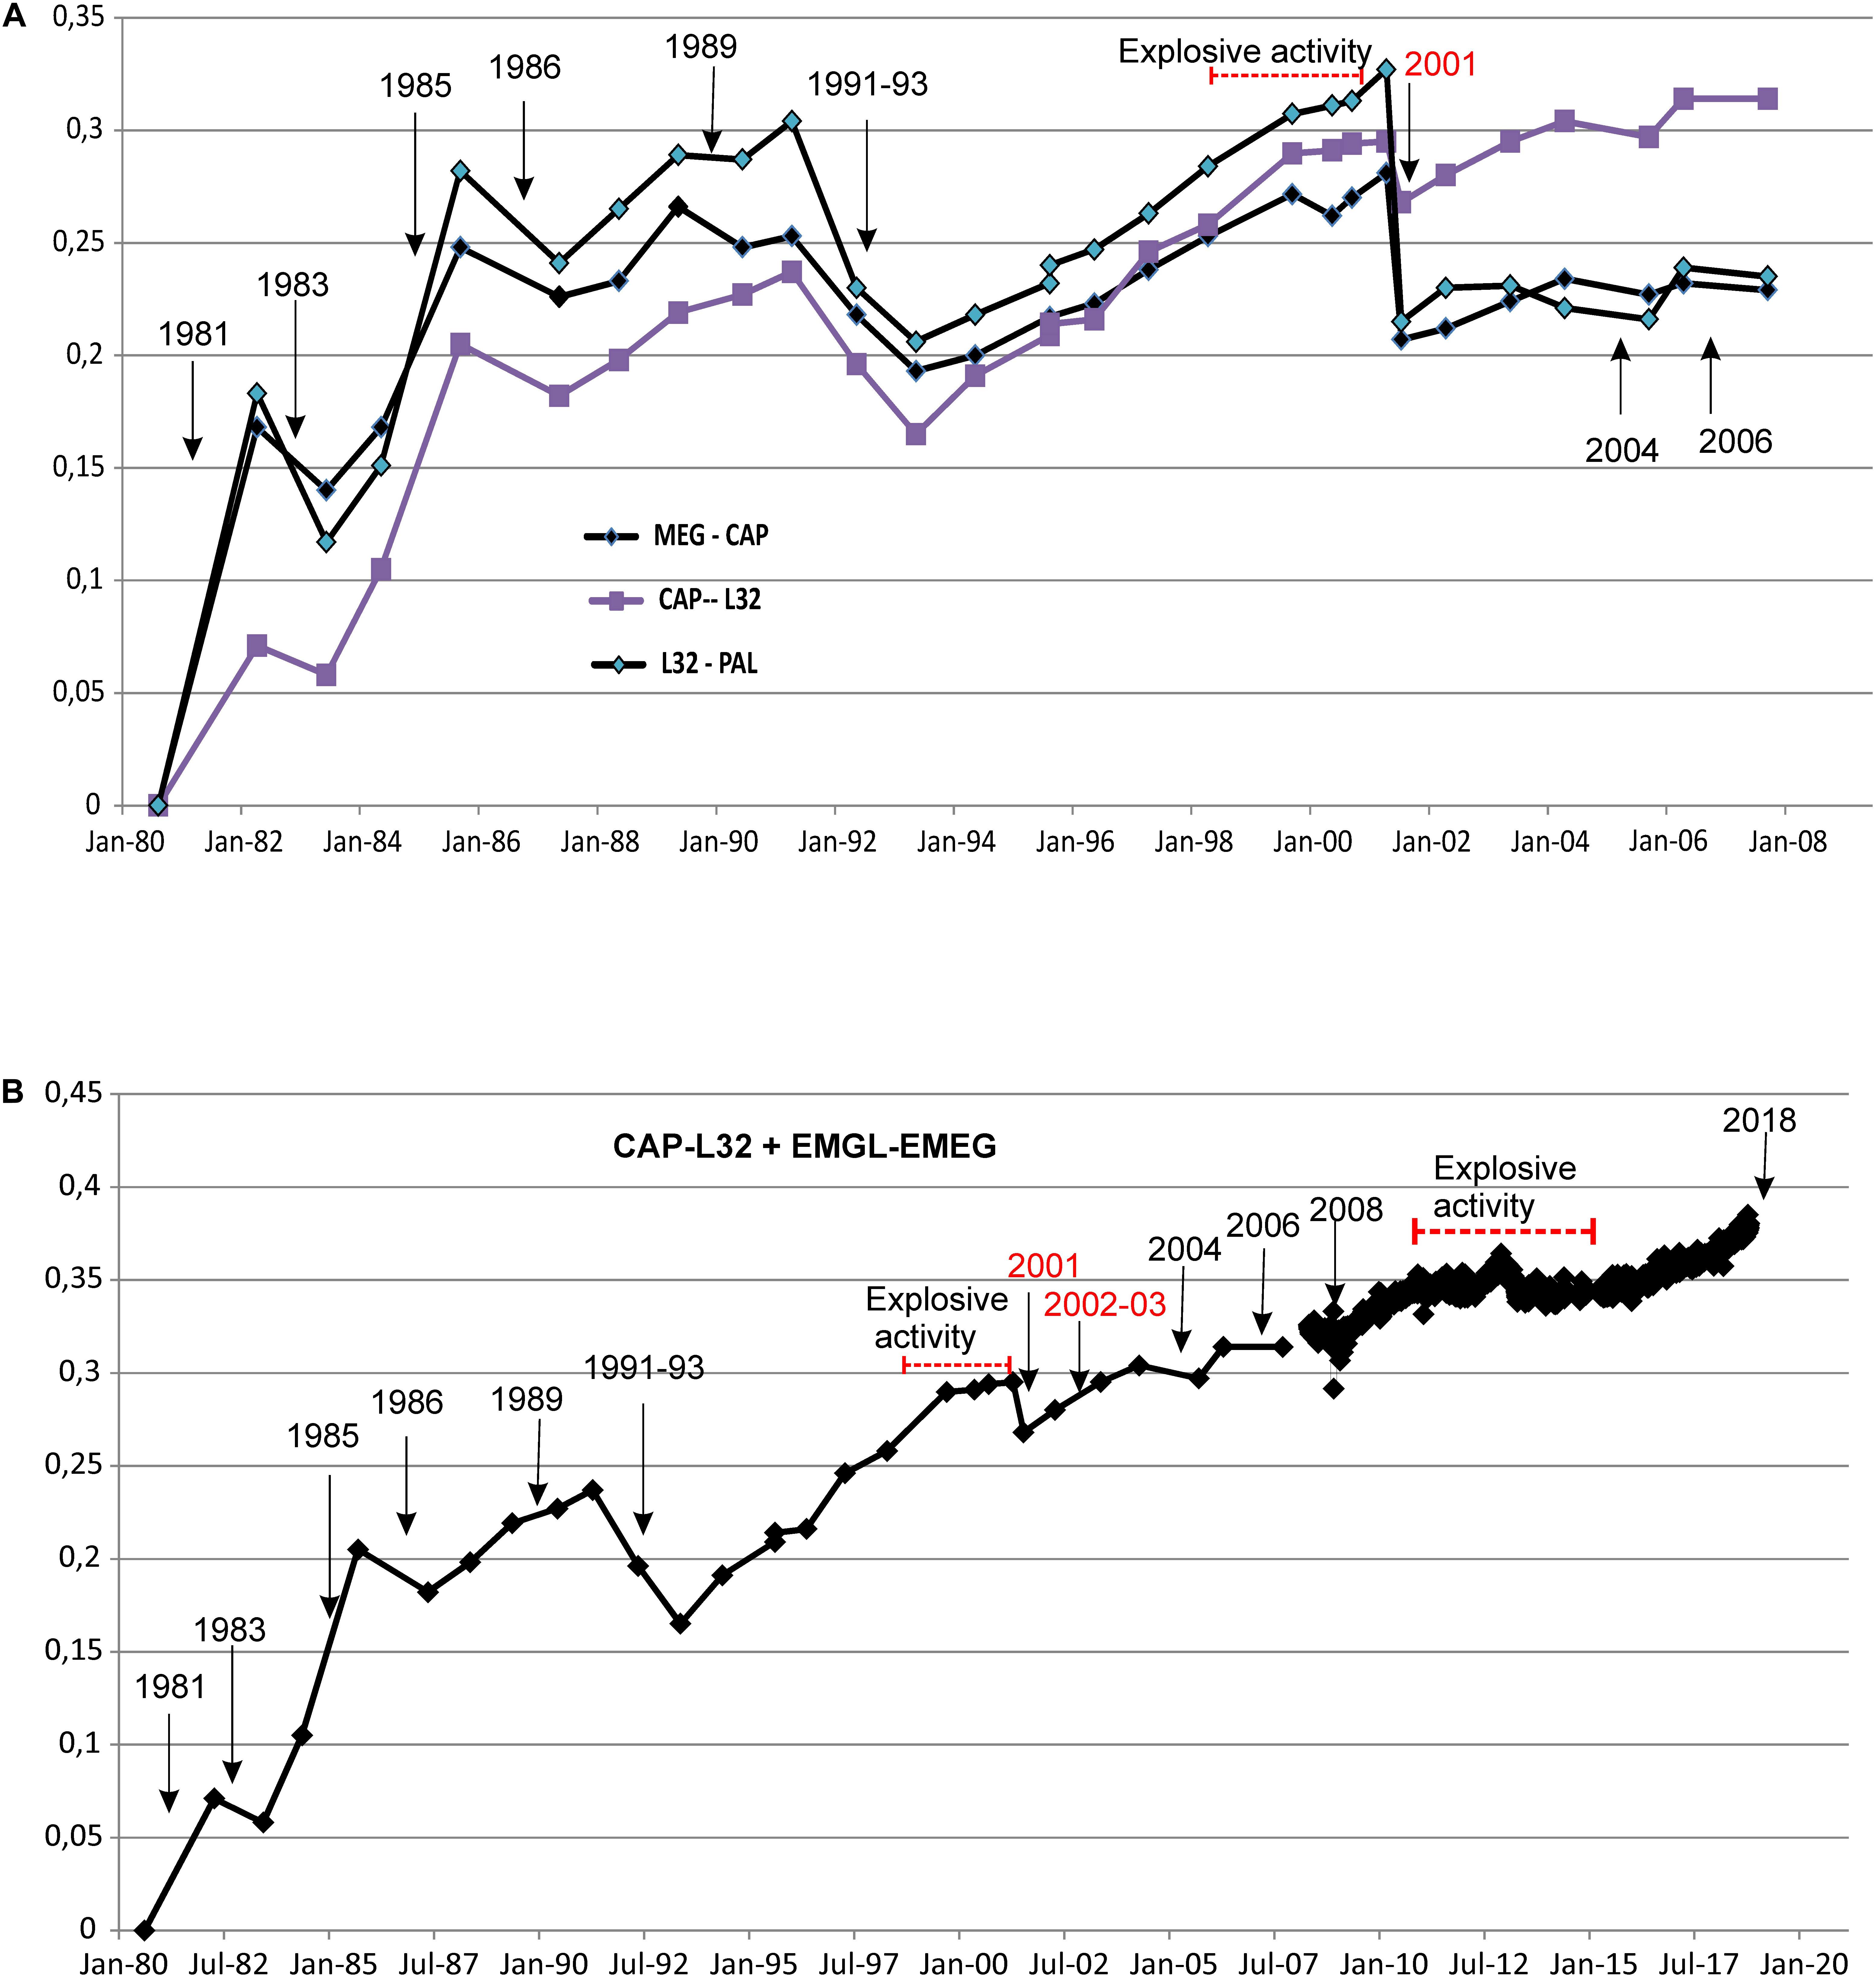
Figure 3. Baseline changes (m) over 40 years of measurements in the W flank of Etna volcano. (A) Selected EDM baselines striking in a near N-S direction in the time interval 1980–2007. (B) EDM baseline CAP-L32 from 1980 to 2007 continuing from 2007 to 2018 with the CGPS baseline EMEG-EMGL that is also in the western flank with similar direction. The arrows marking the main flank eruption are reported.
A further useful mean representation of the deformation frame can be provided by the analysis of the uniform strain tensor εij determined through the change of the baselines measured over time. This tensor characterizes the transformation state of the average deformation between two successive surveys. Applying the principle of infinitesimal strain, the length change ΔLij of the line Lij between the point I and J (Jaeger, 1969) is:
where δ is the angle between ij direction and x-axis. In particular, the ε11 and ε22 components represent the extension (in east–west and north–south directions, respectively, and their sum Δ = ε11 + ε22 represents the areal dilatation. This parameter is very useful for representing the expansion/contraction of the surveyed area when an inflation/deflation occurs.
A pattern of the areal dilatation over the last 40 years is shown in Figure 4. In the period from 1980 to 2007, which comprises the recharge phases from A to D (see Table 2), the areal dilatation of the EDM network in the western flank is traced. In the next period from 2007 to 2018, which comprises the recharge phases E and F (see Table 2), the dilatation of the CGPS triangle EMCN-ESLN-EMEG is added.
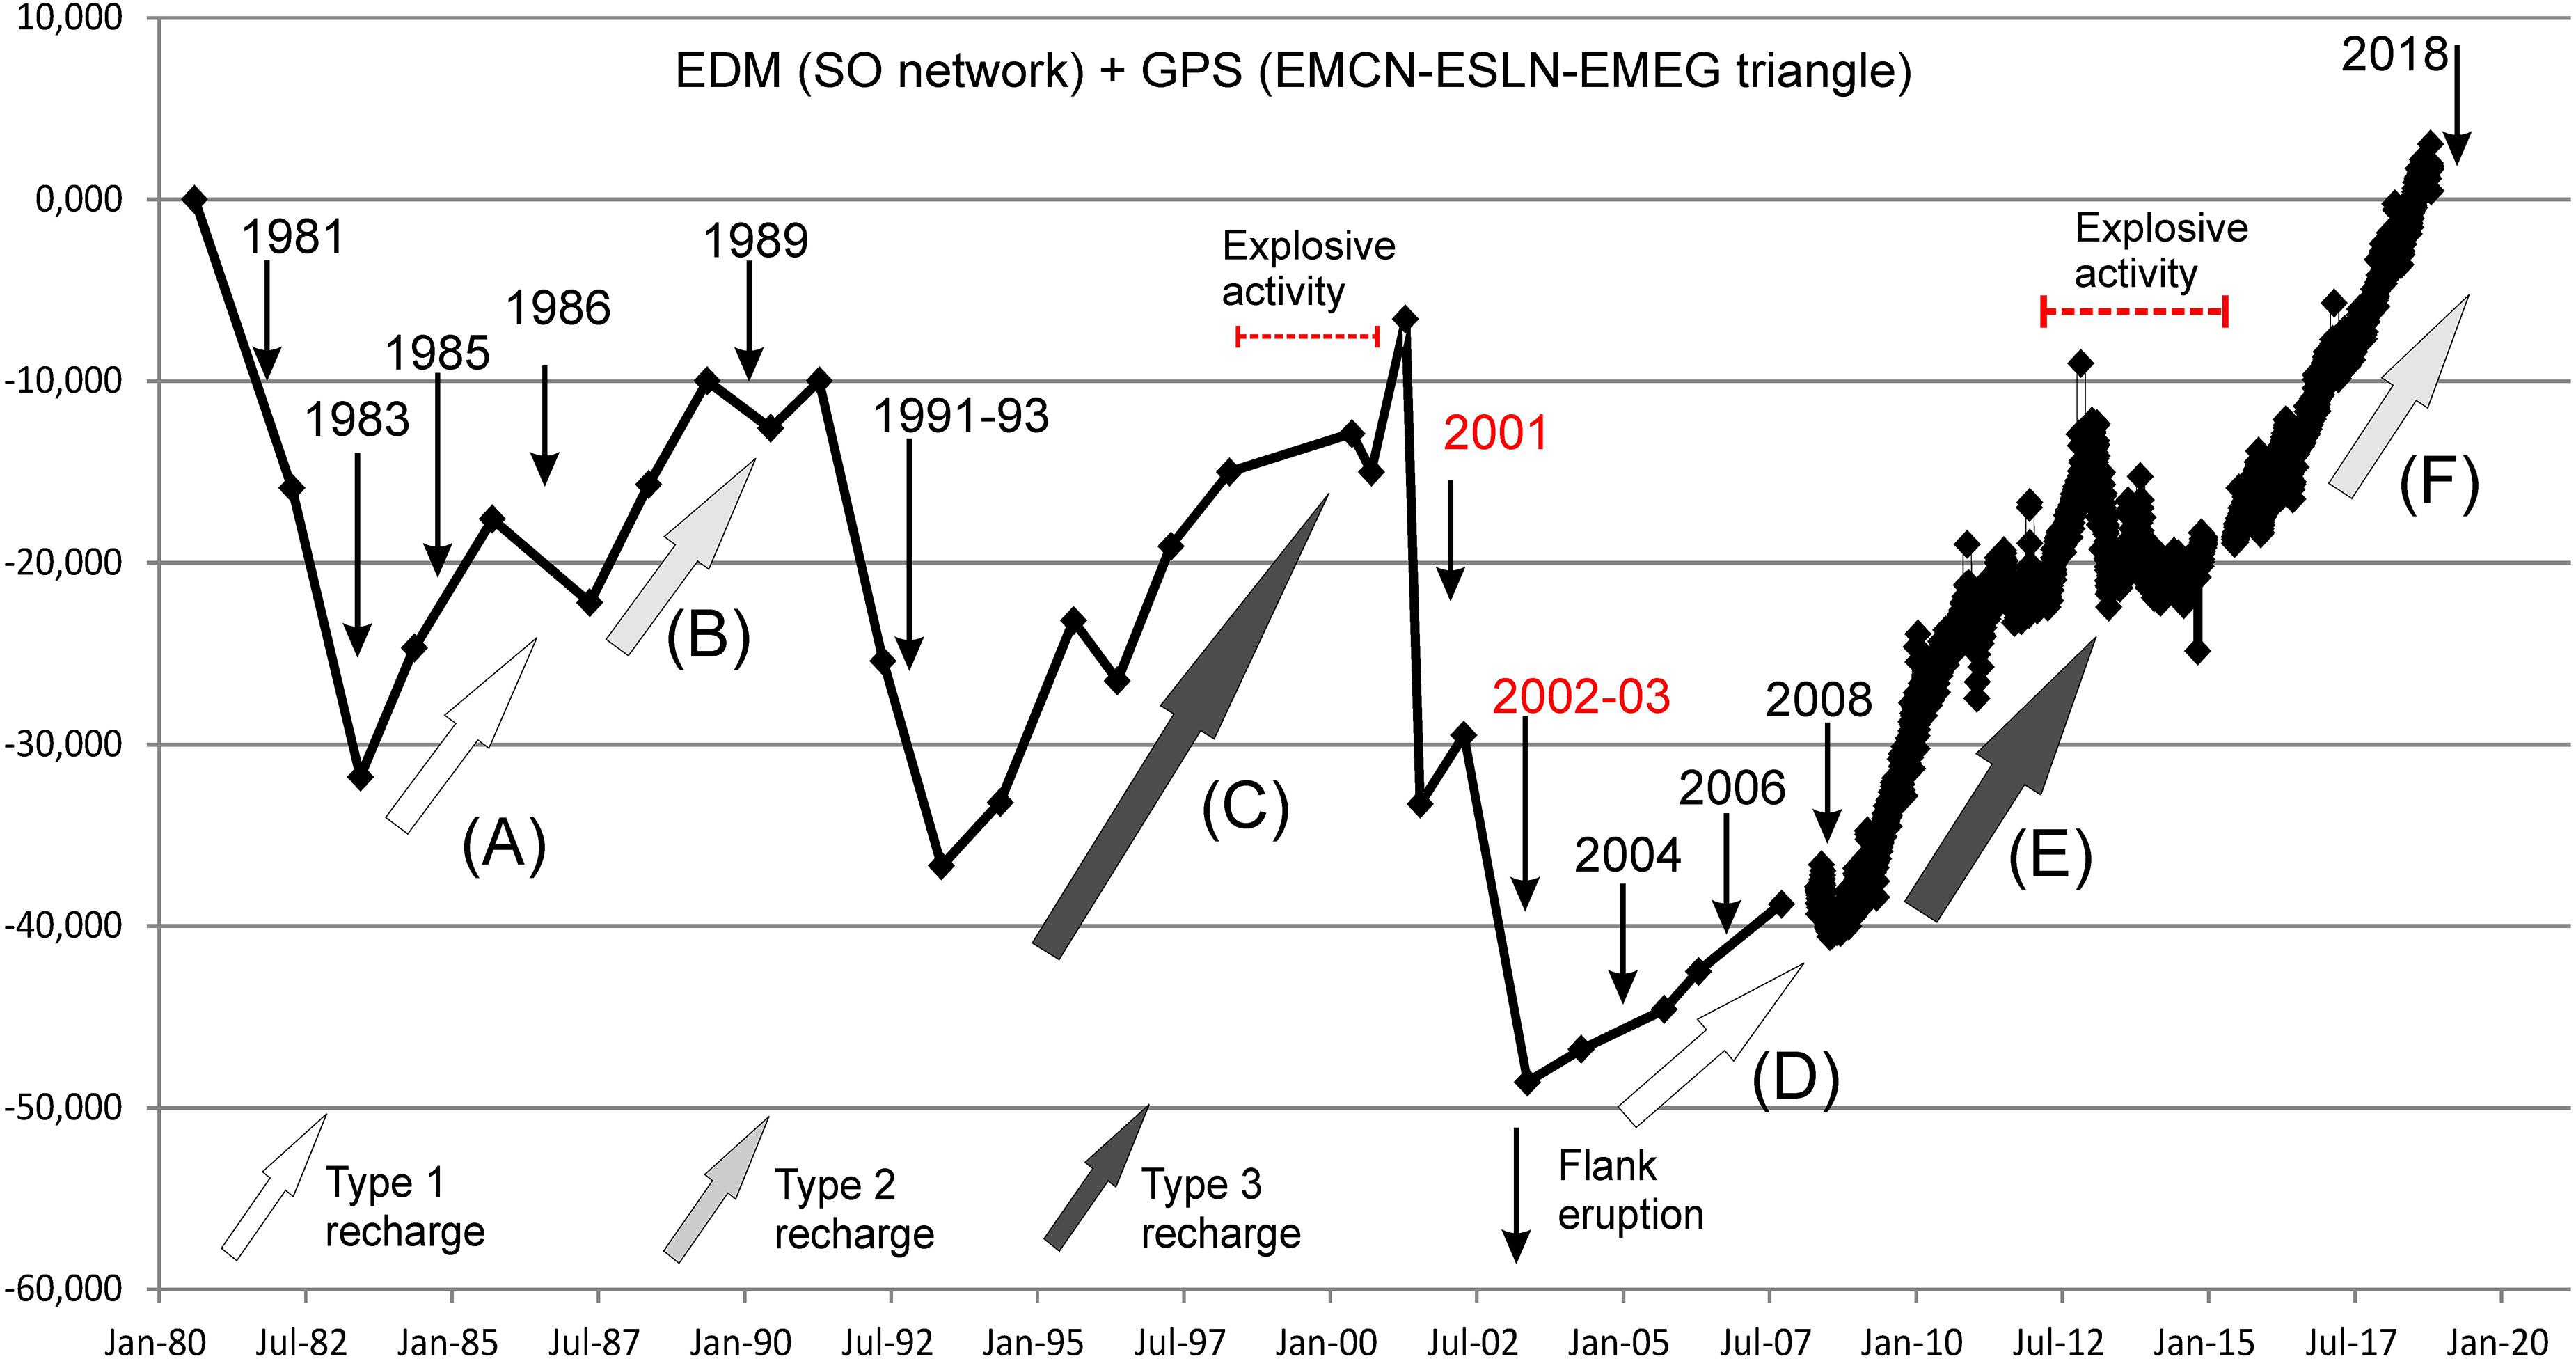
Figure 4. Areal dilatation (ppm) of the EDM network in the western flank from 1980 to 2007 comprising the recharge phases from A to D, and the dilatation from the CGPS triangle GPS EMCN-ESLN-EMEG from 2007 to 2018 comprising the recharge phases E and F (see Table 2). (A) 1983–1987. Recharge phase accompanied by close effusive eruptions and eastern flank marked sliding (inflation type 1). (B) 1987–1991. Long-term recharge phase before the main effusive 1991–1993 eruption (inflation type 2). (C) 1994–2001. Long-term recharge phase preceding the two main effusive-explosive 2001 and 2002–2003 eruptions (inflation type 3). During C1–C3 (1993–1997) a marked source deepening is inferred. (D) Recharge phase accompanied by close effusive eruptions and eastern flank marked sliding (inflation type 1). (E) Recharge phase preceding the 2011–2015 explosive activity (inflation type 3). (F) Recharge phase preceding the December 2018 brief eruption (inflation type 2).
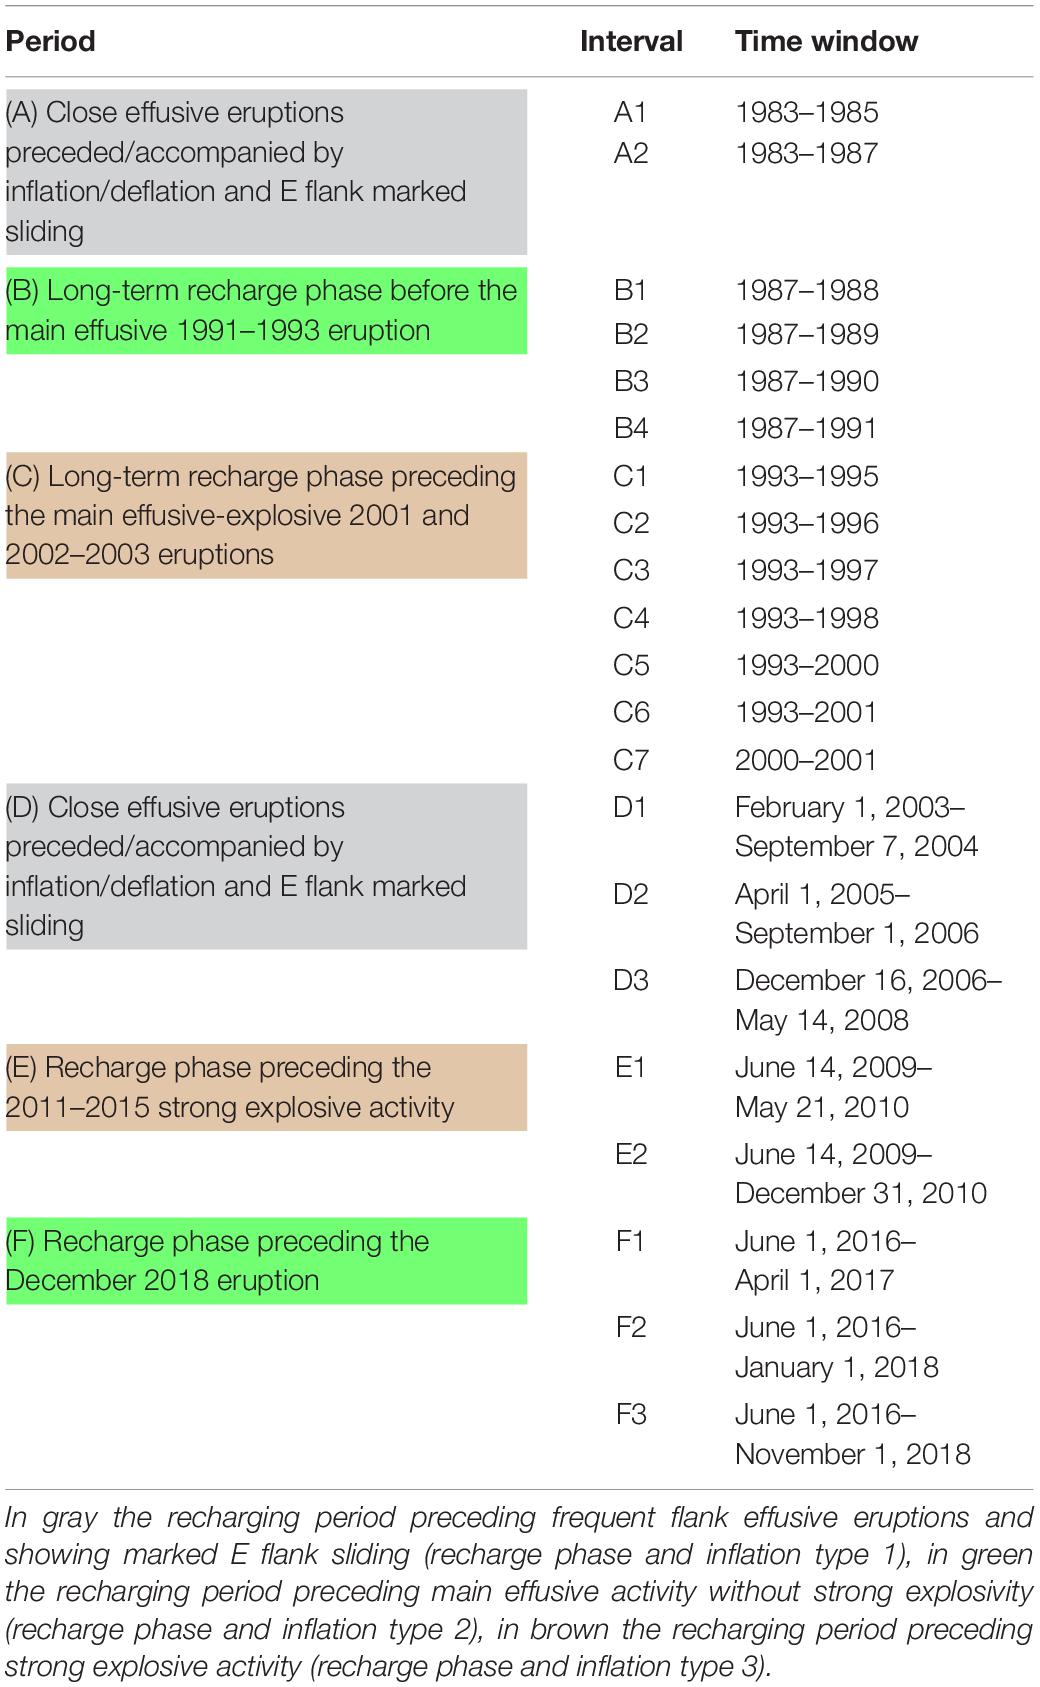
Table 2. Period and interval of the modeled recharge phases.
In our study, we analyzed six main recharging periods by tracking over time the position of the deformation source within each time interval (Table 2). In particular, the two main recharge periods 1987–1991 (recharge B) and 1993–2001 (recharge C) lasted longer and preceded the two main powerful effusive (eruption 1991–1993) and effusive-explosive eruptions (eruptions 2001 and 2002–2003), respectively. We also considered the periods with a marked eastern flank sliding 1983–1997 (recharge A) and 2003–2008 (recharge D), and the two most recent and shorter recharge periods that in 2009–2010 (E) and 2016–2018 (F) preceded the explosive activity of 2011–2015 and the eruption of December 2018, respectively (Table 2 and Figure 4). The recharging phases can be grouped into three types: the recharging period preceding frequent flank effusive eruptions and showing marked E flank sliding such as the A and D phases (recharge phase and inflation type 1); the recharging period preceding main effusive activity without strong explosivity such as B and F phases (recharge phase and inflation type 2); the recharging period preceding strong explosive activity such as C and D phases (recharge phase and inflation type 3) (Table 2 and Figure 4).
For each deformation period (Table 2), we considered the baseline length changes measured at the EDM and GPS networks. Besides representing a uniform set of measurements, baseline changes are not affected by possible biases in the choice of a local reference system. In addition, for the GPS case they show lower levels of noise than the single components, and therefore directly inverting baseline changes can represent a robust method to constrain a model (Aloisi et al., 2018). In our inversions we used: only the EDM baseline for the period from 1980 to 1991, both EDM and periodic GPS measurements for the period from 1993 to 2001 and, finally, the data of the GPS permanent network for the period from 2003 to 2018 (Table 3). In general, we do not consider the GPS stations located on the lower eastern flank of the volcano because of the marked ESE-ward sliding motion of the eastern flank, which is not directly linked to the magma recharging/discharging processes (for a review see, i.e., Aloisi et al., 2011; Murray et al., 2018). Moreover, taking homogeneous data sets for each recharging period into consideration allows following in the variation over time of the source position in a robust way.
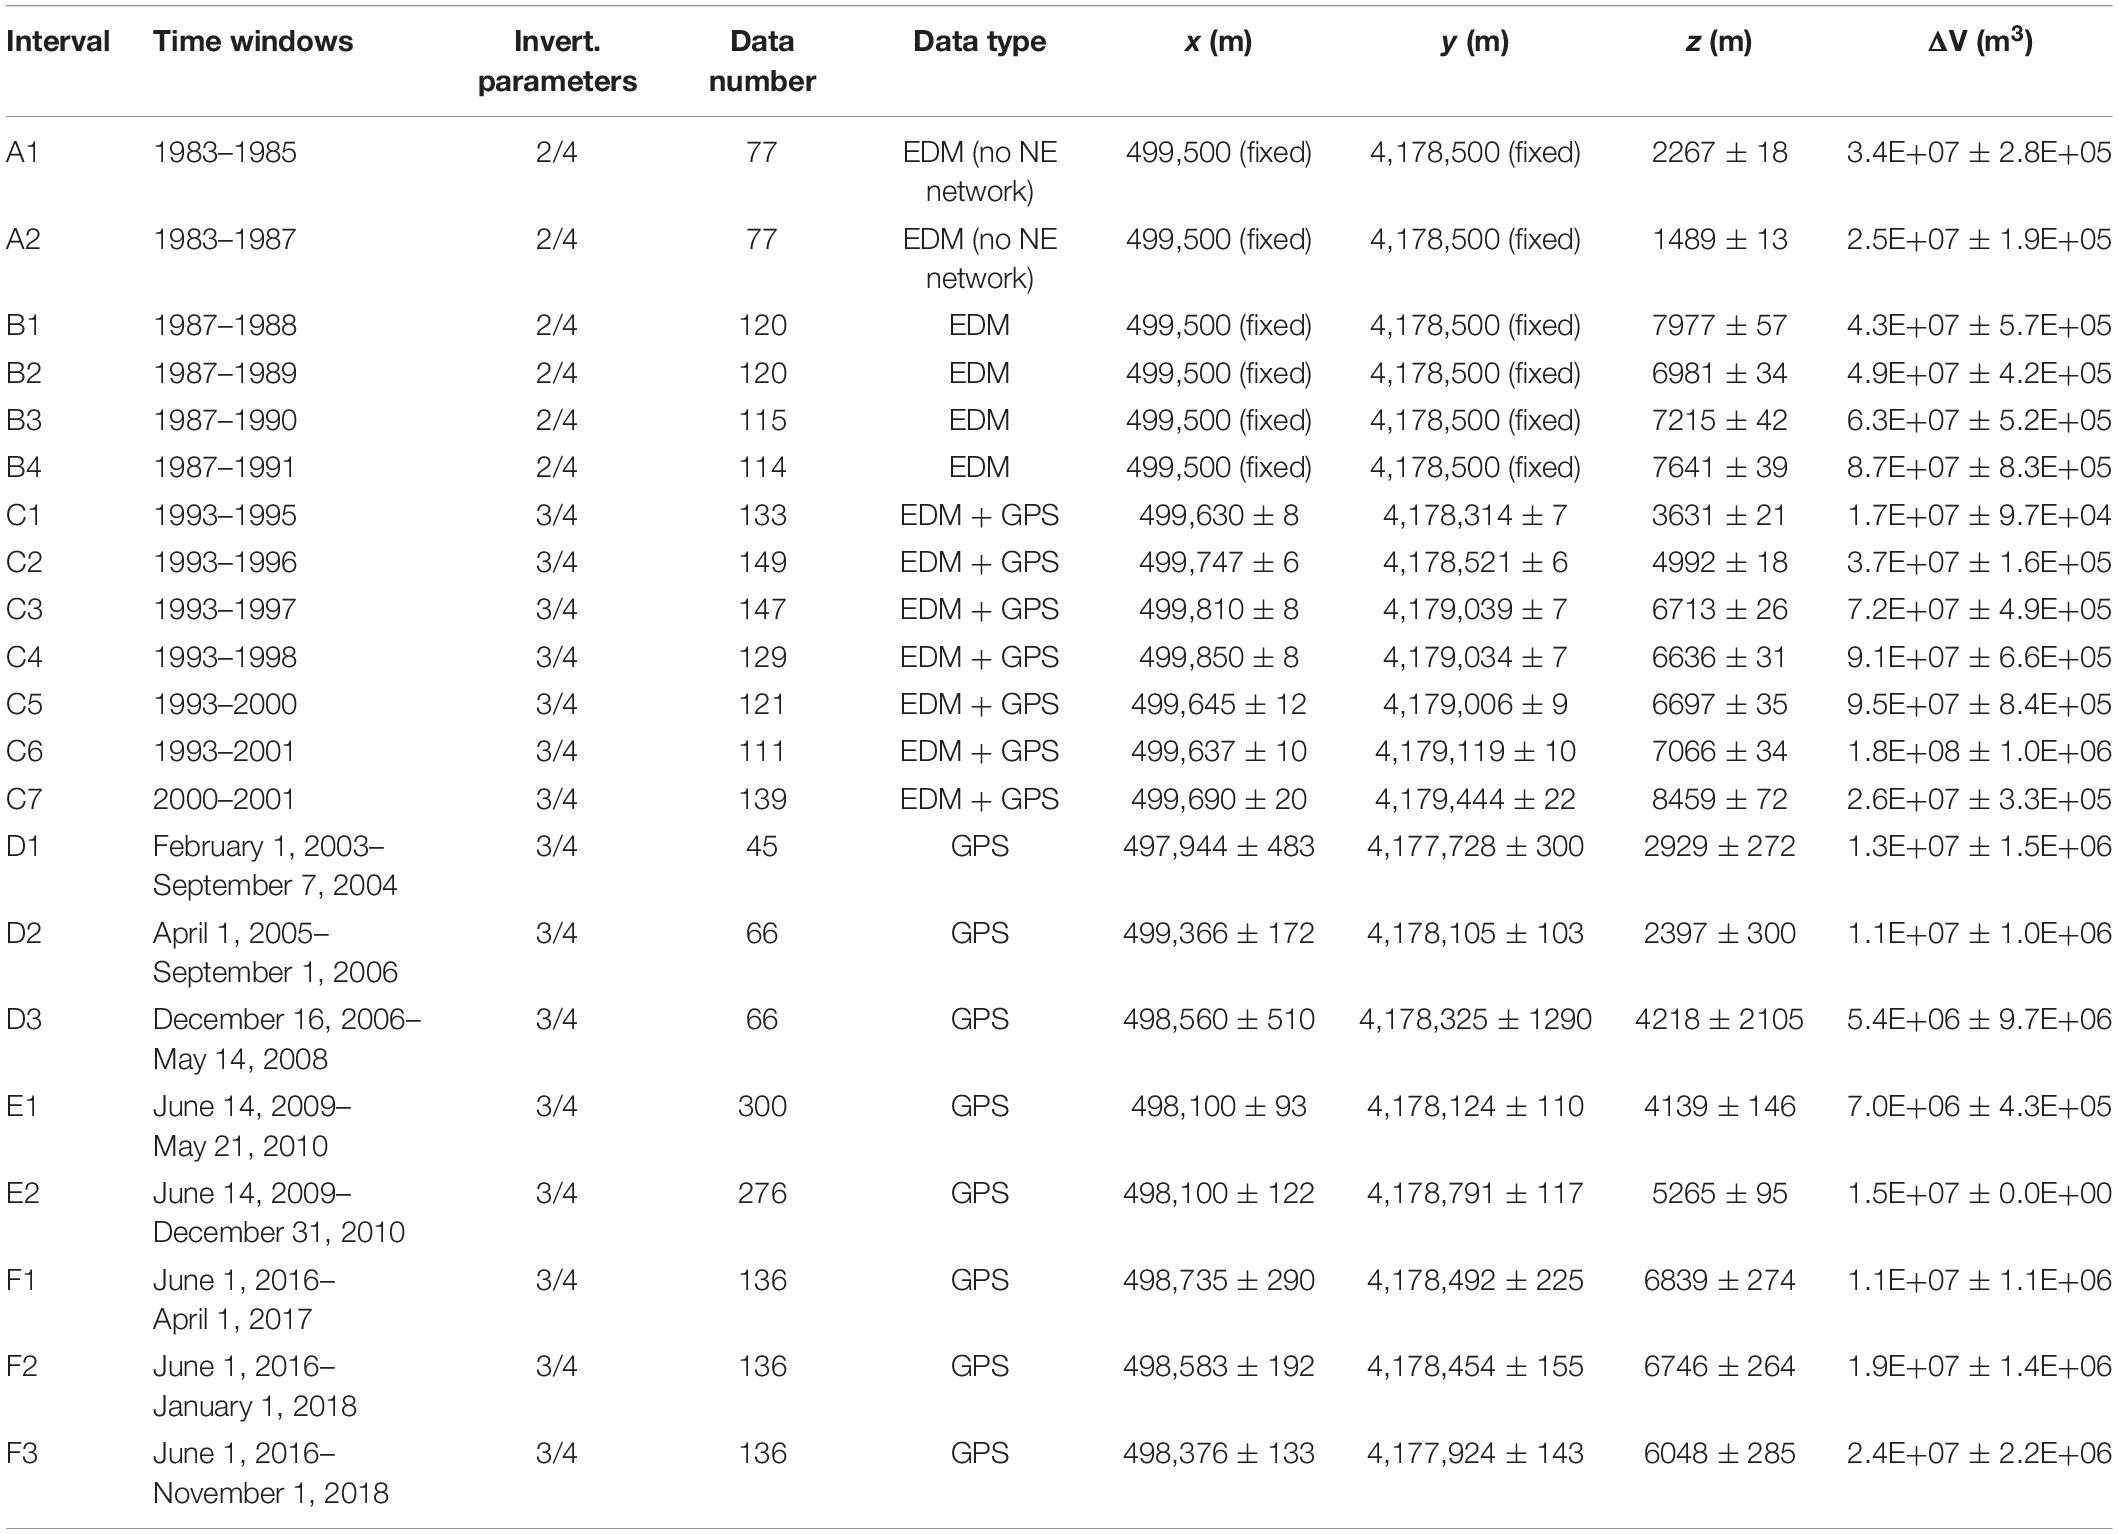
Table 3. Number and type of observables, inverted source parameters, and associated errors for the pressure sources estimated in this study.
For these selected recharge periods we applied analytical inversions of the EDM and/or GPS baseline changes (Cannavò, 2019), using as deformation source a finite spherical magma body embedded in a homogeneous medium following the solution of McTigue (1987). This simple but effective source model shows a good trade-off between the number of degrees of freedom and the obtained data fit. The deformation source is described by four parameters: the coordinates of its center (x, i, and z) and the volume change of the source ΔV. This simple model avoids the trade-off problem between overpressure and elastic rigidity module and can be used to robustly infer the mean position of the centroid of the pressurizing/depressurizing sources (Tiampo et al., 2000). From 1983 to 1991 only EDM baselines are available. For the phases of this time interval, we decided to fix the planar coordinates x and y of the pressure source in the crater area where the magmatic sources are usually inferred. In fact, in this case, there are no baselines connecting the three EDM networks and, therefore, the x and y parameters are not well constrained.
For a Poisson’s ratio of ν equal to 0.25, the elasticity equations for the expanding spherical source in an infinite half-space are:
where Ux,y,z are the displacements in the x, y, or z directions, x and y are the horizontal distance in the x and y direction from the center of the source, z is the depth of the source center, R2 = x2 + y2 + z2.
Model parameters were estimated performing an inversion by using the Pattern Search technique (Lewis and Torczon, 1999) together with a local Genetic Algorithm Search (Goldberg, 1989), followed by a non-linear least squares inversion to further refine the solution (Cannavò, 2019). The uncertainties of the model parameters were estimated adopting a Jackknife re-sampling method (Efron, 1982; Cannavò, 2019). The effects of the topography were taken into account by using the method of Williams and Wadge (2000). The medium was assumed to be homogeneous and isotropic with a Poisson ratio of 0.25.
In Table 2 the analyzed six recharging periods are reported with a brief description of the following volcanic activity. In Table 3, for each temporal sub-interval, we reported the obtained source’s position, the volume change and the associated errors, the number of observables (i.e., the baselines inverted) and the measurement technique used.
Just as an example to show the goodness of the obtained fit, in Figure 5 we reported a comparison between recorded (dark gray) and modeled (light gray) baselines for the 1993–1998 sub-interval. This phase has a pressure source located in the medium zone of the plumbing system (about 6.5 km b.s.l.). Moreover, for this sub-interval, both EDM and GPS measurements were inverted, and we obtained a standard deviation of about 0.03 (m) using 129 baselines varying from −0.02 to +0.25 (m).
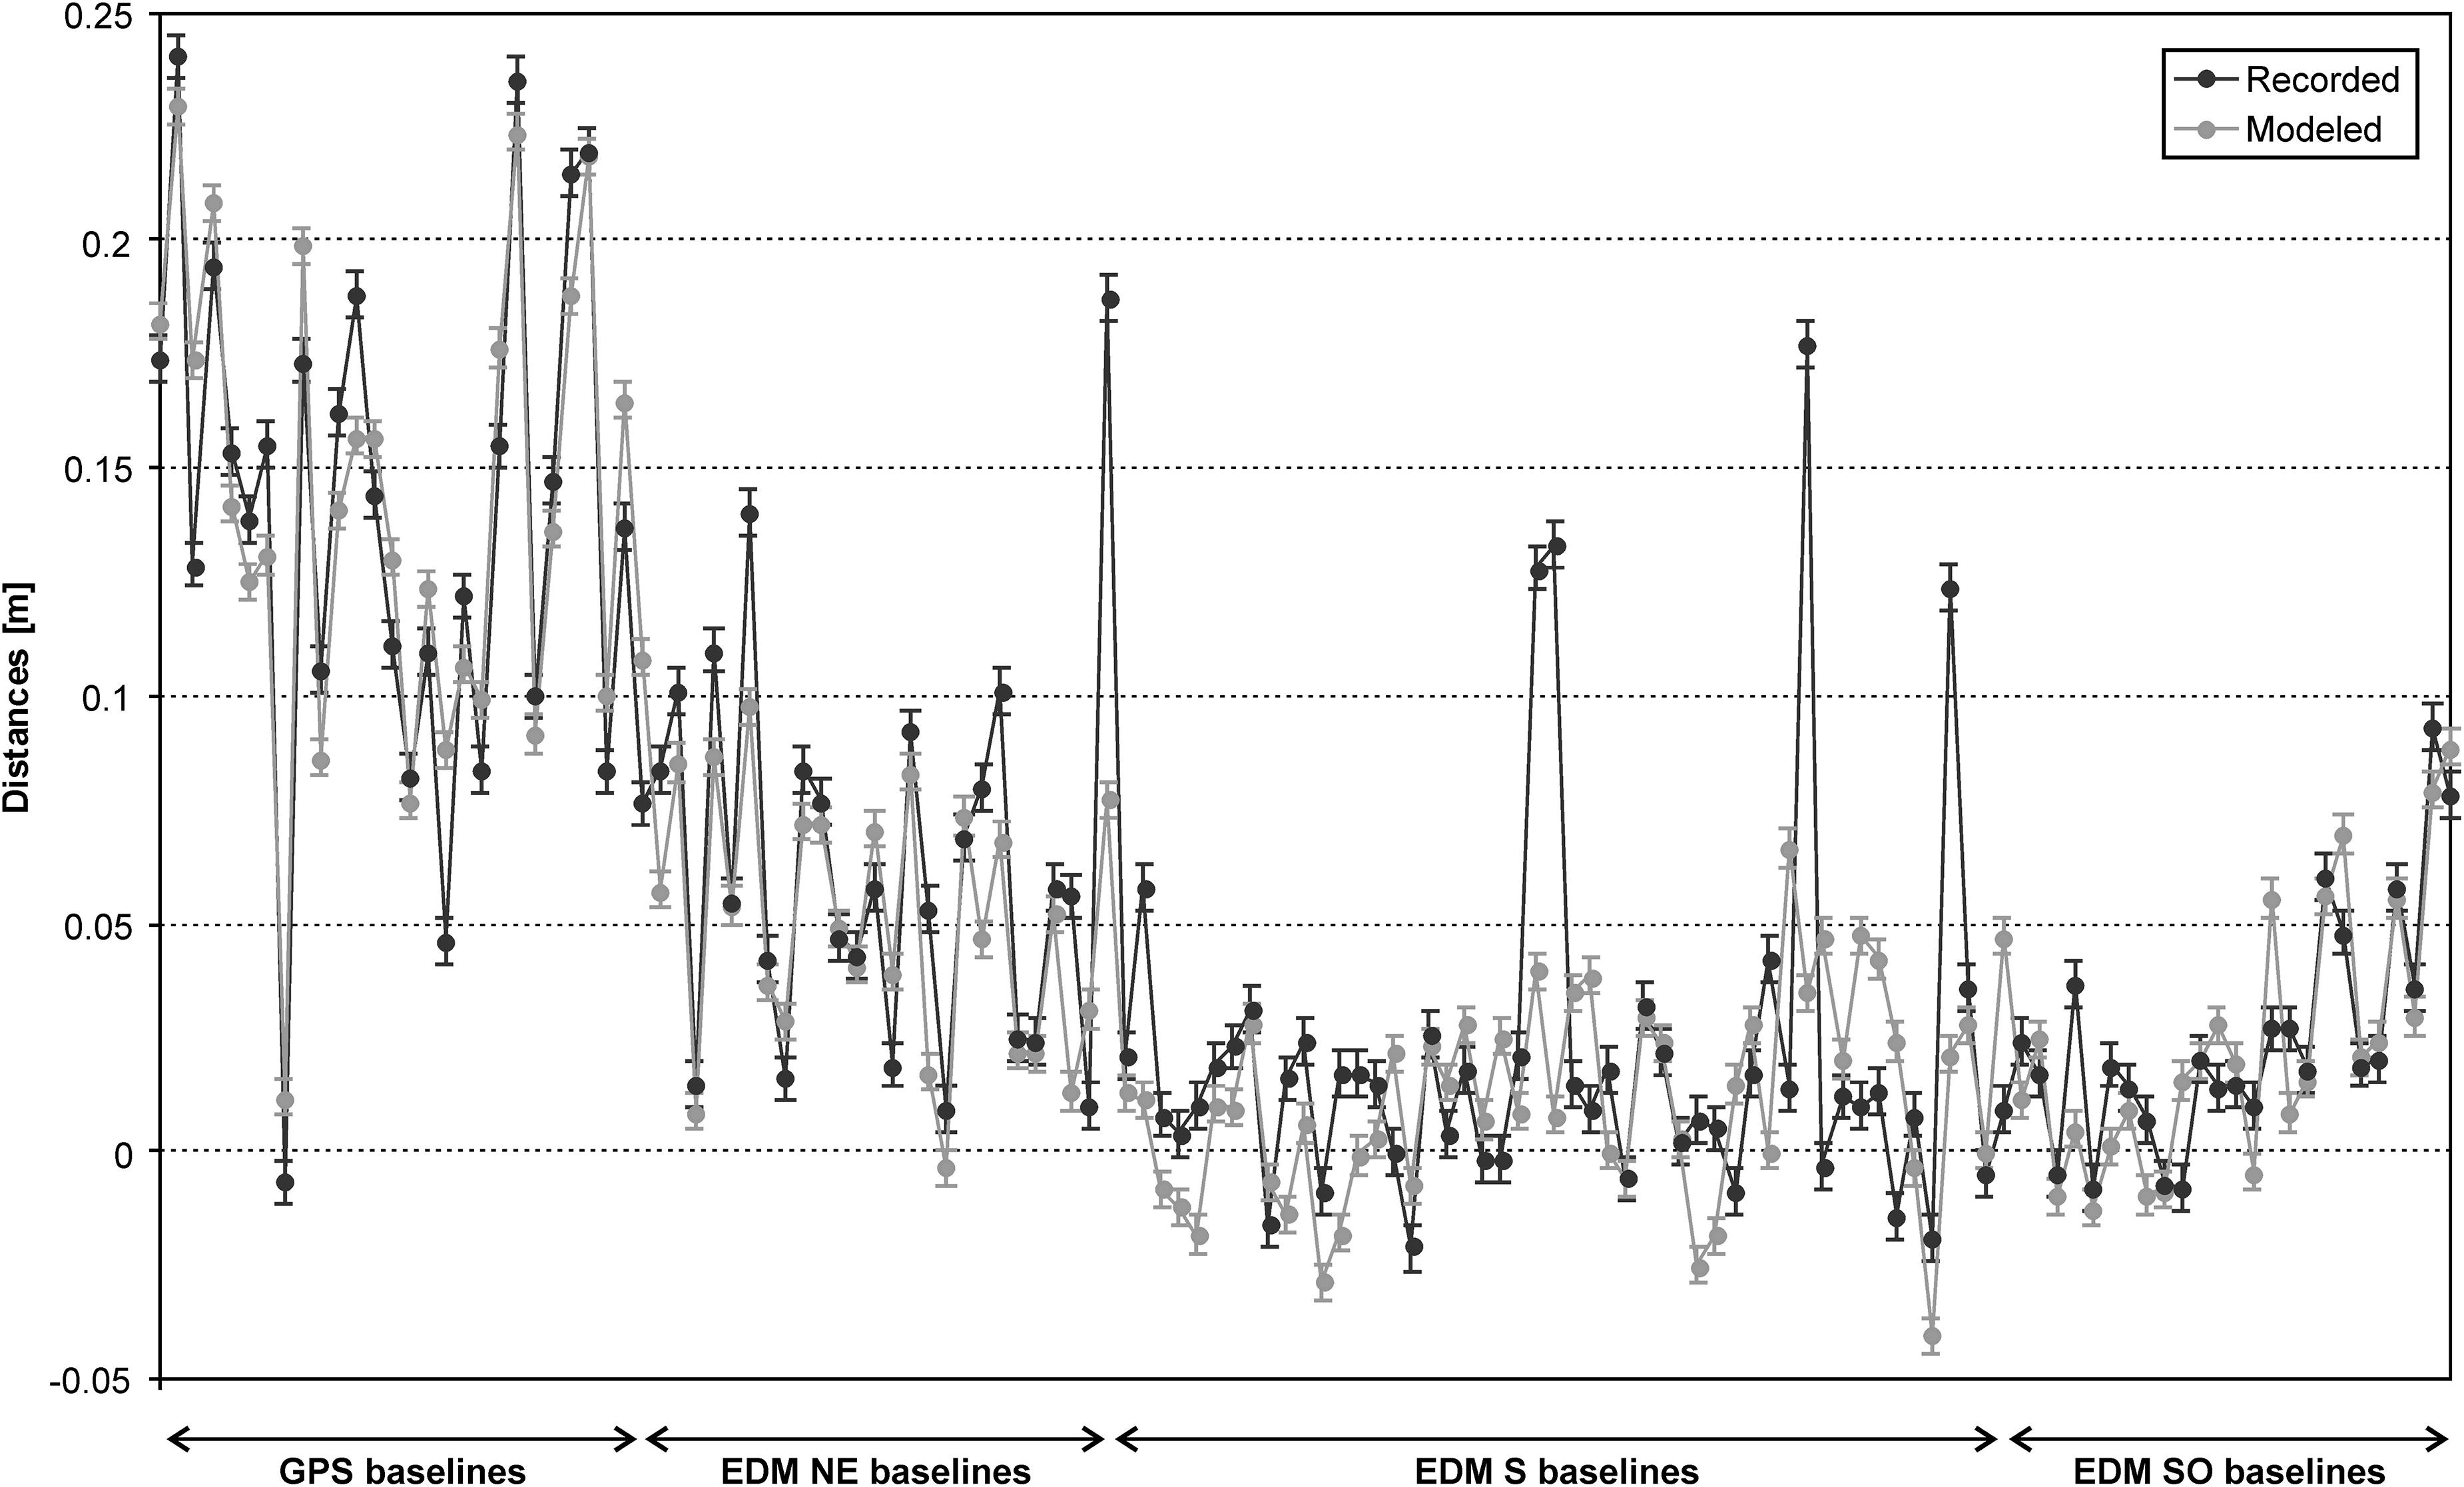
Figure 5. Comparison between recorded (dark gray) and modeled (light gray) baseline changes (m) for the 1993–1998 sub-interval (C4 in Table 2).
Over the past 40 years, Mt. Etna volcano has been characterized by a steady trend of ∼25 Mm3/year of magma input which has been balanced by magma output through numerous eruptions (Bonaccorso and Calvari, 2013). The eruptive phases were preceded by the recharge characterized by inflation and then were accompanied by deflation during the eruptions, as detected by the deformation monitoring (Figure 4). Therefore, at Etna it seems clear that the primary action producing the inflation/deflation cycle is characterized by the arrival and accumulation of new magma followed by the subsequent magma discharge during the eruptions (Figure 4).
An open and very interesting question is whether the eruptive typology could be distinguished during the recharging phase, that is, if the next eruption will be purely effusive or with an explosive nature. In particular, in this work we investigated this issue through an analysis of the position of the source during the recharging phases. In the past, several studies have investigated and modeled the storage sources that produce inflation/deflation on Etna mainly for the cases that preceded/accompanied single eruptions. A summary table of the literature results has been presented by Bonforte et al. (2008) and Aloisi et al. (2011). An updated version, obtained by adding the results of this present study, is shown in Table 4. Recharging source positions are shown in Figure 6.
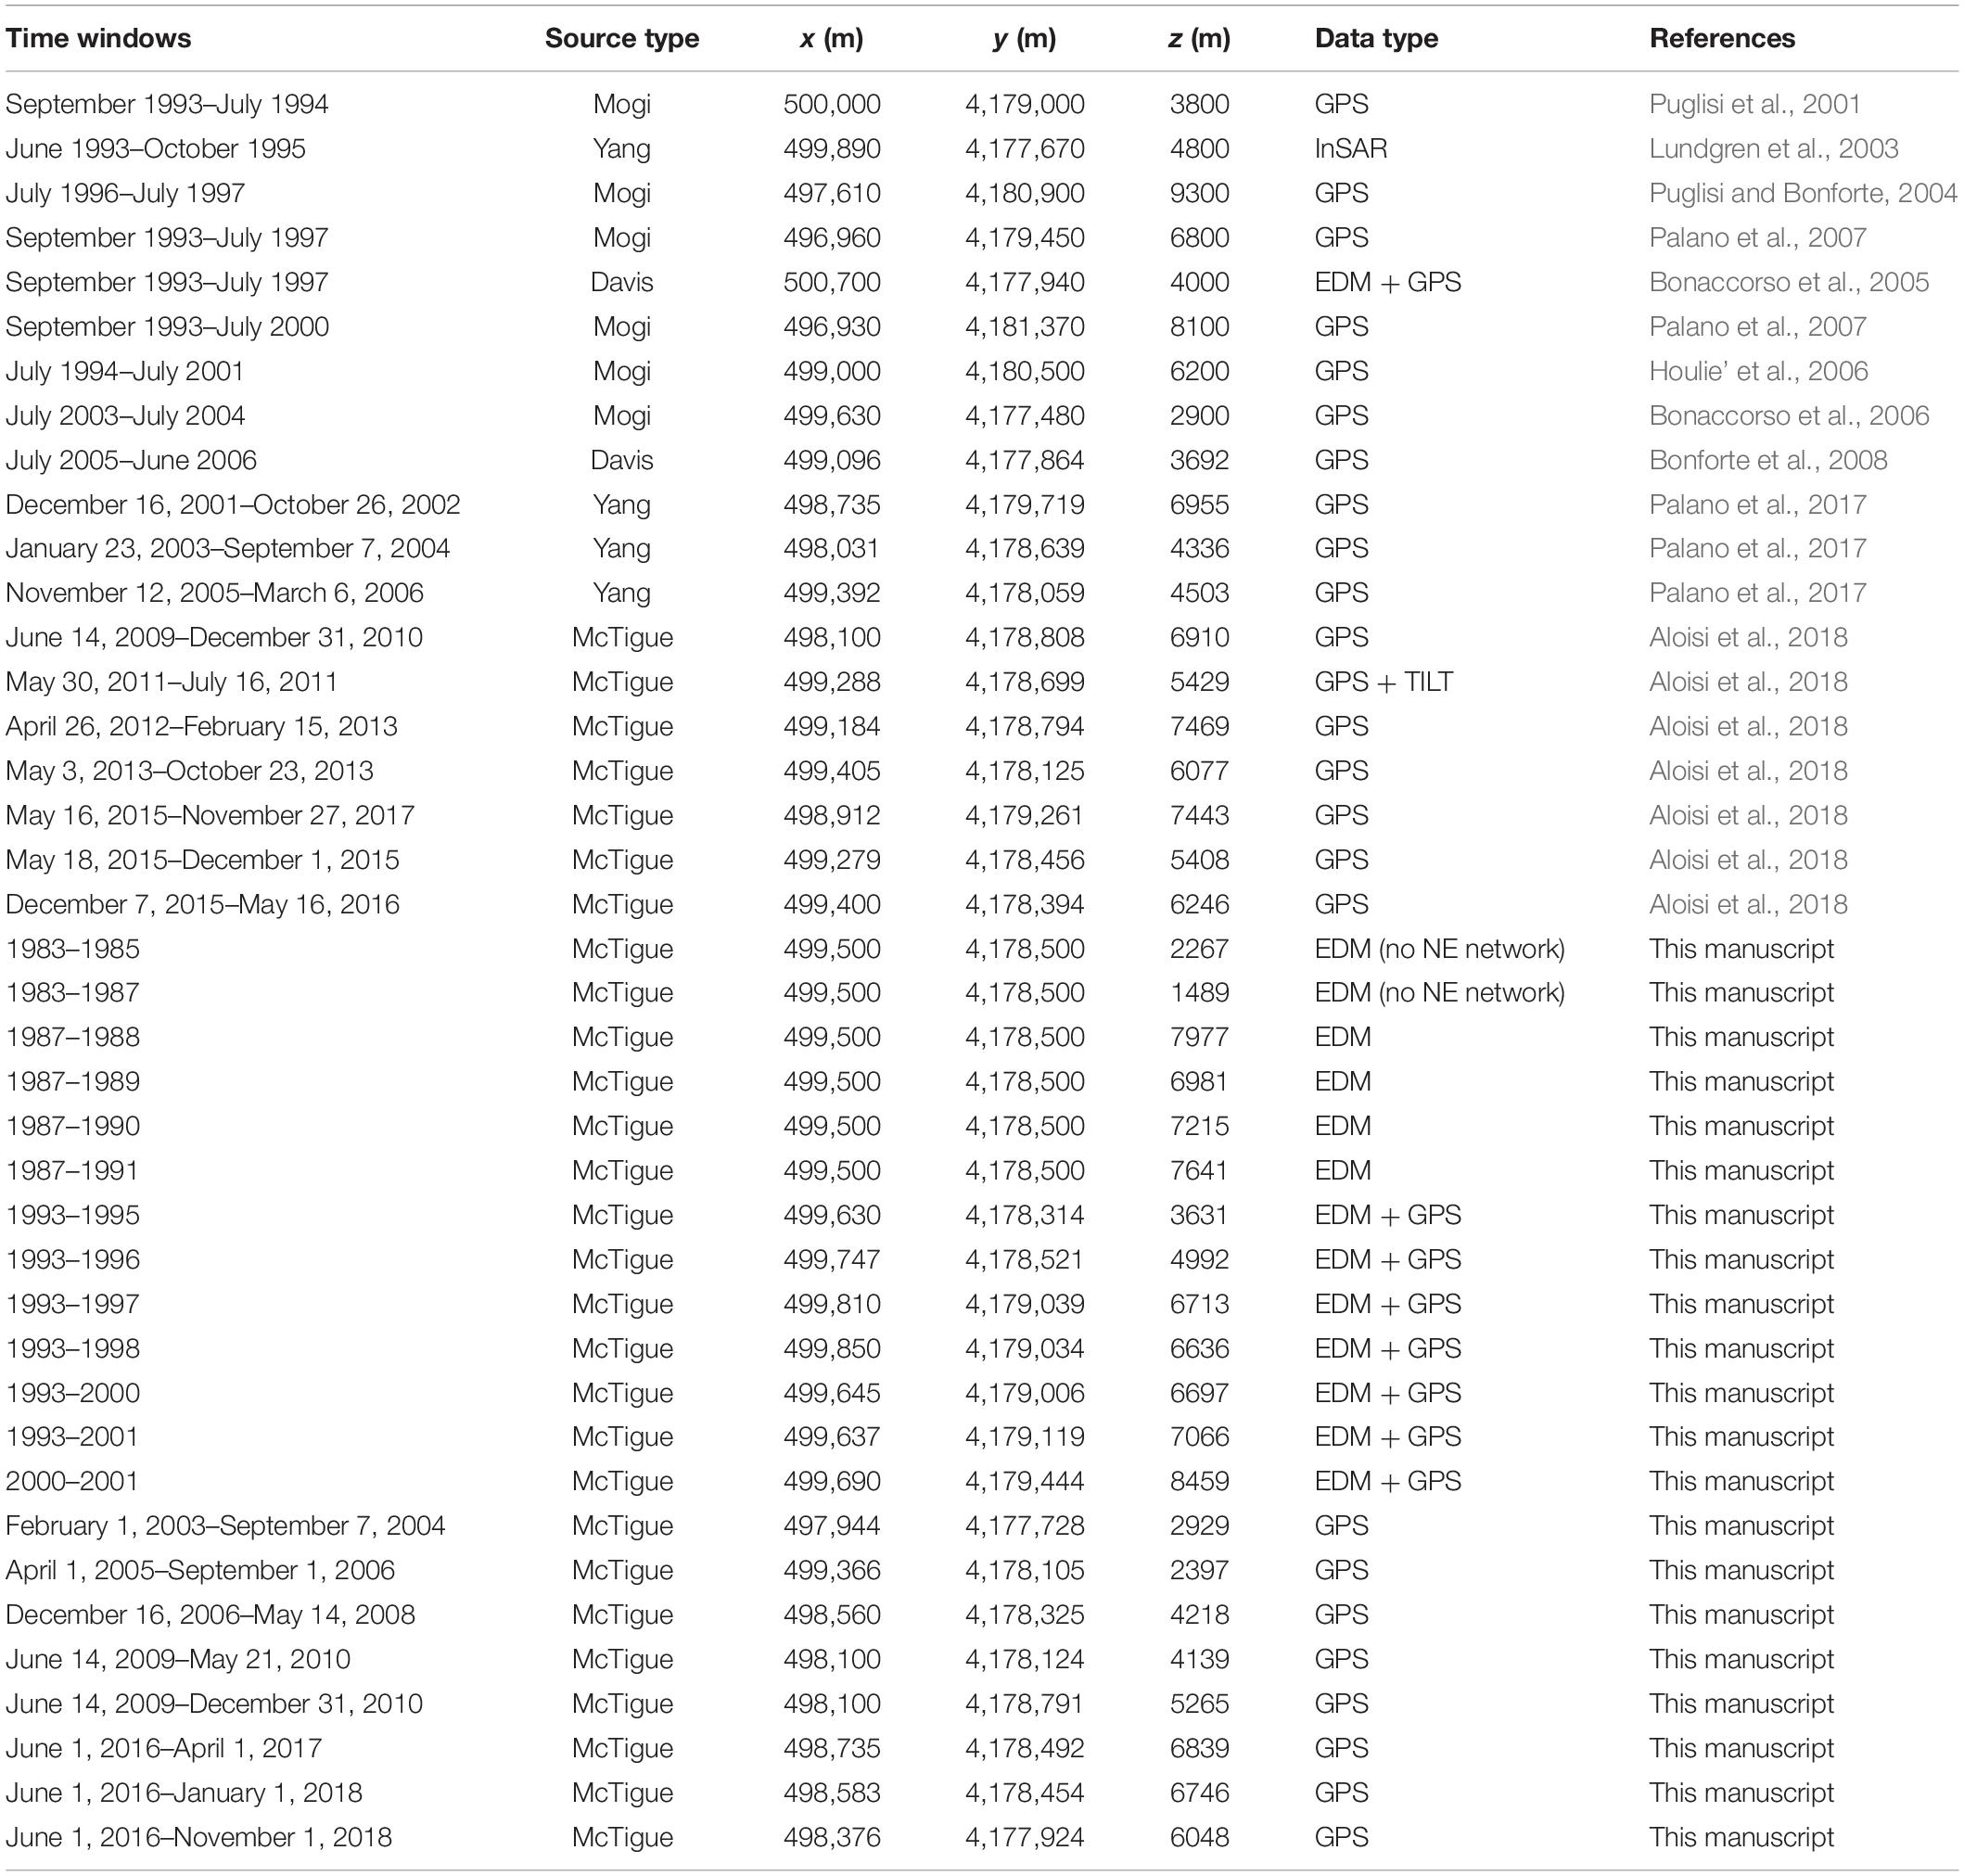
Table 4. Summary table of inflation sources modeled from literature and this study.
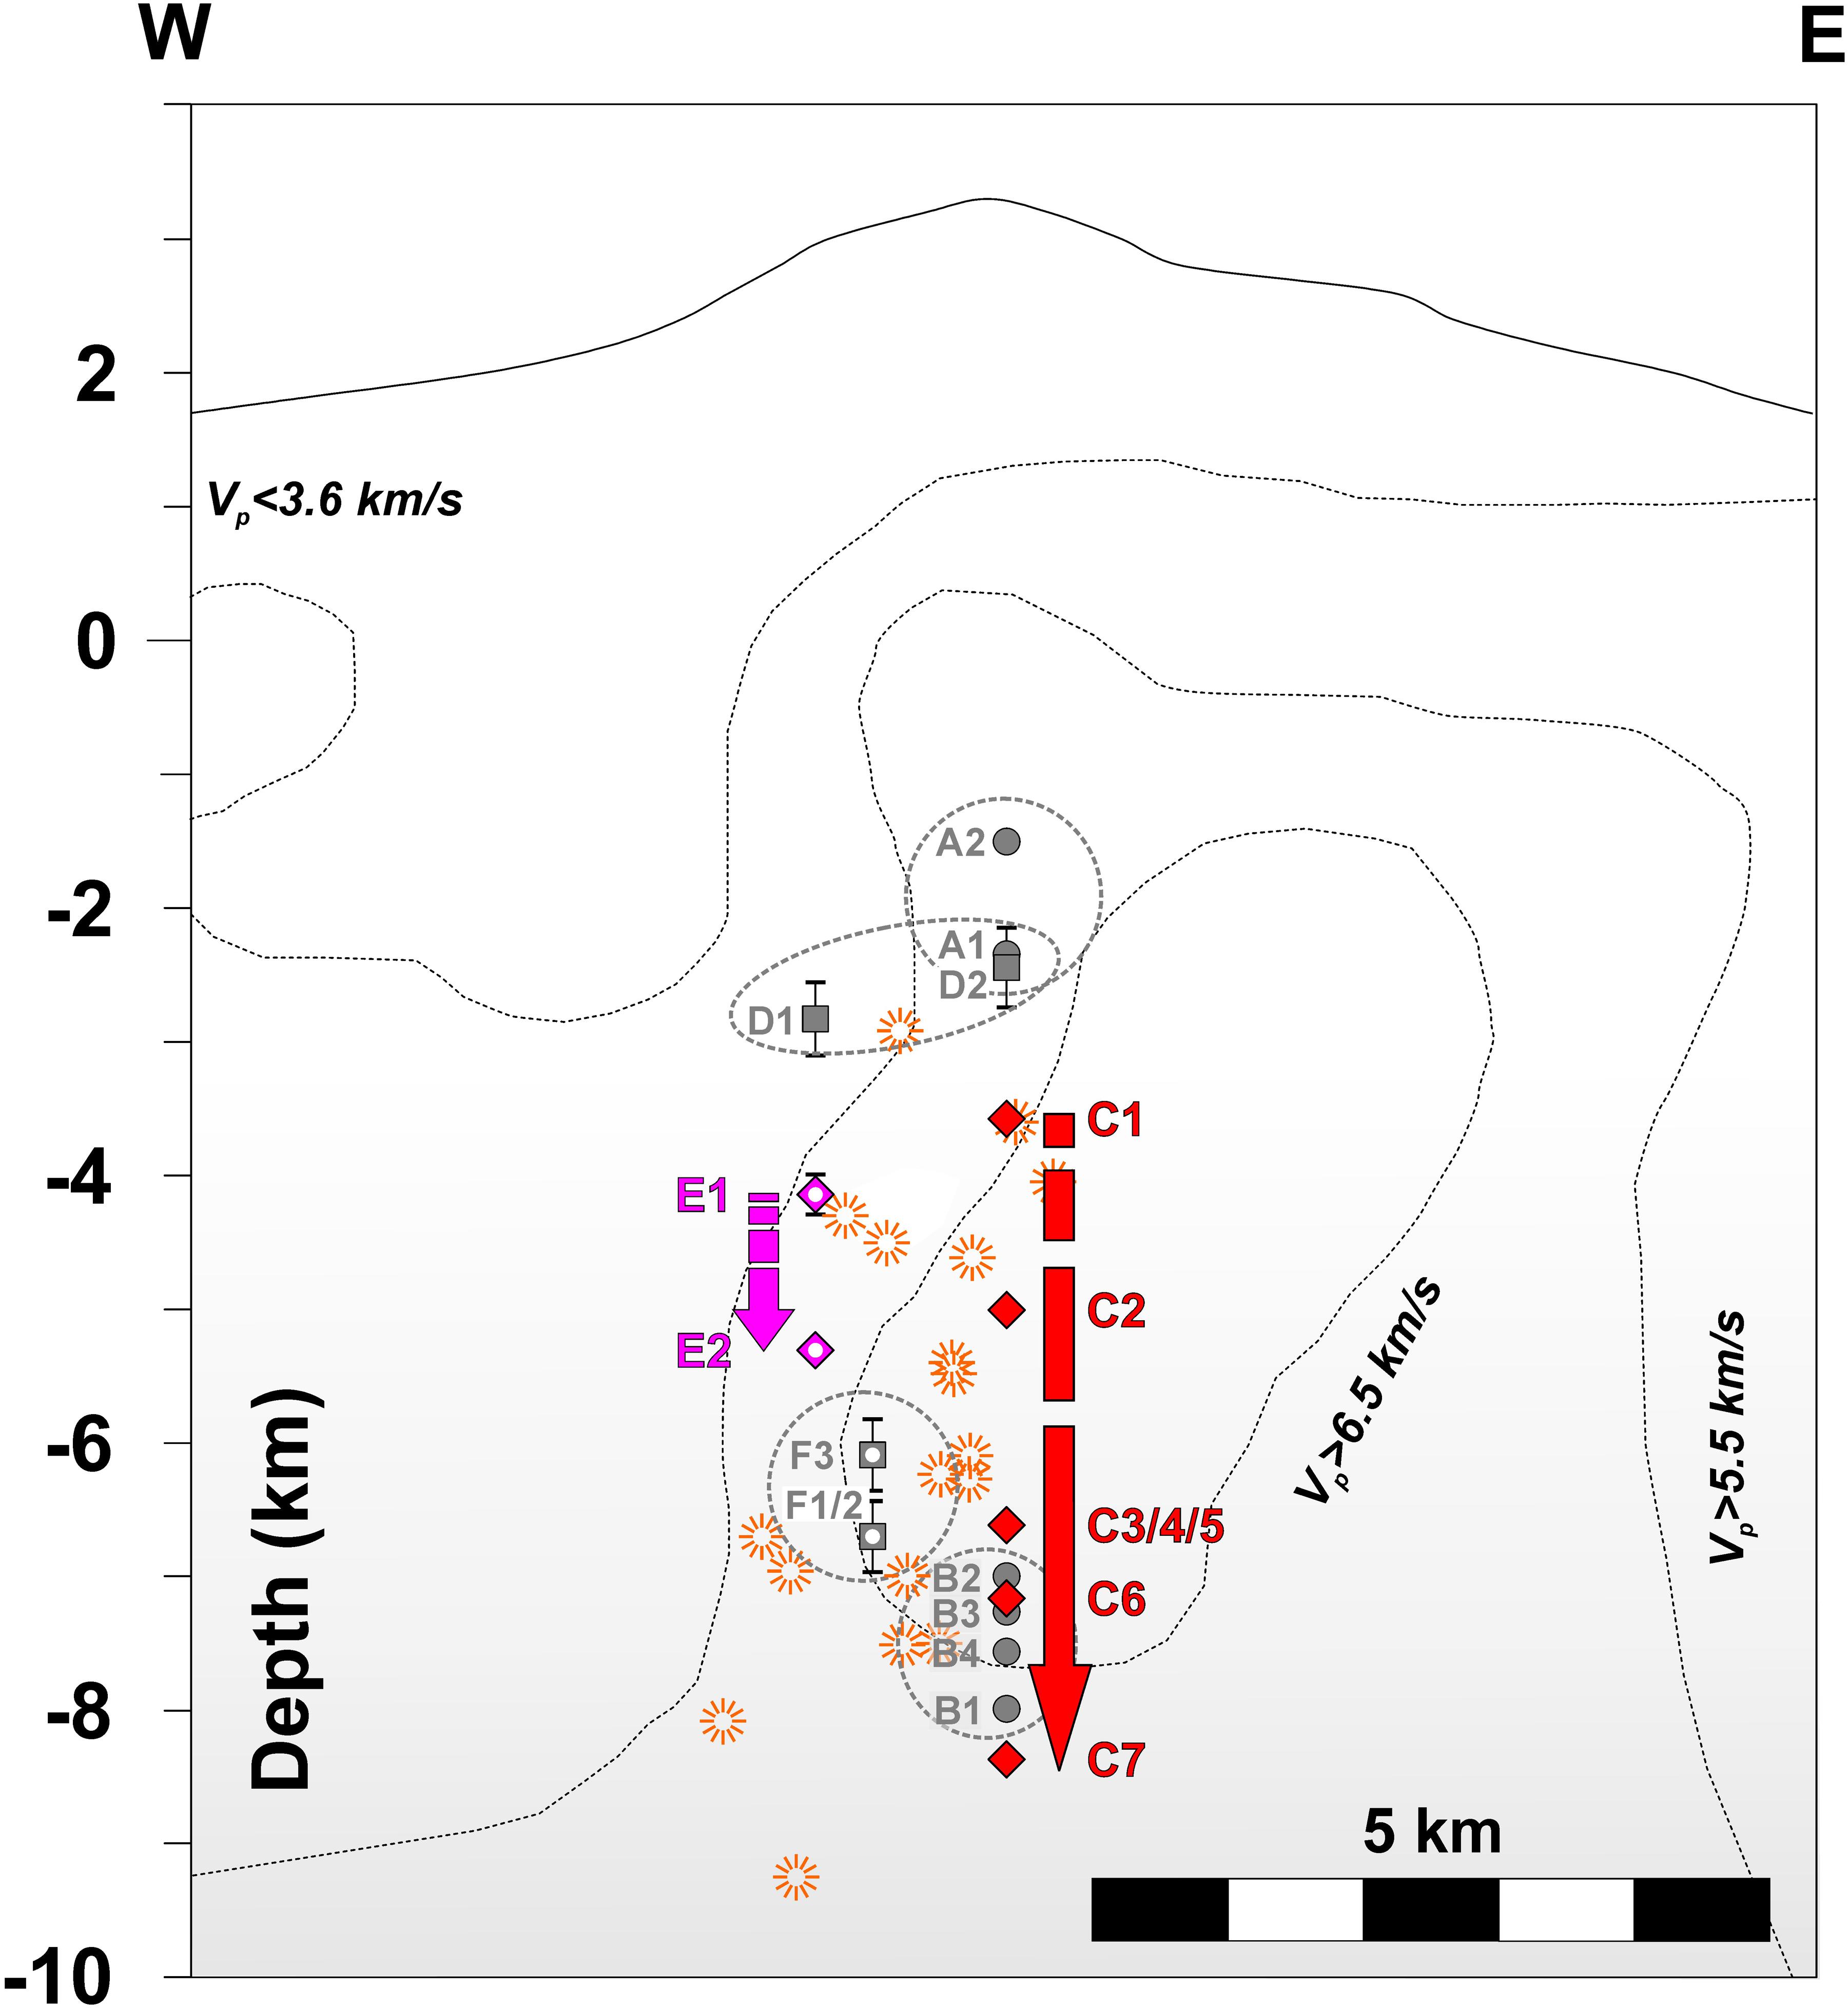
Figure 6. W-E section of Mt. Etna showing the position of the recharging sources inferred by both previous studies (see Table 4), indicated by asterisks, and this investigation specified by numbered capital letters (see Table 3). The C (1993–2001) and E (2009–2010) recharging phases preceding high explosive eruptive periods show a clear lowering of the source depth over time. The error bars, reported in Table 3, are visible for the cases in which the associated error exceeds the dimension of the asterisk symbols representing the position of the inflation sources.
Along Etna’s plumbing system, the magma can stall and store at different depths, compatibly with a wide range of the level of buoyancy between 22 and 2 km b.s.l. (Corsaro and Pompilio, 2004). Pressure sources are located along the western border of the high-density body detected by seismic tomography (Chiarabba et al., 2000; Patanè et al., 2003). However, even if the interpretation of this magma pathway is also well-constrained by the deformation modeling, all the previous modeled sources are referred to measurements recorded astride a single eruption, and have in any case been obtained with different approaches in terms of type of source and inversion method. Their localizations represent a sort of mean static position for each modeled magma storage but do not provide indications if the sources’ position moved during the recharging phase. In fact, we verified that using different inversion methods it is possible to obtain different vertical positions for the same pressure source (around a few kilometers of difference). Therefore, in this study we decided to use a uniform approach with the aim of uniformly comparing the vertical positions of each analyzed sub-interval.
A stimulating clue that inspired the investigation into this intriguing topic came from three studies concerning recent eruptive activity on Etna modeled through the measurements of the permanent GPS network. First, for the 2002–2003 explosive-effusive eruption, Palano et al. (2017) inferred a shift between the inflation and deflation sources with the latter source about 2 km shallower, while for the 2004–2005 and 2006 eruptions they did not find any relevant shift between the inflation and deflation source centers. Second, during the 2009–2010 recharging phase, Aloisi et al. (2011) constrained a progressive deepening of the deformation source over time. A third recent element of interest has been highlighted by Aloisi et al. (2018) regarding the separation at depth of the pressure centroids of the inflation and deflation phases that, respectively, preceded and accompanied the explosive activity phases of lava fountains of 2009–2017.
Therefore, as a further element of novelty and in-depth analysis, we investigated the possible deepening of the source by analyzing two main long recharging periods for Etna belonging to the two intervals 1987–1991 and 1993–2001 which preceded the large effusive eruption of 1991–1993 and the two highly effusive-explosive eruptions of 2001 and 2002–2003, respectively. These are the eruptions that represent the main eruptive activities of the last centuries and distinguish the two different principle classes of flank eruptions for Etna. The first, the purely effusive, is usually characterized by magma rising in the central conduits and breaking out into shallow lateral dikes propagating several km before breaching the surface. This eruption feeds lava flows and the main hazard is lava invasion. The second class involves powerful intrusions that bypass the central conduits and extend vertically through the volcano edifice until they break the surface and erupt, generating the so-called “eccentric” eruption (Bonaccorso and Davis, 2004; Aloisi et al., 2009). In the first case, the emitted lavas are already degassed and accompanied, therefore, by modest explosive phases. The second case instead is characterized by an eccentric feeder path, namely independent of the central conduit. In this case, the erupted magma during the ascent does not gradually exsolve its gaseous phases before the eruption. Consequently, a rich-gas magma comes out and has a high degree of explosiveness prolonged over the weeks-months of the eccentric eruption, therefore causing severe additional problems also in terms of serious interference to the aviation operations of the nearby international airport of Catania.
These two long and significant recharge periods had never been analyzed over time and this is the first time they have been compared. Moreover, the aspect of the possible shift of the source over time has now been highlighted thanks to the comparison of the various cases by applying the same modeling method with the same type of source in the same medium conditions to track the change in centroid position as less ambiguously as possible. In principle, considering the changes over time of a parameter using the same simple model under the same conditions allowed us to eliminate the possible secondary effects due to additional complexities. For Etna volcano, the analysis showed that in the case of the effusive eruptions the inflating source maintains a stable position. Instead, the recharging phases preceding an explosive eruptive activity are characterized by a lowering of the pressurization source over time. From the dynamic analysis conducted, this aspect is clearly evident in the main 1993–2001 period, which precedes the exceptional explosive activity that accompanied permanently the two dramatic eruptions of 2001 and 2002–2003, with a deepening of the center of the pressure ranging from ∼3.6 to 8.5 km b.s.l. (period C in Tables 2, 3 and Figure 6). In a shorter timescale, also the 2009–2010, preceding the powerful explosive phase of more than 50 lava fountains in 2011–2015, was accompanied by a deepening of the center of the pressure source ranging from ∼4.1 to ∼5.3 km b.s.l. (period E in Tables 2, 3 and Figure 6).
To the best of our knowledge, in literature there are no other studies discussing the progressive deepening over time of volcano pressure sources. Only Aloisi et al. (2011) highlighted that during the inflation observed at Mt. Etna volcano after the end of the 2008 eruption, there was a deepening of the inflating source preparing the explosive activity that involved the summit area starting from 2011. The authors did not investigate if the source deepening observed during this recharging period could also be an overall behavior involving other periods. Here, we verified that this phenomenon was repeated other times during 40 years as inferred by the geodetic measurements. The new relevant aspect is that it occurred during the recharging phases preceding the more explosive eruptions, while it was not observed for the purely effusive eruptions.
This aspect of the lowering of the pressurization center is counter-intuitive. In fact, it is generally considered that the magma injection from the deeper levels could exert pressure progressively upwards before giving rise to the eruptions. On Etna, the explosive activity of single episodes of lava fountains can be caused by the foam accumulation of gas-rich- magma in a very shallow (at sea level depth) and smaller reservoir source as occurred for the numerous sequences of 2011–2013 (i.e., Bonaccorso et al., 2011a,b) or by fast uprising of deeper magma batches as for the events of December 2015 (i.e., Bonaccorso and Calvari, 2017; Cannata et al., 2018). But these mechanisms are the final triggers of the individual lava fountains, while the long recharge periods that deform the entire volcanic edifice before a prolonged explosive eruptive activity appear to be characterized by the phenomenon of the pressure center lowering.
In the process of the fluid transport a primary role is played by the CO2. If the magma is under-saturated and the velocity of fluid ascent allows the CO2 to dissolve, dissolution will start from the base and progressively saturate the shallower portion of the magma reservoir (Yoshimura and Nakamura, 2011). However, this behavior would not fit the indication of the source deepening inferred by the geodetic measurements before the explosive eruptions at Etna volcano.
A possible hypothesis to overcome this apparent discrepancy and to explain this intriguing scenario could be provided by a possible CO2 accumulation at depth due to portions of magma tapped along its vertical ascent. This accumulation in some parts of the plumbing system may have played a role in generating the explosivity.
Recently, Ferlito et al. (2014) proposed a possible key role of the passage of H2O through the plumbing system and its absorption by water-undersaturated magma. In their study, deeper magmas would retain a higher quantity of volatiles before achieving saturation, thus implying that deeply flushed magmas can originate strong explosive eruptions though still maintaining primitive compositional features.
At Etna volcano, we highlight a progressive pressure deepening over time preceding the explosive eruptions that would generate the accumulation of more gas-rich- magma then released into more explosive eruptions. Therefore, the observation of the source deepening over time becomes relevant to evaluate in advance the expected eruptive style (in this case explosive) and its intensity. These new considerations are of great interest for volcanic monitoring and surveillance purposes, and open new scenarios for future studies to further investigate the magma recharge process.
We investigated the position of the pressure centroid during the main recharging phases of the last 40 years at Etna volcano. The recharging phases were modeled over time to observe the evolution of the source. We used the same type of deformation measurements (geodetic baselines) and the same modeling method that made it possible to fix the position of the source over time in a uniform and robust approach. This also allowed updating the representation of the shallow-intermediate plumbing system (last 0–10 km) from the modeling of the pressure sources and their positions. Furthermore, a new result, in the case of the recharges preceding the explosive eruptions, is that a lowering of the centroid of the pressure source is observed over time. This aspect is very evident in the 1993–2001 recharging phase forerunning the major effusive-explosive flank eruptions of 2001 and 2002–2003, and in the 2009–2010 phase preceding the extraordinary explosive period of 2011–2015 lava fountains. Compared with previous studies, where a pressurized magma chamber at a stable position is considered, our results support the evidence of a more complex scenario characterized by a deepening of the source.
The data analyzed in this study is subject to the following licenses/restrictions: the data generated for this study are available on request to the corresponding author.
AB conceived the study, coordinated the writing, and verified the first modeling results. MA completed the modeling analysis. AB and MA shared the results and contributed to the discussion and interpretation. Both authors contributed to the article and approved the submitted version.
The authors declare that the research was conducted in the absence of any commercial or financial relationships that could be construed as a potential conflict of interest.
We are indebted to L. Villari who promoted the beginning of the deformation monitoring on Etna, and to the colleagues O. Consoli, B. Puglisi., R. Velardita and to all the technicians and researchers who, since the 1970s, have installed and measured with Electro-optical Distance Technique (EDM) the first trilateration networks on Mt. Etna volcano. In particular, their scientific rigor and enthusiasm has made it possible to acquire very useful deformation data and to train numerous researchers. We thank A. Bonforte who provided the baselines of the GPS yearly campaigns from 1991 to 2001. We thank M. Palano who provided some GPS baselines used in this work. We are grateful to F. Cannavo’ for developing the data inversion software (Cannavò, 2019). We also thank the colleagues V. Bruno, M. Mattia, D. Pellegrino, M. Pulvirenti, and M. Rossi of the INGV – Osservatorio Etneo (GPS Permanent Network) for enabling and improving the acquisition of GPS data and for its systematic processing. Finally, we thank Stephen Conway for correcting the English version of our manuscript. We acknowledge the constructive reviews of two reviewers, the associate editor, BS, and chief editor, Valerio Acocella, whose comments improved the manuscript.
Allard, P., Behncke, B., D’Amico, S., Neri, M., and Gambino, S. (2006). Mount Etna 1993–2005: anatomy of an evolving eruptive cycle. Earth Sci. Rev. 78, 85–114. doi: 10.1016/j.earscirev.2006.04.002
Aloisi, M., Bonaccorso, A., Cannavò, F., Currenti, G., and Gambino, S. (2020). The 24 December 2018 eruptive intrusion at Etna volcano as revealed by multidisciplinary continuous deformation networks (CGPS, borehole strainmeters and tiltmeters). J. Geophys. Res. Solid Earth 125:e2019JB019117. doi: 10.1029/2019JB019117
Aloisi, M., Bonaccorso, A., Cannavò, F., and Currenti, G. M. (2018). Coupled short- and medium-term geophysical signals at etna volcano: using deformation and strain to infer magmatic processes from 2009 to 2017. Front. Earth Sci. 6:109. doi: 10.3389/feart.2018.00109
Aloisi, M., Bonaccorso, A., Cannavò, F., Gambino, S., Mattia, M., Puglisi, G., et al. (2009). A new dike intrusion style for the Mount Etna May 2008 eruption modelled through continuous tilt and GPS data. Terra Nova 21, 316–321. doi: 10.1111/j.1365-3121.2009.00889.x
Aloisi, M., Mattia, M., Ferlito, C., Palano, M., Bruno, V., and Cannavò, F. (2011). Imaging the multi-level magma reservoir at Mt. Etna volcano (Italy). Geophys. Res. Lett. 38:L16306. doi: 10.1029/2011GL048488
Alparone, S., Bonaccorso, A., Bonforte, A., and Currenti, G. (2013). Long-term stress-strain analysis of volcano flank instability: the eastern sector of Etna from 1980 to 2012. J. Geophys. Res. Solid Earth 118, 5098–5108. doi: 10.1002/jgrb.50364
Battaglia, M., Segall, P., Murray, J., Cervelli, P., and Langbein, J. (2003). The mechanics of unrest at Long Valley caldera, California: 1. Modeling the geometry of the source using GPS, leveling and two-color EDM data. J. Volcanol. Geotherm. Res. 127, 195–217. doi: 10.1016/S0377-0273(03)00170-7
Bebbington, M. S. (2014). Long-term forecasting of volcanic explosivity. Geophys. J. Int. 197, 1500–1515. doi: 10.1093/gji/ggu078
Bonaccorso, A. (1996). Dynamic inversion of ground deformation data for modelling volcanic sources (Etna 1991-93). Geophys. Res. Lett. 23, 451–454. doi: 10.1029/96gl00418
Bonaccorso, A. (1999). The march 1981 Mt. Etna eruption inferred through ground deformation modelling. Physics of the Earth and Planetary Interiors 112, 125–136. doi: 10.1016/S0031-9201(99)00003-5
Bonaccorso, A. (2001). Mt Etna volcano: modelling of ground deformation patterns of recent eruptions and considerations on the associated precursors, Special Number on “Mechanics and Thermalfluid Dynamics of the Volcanic Processes”. J. Volcanol. Geotherm. Res. 109, 99–108. doi: 10.1016/s0377-0273(00)00306-1
Bonaccorso, A., Bonforte, A., and Gambino, S. (2015a). Twenty-five years of continuous borehole tilt and vertical displacement data at Mount Etna: insights on long-term volcanic dynamics. Geophys. Res. Lett. 42, 10,222–10,229. doi: 10.1002/2015GL066517
Bonaccorso, A., Calvari, S., and Boschi, E. (2015b). “Hazard mitigation and crisis management during major flank eruptions at Etna volcano: reporting on real experience,” in Detecting, Modelling and Responding to Effusive Eruptions, eds A. Harris, T. De Groeve, F. Garel, and S. A. Carn (London: Geological Society).
Bonaccorso, A., Bonforte, A., Guglielmino, F., Palano, M., and Puglisi, G. (2006). Composite ground deformation pattern forerunning the 2004– 2005 Mount Etna eruption. J. Geophys. Res. 111:B12207.
Bonaccorso, A., and Calvari, S. (2013). Major effusive eruptions and recent lava fountains: balance between expected and erupted magma volumes at Etna volcano. Geophys. Res. Lett. 40, 6069–6073. doi: 10.1002/2013GL058291
Bonaccorso, A., and Calvari, S. (2017). A new approach to investigate an eruptive paroxysmal sequence using camera and strainmeter networks: lessons from the 3-5 December 2015 activity at Etna volcano. Earth Planet. Sci. Lett. 475, 231–241. doi: 10.1016/j.epsl.2017.07.020
Bonaccorso, A., Calvari, S., Coltelli, M., Del Negro, C., and Falsaperla, S. (eds) (2004). Etna : Volcano Laboratory, Monograph of American Geophysical Union, n.143, 369 pp. Washington DC: American Geophysical Union.
Bonaccorso, A., Calvari, S., Currenti, G., Del Negro, C., Ganci, G., Linde, A., et al. (2013). From source to surface: dynamics of etna’s lava fountains investigated by continuous strain, magnetic, ground and satellite thermal data. Bull. Volcanol. 75:690. doi: 10.1007/s00445-013-0690-9
Bonaccorso, A., Campisi, O., Falzone, G., Gambino, S., Laudani, G., Puglisi, B., et al. (1995). Ground deformation on active volcanoes in Sicily (Italy). Cahiers Centre Eur. Geodyn. Seismol. 8, 349–358.
Bonaccorso, A., Cannata, A., Corsaro, R. A., Di Grazia, G., Gambino, S., Greco, F., et al. (2011a). Multidisciplinary investigation on a lava fountain preceding a flank eruption: the 10 May 2008 Etna case. Geochem. Geophys. Geosyst. 12:Q07009. doi: 10.1029/2010GC003480
Bonaccorso, A., Caltabiano, T., Currenti, G., Del Negro, C., Gambino, S., Ganci, G., et al. (2011b). Dynamics of a lava fountain revealed by geophysical, geochemical and thermal satellite measurements: the case of the 10 April 2011 Mt Etna eruption. Geophys. Res. Lett. 38:L24307. doi: 10.1029/2011GL049637
Bonaccorso, A., Cianetti, S., Giunchi, C., Trasatti, E., Bonafede, M., and Boschi, E. (2005). Analytical and 3D numerical modeling of Mt. Etna (Italy) volcano inflation. Geophys. J. Int. 163, 852–862. doi: 10.1111/j.1365-246x.2005.02777.x
Bonaccorso, A., and Davis, P. M. (2004). Modeling of ground deformation associated with recent lateral eruptions: mechanics of magma ascent and intermediate storage at Mt. Etna. Geophys. Monograph. Ser. 143, 293–306. doi: 10.1029/143GM18
Bonforte, A., Bonaccorso, A., Guglielmino, F., Palano, M., and Puglisi, G. (2008). Feeding system and magma storage beneath Mt. Etna as revealed by recent inflation/deflation cycles. J. Geophys. Res. 113:B05406. doi: 10.1029/2007JB005334
Branca, S., and Del Carlo, P. (2004). Eruptions of Mt Etna during the past 3.200 years: a revised compilation integrating the Historical and stratigraphic records. Geophys. Monograph. Ser. 143, 1–27. doi: 10.1029/143GM02
Bruno, V., Mattia, M., Aloisi, M., Palano, M., Cannavò, F., and Holt, W. E. (2012). Ground deformations and volcanic processes as imaged by CGPS data at Mt. Etna (Italy) between 2003 and 2008. J. Geophys. Res. 117:B07208. doi: 10.1029/2011JB009114
Calvari, S., Bilotta, G., Bonaccorso, A., Caltabiano, T., Cappello, A., Corradino, C., et al. (2020). The VEI 2 Christmas 2018 Etna eruption: a small but intense eruptive event or the starting phase of a larger one? Remote Sens. 12:905. doi: 10.3390/rs1206905
Calvari, S., Cannavò, F., Bonaccorso, A., Spampinato, L., and Pellegrino, A. G. (2018). Paroxysmal explosions, lava fountains and ash plumes at etna volcano: eruptive processes and hazard implications. Front. Earth Sci. 6:107. doi: 10.3389/feart.2018.00107
Cannata, A., Grazia, G. Di, Marisa, Giuffrida, Gresta, S., Palano, M., Sciotto, M., et al. (2018). Space-time evolution of magma storage and transfer at mt. etna volcano (Italy): the 2015–2016 reawakening of voragine crater. Geochem. Geophys. Geosyst. 19, 471–495. doi: 10.1002/2017GC00729
Cannavò, F. (2019). A new user-friendly tool for rapid modelling of ground deformation. Comput. Geosci. 128, 60–69. doi: 10.1016/j.cageo.2019.04.002
Chang, W.-L., Smith, R. B., Farrell, J., and Puskas, C. M. (2010). An extraordinary episode of Yellowstone caldera uplift, 2004–2010, from GPS and InSAR observations. Geophys. Res. Lett. 37:L23302. doi: 10.1029/2010GL045451
Chiarabba, C., Amato, A., Boschi, E., and Barberi, F. (2000). Recent seismicity and tomographic modeling of the Mount Etna plumbing system. J. Geophys. Res. 105, 10923–10938. doi: 10.1029/1999jb900427
Corsaro, R. A., and Pompilio, M. (2004). Buoyancy-controlled eruption of magmas at Mt Etna. Terra Nova 16, 16–22. doi: 10.1046/j.1365-3121.2003.00520.x
Currenti, G., Bonaccorso, A., Negro, C. D., Scandura, D., and Boschi, E. (2010). Elasto-plastic modeling of volcano ground deformation. Earth Planet. Sci. Lett. 296, 311–318. doi: 10.1016/j.epsl.2010.05.013
Davis, P. M. (1986). Surface deformation due to inflation of an arbitrarily oriented triaxial ellipsoidal cavity in an elastic half-space, with reference to Kilauea volcano, Hawaii. J. Geophys. Res. 91, 7429–7438. doi: 10.1029/JB091iB07p07429
De Beni, E., Behncke, B., Branca, S., Nicolosi, I., Carluccio, R. D., Ajello Caracciolo, F., et al. (2015). The continuing story of Etna’s New Southeast Crater (2012–2014): evolution and volume calculations based on field surveys and aerophotogrammetry. J. Volcanol. Geotherm. Res. 303, 175–186. doi: 10.1016/j.jvolgeores.2015.07.021
De Novellis, V., Atzori, S., De Luca, C., Manzo, M., Valerio, E., Bonano, M., et al. (2019). DInSAR analysis and analytical modeling of Mount Etna displacements: the December 2018 volcano-tectonic crisis. Geophys. Res. Lett. 46, 5817–5827. doi: 10.1029/2019GL082467
Del Negro, C., Currenti, G., and Scandura, D. (2009). Temperature-dependent viscoelastic modeling of ground deformation: application to Etna volcano during the 1993–1997 inflation period. Phys. Earth Planet. Inter. 172, 299–309. doi: 10.1016/j.pepi.2008.10.019
Dzurisin, D., Lisowski, M., and Wicks, C. W. (2009). Continuing inflation at three sisters volcanic center, central oregon cascade range, USA, from GPS, leveling, and InSAR observations. Bull. Volcanol. 71, 1091–1110. doi: 10.1007/s00445-009-0296-4
Efron, B. (1982). The Jackknife, Bootstrap and Other Resampling Plans. Philadelphia, PA: Society for Industrial and Applied Mathematics.
Ferlito, C., Coltorti, C., Lanzafame, G., and Giacomoni, P. P. (2014). The volatile flushing triggers eruptions at open conduit volcanoes: evidence from Mount Etna volcano (Italy). Lithos 184–187, 447–455. doi: 10.1016/j.lithos.2013.10.030
Goldberg, D. E. (1989). Genetic Algorithms in Search, Optimization and Machine Learning. Boston, MA: Kluwer Academic Publishers.
Harris, A. J. L., Steffke, A., Calvari, S., and Spampinato, L. (2011). Thirty years of satellite-derived lava discharge rates at Etna: implications for steady volumetric output. J. Geophys. Res. 116:B08204.
Houlie’, N., Briole, P., Bonforte, A., and Puglisi, G. (2006). Large scale ground deformation of Etna observed by GPS between 1994 and 2001. Geophys. Res. Lett. 33:L02309. doi: 10.1029/2005GL024414
Jaeger, J. C. (1969). Elasticity, Fracture and Flow. With Engineering and Geological Applications. London: Chapman & Hall, 268.
Lewis, R. M., and Torczon, V. (1999). Pattern search algorithms for bound constrained minimization. SIAM J. Optim. 9, 1082–1099. doi: 10.1137/S1052623496300507
Lu, Z., Dzurisin, D., Biggs, J., Wicks, C., and McNutt, S. (2010). Ground surface deformation patterns, magma supply, and magma storage at Okmok volcano, Alaska, from InSAR analysis: 1. Interruption deformation, 1997–2008. J. Geophys. Res. 115:B00B02. doi: 10.1029/2009JB006969
Lu, Z., Masterlark, T., Dzurisin, D., Rykhus, R., and Wicks, C. (2003). Magma supply dynamics at Westdahl volcano, Alaska,modeled from satellite radar interferometry. J. Geophys. Res. 108:2354. doi: 10.1029/2002JB002311
Lundgren, P., Berardino, P., Coltelli, M., Fornaro, G., Lanari, R., Puglisi, G., et al. (2003). Coupled Megma chamber and sector collapse slip observed with synthetic aperture radar interferometry on Mt. Etna volcano. J. Geophys. Res. 108:2247.
Mattia, M., Bruno, V., Montgomery-Brown, E., Patanè, D., Barberi, G., and Coltelli, M. (2020). Combined seismicand geodetic analysis before, during, and after the 2018 Mount Etna eruption. Geochem. Geophys. Geosyst. 21:e2020GC009218. doi: 10.1029/2020GC009218
McTigue, D. F. (1987). Elastic stress and deformation near a finite spherical magma body: resolution of the point source paradox. J. Geophys. Res. 92, 12931–12940. doi: 10.1029/JB092iB12p12931
Mogi, K. (1958). Relations between the eruptions of various volcanoes and the deformations of the ground surfaces around them. Bull. Earthquake Res. Inst. 36, 99–134.
Murray, J. B., and Pullen, A. D. (1984). Three dimensional model of the feeder conduit of the 1983 eruption of Mt. Etna volcano from ground deformation measurements. Bull. Volc. 47, 1145–1163. doi: 10.1007/bf01952369
Murray, J. B., van Wyk de Vries, B., Pitty, A., Sargent, P., and Wooller, L. (2018). Gravitational sliding of the Mt. Etna massif along a sloping basement. Bull. Volcanol. 80:40. doi: 10.1007/s00445-018-1209-1
Newman, A. V., Dixon, T., Ofoegbu, G., and Dixon, J. (2001). Geodetic data constraints on recent activity at Long Valley Caldera, California: evidence for viscoelastic rheology. J. Volcan. Geoth. Res. 105, 183–206. doi: 10.1016/s0377-0273(00)00255-9
Newman, A. V., Dixon, T. H., and Gourmelen, N. (2006). A four-dimensional viscoelastic deformation model for Long Valley Caldera, California, between 1995 and 2000. J. Volcanol. Geotherm. Res. 150, 244–269. doi: 10.1016/j.jvolgeores.2005.07.017
Newman, A. V., Stiros, S., Feng, L., Psimoulis, P., Moschas, F., Saltogianni, V., et al. (2012). Recent geodetic unrest at Santorini caldera, Greece. Geophys. Res. Lett. 39:L06309. doi: 10.1029/2012GL051286
Palano, M., Puglisi, G., and Gresta, S. (2007). Ground deformation at Mt. Etna: a joint interpretation of GPS and InSAR data from 1993 to 2000. Boll. Geofis. Teor. Appl. 48, 81–98.
Palano, M., Puglisi, G., and Gresta, S. (2008). Ground deformation patterns at Mt. Etna from 1993 to 2000 from joint use of InSAR and GPS techniques. J. Volcanol. Geotherm. Res. 169, 99–120. doi: 10.1016/j.jvolgeores.2007.08.014
Palano, M., Viccaro, M., Zuccarello, F., and Gresta, S. (2017). Magma transport and storage at Mt. Etna (Italy): a review of geodetic and petrological data for the 2002–03, 2004 and 2006 eruption. J. Volc. Geoth. Res. 347, 149–164. doi: 10.1016/j.jvolgeores.2017.09.00
Patanè, D., De Gori, P., Chiarabba, C., and Bonaccorso, A. (2003). Magma ascent and the pressurization of Mount Etna’s volcanic system. Science 299, 2061–2063. doi: 10.1126/science.1080653
Prescott, W. (1981). The determination of displacement fields from geodetic data along a strike slip fault. J. Geophys. Res. 86, 6067–6072. doi: 10.1029/JB086iB07p06067
Puglisi, G., and Bonforte, A. (2004). Dynamics of Mount Etna volcano inferred from static and kinematic GPS measurements. J. Geophys. Res. 109:B11404. doi: 10.1029/2003JB002878
Puglisi, G., Bonforte, A., and Maugeri, S. R. (2001). Ground deformation patterns on Mt. Etna, between 1992 and 1994, inferred from GPS data. Bull. Volcanol. 62, 371–384. doi: 10.1007/s004450000112
Puglisi, G., Briole, P., and Bonforte, A. (2004). “Twelve years of ground deformation studies on Mt. Etna volcno based on GPS survey,” in Etna Volcano Laboratory, ed. S. Bonaccorso (Washington, DC: American Geophysical Union), 321–341. doi: 10.1029/143gm20
Pulvirenti, F., Aloisi, M., and Shuanggen, J. (2017). Time-dependent Coulomb stress changes induced by the 2002–2003 Etna magmatic intrusions and implications on following seismic activities. J. Volcanol. Geotherm. Res. 344, 185–196. doi: 10.1016/j.jvolgeores.2016.11.001
Solana, M. C., Calvari, S., Kilburn, C. R. J., Gutierrez, H., Chester, D., and Duncan, A. (2017). “Supporting the development of procedures for communications during volcanic emergencies: lessons learnt from the canary islands (Spain) and Etna and Stromboli (Italy),” in Advances in Volcanology, Observing the Volcano World, Volcano Crisis Communication, eds C. J. Fearnley, D. K. Bird, K. Haynes, W. J. McGuire, and G. Jolly (Berlin: Springer Open), 289–305. doi: 10.1007/11157_2016_48
Solaro, G., Acocella, V., Pepe, S., Ruc, J., Neri, M., and Sansosti, E. (2010). Anatomy of an unstable volcano from InSAR: multiple processes affecting flank instability at Mt. Etna, 1994–2008. J. Geophys. Res. 115:JB000820. doi: 10.1029/2009JB000820
Sturkell, E., Einarsson, P., Sigmundsson, F., Geirsson, H., Ólafsson, H., Pedersen, R., et al. (2006). Volcano geodesy and magma dynamics in Iceland. J. Volcanol. Geotherm. Res. 150, 14–34. doi: 10.1016/j.jvolgeores.2005.07.010
Tanguy, J. C., Condomines, M., Goff, M. Le, Chillemi, V., La Delfa, S., and Patané, G. (2007). Mount Etna eruptions of the last 2,750 years: revised chronology and location through archeomagnetic and 226Ra-230Th dating. Bull. Volcanol. 70, 55–83. doi: 10.1007/s00445-007-0121-x
Tiampo, K. F., Rundle, J. B., Fernandez, J., and Langbein, J. O. (2000). Spherical and ellipsoidal volcanic sources at Long Valley caldera, California, using a genetic algorithm inversion technique. J. Volcanol. Geotherm. Res. 102, 189–206. doi: 10.1016/S0377-0273(00)00185-2
Trasatti, E., Giunchi, C., and Bonafede, M. (2003). Effects of topography and rheological layering on ground deformation in volcanic regions. J. Volcanol. Geotherm. Res. 122, 89–110. doi: 10.1016/S0377-0273(02)00473-0
Williams, C. A., and Wadge, G. (2000). An accurate and efficient method for including theeffects of topography in three-dimensional elastic models of ground deformation with applications to radar interferometry. J. Geophys. Res. 105, 8103–8120. doi: 10.1029/1999JB900307
Yang, X. M., Davis, P. M., and Dieterich, J. H. (1988). Deformation from inflation of a dipping finite prolate spheroid in an elastic half-space as a model for volcanic stressing. J. Geophys. Res. 93, 4249–4257. doi: 10.1029/JB093iB05p04249
Keywords: Etna volcano, volcano monitoring, magma storage, ground deformation, volcano sources modeling
Citation: Bonaccorso A and Aloisi M (2021) Tracking Magma Storage: New Perspectives From 40 Years (1980–2020) of Ground Deformation Source Modeling on Etna Volcano. Front. Earth Sci. 9:638742. doi: 10.3389/feart.2021.638742
Received: 07 December 2020; Accepted: 26 February 2021;
Published: 16 March 2021.
Edited by:
Bruno Scaillet, Centre National de la Recherche Scientifique (CNRS), FranceReviewed by:
Eisuke Fujita, National Research Institute for Earth Science and Disaster Resilience (NIED), JapanCopyright © 2021 Bonaccorso and Aloisi. This is an open-access article distributed under the terms of the Creative Commons Attribution License (CC BY). The use, distribution or reproduction in other forums is permitted, provided the original author(s) and the copyright owner(s) are credited and that the original publication in this journal is cited, in accordance with accepted academic practice. No use, distribution or reproduction is permitted which does not comply with these terms.
*Correspondence: Alessandro Bonaccorso, YWxlc3NhbmRyby5ib25hY2NvcnNvQGluZ3YuaXQ=
Disclaimer: All claims expressed in this article are solely those of the authors and do not necessarily represent those of their affiliated organizations, or those of the publisher, the editors and the reviewers. Any product that may be evaluated in this article or claim that may be made by its manufacturer is not guaranteed or endorsed by the publisher.
Research integrity at Frontiers
Learn more about the work of our research integrity team to safeguard the quality of each article we publish.