 Maren Jenrich1,2*
 Michael Angelopoulos1,2
 Guido Grosse1,2
 Pier Paul Overduin1
 Lutz Schirrmeister1
 Ingmar Nitze1
 Boris K. Biskaborn3
 Susanne Liebner4,5
 Mikhail Grigoriev6
 Andrew Murray7
 Loeka L. Jongejans1,2
 Jens Strauss1
- 1Alfred Wegener Institute, Helmholtz Centre for Polar and Marine Research, Section of Permafrost Research, Potsdam, Germany
- 2University of Potsdam, Institute of Geosciences, Potsdam, Germany
- 3Alfred Wegener Institute, Helmholtz Centre for Polar and Marine Research, Section of Polar Terrestrial Environmental Systems, Potsdam, Germany
- 4GFZ German Research Centre for Geosciences, Section Geomicrobiology, Potsdam, Germany
- 5Institute of Biochemistry and Biology, University of Potsdam, Potsdam, Germany
- 6Melnikov Permafrost Institute, Russian Academy of Sciences, Siberian Branch, Yakutsk, Russia
- 7Nordic Laboratory for Luminescence Dating, Department of Geoscience, Aarhus University and DTU Physics, Risø Campus, Roskilde, Denmark
Permafrost region subsurface organic carbon (OC) pools are a major component of the terrestrial carbon cycle and vulnerable to a warming climate. Thermokarst lagoons are an important transition stage with complex depositional histories during which permafrost and lacustrine carbon pools are transformed along eroding Arctic coasts. The effects of temperature and salinity changes during thermokarst lake to lagoon transitions on thaw history and lagoon deposits are understudied. We analyzed two 30-m-long sediment cores from two thermokarst lagoons on the Bykovsky Peninsula, Northeast Siberia, using sedimentological, geochronological, hydrochemical, and biogeochemical techniques. Using remote sensing we distinguished between a semi-closed and a nearly closed lagoon. We (1) characterized the depositional history, (2) studied the impact of marine inundation on ice-bearing permafrost and taliks, and (3) quantified the OC pools for different stages of thermokarst lagoons. Fluvial and former Yedoma deposits were found at depth between 30 and 8.5 m, while lake and lagoon deposits formed the upper layers. The electrical conductivity of the pore water indicated hypersaline conditions for the semi-closed lagoon (max: 108 mS/cm), while fresh to brackish conditions were observed beneath a 5 m-thick surface saline layer at the nearly closed lagoon. The deposits had a mean OC content of 15 ± 2 kg/m3, with higher values in the semi-closed lagoon. Based on the cores we estimated a total OC pool of 5.7 Mt-C for the first 30 m of sediment below five mapped lagoons on the Bykovsky Peninsula. Our results suggest that paleo river branches shaped the middle Pleistocene landscape followed by late Pleistocene Yedoma permafrost accumulation and early Holocene lake development. Afterward, lake drainage, marine flooding, and bedfast ice formation caused the saline enrichment of pore water, which led to cryotic talik development. We find that the OC-pool of Arctic lagoons may comprise a substantial inventory of partially thawed and partially refrozen OC, which is available for microbial degradation processes at the Arctic terrestrial-marine interface. Climate change in the Arctic leading to sea level rise, permafrost thaw, coastal erosion, and sea ice loss may increase the rate of thermokarst lagoon formation and thus increase the importance of lagoons as biogeochemical processors of former permafrost OC.
Introduction
Over the last 2 decades, the Arctic has been warming more than twice as fast as the global average (Johannessen et al., 2004; Berner et al., 2005; Notz and Stroeve 2016). This amplified warming has led to rapid surface warming in Siberia with modeled temperature rise of up to 4°C over the last 5 decades (Romanovsky et al., 2010; Biskaborn et al., 2019; Lenssen et al., 2019; GISTEMP Team, 2020). As a consequence, permafrost is thawing in many regions, mobilizing large amounts of sediments including organic carbon and allowing microbial decomposition of previously frozen organic matter (Strauss et al., 2013; Strauss et al. 2021; Schuur et al., 2015). Arctic coastal systems are especially affected by rapid permafrost thaw and mobilization of organic matter by erosion and marine inundation (Fritz et al., 2017). Lagoons, a frontier environment between land and ocean, are transitional and dynamic coastal landforms combining characteristics of both terrestrial and marine systems (Kjerfve, 1994; Tagliapietra et al., 2009; Harris et al., 2017). Globally, coastal lagoons are defined as shallow coastal water bodies separated from the sea by a barrier, connected at least intermittently to the ocean by one or more restricted inlets, and usually have a shore-parallel orientation (Kjerfve, 1994). As lagoons are complex and diverse systems, there are many different approaches to classify them, for example based on geomorphological and geological origin, their morphological properties such as size and water depth (Kosyan, 2016), the degree of isolation from the sea (Kjerfve, 1994), their physicochemical state (for example, salinity, ionic composition, temperature, turbidity, nutrients) (Tagliapietra et al., 2009), or the degree of influence by living organisms such as corals and humans (Brovko 1990).
Permafrost thaw results in landscape change as melting excess ground ice causes surface subsidence, eventually forming thermokarst lakes (Osterkamp et al., 2009; Jones et al., 2011; Lenz et al., 2016). Along eroding sections of Arctic coasts, lowered thermokarst terrain is affected by flooding of nearshore thermokarst lakes and basins with seawater, transforming them into thermokarst lagoons (Ruz et al., 1992; Romanovskii et al., 2000). Thermokarst lagoons are also formed by natural thermokarst lake dynamics in the course of lake drainage at coasts (Arp et al., 2010). However, rates of formation are expected to intensify as a result of ongoing climate change in the Arctic. Increasing coastal erosion (Günther et al., 2015; Jones et al., 2018), sea-level rise (Proshutinsky et al., 2001; Watson et al., 2015; Nerem et al., 2018), and higher sea water temperatures (Bindoff et al., 2007) are likely to result in an acceleration of erosion of permafrost coasts and in particular lagoon formation. Incubation experiments performed by Tanski et al. (2019) indicate that along eroding permafrost coastlines, large amounts of carbon dioxide can be produced. Therefore, thermokarst lagoon formation is an important process affecting permafrost carbon pools along rapidly changing permafrost coasts. In addition, marine inundation affects the temperature and salinity of taliks formerly beneath thermokarst lakes during their transition to the marine environment (Angelopoulos et al., 2020a). The formation of hypersaline, unfrozen ground beneath thermokarst lagoons may preserve existing thermokarst lake taliks, forming migration pathways for methane (Shakhova et al., 2019; Angelopoulos et al., 2020a). However, lagoon formation can also cause taliks to partially refreeze, provided that heat loss is faster than salt diffusion (Angelopoulos et al., 2020a). Ascending gas can get trapped below low-permeability sediment layers (Ruppel and Kessler, 2017) and be released when conditions warm up. These pathways, which may contain low-permeability ice-saturated zones, become part of the offshore environment with sufficient coastal erosion and so become potential sources of gas release in subsea permafrost areas (Frederick and Buffett, 2014; Shakhova et al., 2017).
Although thermokarst lagoons are widespread along the pan-Arctic coast (Jenrich, 2020), there is still no qualitative or quantitative assessment of their distribution or of the size of the total carbon reservoir they represent. Until now, Arctic thermokarst lagoon research has concentrated on the Mackenzie Delta region in Northwest Canada (Hill, 1990; Ruz et al., 1992; Héquette et al., 1995; Campeau et al., 2000; Solomon et al., 2000) and the Bykovsky Peninsula in Northeast Siberia. On the Bykovsky Peninsula, several lagoons have evolved from thermokarst lake basins in ice-rich Yedoma Ice Complex permafrost, and these are now actively developing in different stages (Romanovskii et al., 2000; Romanovskii et al., 2004; Ulyantsev et al., 2017; Schirrmeister et al., 2018). Still, little is known of the sedimentary history of thermokarst lagoons, the impact of marine inundation, and the amount and quality of carbon stored in greater depths.
To address these research gaps, we applied a multidisciplinary approach to characterize the sedimentological, geochronological, hydrochemical, and biogeochemical properties of two approximately 30 m deep (below lagoon ice surface level in spring) sediment cores from two typical thermokarst lagoons on the Bykovsky Peninsula (Figure 1). We paired this with remote sensing observations to identify, map, and characterize thermokarst lagoons in a regional context along the coast of the Bykovsky Peninsula. The specific aims of this paper are to characterize (1) the sediments and (2) pore water below the lagoons and (3) to quantify the regional carbon inventory based on spatially explicit lagoon areas in the region.
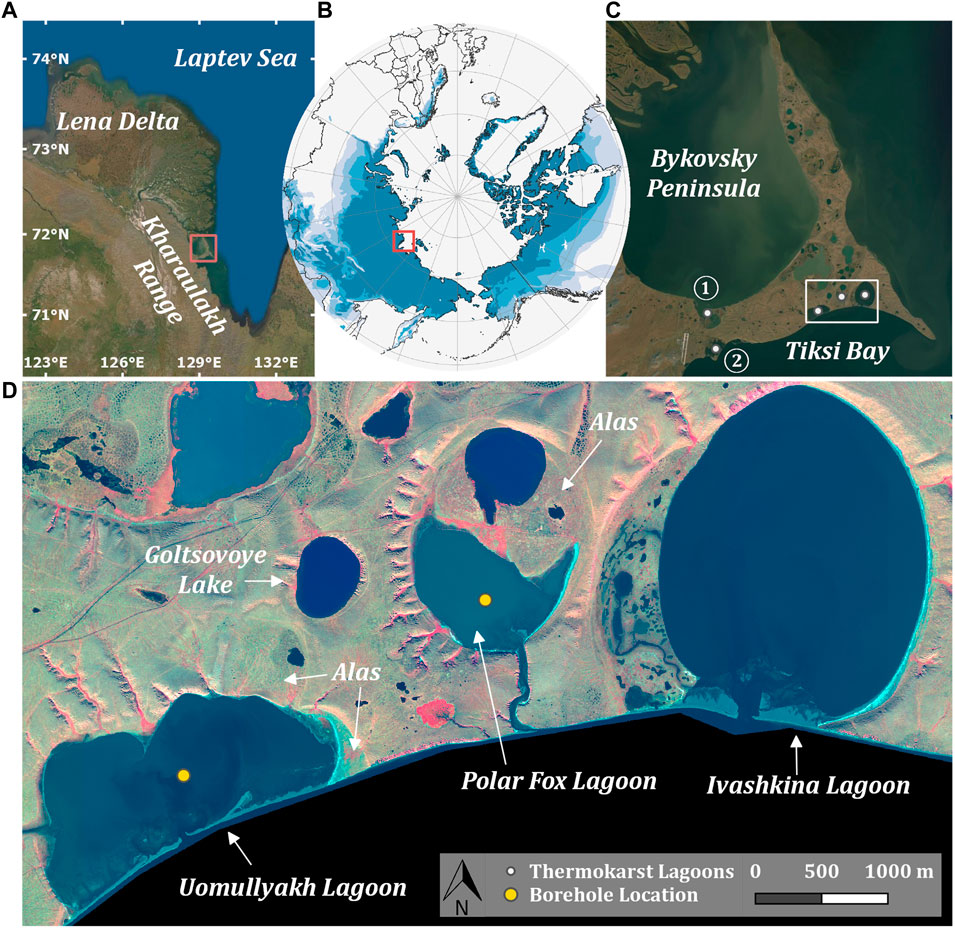
FIGURE 1. Bykovsky Peninsula in Northeast Siberia, south of Lena Delta (A, B). Both the Stepanenko ① and Safroneeva ② lagoons (C) as well as the Uomullyakh, Polar Fox, and Ivashkina lagoons are located at the southern coast of the Bykovsky Peninsula (D). The drilling locations in the lagoon centers of Uomullyakh and Polar Fox lagoons are indicated by yellow dots (D). Source imagery: (A, C): ESRI Satellite World Imagery b: Permafrost extent regions based on Brown et al. (1997) (D) WorldView3 false colour satellite image (8-5-3), acquired 2016-09-02.
Study Area
The lagoons investigated here are the semi-closed Uomullyakh Lagoon (UoL) and the nearly closed Polar Fox Lagoon (PFL) (Table 1), located on the southern coast of the Bykovsky Peninsula (71°51′ N, 129°19′ E) (Strauss et al., 2018, Figure 1D). The peninsula is located in Northeast Siberia (Figure 1B), at the mouth of the Bykovskaya Channel, one of the main outflow channels of the Lena River Delta (Figure 1A). The hinterland of the Bykovsky Peninsula is the Kharaulakh Range with elevations up to 500 m above sea level (asl), which is part of the northern foothills of the Verkhoyansk Mountains. The peninsula consists of the remains of a former late Pleistocene sediment accumulation plain with elevations of up to 45 m asl (Schirrmeister et al., 2002; Schirrmeister et al., 2018). It lies within the continuous permafrost zone and is characterized by thick, ice-rich Yedoma Ice Complex deposits (Grosse et al., 2007). Postglacial sea level rise during the Lateglacial interstadial and the early Holocene inundated the shallow Laptev Sea shelf and transformed terrestrial permafrost into subsea permafrost (Romanovskii et al., 1998; Lantuit et al., 2011). Cliffs and thermokarst basins are the typical backshore coastal landforms. Sixteen large thermokarst depressions are found on the peninsula (Grosse et al., 2005; Fuchs et al., 2018). In total, more than 50% of the Bykovsky Peninsula is strongly influenced by thermokarst and thermo-erosion landforms (Grosse et al., 2005; Lantuit et al., 2011).
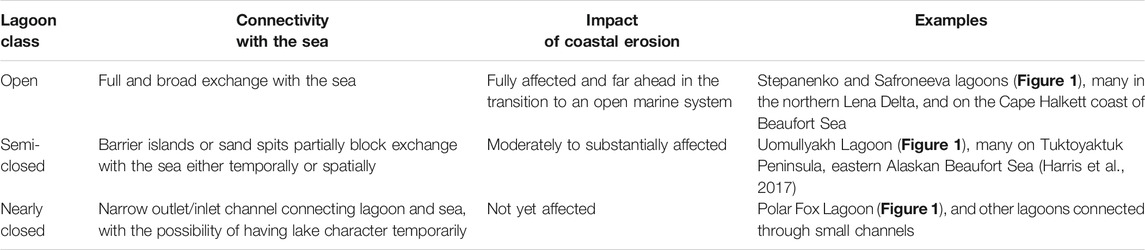
TABLE 1. Classification of lagoons into “open”, “semi-closed” and “nearly closed” lagoon systems which occur along a gradient of coastal erosion.
According to the Köppen–Geiger world climate classification (Peel et al., 2007), the peninsula is located in the polar tundra climate zone (ET). Despite the coastal location, the climate is strongly continental with long, cold winters (September–May) and short, cool summers. In January, the mean air temperature is −30.0°C and rises to +8.5°C in July (1987–2016). The mean annual precipitation does not exceed 350 mm (Tiksi Hydrometeorological Observatory, WMO 218240). The open-water season in the southern Laptev Sea starts on average in mid-June and extends to mid-October (Lantuit et al., 2011).
During drilling campaigns within the Russian-German science cooperation Lena Expedition in 2017, deep sediment cores from two thermokarst lagoons (UoL and PFL) and one thermokarst lake (Goltsovoye Lake (GoL)) were drilled on the Bykovsky Peninsula (Figure 1D). Furthermore, sediment characteristics of a 6.2 m deep core from the Ivashkina Lagoon (IvL) drilled in 1999 were published by Schirrmeister et al. (2018). The results showed several stages of landscape development from the initial Yedoma Ice Complex through thaw-induced lake development and eventually lagoon formation. In this study, we report on results from the approximately 30 m deep cores from Polar Fox and Uomullyakh lagoons.
The Uomullyakh Lagoon (71°43′51″N, 129°16′21″E, Figure 1D) is a 2.1 km2 large, shallow lagoon (water depth 0.8 m at the borehole location) with underlying former Yedoma and Alas permafrost (Strauss et al., 2018). The lagoon is well connected with the Tiksi Bay via a 90 m wide opening in the center of the narrow and flat sand spit, which can be flooded by storm surges. In April 2017, test hole drilling (17 locations) with a Kovacs 5 cm diameter ice auger revealed bedfast ice at all locations. However, bathymetry surveys in summer 2017 (Strauss et al., 2018) suggest that small isolated water pockets might have existed in April 2017. We recorded 40 cm of compacted snow on top of 80 cm ice, which was overlying the frozen lagoon bed at the drilling location (71°43′51″N, 129°16′29″E). In the west, the lagoon is connected to two drained thermokarst lakes basins by a former drainage channel.
The Polar Fox Lagoon (71°44′35″N, 129°20′16″E; Figure 1D) is a smaller sized (0.6 km2), brackish to salty water body (water depth 3.30 m in the lagoon center) formed after partial lake drainage. This nearly closed lagoon is located in a partially drained thermokarst basin (Alas in Figure 1D) and is connected to the sea only during the open water season via an 800 m long and roughly 50 m wide outlet channel. The water level in the lagoon is at about sea level and water flow occurs in both directions depending on wind, wave, and tide conditions. Ice thickness measurements from April 2017 and bathymetry from July 2017 suggest that the lagoon was 75% covered with bedfast ice (Angelopoulos et al., 2020a). In the center of the lagoon, at the borehole location (71°44′58″N, 129°20′30″E), a 175 cm salty water layer was present underneath the 155 cm thick seasonal ice layer in April 2017 (Strauss et al., 2018).
Both lagoons are strongly impacted by warm freshwater discharge from the Lena River into the Buor Khaya and Tiksi bays (Juhls et al., 2019). This discharge causes large seasonal and interannual variations in temperature and salinity (Supplementary Table S1). For example, Polar Fox Lagoon had a salinity of 13 psu (practical salinity unit) and 44 psu below the ice cover in April 2017 and April 2019, respectively. In July 2017, the salinity dropped to less than 1 psu.
Methods
Field Work
Fieldwork on the Bykovsky Peninsula was carried out in April 2017 (Strauss et al., 2018). Over eight days, a 33.5 m deep borehole was drilled from the ice surface on UoL (core number PG2410) and a 31 m deep borehole was drilled from the ice surface of neighboring PFL (PG2411) (Figure 1) using a URB2-4T drilling rig mounted on a tracked vehicle. The sediment core retrieved at UoL was 32.3 m long and at PFL 27.7 m long. Immediately after recovery, the cryolithology of the sediment cores was visually described and the cores were packed and transported frozen to AWI Potsdam. GeoPrecision temperature chains were installed in both boreholes, each with an accuracy of ± 0.1°C at 0°C and a resolution of 0.01°C. The thermistors had been calibrated in a MilliQ water-ice bath to measure their offset from 0°C prior to deployment. The chains remained in the boreholes for 5 days at Polar Fox Lagoon and 11 days at Uomullyakh Lagoon. To account for drilling heat effects, the observed temperature drift for each thermistor was analyzed following Lachenbruch et al. (1982) to estimate the undisturbed temperature. Both sediment cores were mostly unfrozen but had some partially frozen layers. The heat generated during the drilling of the cores caused the cores to partially thaw, so that the on-site haptic observation of the frozen state included some uncertainty. The PFL raw temperature data is available from Angelopoulos et al. (2020a) and the UoL temperature data and processing are described in the supporting information (Supplementary Figure A4).
Laboratory Analyses
In the cold lab (−9°C), the sediment cores were opened, cleaned and split, and the cryolithology was described in more detail. Furthermore, the core halves were photographed and subsamples were taken approximately every 50 cm for laboratory analyses. For the Polar Fox core, a higher sampling resolution of about every 10 cm was used for pore water extraction.
Hydrochemical Analyses
Pore water was extracted from thawed samples using Rhizons™ with a membrane pore size of 0.15 µm and analyzed for pH, electrical conductivity (EC, mS/cm), DOC (mg/L) and stable water isotopes (δD, δ18O (‰ vs. VSMOW)). The pH and EC values were measured with a WTW Multilab 540 (accuracy: ± 0.01/± 1 mV). DOC samples were acidified with 50 μL of 30% HCl supra-pure and stored at + 4°C until measured with a Shimadzu Total Organic Carbon Analyzer (TOC-VCPH) (accuracy: ± 1.5%) following Fritz et al. (2015). For analyzing the ratios of δD and δ18O, water and ice samples were processed following Meyer et al. (2000) and measured with a Finnigan MAT Delta-S mass spectrometer.
Sedimentology Analyses
Grain size measurements were conducted to gain information about the transportation medium and the level of sediment accumulation at the study areas. Mass specific magnetic susceptibility, describing the ability of a material to be magnetized, gives an indication of the amount of ferri- and ferromagnetic minerals in a sample. Differences in mineral composition between samples usually indicate sediment sources and changes in stratification (Liu et al., 2010). For both measurements the samples were pre-weighed and freeze-dried. The absolute ice or water content was determined based on the difference in weight before thawing and after freeze drying related to the wet weight (Phillips et al., 2015). The bulk density (BD in kg/m3) was calculated from the ice content according to Strauss et al. (2012). The grain size distributions of 74 samples from both cores were measured with a Malvern Mastersizer 3000 laser particle size analyser with a measuring range of 0.01–1000 µm. Additional details on BD calculation and grain size measurement can be found in the supplementary material. Mass-specific magnetic susceptibility (MS in 10–8 m3/kg) was measured with a Magnetic Susceptibility Meter (Model MS2, Sensor Type MS 2B, Bartington Instruments) on the freeze-dried, but not homogenized samples at a frequency of 0.465 kHz (low frequency).
Bulk Biogeochemistry
To gain information about changes in the nutrient cycle during the transformation of terrestrial permafrost into sub-aquatic permafrost, the biogeochemical parameters total nitrogen (TN), total carbon (TC) and total organic carbon content (TOC), and their stable isotopes (δ13C and δ15N) were measured and the TOC/TN ratio determined. The parameters TOC/TN and δ13C are widely used as a broad indicator for the degree of decomposition and source of organic matter (OM) (e.g. Mary et al., 1992; Meyers 1994; Meyers, 1997; Gundelwein et al., 2007; Andersson et al., 2012; Strauss et al., 2015). Generally, a lower TOC/TN ratio and higher δ13C indicate more decomposed organic material (Schirrmeister et al., 2011; Strauss et al., 2015). Since microorganisms prefer easily accessible carbon compounds, the organic carbon quality decreases with increasing organic matter decomposition (Schowalter, 2016). Using δ13C and TOC/TN, it is possible to distinguish between land plants and marine, brackish and freshwater algae (decreasing δ13C is associated with decreasingly saline environment) (Meyers et al., 1994) (Supplementary Table S2).
To determine TC and TN content, the homogenized, freeze dried and ground samples were measured with a carbon–nitrogen–sulfur analyzer (Vario EL III, Elementar). TOC was measured with a TOC analyser (Vario Max C, Elementar). We measured two replicates of each sample and accepted only <5% deviation for the replicates. The TOC/TN ratio is expressed as atomic TOC/TN value to ensure comparability between studies. The atomic TOC/TN value was calculated following Meyers et al. (1994) by multiplying the weight ratio with 1.167, which is the ratio of the atomic weights of nitrogen (14.007 amu, atomic mass unit) and carbon (12.001 amu). The rate of mineralization was considered high at TOC/TN < 12, moderate between 12 and 25, and low at values >25 (Walhert et al., 2004).
The volumetric TOC content (carbon density, kg TOC/m3) was calculated following Strauss et al. (2013) according to Eq. 1:
where Vref is the reference volume of 1 m3, BD in kg/m3 and TOC in wt%.
The stable carbon and nitrogen isotopic composition was measured for all samples with TOC or TN values above the detection limit (0.1 wt%) with a ThermoFisher Scientific Delta-V-Advantage gas mass spectrometer equipped with an organic elemental analyser Carlo-Erba NC2500 (accuracy: < 0.2‰). Measured δ13C and δ15N was compared to the standardized Vienna Pee Dee Belemnite (VPDB) and expressed in per mille (‰ vs. VPDB). TOC and TN values below the detection limit were neglected in further calculations.
Geochronology
For radiocarbon dating, we chose samples about every 3 m (n = 19 for both cores). When present, macroplant remains were hand-picked under a stereomicroscope, otherwise bulk sediment was selected and dated using Accelerator Mass Spectrometry in the AWI MICADAS (MIni radioCArbon DAting System) Laboratory in Bremerhaven. Radiocarbon dates were calibrated using Calib 7.04 software after (Reimer et al., 2013) and the IntCal13 calibration curve (Stuiver et al., 2020) to calculate calibrated years before present (cal. years BP).
For optically stimulated luminescence (OSL) dating, three core segments were selected in the field from the Uomullyakh core, and two from the Polar Fox core. The core segments were frozen in their original state, wrapped in black foil, and delivered frozen to Aarhus University’s Nordic Laboratory for Luminescence Dating (Roskilde, Denmark). The core segments were then thawed in a controlled-light environment and the outer ∼5 mm removed to minimize the effects of smearing, and to ensure that the material used for OSL measurements had not been exposed to daylight during or after retrieval. Luminescence measurements were made using a Risø TL/OSL reader, model TLDA 20. A standard SAR protocol based on Murray and Wintle (2000; 2003) was used for quartz dose estimation, and a comparison with feldspar data was used to investigate the degree of bleaching at deposition (e.g. Möller and Murray, 2015). Radionuclide concentrations were measured using high resolution gamma spectrometry (Murray et al., 1987; Murray et al., 2018), calibrated using Certified Reference Materials produced by Natural Resources Canada (NRCAN). For detailed information see supplementary material.
Borehole Temperature Measurements and Calculation of Freezing Conditions
Ground temperature was recorded for 11 days in the Uomullyakh borehole and for 5 days in the Polar Fox borehole in April 2017. The freezing point depression ΔTf of the sediment was calculated from the molality of dissolved ions estimated from the measured pore water electrical conductivity according to Eq. 2 (Atkins, 2018) and then compared with the measured borehole temperatures.
This equation describes the lowering of the freezing point of free water with the salt content c (mol/kg). R is the universal gas constant 8.314 J/(K mol), Tm,fw is the freezing point of free water (273.15 K) and Lf is the latent heat of fusion of water (334,000 J/kg). For the conversion of the measured EC to molality (mol/kg) the MATLAB implementation of TEOS-10 (McDougall and Barker 2011) was used. It has been demonstrated that TEOS-10 also performs well for hypersaline solutions (Pawlowicz, 2012). Further details can be found in the supplementary material.
Lagoon Mapping
Along the coast of the Bykovsky Peninsula six lagoons exist, five of them originated from thermokarst basins (Jenrich, 2020). All of them are located in the southern part of the peninsula (Figure 1). We used a simple geomorphological approach to further differentiate them based on their connectivity with the ocean into open, semi-closed and nearly closed thermokarst lagoons (Table 1).
The extent of each of the five lagoons was determined using the Global Surface Water dataset which is based on Landsat-5, -7, and -8 satellite images from 1984 to 2018 at 30 m resolution (Pekel et al., 2016). Water bodies were defined by a water occurrence threshold of >75% over this time period. The raster dataset was vectorized and smaller geometric errors, which occurred during vectorization, were solved with the Fix Geometry function in QGIS3.6. The five Bykovsky Peninsula lagoon polygons were selected manually and these water bodies were split from the ocean by using the function “split by line”. The resulting lagoon polygons were re-projected in UTM Zone 52N (EPSG:32652) to calculate the polygon area in km2.
Upscaling Carbon Pools
The organic carbon pools of Uomullyakh and Polar Fox lagoons were estimated after Jongejans et al. (2018) using Equation 3, based on a deposit thickness of 30 m, the lagoon size, bulk density, and TOC content. We assume that there is no form of massive ice in the thermokarst lagoon sediments, so that the TOC pool can be calculated as:
with thickness and coverage in m, BD in kg/m3 and TOC in wt%. For further calculations, we assumed a TOC of 0.05 wt% for the samples with TOC below the detection limit (n = 21). To compensate for data gaps caused by core loss or larger sampling distances, the BD and TOC values were first multiplied, and the depth interval given as the difference of two adjoining depths was calculated. For core loss sections, this interval was accordingly higher. The product of BD and TOC was weighted and replicated for each depth interval. To interpolate the carbon content of point measurements to greater areas, the data was resampled using the bootstrapping method after Jongejans and Strauss (2020). Assuming that the deposition of organic material in the study area did not show significant differences, the calculated C-budgets of UoL and PFL were averaged and upscaled on the three further lagoons on the peninsula. Therefore, the size of each lagoon was multiplied with the mean of the TOC pool of UoL and PFL, and divided by the mean size of UoL and PFL.
Statistics
We used the R environment to perform various statistical analyses on 10 parameters (R Core Team (2016); R version 3.6.3). In order to compare the differently scaled parameters, the data was normalized with the function "normalize". To subdivide the cores into stratigraphic zones, the stratigraphically constrained, incremental sum of squares cluster analysis (CONISS) was applied. Thereby, only stratigraphically adjacent clusters are considered for merging. The CONISS clustering was performed in R with the 'chclust' function from the package 'rioja'. The used dissimilarity index was 'bray'. In order to compare the properties at the time of sediment deposition, only sedimentological and biogeochemical parameters were included in the calculation. In total 10 parameters: mean depth, grain size (mean, volumetric proportion of clay, silt and sand), mass specific magnetic susceptibility, TOC, TN, TOC/TN and δ13C. Hydrochemical parameters were not used as pore water in unfrozen soil is flowing and mixing constantly and so does not represent the hydrochemical composition at the time of sediment deposition. The results were visualized in a dendrogram. The cutting point was selected based on visual validation and dating results.
A principal component analysis (PCA) was performed on the same parameters to reduce this high-dimensional data set to fewer dimensions and to detect patterns in the distribution of sedimentological and biogeochemical parameters over depth. The results were visualized in a biplot. The arrows show the loading on each variable, with the length approximating the variance and the angle between the arrows their correlation. Points close together correspond to depth that have similar scores on the PCA components. PCA was performed using the ‘prcomp' function from the Package ‘stats'.
Results
The cores are described according to the depositional record from bottom to top. All depth specifications refer to the top of the ice cover (contains a compacted snow layer on top of lagoon ice) unless they are specifically stated as sediment depth, in which case we refer to the depth from the top of sediment. The units were separated according to a vertical cut in the dissimilarity dendrogram at height 7 for the Uomullyakh sediment core (Figure 2) and at height 4 for the Polar Fox sediment core (Figure 3). Therefore, the Uomullyakh core (PG2410, core recovery of 85%) was divided into three units, whereby Unit I was divided into two subunits: UoL-UIII ranges from 3350 to 1480 cm, UoL-UII from 1480 to 820 cm, UoL-UIa from 820 to 320 cm and UoL-UIb from 320 to 120 cm depth. The Polar Fox sediment core (PG2411, core recovery of 70%) was also divided into three units: PFL-UIII from 3070 to 2080 cm, PFL-UII from 2080 to 860 cm and PFL-UI ranges from 860 to 330 cm depth.
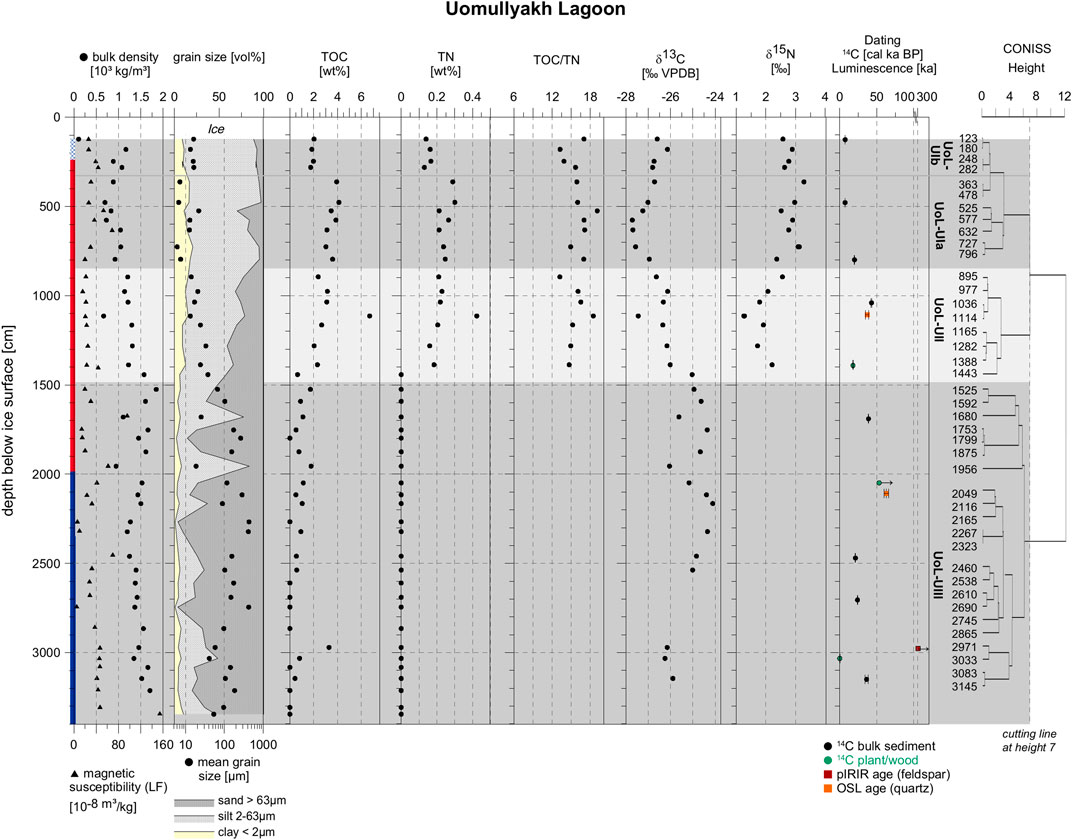
FIGURE 2. Summary of sedimentological, geochronological and biogeochemical parameters for the Uomullyakh Lagoon core: bulk density (upper axis), mass specific magnetic susceptibility (lower axis), grain size (upper axis: volumetric proportions, lower axis: mean grain size), total organic carbon content (TOC), total nitrogen content (TN), organic carbon and nitrogen ratio (TOC/TN), stable carbon and nitrogen isotope composition (δ13C, δ15N), radiocarbon dating (14C) and luminescence dating (pIRIR, OSL). The top 120 cm is the overlying ice cover. The core was divided into three stratigraphic units based on a CONISS analysis. Color bar at the y-axis indicates frozen (blue), unfrozen (red) and partially frozen (shaded) core segments. Note that “frozen” includes visibly frozen core sections and re-constructed frozen conditions. Arrows indicate non-finite ages.
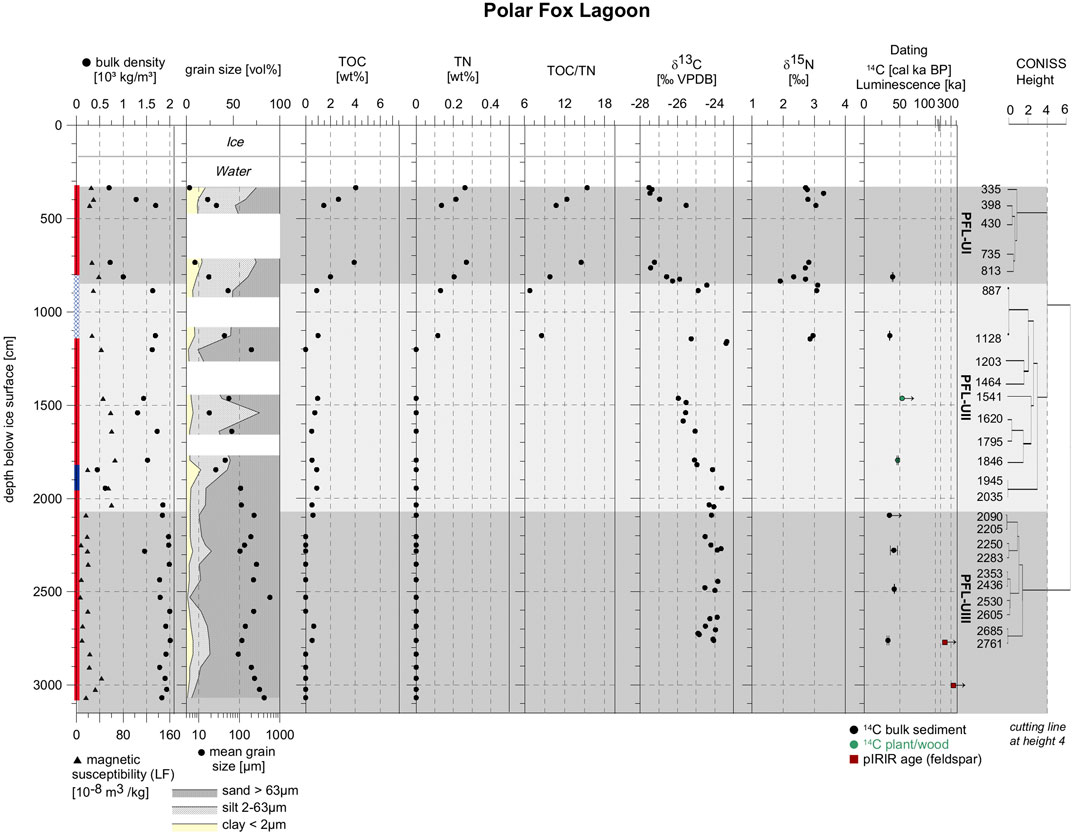
FIGURE 3. Summary of sedimentological, geochronological and biogeochemical parameters for Polar Fox Lagoon core: bulk density (upper axis), mass specific magnetic susceptibility (lower axis), grain size (upper axis: volumetric proportions, lower axis: mean grain size), total organic carbon content (TOC), total nitrogen content (TN), organic carbon and nitrogen ratio (TOC/TN), stable carbon and nitrogen isotope composition (δ13C, δ15N), radiocarbon dating (14C) and luminescence dating (pIRIR). The top 330 cm is the overlaying ice and water layer. The core is divided into three stratigraphic units based on a CONISS analysis. Color bar at the y-axis indicates frozen (blue), unfrozen (red) and partially frozen (shaded) core segments. Arrows indicate non-finite ages.
Core Description
At UoL, from core bottom up to 1480 cm depth (UoL-UIII), the grain-size of the sediments alternated several times from silty fine sand to coarse-grained sand. Rounded pebbles up to 2 cm in diameter were found up to 1030 cm depth. In UoL-UII, layers of silty fine sand became thicker and coarse-grained layers thinner. From 820 cm to the top (UoL-UI), the sediment consisted of black to dark grey clayish to silty fine sand with parallel sediment structures. UoL-UIb was partially frozen. From 2100 cm downwards the sediment was rich in structureless ground-ice. Between the frozen parts the core was thawed. Several organic-bearing layers were encountered along the core. At 1530 cm, a layer of large wood pieces (up to 5 cm in size) was observed.
At PFL, the sediment gradually became finer upwards in the core. From core end up to 860 cm (PFL-UIII & II), the sediment was sandy with fine, medium and coarse sand alternating frequently. Rounded pebbles up to 3 cm in diameter were found up to 1120 cm depth. Above 860 cm in PFL-Unit I, the sediment was dark grey and increasingly silty. From 630 cm onwards, shell and plant remains were encountered. Between 2245 cm and 2100 cm two 5–10 cm thick macro organic containing layers were observed. At 1810 cm, a 5 cm layer of large wood pieces (up to 8 cm in size) similar to UoL was found. The upper 1500 cm of sediment contained only sparse organic remains. The core was mostly thawed and had only small frozen sections (1815–1855 cm, 2040–2050 cm and 2970–2985 cm, and ground ice structures between 810 and 1160 cm).
Geochronology
Radiocarbon dates for the Uomullyakh Lagoon core ranged from >53.2 cal ka BP to 2.6 cal ka BP (Figure 2, Supplementary Table S3) and showed several age inversions from 1036 cm depth downwards. The upper two samples until 478 cm depth were of early Holocene age. Both the oldest sample (>53 cal ka BP) at a depth of 2049 cm, and the (even deeper) youngest sample (2.6 cal ka BP) at 3033 cm, were from plant macrofossils. Bulk organic samples also showed inversions although not so extreme, and varied between 18 and 34 cal ka BP. The luminescence ages of quartz (OSL) and feldspar (pIRIR) (Supplementary Table S4) were similar in range to the radiocarbon dates at 1107 cm [37 ± 2 ka (OSL), 29.9 ± 1.6 ka (pIRIR) and 43.0 ± 0.6 ka cal BP (radiocarbon)] and 2108 cm depth [63 ± 3 ka (OSL), 59 ± 4 ka (pIRIR) and >53.2 ka cal BP (radiocarbon)]. Since quartz dose recovery was satisfactory for these samples from UoL, the OSL ages are considered more reliable for these samples than the feldspar and radiocarbon ages. The lowermost luminescence age at 2978 cm was non-finite for both quartz (>100 ka) and feldspar (>300 ka). Since feldspar provided the more limiting constraint, the minimum feldspar age is shown in Figure 2.
Radiocarbon dates for Polar Fox Lagoon ranged from > 53.3 cal ka BP to 33.5 cal ka BP (Figure 3, Supplementary Table S3). For the uppermost sample, the radiocarbon dating failed due to insufficient organic carbon content, so that available dates started at 480 cm sediment depth (corresponding to depth of 813 cm measured from ice surface). As seen at UoL, the age dating revealed no linear trend over depth. The youngest age was found in the greatest depth (2761 cm), while the oldest sample was found at 1130 cm sediment depth. The luminescence ages included only non-finite ages for quartz and feldspar of >100 ka and >300 ka at 2771 cm and of >100 ka and >320 ka at 3002 cm depth (Supplementary Figure S1, Table S4). Therefore, the feldspar pIRIR ages were used for interpretation of the lowest core ages, as with UoL.
The radiocarbon ages of the lowest unit UIII of both cores were not used in the discussion because of low carbon content and high risk of contamination. The results of the luminescence dating, aiming at a depositional age of mineral grains, were considered more reliable. The two samples with quartz OSL ages from the Uomullyakh Lagoon core had ages well within the range of the method and they were in stratigraphic order.
We acknowledge the fact that shore erosion and sediment mixing in such permafrost thaw-affected aquatic environments may easily result in radiocarbon age inversions and thus challenge chronological interpretation.
Detailed dose rate results and luminescence ages are summarized in Supplementary Table S4. Information on radionuclide concentrations are shown in Supplementary Table S5.
Sediment Characteristics
Uomullyakh Lagoon
The sediments of UoL-UIII (Figure 2) were very poorly sorted. Up to 2000 cm depth, sand dominated with a share of up to 96 wt%, mainly fine to medium sand (measured mean grain size of the < 1 mm fraction: 161 µm) and visually observed rounded pebbles up to 2 cm in size. The upper part of UoL-UIII was also characterized by an alternation of coarser deposits (mean grain size: 193 µm) with low MS of 20 × 10–8 m3/kg and fine deposits (mean grain size: 37 µm) with high MS values of 59 × 10–8 m3/kg. At the lower end of UoL-UII, the TN content decreased below the detection limit of 0.1 wt%. In UoL-UII, coarse sand layers with pebbles and silty fine sand layers alternated. The sand fraction decreased (mean grain size: 24.3 µm). At 1110 cm, TOC (6.7 wt%) and TN (0.4 wt%) values were at a maximum and were associated with low δ13C (−27.5‰ VPDB) and low δ15N (1.3‰) values (Supplementary Table S3). In Unit Ia of UoL, poorly sorted clay and silt deposits were predominant with a share of 16 and 73% respectively (mean grain size: 12.5 µm) (Figure 2). The TOC content ranged between 3.2 and 4.5 wt% and the TN content between 0.2 and 0.3 wt%. UoL-UIb, containing the upper 200 cm, was distinguished from the lower unit UoL-UIa by coarser grain size and lower TOC and TN content (1.9 wt% and 0.15 wt%, respectively). In samples with a mean grain size below 63 µm (mainly Units I and II), the δ13C values were mostly below −26‰ VPDB, whereas they were higher in coarse-grained samples. The bulk density decreased from the core bottom to the top (1600–100 kg/m3, mean 1200 kg/m3). For further details of the biogeochemical results see Supplementary Table S6. The MS ranged from 5 to 154 × 10–8 m3/kg, with variations mainly in areas of abrupt changes in grain size. Fine deposits corresponded with high TOC content over the core length.
Polar Fox Lagoon
The lowermost Unit III (PFL-UIII) stretching up to 2080 cm depth was characterized by a large proportion of coarse material (sand and gravel, measured mean grain size of the <1 mm fraction: 230 µm) and a very low organic carbon content of 0.1 wt%. The sediment of this unit was mostly moderately well sorted.
In the overlying PFL-UII the sorting was poor. Silty fine sand and medium sand layers alternated (mean grain size: 72.3 µm) along with MS changes. Changes in MS correspond to rapid increases in grain size (at 630 and 530 cm depth). MS ranged between 6 and 66 × 10–8 m3/kg, with particularly strong variation in the small frozen core sections. Overall, the Polar Fox Lagoon core had coarser material composition of the < 1 mm fraction than the Uomullyakh Lagoon core. The TOC content was low (0.7 wt%) and the TN content decreased to below the detection limit at 1200 cm depth.
The uppermost Unit I (PFL-UI) comprised approximately the uppermost 5 m of sediment (corresponding to a depth of 860 cm) and was characterized by clay, silt and fine sand (mean grain size: 15.1 µm). Samples of the upper and the lower half of this unit show the same pattern of decreasing grain size, associated with increasing TOC and TN contents, as well as an increase in TOC/TN ratio and a depletion in δ13C. In contrast to UoL-UI, TOC, maximal at 4 wt%, was highest in the uppermost sample (Supplementary Table S7). TN ranged between 0.14 and 0.27 wt%. Changes in MS corresponded to rapid increases in grain size (at 630 and 530 cm). MS ranged between 6 and 66 × 10–8 m3/kg, with particularly strong variation in the small frozen core sections.
Hydrochemistry and Reconstructed Freezing Conditions
Results of the hydrochemical analyses of pore water are shown in Figure 4 and also in Supplementary Table S8. The pore water pH of both lagoons was neutral to slightly alkaline with a median of 7.5 for UoL and 8.0 for PFL. The EC was much higher in the pore water of the UoL-core with a maximum of 108 mS/cm at 1955 cm depth (median: 83.1 mS/cm) and showed higher variations over depth. Relatively low EC values at 2267 and 2745 cm depth were correlated with heavy stable water isotopes (Supplementary Figure S2A). The EC of the Polar Fox core pore water was highest in the upper sediment layer (max: 41 mS/cm) and showed freshwater to brackish conditions from 800 cm depth downwards (median: 3.3 mS/cm). The DOC distribution differed between the two lagoons, while the median value was similar (UoL: 58 mg/L, PFL: 50 mg/L). In UoL, the DOC concentration varied most in the uppermost unit and was highest at 360 cm depth (282 mg/L), while in PFL the greatest variation was found in the lower 5 m with the highest DOC concentration measured at 2835 cm depth (221 mg/L; Figure 4 and Supplementary Table S8).
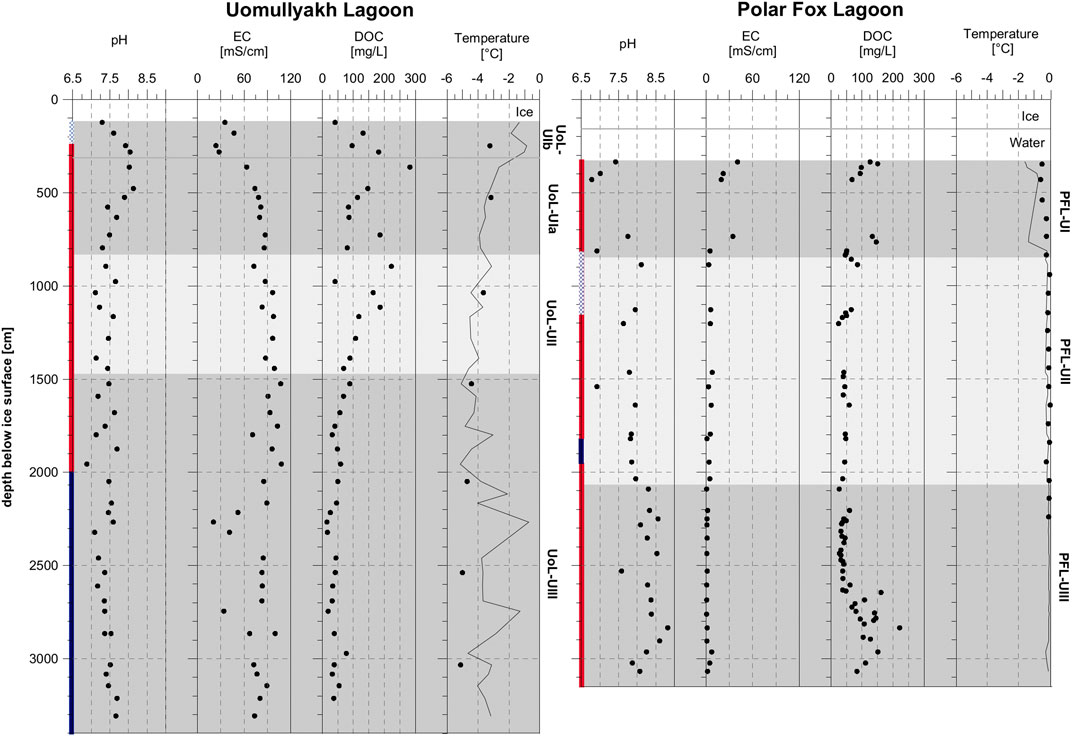
FIGURE 4. Hydrochemical parameters of the pore water and borehole temperature of the Uomullyakh Lagoon (left) and the Polar Fox Lagoon cores (right): pH, electrical conductivity (EC), dissolved organic carbon concentration (DOC), measured borehole temperature (point) and freezing point (line) estimated from pore water salinity. Color bar at the y-axis indicates frozen (blue), unfrozen (red) and partially frozen (shaded) core segments. Note that at UoL “frozen” includes visibly frozen core sections and re-constructed frozen conditions.
The stable water isotope composition was generally heavier in the pore water of the semi-closed Uomullyakh Lagoon (mean δ18O/δD: −20.9‰/−163.4‰) (Supplementary Figure S2A) than in the nearly closed Polar Fox Lagoon (mean δ18O/δD: −17.7‰/−133.7‰) (Supplementary Figure S3A). In the UoL core, the pore water of the upper sample had the lightest isotope composition with δ18O of −19.8‰, which is comparable to the upper 5 m of PFL core pore water where its isotope composition was heaviest. There was no significant difference in isotopic composition between frozen and unfrozen samples (Supplementary Figure S2B, S3B). For UoL, we found a depletion of δ18O with increased salinity. This was not found in the mainly freshwater to brackish dominated PFL core.
High freezing point depressions were observed for hypersaline samples (Figure 4) (e.g. for Uomullyakh at a depth of 1955 cm). For UoL, the borehole temperature was below the calculated freezing points in the lower core (1880 cm sediment depth and deeper) and thus the sediment could have been frozen at the time of drilling. In comparison to Uomullyakh, the Polar Fox borehole temperatures were significantly warmer (up to 5.2°C warmer) and significantly exceeded the calculated freezing point in the upper 480 cm of sediment above the partially frozen layer. Within Unit II and III of PFL, the calculated freezing point was very close to the observed temperature, suggesting that the system was close to equilibrium. This confirms the observations made in the field on the mostly thawed state of the core.
Carbon Pool Calculation
The surface areas for the Uomullyakh, Polar Fox, Ivashkina, Stepanenko, and Safroneeva lagoons were determined with remote sensing to be 2.10, 0.64, 3.87, 2.88, and 1.89 km2, respectively. The total thermokarst lagoon area is 11.4 km2. Table 2 presents C-budgets and C-density calculated for the upper 3 m and 30 m of the sediment deposited in the Uomullyakh and Polar Fox lagoons. Results were extrapolated for the deposits below the other three thermokarst lagoons on the southern Bykovsky Peninsula using mean values for C-budget and C-density of Uomullyakh and Polar Fox lagoons. Below UoL, a carbon stock of 0.15 ± 0.01 Mt with a carbon density of 24.37 ± 2.09 kg/m3 for the upper 3 m and 1.14 ± 0.2 Mt with a carbon density of 18.03 ± 3.12 kg/m3 for 30 m thick deposits was calculated. The upper 3 m of PFL stored 0.05 ± 0.001 Mt organic carbon with a density of 26.50 ± 0.57 kg/m3. The carbon stock amounts to 0.24 ± 0.04 Mt with a carbon density of 12.55 ± 0.04 kg/m3 for 30 m thick deposits. The total carbon pool of the thermokarst lagoons on the southern Bykovsky Peninsula is 5.72 ± 0.63 Mt with an average carbon density of 15.29 ± 1.94 kg/m3 for the upper 30 m (for the upper 3 m: 0.85 ± 0.09 Mt, 25.44 ± 0.75 kg/m3).
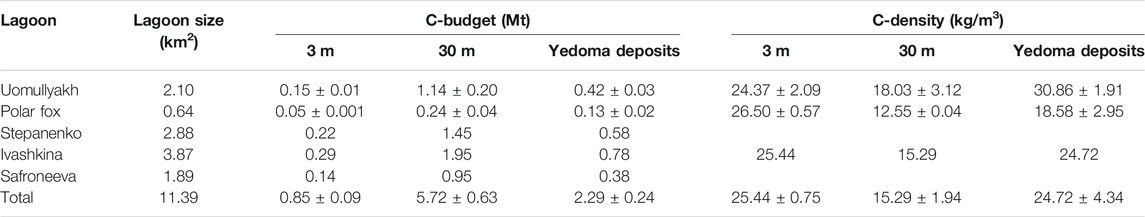
TABLE 2. Calculated carbon pools for the upper 3 m and 30 m deposits below Uomullyakh and Polar Fox lagoons and estimated carbon pools below the three additional thermokarst lagoons of the southern Bykovsky Peninsula. Calculation is based on the bootstrapping method. The C-density of Stepanenko, Ivashkina and Safroneeva lagoons is the mean of the C-density calculated for Uomullyakh and Polar Fox lagoons.
PCA
The first two PCA axes explained 88% of the variation in the data for the Uomullyakh Lagoon core and 82% for PF Lagoon core (Figure 5). Though the variance is small, two groups were distinguished for both lagoon cores. Shallow depth correlated with fine deposits and high organic matter content and quality, while in the deeper core, the variables sand content and δ13C were decisive. The main variance in the data was explained by differences in grain size and organic matter contents and composition along the core.
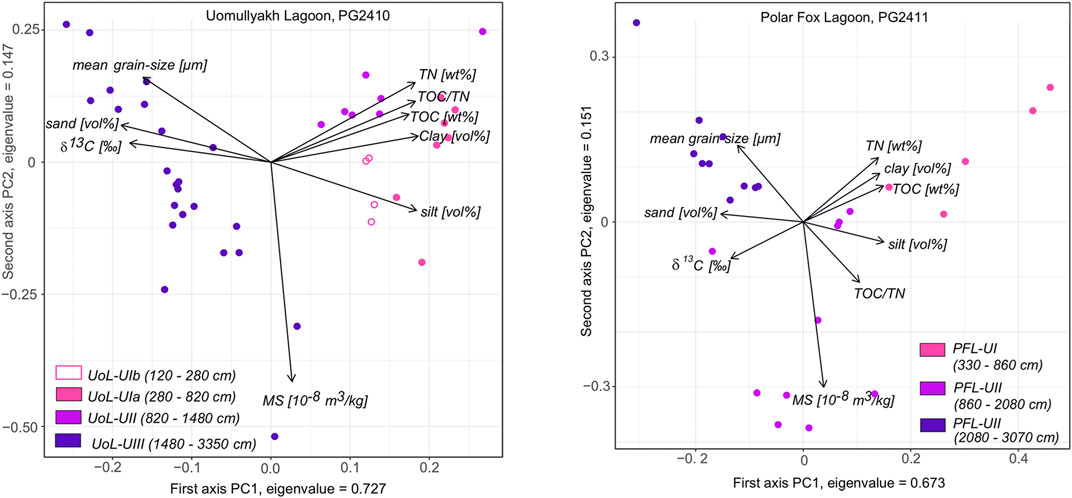
FIGURE 5. Principal component analysis of biogeochemical parameter (TN, TOC/TN, TOC and δ13C) and sedimentological parameter (volumetric and mean grain size, MS) for Uomullyakh Lagoon (left) and Polar Fox Lagoon (right). Main variance in the data is explained by differences in grain size and organic matter content and composition along the core.
Discussion
Depositional History and Sediment Facies
At both lagoons, we identified four phases of landscape development based on sedimentological and biogeochemical parameters. These are: 1. Middle/Late Pleistocene fluvial deposition, 2. Late Weichelian (MIS 2) Yedoma deposition, 3. Holocene thermokarst lake formation and 4. Holocene lagoon formation.
The grain size distribution of sediments beneath Uomullyakh Lagoon and Polar Fox Lagoon indicates a changing depositional environment over time. In both lagoons, the sediments represent accumulation over the last glacial and interglacial cycles (Table 3). It is very likely that only the top few meters were accumulated since the previous interglacial. Based on stratigraphically constrained cluster analysis (CONISS) and visual observation, we distinguished four main stages of the late Quaternary history of the study area. The horizontal axis of the dendrogram (heights) represents the distance and therefore dissimilarity between clusters. The CONISS analysis of the 10 sedimentological and biogeochemical parameters at UoL showed a greater dissimilarity between clusters as for PFL. That hints to a more diverse depositional history for UoL. The cut of the dendrogram at height 7 for UoL (Figure 2) and height 4 for PFL (Figure 3), divided the cores into three main units, which is supported by the results of the PCA (Figure 5).
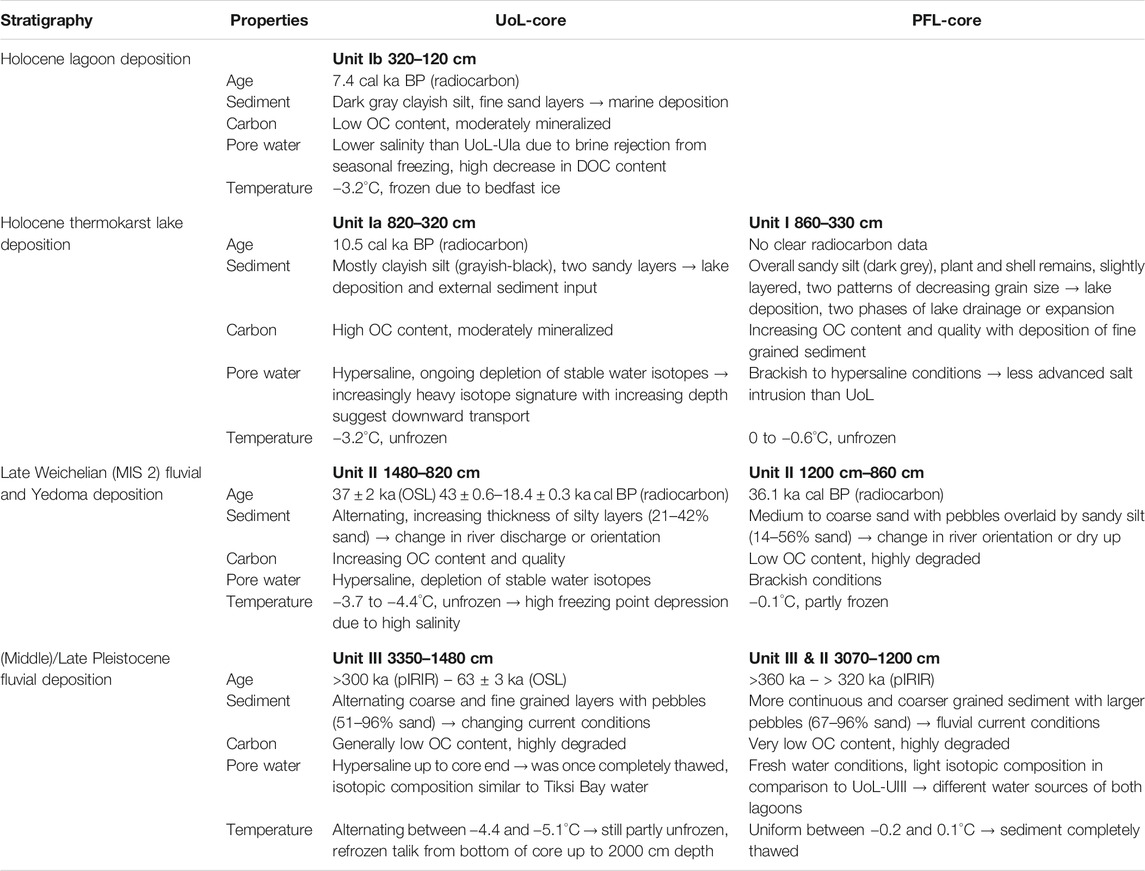
TABLE 3. Summary of stratigraphy, geochrononoly, sedimentology, biogeochemistry, facies, temperature, and pore water hydrochemistry deduced from multiproxy records.
Radiocarbon ages out of stratigraphic order due to reworking of sediment as part of thawing and re-freezing processes are common for sedimentary deposits in thermokarst landscapes (Wetterich et al., 2009; Biskaborn et al., 2013; Schirrmeister et al., 2017, 2018; Jongejans et al., 2018). In the case of UoL, radiocarbon age reversals occur in Unit II (11–17 m) and Unit III (below 17 m). Possible reasons for unexpected high radiocarbon concentrations include processes associated with the melt of large ice wedges and subsequent mixing, which transport younger material into older layers. Also, possible contamination by younger material during the drilling process and sample preparation have a larger effect when sample TOC contents are very low and available material is limited and can lead to dating bias (Oswald et al., 2005; Vyse et al., 2020). Unit II is characterized by thawed Yedoma Ice Complex deposits (see chapter 5.1.2). Existing intact Yedoma deposits, in north-east Siberian Arctic lowlands consist of massive syngenetic ice wedges several tens meters in height (Schirrmeister et al., 2002, 2011, 2013; Wetterich et al., 2014; Strauss et al., 2017; Möller et al., 2019; Fuchs et al., 2020). On the Bykovsky Peninsula only 10 km northeast of the lagoons, the Mamontovy Khayata Yedoma exposure is an example with syngenetic ice wedges up to 40 m high and 5–6 m wide (Schirrmeister et al., 2002). Likely, the same deposits were present at our drilling sites before thermokarst degradation. To estimate total thaw subsidence for the sites we measured the elevation difference of lagoon bottoms and the surrounding Yedoma upland based on height information of the ArcticDEM (Porter et al., 2018). The results suggest that Holocene permafrost degradation subsided the Yedoma surface by up to 25 m for UoL and 27 m for PFL, potentially causing mass flux of sediment and its organic carbon. At many locations across the landscape, large ice wedges thawed and the surface subsided, leaving ice wedge casts and water bodies, both of which infilled with local sediment. Where young near-surface organic matter slumped, and mixed into lower, older layers, age inversions as seen at UoL would have been created.
Though sediment mixing in such thaw-affected aquatic environments challenges chronological interpretation, comparison with deposits at other sites on the peninsula are consistent with our interpretation of the landscape development. In general, the radiocarbon age ranges of both cores correspond to previous dating from Yedoma sequences of Mamontovy Khayata (58.4–12 ka BP), about 10 km northeast (Schirrmeister et al., 2002), of Cape Razdelny (core 103/81: 40.8–21.63 ka BP) about 10 km southwest (Slagoda, 1993; Grosse et al., 2016) and of the Goltsovoye Lake (47.5–21.39 cal ka BP) less than 500 m north (Jongejans et al., 2020). Furthermore, the luminescence dating at 1107 cm and 2106 cm depth is consistent with the corresponding radiocarbon ages, showing an overall chronological succession. This sequence comprises Pleistocene ages in deep fluvial deposits, followed by late Weichelian ages in overlying Yedoma deposits. Therefore, the age range for the upper sections (UII, UI) appear reasonable. We correlate stratigraphic units between cores to assign the late Pleistocene ages of UoL-UII to the upper part of PFL-UII.
For deeper layers, especially Unit III of both cores, the results of the luminescence dating were used. The dose recovery ratios are satisfactory, and the comparison with the more-difficult-to-bleach feldspar IR50 and post-IRIR signals indicates that it is very likely that the quartz was well bleached at deposition (see Supplementary Material Chapter 1.3 for a more detailed technical discussion of these issues).
Unfortunately, the quartz luminescence signals from the bottom Uomullyakh Lagoon sample, and both samples from the Polar Fox Lagoon, are saturated, and so all give minimum quartz age estimates of >100 ka. Interestingly, the feldspar pIRIR signals are also saturated, and since the dose range of the feldspar signal is considerably larger than that for the quartz OSL signal, the implied minimum age is > 300 ka. At least for the two lagoons located in a similar morphological setting and with similar sedimentology (see below) it is reasonable to assume that the bleaching history of the sediment entering the two water bodies is also similar. Luminescence dating from the adjoining Goltsovoye Lake supports this assumption (Supplementary Table S4). The quartz and feldspar signals of the bottom sample (fluvial deposits at 3513 cm depth) are also saturated and in the same age range as for UoL and PFL (quartz age: >90 ka, feldspar age: >280 ka). The implication of the broad agreement between the pIRIR and OSL signals in the top two Uomullyakh samples is that both were well bleached before deposition. If we extrapolate this observation to the bottom-most Uomullyakh sample and the two Polar Fox samples, we may assume that the pIRIR minimum ages should also be reliable, and since they are the most constraining, they are used in further discussion.
Middle/Late Pleistocene Fluvial Deposition – UoL-UIII (3350–1480 cm) and PFL-UIII + II (3070–1460 cm)
The first phase of landscape history at the study area is mainly characterized by fluvial deposits. Under the Polar Fox Lagoon, they range in age from >360 to >320 ka (pIRIR) and include the units PFL-UIII and the lower part of PFL-UII (in total 1590 cm). Below Uomullakh Lagoon, these deposits (Uol-UIII) have an age between >300 ka (pIRIR) to 63 ± 2 ka (OSL). This long time period is represented by only about 9 m of sediment, indicating an overall low accumulation rate under a dynamic fluvial regime with frequently alternating phases of accumulation and erosion in Unit III.
The presence of coarse sediments, rounded gravel and pebbles up to 2 cm, as well as driftwood indicates fluvial transportation and deposition (Supplementary Figure S4). Several studies also found fluvial sediments in similar depth underneath the neighboring Ivashkina Lagoon (Romankevich et al., 2017; Schirrmeister et al., 2018) and underlying Yedoma deposits on the Bykovsky Peninsula (Slagoda 1993; Slagoda, 2004; Siegert et al., 2002; Grosse et al., 2007; Jongejans et al., 2020). Kunitsky (1989) and Wetterich et al. (2008) assumed that the paleo-Lena River crossed the present Bykovsky Peninsula in an early Weichselian period (MIS 4 and maybe older). Our luminescence ages suggest that river transport existed over a long period from >360 ka (pIRIR) to 63 ± 2 ka (OSL).
While in UoL-UIII, discontinuous grain sizes, very poor sorting and higher organic matter content reflect frequently varying water runoff in a shallow river branch or near-shore area, PFL-UIII is distinguished by very little organic material, more continuous and coarser grain sizes, and a higher degree of sorting. Such properties reflect stable fluvial current conditions (Wetterich et al., 2008). This could suggest that UoL core was located in the near-shore area and PFL core closer to the center of a paleo river. However, the large distance between both cores (2.5 km) and the deposition of fine grained sediment underneath the Goltsovoye Lake, located in the middle of both lagoons, makes this scenario improbable. It is more likely that two neighboring river branches, part of a braided river system or delta run through the location of today’s lagoons. This assumption is encouraged by finds of fluvial deposits across the peninsula. Alternation of fine and coarse grained layers at UoL-UIII indicate ongoing changes in river morphology. In PFL-UII until 1200 cm depth, organic containing fine sand layers were interbedded with coarser sand and gravel layers similar to the upper part of UoL-UIII also indicating varying water runoff or change in river course.
A layer of large driftwood pieces of similar shape and size found in UoL-UIII (at 1530 cm), PFL-UII (at 1810 cm) as well as GoL (at 2045 cm) (Unit II in Jongejans et al., 2020) are presumably deposited at the same flood event. In comparison to PFL and GoL, UoL core showed coarser grained fluvial deposits after the flood event which go along with increased erosion of overlying sediment explaining the higher elevation of the driftwood layer at UoL. Based on biomarker analyses carried out for the Goltsovoye Lake core, Jongejans et al. (2020) concluded that the area at time of flooding was a wetland, dominated by low-centered polygons formed during the Kargin Interstadial (MIS 3).
Late Weichelian (MIS 2) Yedoma Deposition – UoL-UII (1480–820 cm) and PFL-UII (1200–860 cm)
In the second phase of the landscape development an increase in silt deposition and organic matter content, as well as a depletion of δ13C point to changing environmental conditions away from high energy fluvial processes toward lower energy alluvial and other transport processes. Luminescence dating for UoL at 1107 cm to 37 ± 2 ka (OSL) revealed a late Pleistocene age (beginning of late Weichelian stadial). Radiocarbon dates from sediments of similar depth for both UoL (43 ± 0.56 cal ka BP at 1063 cm) and PFL (36.1 ± 0.39 cal ka BP at 1128 cm) are in a similar time range. Paleo-ecological data from the nearby Mamontovy Khayata Yedoma cliff (Andreev et al., 2002; Schirrmeister et al., 2002) and biomarker analyses from GoL (Jongejans et al., 2020) revealed that the climate was drier and colder, transforming the former wetland into a steppe-like tundra, which probably caused decreasing river run off and changing river morphology.
When comparing the data with those of the Yedoma Ice Complex of Mamontovy Khayata, they appear to resemble mostly the fine-grained layer of the units Uo-UII and PFL-UII. Thus, it can be deduced that ice-rich Yedoma Ice Complex deposits started accumulating when either the previously existing river fell dry or changed its course.
Holocene Thermokarst Lake Formation – UoL-UIa (820–320 cm) and PFL-UI (860–330 cm)
The third phase involves the formation of a thermokarst lake, which is a prerequisite for a thermokarst lagoon. High proportions of clay and silt as well as high TOC and TN content and shell remains (PFL at 400–440 cm) indicate that Unit I of both cores represent the lake stage. Based on the results of the CONISS analysis, we discovered ∼5.5 m thick lake sediments for both lagoons, which are likely mixed with Yedoma deposits from the lake shore.
In northeast Siberia, thermokarst lake formation began with rapid warming and wetting between 14 and 11.7 ka (Kaplina and Lozhkin, 1979; Kaplina, 2009; Anthony et al., 2014; Subetto et al., 2017). Grosse et al. (2007) estimated that major lakes and basins on the Bykovsky Peninsula were formed in the early Holocene, probably starting between 12.5 and 9.4 cal ka BP when a sedimentation gap on top of local Yedoma deposits suggests widespread reorganization of the landscape. This is in agreement with a radiocarbon date of 10.5 ka cal BP at 480 cm for UoL-UIa which we interpret as lacustrine deposits.
The gravimetric ice content of Yedoma deposited at Mamontovy Khayata is between 60 and 180% (Schirrmeister et al., 2002). Assuming that the Yedoma deposits were similarly ice-rich underneath the lagoons, thawing of these ice-rich sediments explains the large surface subsidence discussed before and suggests a substantial deposit compaction during lake stage.
The size of the drained thermokarst lake basins, shown in the landform classification map of Fuchs et al. (2018) (Supplementary Figure S5), indicates that Uomullyakh and Polar Fox basins were once significantly larger than the current water bodies and that drainage events occurred in the past. Lake drainages are common for thermokarst landscapes and are often rapid events with formation of drainage channels cutting deep into ice-rich permafrost (Grosse et al., 2013).
In UoL-UIa, a rapid increase in grain size at 630 and 530 cm depth corresponds to erratic changes in mass specific magnetic susceptibility indicating an external input of sediment at least twice. Upstream, south-west and north-west of UoL, two drained lake basins (Supplementary Figure S5) are located. Drainage channels connecting the basins with UoL, still visible at satellite images, suggest that UoL has been flooded while these lakes drained. As lake drainage may cause sediment erosion and downstream deposition, it is possibly the reason for the external sediment and organic matter input found in the UoL core.
In PFL-UI, two repetitive patterns of decreasing grain size associated with increasing TOC and TN content and organic matter quality are visible and might indicate drainage events. Therefore, Polar Fox Lagoon may have drained twice during the lake phase. The first drainage could have been northwards toward the adjoining lake basin (Supplementary Figure S5) and the second drainage southwards to the sea leading to lagoon formation.
A wider TOC/TN ratio and lighter δ13C composition of the sediment beneath UoL indicates that the organic matter was less mineralized than beneath PFL. That is likely because the UoL-UIb horizon is frozen in winter due to bedfast ice formation and subsequent lagoon bottom freezing, while PFL-UI is mostly thawed throughout the year, allowing more time for microbial degradation of organic matter. Seasonal freezing under floating ice conditions at PFL is also possible but would likely only result in partial sediment freezing and a thinner seasonally frozen layer compared to UoL (Angelopoulos et al., 2020a).
Holocene Lagoon Formation – UoL-UIb (320–120 cm)
Indications for the fourth phase of landscape development, the formation of a thermokarst lagoon, were found at the boundary between UoL-UIb and UoL-UIa (between 360 and 280 cm). The increase in mass specific magnetic susceptibility and grain size, the decrease in TOC and TN content, as well as a slight decrease in TOC/TN ratio indicate a system change. In our interpretation, this shift is caused by marine inundation and marks the beginning of the third stage, the lagoon formation. Postglacial rising sea levels caused by melting of continental ice sheets led to the inundation of former terrestrial permafrost on the Laptev Sea shelf until about 5 ka (Bauch et al., 2001) when sea levels stabilized and coastal erosion of ice-rich permafrost started to dominate the coastline (Romanovskii et al., 2000; Romanovskii et al., 2004). Likely, the Uomullyakh thermokarst lake was breached by the transgressing sea and coastal erosion in the early to mid-Holocene. A similar breaching and submergence of thermokarst lakes and drained lake basins has been observed in thermokarst-affected coastal lowlands on the Alaska North Slope (Arp et al., 2010), in the Mackenzie Delta region (e.g. Ruz et al., 1992), and on Banks Island (Grasby et al., 2013).
Satellite images (e.g. Figure 1) indicate that the Uomullyakh Lagoon is characterized by stronger turbidity due to lack of topographical wind shadow (compared to the Yedoma upland surrounded PFL) and its connection to the sea, which enables waves to enter. High connectivity to the sea likely leads to an increased input of marine sediment (Grotheer et al., 2020). This is in agreement with sediment analyses indicating marine deposition in Uomullyakh Lagoon for the upper 2 m mixed with lacustrine deposits.
At Polar Fox Lagoon, this distinction could not be made. This is very likely caused by the different morphology of both lagoons. The Polar Fox Lagoon was formed as a result of thermokarst lake drainage, which led to the formation of a shallow and winding channel connecting lake and sea (Angelopoulos et al., 2020a). The connection to the Tiksi Bay is cut off during winter when ice formation reaches the channel bed, restricting water and sediment exchange (Spangenberg et al., 2021).
Impact of Marine Inundation
Our data suggests that deep (∼20 m) hypersaline taliks (UoL) preserve organic carbon better than taliks that contain mostly freshwater below a thin saline layer (PFL). Drawing on microbial subsea permafrost research (Mitzscherling et al., 2017), hypersaline cryotic taliks can stress microbes and slow the decay of organic matter.
Once a connection from the lake to the sea is established, salts from seawater can diffuse into the sediment (Angelopoulos et al., 2020a) or transport into the sediment more rapidly via convection (Shakhova et al., 2017). Therefore, the frozen/thawed state of the sediment is largely a reflection of recent marine sediment deposition and salt transport. In the Uomullyakh Lagoon core, the EC of pore water generally increased with depth, from 30 mS/cm just below the seasonally frozen layer (240 cm below ice) to 108 mS/cm at 1525 cm depth below ice (mean 77 mS/cm for the entire core). The salinities were significantly higher than the Tiksi Bay water (3.8 mS/cm) (Supplementary Table S1) for the same time of the year. At the Polar Fox Lagoon core, the maximum EC (41 mS/cm) was measured in the uppermost sample just below the sediment surface. The relatively high EC in both lagoons suggests that brine rejection from lagoon ice formation and the seasonal isolation of the water bodies from Tiksi Bay are key processes affecting the pore water salinity.
Uomullyakh is a semi-closed lagoon, especially during the open water season when it may experience flooding and enhanced marine sediment deposition from storm surges (e.g. Nazarova et al., 2017) (Figure 6A). Polar Fox Lagoon, on the other hand, is a nearly closed lagoon (Figure 6B). It is isolated from the sea once bedfast ice forms at the shallow inlet (∼0.5 m) of the connecting channel (Spangenberg et al., 2021).
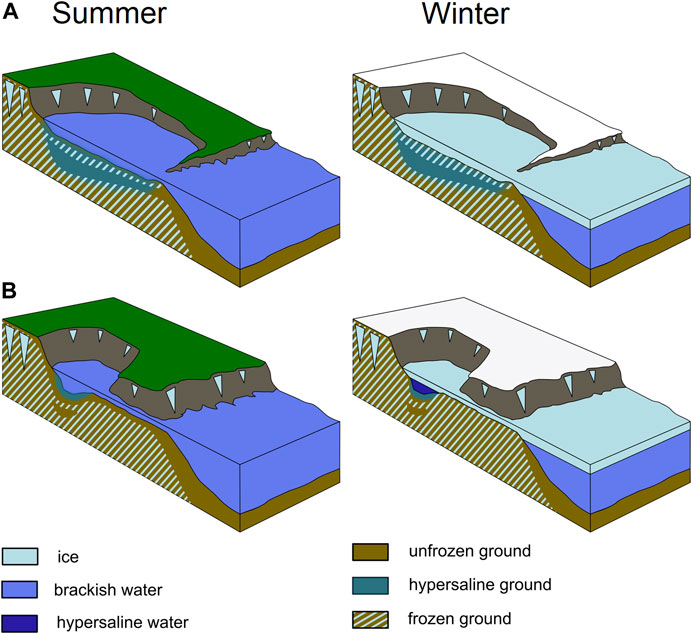
FIGURE 6. Schematic diagram showing two types of lagoon systems in summer and winter. (A) semi-closed lagoon system (similar to Uomullyakh Lagoon). Bedfast ice in winter leads to salt enrichment of the pore water up to great depth. (B) nearly closed lagoon system (similar to Polar Fox Lagoon) which is connected during the open-water season only. The long and shallow channel mitigates sediment exchange. Floating ice that thickens in winter leads to salt enrichment of free water and upper sediment. Modified after Angelopoulos et al. (2020a).
At Uomullyakh Lagoon, all 17 ice-auger measurements in April 2017 revealed bedfast ice, suggesting that there was nearly no surface water exchange with Tiksi Bay. Despite a seasonally closed system for the surface water, lateral groundwater exchange in the sediment can still occur if the sub-lagoon and subsea permafrost taliks are connected. This talik connection is possible, because the sediment just offshore of the spit is also characteristic of the lagoon talik when the spit was located further south. Furthermore, permafrost aggradation beneath the spit is controlled by limited sub-aerial exposure time as the spit retreats further north with coastal erosion. The large difference in isotopic composition of the pore water between the lagoons confirms that the Uomullyakh Lagoon sediment had a larger source water contribution from Tiksi Bay (Figure 7). Tiksi Bay as a heavy endmember likely caused the enrichment in heavier water isotopes of the Uomullyakh Lagoon pore water. Pedrazas et al. (2020) used electrical resistivity surveys to map continuous unfrozen sediment from an onshore cryopeg to a sub-lagoon talik down to a depth of 20 m in northern Alaska, and suggested it could be a conduit for groundwater and nutrient exchange. The isotopic composition of the pore water, along with the near vertical profile of salinity with depth (5–20 m and 25–33 m; Supplementary Figure S3) suggests that convective processes influenced the salt distribution (Harrison and Osterkamp, 1982). In addition, there was a likely high salt content injection into the sediment following bedfast ice formation. The seasonally frozen layer can still have been permeable and susceptible to brine flow (Osterkamp et al., 1989). Although temperatures were as low as −4.4°C (at 1540 cm), the freezing point of the hypersaline sediment was calculated to have been as low as −5.1°C (at 1520 cm), resulting in a cryotic talik. At a depth of 2040 cm, the observed temperature (−4.7°C) was below the freezing point (−3.82°C), indicating the approximate depth to ice-bearing permafrost. It is unclear how the ice-bearing permafrost table evolved, but the decreasing temperature trend with depth suggests the lagoon sediment column might be warming. Therefore, it is plausible that hypersaline sediment partially froze once sufficient sediment deposition in the lagoon created a mostly bedfast ice regime with some small isolated water pockets. Now, the ice-bearing permafrost table may be degrading under warmer, but still cryotic bedfast ice conditions. This is similar to terrestrial cryopeg expansion under warming subaerial conditions (Streletskaya, 1998).
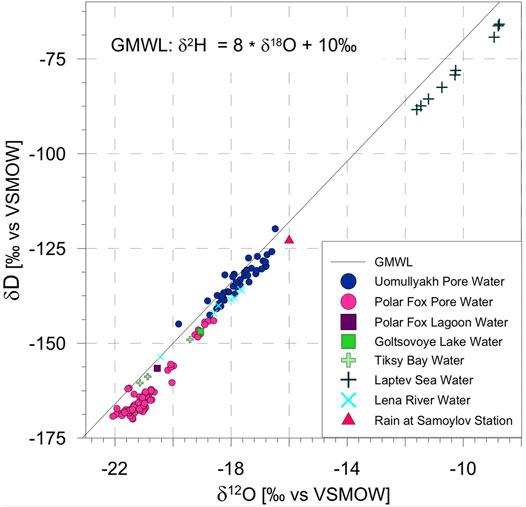
FIGURE 7. Comparison of the stable water isotope composition of lagoon core pore water and surface water of different possible endmember; sediment pore water from April 2017 (this study); water of Polar Fox Lagoon, Goltsovoye Lake, and Tiksi Bay were sampled in July 2017 (P. Overduin, unpublished data); Laptev Sea water was sampled during expedition with the research vessel Pavel Bashmakov at the end of August 2002 (H. Meyer, unpublished data); Lena River water from summer 2005–2016 (clustered points) and one sample from April 2013 (isolated point) (H. Meyer, unpublished data). Stable water isotopes δD and δ18O relative to Vienna Standard Mean Ocean Water (VSMOW).
At Polar Fox Lagoon, the contemporary distribution of ice-bearing permafrost and taliks is somewhat different. Polar Fox Lagoon is presumably younger than Uomullyakh Lagoon and still contains a floating ice area with a maximum water depth of 340 cm. In the floating ice area, coupled heat and salt diffusion models suggest that the thin partially frozen permafrost layer (830 to 480 cm below the sediment surface) developed sub-aquatically after the lake to lagoon transition. The partially frozen layer depth and thickness are transient, as the top-down chemical degradation of newly formed frozen sediment lags behind the talik refreezing (Angelopoulos et al., 2020a). In bedfast ice zones (approximately 75% of Polar Fox Lagoon), electrical resistivity surveys showed that the thickness of the frozen layer and that of the overlying saline layer increased and decreased toward the shoreline, respectively.
The transient nature of frozen sediment and taliks beneath may affect CO2 and CH4 fluxes in the sediment column, because partially frozen sediment with an ice saturation exceeding 60% has proven to be an effective barrier to gas flow (Chuvilin et al., 2016). In the case of a shallow lagoon with bedfast ice, the frozen sediment can be saline and have a lower freezing point compared to frozen sediment without salt. Therefore, lagoons may precondition the frozen sediment for rapid thawing (compared to Yedoma permafrost) once it is exposed to warmer coastal waters in the subsea permafrost environment. This, in turn, could contribute to the development of offshore gas migration pathways for greenhouse gas released from thawing subsea permafrost (Shakhova et al., 2019). Any released gas might not reach the atmosphere, as it has to bypass numerous sinks, including anaerobic oxidation in the sediment column (Overduin et al., 2015), dissolution in the pore water and surface water, low-permeability layers, and lagoon ice. Angelopoulos et al. (2020b) provide a review of subsea permafrost within the context of global climate change, and Ruppel and Kessler (2017) provide a review specific to climate change interactions with gas hydrates.
Carbon Pool Upscaling
Permafrost thaw beneath thermokarst lakes is more rapid than gradual thaw of near-surface permafrost and could double permafrost carbon emissions this century (Walter Anthony et al., 2018; Turetsky et al., 2020). Field-based observations on carbon turnover and greenhouse gas production in thermokarst lake sediments are scarce (Heslop et al., 2015; Heslop et al., 2019a; Heslop et al., 2019b) and completely missing for thermokarst lagoons. In order to estimate potential future greenhouse gas release from emerging thermokarst lagoons, we assessed the size of the lagoon C-pool by extrapolating our TOC and BD of the two analyzed lagoons to the other three thermokarst lagoons on the Bykovsky Peninsula.
The calculations of the carbon budgets show that the carbon density differs between the neighboring lagoons, especially for greater depths (upper 3 m: 22.5 kg/m3 (Uo) vs. 26.5 kg/m3 (PFL); upper 30 m: 17.4 kg/m3 (UoL) vs. 10.2 kg/m3 (PFL), which demonstrates the small scale spatial variability of the carbon deposits. The input and output of organic matter are strongly dependent on environmental conditions and lake drainage events. Schirrmeister et al. (2018) estimated the carbon density for the upper 6 m of the thermokarst lagoons on the Bykovsky Peninsula at 25 ± 5 kg/m3, which is in the same range as the carbon density we calculated for the upper 3 m (24.5 ± 1.4 kg/m3), but 45% higher than the mean carbon density of the 30 m-long sediment cores (13.8 ± 3 kg/m3). We explain this with the higher TOC values we measured in the lake influenced sediments (UoL-UIa, PFL-UI), which were the stratigraphic class dominating the Schirrmeister et al. (2018) dataset.
A similar carbon storage was estimated for thermokarst lagoons on northern Richards Island, Mackenzie Delta, Canada. Based on an average carbon content of 2.75–3% for marine and lacustrine deposits, Solomon et al. (2000) estimated a carbon deposition of ca. 25 × 104 t in the investigated embayment area (10.3 km2) since thermokarst lake development. This corresponds to a carbon density of 25 kg/m3 for the upper 10 m, which is similar to the carbon density of the lacustrine sediments of the Bykovsky lagoons. Comparing the carbon stored in undisturbed, previously unthawed ice-rich Yedoma deposits of Mamotovy Khayata (Schirrmeister et al., 2011) with the TOC of Yedoma thawed under thermokarst lake and lagoon conditions (Table 4), we would expect to find a gradient of C loss in thawed Yedoma underneath thermokarst landforms that is linked to thaw histories. Using a simple mass balance approach, the difference in mean TOC content between the Mamotovy Khayata Yedoma and the thawed Yedoma beneath thermokarst sites (Table 4) can be expressed as percentage carbon loss. This approach suggests a C loss of 85% for thawed Yedoma under Goltsovoye Lake, 83% C loss for PFL, 48% C loss for UoL, and 44% C loss for IvL due to subaquatic permafrost thaw. These estimations imply that less organic carbon is lost in the more open UoL and IvL compared to the younger, nearly closed PFL and the freshwater GoL. If our assumptions are valid, this would signify that a freshwater dominated lake and the floating ice areas of nearly closed lagoon systems like PFL result in strong organic carbon loss upon thaw while seawater dominated systems seem to better preserve organic carbon. In addition, higher TOC/TN and lower δ13C values for thawed Yedoma underneath UoL and IvL indicate lower organic matter degradation both more open lagoons, further supporting this hypothesis. Since approximately 75% of PFL was characterized by bedfast ice in April 2017 (Angelopoulos et al., 2020a), additional C is likely preserved in areas with thick frozen sediment. At UoL, the hypersalinity of the cryotic talik can stress microbial communities, leading to reduced population, diversity, and decay of organic matter (Mitzscherling et al., 2017). Although bacterial communities can adapt to increasingly saline conditions, past refreezing events in the upper 20 m of the sediment core (refer to “Impact of Marine Inundation” Section 5.2), can also preserve C at UoL.
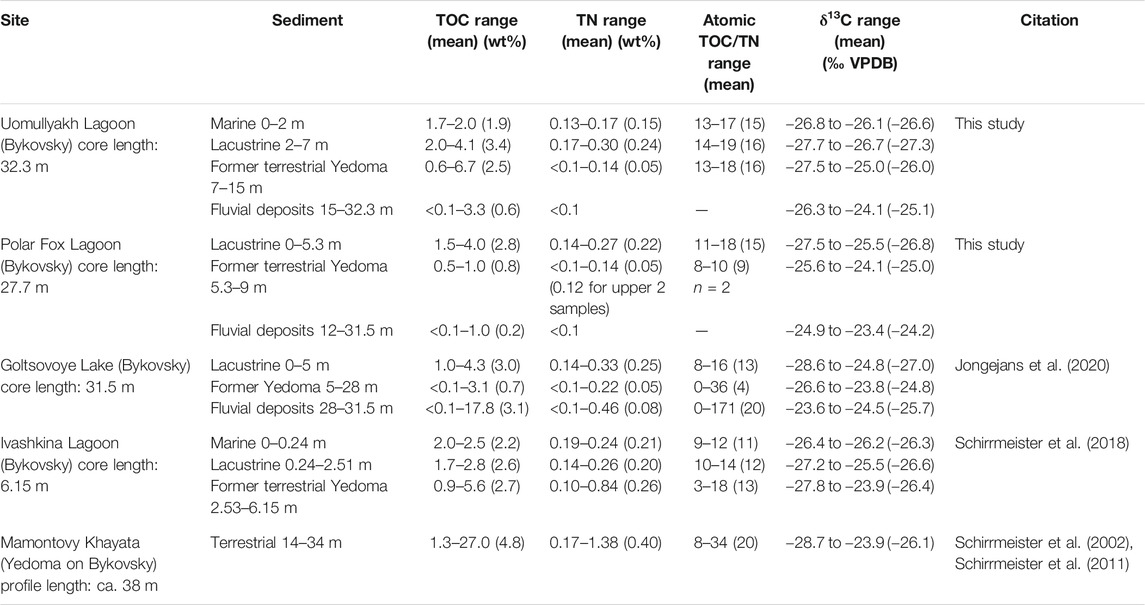
TABLE 4. Comparison of biogeochemistry characteristics with different lagoons, Yedoma sites and a thermokarst lake: total organic carbon content (TOC), total nitrogen (TN), atomic carbon nitrogen ratio, stable carbon isotope composition (δ13C). Note that given depth are measured from the sediment surface for better comparability of the sites.
The calculated average C-density of the core section referred to Yedoma deposits of the five thermokarst lagoons on Bykovsky Peninsula is 24.72 ± 4 kg/m3 and therefore in the upper range of the C-density estimated for the 0.41 × 10⁶ km2 large Yedoma region (19 + 13/-11 kg/m3) (Strauss et al., 2013) and in the lower range of terrestrial thermokarst deposits of the Yedoma region (33 + 25/-19 kg/m3) (Schirrmeister et al., 2011; Strauss et al., 2013).
Using the lagoon C-density mean, we calculated 5.7 Mt C in the first 30 m of lagoon sediments covering an area of 11.4 km2. This is a substantial inventory of formerly frozen C, which is now largely unfrozen and thus available for microbial degradation processes. δ13C and TOC/TN values indicate that the degradation of the primarily terrestrial plant material is advanced. Highest organic matter degradation was indicated for the fluvial deposits possibly because the alluvial material was already strongly degraded at the time of deposition.
The comparison of different sites shows that the biogeochemical parameters differ between sediment types rather than between the sites (Table 4). For example, the lacustrine sediments at all four sites (PFL, UoL, GoL and IvL) have very similar TOC and TN contents as well as similar TOC/TN ratios and δ13C signals, but they differ from the over- or underlying sediment facies (Schirrmeister et al., 2018; Jongejans et al., 2020). The lacustrine sediments in the deep sediment cores of UoL, PFL and GoL are richer in TOC and TN than the underlying former terrestrial or overlying marine sediments. High carbon accumulation in thermokarst lake sediments can be caused by shore erosion and deposition of terrestrial organic matter, high aquatic productivity, and unique preservation conditions (Anthony et al., 2014). In contrast, the biogeochemical parameters of lacustrine and underlying Yedoma deposits of the Ivashkina Lagoon differ only slightly (Schirrmeister et al., 2018). This is not surprising, as the upper part of the Yedoma deposits (IvL core reaches only to 6.15 m depth) tend to have higher carbon and nitrogen contents and lower degradation rate than the deeper deposits. An exception are the deep fluvial deposits under the GoL, where allochthonous organic material leads to very high TOC and TN contents (Jongejans et al., 2020). The TOC content of thawed talik sediments (former Yedoma deposits) is highest for the UoL, with similar values found in Taberites (2.7 ± 1.4 wt%) and late Weichelian (MIS 2) Ice Complex deposits (2.2 ± 0.9 wt%) of the Siberian permafrost region (Schirrmeister et al., 2011). The organic matter mineralization is highest for former Yedoma deposits below GoL (TOC/TN = 4) and lowest for Yedoma deposits at Mamontovy Khayata (TOC/TN = 20). The high mean TOC/TN ratio of fluvial deposits below GoL is based on five samples with very high TOC/TN ratios. The median TOC/TN ratio of 0 shows that the carbon mineralization is high for most samples of the fluvial deposits below GoL. In general, the carbon mineralization is mostly high (TOC/TN < 12) or in the lower moderate range (TOC/TN 12–25) for thermokarst affected sites. This is a common phenomenon in the warming Arctic, as rising permafrost temperatures result in increasing thermokarst development which favors the microbial decomposition of thawing organic matter (Strauss et al., 2017).
Greenhouse gas production in thermokarst lagoons connected to the marine environment is expected to differ substantially from that in thermokarst lakes: the supply of electron acceptors, specifically of sulfate, will promote sulfate reduction and anaerobic methane oxidation thus favoring the release of CO2 relative to that of methane (Segers and Kengen, 1998). In line with this, substantial CO2 release was recently reported for a laboratory study that incubated permafrost with seawater (Tanski et al., 2019). In addition, anaerobic methane oxidation was observed in thawing seawater-affected permafrost (Winkel et al., 2018) and thermokarst lake sediments with temperatures close to 0°C (Winkel et al., 2019). Given both our first estimate of thermokarst lagoon carbon budgets, and the expectation that the rate of formation of such lagoons will increase due to coastal erosion, thermokarst lagoons are considered important biogeochemical processors of former permafrost carbon and a critical component of the future Arctic greenhouse gas system.
Conclusion
This study shows that thermokarst lagoons are highly dynamic landforms at the boundary between terrestrial permafrost and marine systems. Based on two ∼30 m long sediment cores from two contrasting thermokarst lagoon systems, we examined the depositional history, the impact of marine inundation and the amount of stored organic carbon for different stages of thermokarst lagoons. We identified several different phases of sediment deposition in the semi-closed Uomullyakh Lagoon and the nearly closed Polar Fox Lagoon. The sedimentological analysis of both lagoon cores shows that fluvial deposition from a paleo-river system dominated at the sites from >360 ka to the late Pleistocene, when silty to sandy ice-rich Yedoma deposits started to accumulate in this region. These former Yedoma deposits are now present as thawed talik sediments. With the beginning of the warmer Late Glacial to Holocene period, the formation of thermokarst lakes began and resulted in lacustrine sediment deposition at both lagoons. At the more open Uomullyakh Lagoon, marine sediments overlying lacustrine deposits indicate the onset of the lagoon phase starting in the early to mid-Holocene. Inundation with seawater and formation of seasonal bedfast ice caused the saline enrichment of the pore water, which led to cryotic talik formation.
Our case study from the Bykovsky Peninsula provides a first estimate of organic carbon quantity and quality based on deep sediment cores below thermokarst lagoons. We have identified large organic carbon stocks in these special Arctic lagoon systems. We measured a mean C-density of 15.3 ± 2 kg/m3 for the 30 m thick deposits below the lagoons, with higher values found below the semi-closed lagoon. The measured carbon density for the Yedoma deposits (24.72 ± 4 kg/m3) is in the upper range of the estimate of terrestrial Yedoma (19 + 13/-11 kg/m3), but lower range of terrestrial thermokarst deposits (33 + 25/-19 kg/m3) in the Yedoma region. Based on the mean C-density and the remote sensing-based spatial extent of thermokarst lagoons, we calculate a total C storage of 5.7 Mt C in the upper 30 m of sediment in five thermokarst lagoons on the southern Bykovsky Peninsula.
Our data indicate that open thermokarst lagoons under high seawater influence seem to better preserve organic carbon more then freshwater dominated systems. This shows the potential importance of the role and contribution of thermokarst lagoons in the transformation of terrestrial permafrost carbon under increasingly marine influence.
Data Availability Statement
The datasets presented in this study can be found in online repositories. The names of the repository/repositories and accession number(s) can be found below: https://doi.pangaea.de/10.1594/PANGAEA.922169.
Author Contributions
MJ and JS designed this study. MJ led the writing of the first draft of the manuscript. JS, GG, and MG developed the overall coring plans for the Bykovsky Peninsula field campaign. JS, MG, LS, BB, PO, MA, SL, and GG conducted the field work. MA and PO did the subsampling for the Polar Fox sediment core and MJ for the Uomullyakh core. MJ and PO performed laboratory analyses. MJ led the data interpretation for both cores. MJ and IN conducted the spatial analysis and mapping of the lagoons. AM performed optical luminescence analyses and data interpretation. All co-authors contributed within their specific expertise to data interpretation.
Funding
This study was carried out within the NERC-BMBF project CACOON (Changing Arctic Carbon cycle in the cOastal Ocean Near-shore, grant no. 03F0806A), the ERC Project PETA-CARB (#338335), and the BMBF project KoPF (03F0764B, 03F0764F). The Alfred Wegener Institute Helmholtz Centre for Polar and Marine Research (AWI) provided baseline funding and together with the Germany Research Centre for Geosciences (GFZ) AWI provided funding for the expedition.
Conflict of Interest
The authors declare that the research was conducted in the absence of any commercial or financial relationships that could be construed as a potential conflict of interest.
Publisher’s Note
All claims expressed in this article are solely those of the authors and do not necessarily represent those of their affiliated organizations, or those of the publisher, the editors and the reviewers. Any product that may be evaluated in this article, or claim that may be made by its manufacturer, is not guaranteed or endorsed by the publisher.
Acknowledgments
We thank the Hydrobase Tiksi, Arctica GeoZentr, Stanislav Ostreldin, Waldemar Schneider, Dmitri Bolshiyanov, and Sergey Pravkin for their logistic contributions to the field expedition Bykovsky 2017. We thank the MICADAS Team at AWI Bremerhaven for dating the radiocarbon samples and Hanno Meyer for discussing the isotope results. Torben Windirsch is acknowledged for his support during subsampling the Uomullyakh core as well as Antje Eulenburg, Dyke Scheidemann, Jonas Sernau and Angélique Opitz for their support and assistance in the lab. We also thank Frederieke Miesner for her help on modifying Figure 6. We acknowledge the support by the Open Access Publication Funds of Alfred-Wegener-Institut Helmholtz Zentrum für Polar- und Meeresforschung.
Supplementary Material
The Supplementary Material for this article can be found online at: https://www.frontiersin.org/articles/10.3389/feart.2021.637899/full#supplementary-material
References
Andersson, R. A., Meyers, P., Hornibrook, E., Kuhry, P., and Mörth, C.-M. (2012). Elemental and Isotopic Carbon and Nitrogen Records of Organic Matter Accumulation in a Holocene Permafrost Peat Sequence in the East European Russian Arctic. J. Quat. Sci. 27 (6), 545–552. doi:10.1002/jqs.2541
Andreev, A. A., Schirrmeister, L., Siegert, C., Bobrov, A. A., Demske, D., Seiffert, M., et al. (2002). Paleoenvironmental Changes in Northeastern Siberia during the Late Quaternary - Evidence from Pollen Records of the Bykovsky Peninsula’. Polarforschung 70, 13–25. doi:10.2312/polarforschung.70.13
Angelopoulos, M., Overduin, P. P., Miesner, F., Grigoriev, M. N., and Vasiliev, A. A. (2020b). Recent Advances in the Study of Arctic Submarine Permafrost. Permafrost and Periglac Process 31 (3), 442–453. doi:10.1002/ppp.2061
Angelopoulos, M., Overduin, P. P., Westermann, S., Tronicke, J., Strauss, J., Schirrmeister, L., et al. (2020a). Thermokarst lake to Lagoon Transitions in Eastern Siberia: Do Submerged Taliks Refreeze? J. Geophys. Res. Earth Surf. 125. doi:10.1029/2019JF005424
Anthony, K. M. W., Zimov, S. A., Grosse, G., Jones, M. C., Anthony, P. M., Iii, F. S. C., et al. (2014). A Shift of Thermokarst Lakes from Carbon Sources to Sinks during the Holocene Epoch. Nature 511 (7510), 452–456. doi:10.1038/nature13560
Arp, C. D., Jones, B. M., Whitman, M., Larsen, A., and Urban, F. E. (2010). Lake Temperature and Ice Cover Regimes in the Alaskan Subarctic and Arctic: Integrated Monitoring, Remote Sensing, and Modeling1. JAWRA J. Am. Water Resour. Assoc. 46 (4), 777–791. doi:10.1111/j.1752-1688.2010.00451.x
Bauch, H. A., Mueller-Lupp, T., Taldenkova, E., Spielhagen, R. F., Kassens, H., Grootes, P. M., et al. (2001). Chronology of the Holocene Transgression at the North Siberian Margin. Glob. Planet. Change 31 (1-4), 125–139. doi:10.1016/S0921-8181(01)00116-3
Berner, J., Symon, C., Arris, L., and Heal, O. W. (2005). Arctic Climate Impact Assessment, National Science Foundation (U.S.), United States, and National Oceanic and Atmospheric Administration. New York, N.Y.: Cambridge University Press.
Bindoff, N. L., Willebrand, J., Artale, V., Cazenave, A., Gregory, J., Gulev, S., et al. (2007). “Observations: Oceanic Climate Change and Sea Level,” in Climate Change 2007: The Physical Science Basis. Contribution of Working Group I to the Fourth Assessment Report of the Intergovernmental Panel on Climate Change. Editors S. Solomon, D. Qin, M. Manning, Z. Chen, M. Marquis, K.B. Averytet al. (Cambridge, United Kingdom and New York, NY, USA: Cambridge University Press).
Biskaborn, B. K., Herzschuh, U., Bolshiyanov, D. Y., Schwamborn, G., and Diekmann, B. (2013). Thermokarst Processes and Depositional Events in a Tundra Lake, Northeastern Siberia: Thermokarst Processes in a Siberian Tundra Lake. Permafrost Periglacial Process. 24 (3), 160–174. doi:10.1002/ppp.1769
Biskaborn, B. K., Smith, S. L., Noetzli, J., Matthes, H., Vieira, G., Streletskiy, D. A., et al. (2019). Permafrost Is Warming at a Global Scale. Nat. Commun. 10 (1), 264. doi:10.1038/s41467-018-08240-4
Brovko, P. (1990). Development of Coastal Lagoons. Vladivostok (Russia): Publishing house of the Far East University press.
Brown, J., Ferrians, O. J., Heginbottom, J. A., and Melnikov, E. S. (1997). Circum-Arctic Map of Permafrost and Ground-Ice Conditions. Circum-Pacific Map. doi:10.3133/cp45
Campeau, S., Héquette, A., and Pienitz, R. (2000). Late Holocene Diatom Biostratigraphy and Sea-Level Changes in the southeastern Beaufort Sea. Can. J. Earth Sci. 37 (1), 63–80. doi:10.1139/e99-107
Chuvilin, E. M., Grebenkin, S. I., and Sacleux, M. (2016). Influence of Moisture Content on Permeability of Frozen and Unfrozen Soils. Kriosfera Zemli 20 (3), 66–72. doi:10.21782/EC2541-9994-2018-1(41-45)
Frederick, J. M., and Buffett, B. A. (2014). Taliks in Relict Submarine Permafrost and Methane Hydrate Deposits: Pathways for Gas Escape under Present and Future Conditions. J. Geophys. Res. Earth Surf. 119 (2), 106–122. doi:10.1002/2013JF002987
Fritz, M., Opel, T., Tanski, G., Herzschuh, U., Meyer, H., Eulenburg, A., et al. (2015). Dissolved Organic Carbon (DOC) in Arctic Ground Ice. The Cryosphere 9 (2), 737–752. doi:10.5194/tc-9-737-2015
Fritz, M., Vonk, J. E., and Lantuit, H. (2017). Collapsing Arctic Coastlines. Nat. Clim. Change 7 (1), 6–7. doi:10.1038/nclimate3188
Fuchs, M., Grosse, G., Strauss, J., Günther, F., Grigoriev, M., Maximov, G. M., et al. (2018). Carbon and Nitrogen Pools in Thermokarst-Affected Permafrost Landscapes in Arctic Siberia. Biogeosciences 15 (3), 953–971. doi:10.5194/bg-15-953-2018
Fuchs, M., Nitze, I., Strauss, J., Günther, F., Wetterich, S., Kizyakov, A., et al. (2020). Rapid Fluvio-Thermal Erosion of a Yedoma Permafrost Cliff in the Lena River Delta. Front. Earth Sci. 8. doi:10.3389/feart.2020.00336
GISTEMP Team (2020). GISS Surface Temperature Analysis (GISTEMP). version 4. NASA Goddard Institute for Space Studies. Dataset accessed 2020-22-26 at: data.giss.nasa.gov/gistemp/.
Grasby, S. E., Rod Smith, I., Bell, T., and Forbes, D. L. (2013). Cryogenic Formation of Brine and Sedimentary Mirabilite in Submergent Coastal lake Basins, Canadian Arctic. Geochimica et Cosmochimica Acta 110(0): 13–28. doi:10.1016/j.gca.2013.02.014
Grosse, G., Goetz, S., McGuire, A. D., Romanovsky, V. E., and Schuur, E. A. G. (2016). Changing Permafrost in a Warming World and Feedbacks to the Earth System. Environ. Res. Lett. 11 (4), 040201. doi:10.1088/1748-9326/11/4/040201
Grosse, G., Jones, B., and Arp, C. (2013). 8.21 Thermokarst Lakes, Drainage, and Drained Basins. Treatise on Geomorphology. Fairbanks: Elsevier, 325–353. doi:10.1016/B978-0-12-374739-6.00216-5
Grosse, G., Schirrmeister, L., Kunitsky, V. V., and Hubberten, H.-W. (2005). The Use of CORONA Images in Remote Sensing of Periglacial Geomorphology: An Illustration from the NE Siberian Coast. Permafrost Periglac. Process. 16 (2), 163–172. doi:10.1002/ppp.509
Grosse, G., Schirrmeister, L., Siegert, C., Kunitsky, V. V., Slagoda, E. A., Andreev, A. A., et al. (2007). Geological and Geomorphological Evolution of a Sedimentary Periglacial Landscape in Northeast Siberia during the Late Quaternary. Geomorphology 86 (1–2), 25–51. doi:10.1016/j.geomorph.2006.08.005
Grotheer, H., Meyer, V., Riedel, T., Pfalz, G., Mathieu, L., Hefter, J., et al. (2020). Burial and Origin of Permafrost‐Derived Carbon in the Nearshore Zone of the Southern Canadian Beaufort Sea. Geophys. Res. Lett. 47 (3), e2019GL085897. doi:10.1029/2019GL085897
Gundelwein, A., Müller-Lupp, T., Sommerkorn, M., Haupt, E. T. K., Pfeiffer, E.-M., and Wiechmann, H. (2007). Carbon in Tundra Soils in the Lake Labaz Region of Arctic Siberia. Eur. J. Soil Sci. 58 (5), 1164–1174. doi:10.1111/j.1365-2389.2007.00908.x
Günther, F., Overduin, P. P., Yakshina, I. A., Opel, T., Baranskaya, A. V., and Grigoriev, M. N. (2015). Observing Muostakh Disappear: Permafrost Thaw Subsidence and Erosion of a Ground-Ice-Rich Island in Response to Arctic Summer Warming and Sea Ice Reduction. The Cryosphere 9 (1), 151–178. doi:10.5194/tc-9-151-2015
Harris, C. M., McClelland, J. W., Connelly, T. L., Crump, B. C., and Dunton, K. H. (2017). Salinity and Temperature Regimes in Eastern Alaskan Beaufort Sea Lagoons in Relation to Source Water Contributions. Estuaries and Coasts 40 (1), 50–62. doi:10.1007/s12237-016-0123-z
Harrison, W. D., and Osterkamp, T. E. (1982). Measurements of the Electrical Conductivity of Interstitial Water in Subsea Permafrost. Proceedings of the Fourth Canadian Permafrost Conference, Ottawa, Canada:National Research Council of Canada, 229–237.
Héquette, A., Ruz, M.-H., and Hill, P. R. (1995). The Effects of the Holocene Sea Level Rise on the Evolution of the Southeastern Coast of the Canadian Beaufort Sea. J. Coastal Res. 11 (2), 494–507.
Heslop, J. K., Walter Anthony, K. M., Grosse, G., Liebner, S., and Winkel, M. (2019b). Century-scale Time since Permafrost Thaw Affects Temperature Sensitivity of Net Methane Production in Thermokarst-Lake and Talik Sediments. Sci. Total Environ. 691 (November), 124–134. doi:10.1016/j.scitotenv.2019.06.402
Heslop, J. K., Walter Anthony, K. M., Sepulveda-Jauregui, A., Martinez-Cruz, K., Bondurant, A., Grosse, G., et al. (2015). Thermokarst Lake Methanogenesis along a Complete Talik Profile. Biogeosciences 12 (14), 4317–4331. doi:10.5194/bg-12-4317-2015
Heslop, J. K., Winkel, M., Walter Anthony, K. M., Spencer, R. G. M., Podgorski, D. C., Zito, P., et al. (2019a). Increasing Organic Carbon Biolability with Depth in Yedoma Permafrost: Ramifications for Future Climate Change. J. Geophys. Res. Biogeosci. 124 (7), 2021–2038. doi:10.1029/2018JG004712
Hill, P. R. (1990). Coastal Geology of the King Point Area, Yukon Territory, Canada. Mar. Geology 91 (1), 93–111. doi:10.1016/0025-3227(90)90135-7
Jenrich, M. (2020). “Thermokarst Lagoons – Carbon Pools and Panarctic Distribution,” (Germany: University of Potsdam). Master Thesis. Avilable at: https://epic.awi.de/id/eprint/51597/.
Johannessen, O. M., Bengtsson, L., Miles, M. W., Kuzmina, S. I., Semenov, V. A., Alekseev, G. V., et al. (2004). Arctic Climate Change: Observed and Modelled Temperature and Sea-Ice Variability. Tellus A: Dynamic Meteorology and Oceanography 56 (4), 328–341. doi:10.3402/tellusa.v56i4.14418
Jones, B. M., Farquharson, L. M., Baughman, C. A., Buzard, R. M., Arp, C. D., Grosse, G., et al. (2018). A Decade of Remotely Sensed Observations Highlight Complex Processes Linked to Coastal Permafrost bluff Erosion in the Arctic. Environ. Res. Lett. 13 (11), 115001. doi:10.1088/1748-9326/aae471
Jones, B. M., Grosse, G., Arp, C. D., Jones, M. C., Walter Anthony, K. M., and Romanovsky, V. E. (2011). Modern Thermokarst Lake Dynamics in the Continuous Permafrost Zone, Northern Seward Peninsula, Alaska. J. Geophys. Res. 116 (G2). doi:10.1029/2011JG001666
Jongejans, L. L., Mangelsdorf, K., Schirrmeister, L., Grigoriev, M. N., Maksimov, G. M., Biskaborn, B. K., et al. (2020). n-Alkane Characteristics of Thawed Permafrost Deposits below a Thermokarst Lake on Bykovsky Peninsula, Northeastern Siberia. Front. Environ. Sci. 8. doi:10.3389/fenvs.2020.00118
Jongejans, L. L., and Strauss, J. (2020). Bootstrapping Approach for Permafrost Organic Carbon Pool Estimation. Zenodo. doi:10.5281/zenodo.3734247
Jongejans, L. L., Strauss, J., Lenz, J., Peterse, F., Mangelsdorf, K., Fuchs, M., et al. (2018). Organic Matter Characteristics in Yedoma and Thermokarst Deposits on Baldwin Peninsula, West Alaska. Biogeosciences 15 (20), 6033–6048. doi:10.5194/bg-15-6033-2018
Juhls, B., Overduin, P. P., Hölemann, J., Hieronymi, M., Matsuoka, A., Heim, B., et al. (2019). Dissolved Organic Matter at the Fluvial-marine Transition in the Laptev Sea Using In Situ Data and Ocean Colour Remote Sensing. Biogeosciences 16 (13), 2693–2713. doi:10.5194/bg-16-2693-2019
Kaplina, T. N. (2009). Alas Complexes of Northern Yakutia. Earth’s Cryosphere 12, 3–17. (in Russian).
Kaplina, T. N., and Lozhkin, A. V. (1979). Age of Alas Deposits of the Coastal plain of Yakutia (Radiocarbon Substantiation). Izv. SSSR. Ser. Geol. 2, 69–76. (in Russian).
Kjerfve, B. (1994). Coastal Lagoons. Coastal Lagoon Processes, 8. Elsevier Oceanography Series 60. Elsevier Science Publisher B.V.
Kosyan, R. (2016). The Diversity of Russian Estuaries and Lagoons Exposed to Human Influence. New York, NY: Springer Berlin Heidelberg.
Kunitsky, V. V. (1989). Kriolitologiya Nizo’ev Leny (Cryolithology of the Lower LENA). Yakutsk: Permafrost Institute Press.
Lachenbruch, A. H., Sass, J. H., Marshall, B. V., and Moses, T. H. (1982). Permafrost, Heat Flow, and the Geothermal Regime at Prudhoe Bay, Alaska. J. Geophys. Res. 87 (B11), 9301–9316. doi:10.1029/JB087iB11p09301
Lantuit, H., Atkinson, D., Paul Overduin, P., Grigoriev, M., Rachold, V., Grosse, G., et al. (2011). Coastal Erosion Dynamics on the Permafrost-Dominated Bykovsky Peninsula, north Siberia, 1951-2006. Polar Res. 30 (1), 7341. doi:10.3402/polar.v30i0.7341
Lenssen, N. J. L., Schmidt, G. A., Hansen, J. E., Menne, M. J., Persin, A., Ruedy, R., et al. (2019). Improvements in the GISTEMP Uncertainty Model. J. Geophys. Res. Atmos. 124 (12), 6307–6326. doi:10.1029/2018JD029522
Lenz, J., Wetterich, S., Jones, B. M., Meyer, H., Bobrov, A., and Grosse, G. (2016). Evidence of Multiple Thermokarst lake Generations from an 11 800‐year‐old Permafrost Core on the Northern S Eward P Eninsula, A Laska. Boreas 45 (4), 584–603. doi:10.1111/bor.12186
Liu, J., Chen, Z., Chen, M., Yan, W., Xiang, R., and Tang, X. (2010). Magnetic Susceptibility Variations and Provenance of Surface Sediments in the South China Sea. Sediment. Geology 230 (1), 77–85. doi:10.1016/j.sedgeo.2010.07.001
Mary, B., Mariotti, A., and Morel, J. L. (1992). Use Ofr 13C Variations at Natural Abundance for Studying the Biodegradation of Root Mucilage, Roots and Glucose in Soil. Soil Biol. Biochem. 24 (10), 1065–1072. doi:10.1016/0038-0717(92)90037-X
McDougall, T. J., and Barker, P. M. (2011). Getting Started with TEOS-10 and the Gibbs Seawater (GSW) Oceanographic Toolbox. SCOR/IAPSO WG 127, 1–28.
Meyer, H., Schönicke, L., Wand, U., Hubberten, H. W., and Friedrichsen, H. (2000). Isotope Studies of Hydrogen and Oxygen in Ground Ice - Experiences with the Equilibration Technique. Isotopes Environ. Health Stud. 36 (2), 133–149. doi:10.1080/10256010008032939
Meyers, P. A. (1997). Organic Geochemical Proxies of Paleoceanographic, Paleolimnologic, and Paleoclimatic Processes. Org. Geochem. 27 (5), 213–250. doi:10.1016/S0146-6380(97)00049-1
Meyers, P. A. (1994). Preservation of Elemental and Isotopic Source Identification of Sedimentary Organic Matter. Chem. Geology 114 (3–4), 289–302. doi:10.1016/0009-2541(94)90059-0
Mitzscherling, J., Winkel, M., Winterfeld, M., Horn, F., Yang, S., Grigoriev, M. N., et al. (2017). The Development of Permafrost Bacterial Communities under Submarine Conditions. J. Geophys. Res. Biogeosci. 122 (7), 1689–1704. doi:10.1002/2017JG003859
Möller, P., Benediktsson, Í. Ö., Anjar, J., Bennike, O., Bernhardson, M., Funder, S., et al. (2019). Data Set on Sedimentology, Palaeoecology and Chronology of Middle to Late Pleistocene Deposits on the Taimyr Peninsula, Arctic Russia. Data in Brief 25, 104267. doi:10.1016/j.dib.2019.104267
Möller, P., and Murray, A. S. (2015). Drumlinised Glaciofluvial and Glaciolacustrine Sediments on the Småland Peneplain, South Sweden - New Information on the Growth and Decay History of the Fennoscandian Ice Sheets during MIS 3. Quat. Sci. Rev. 122 (August), 1–29. doi:10.1016/j.quascirev.2015.04.025
Murray, A. S., Helsted, L. M., Autzen, M., Jain, M., and Buylaert, J. P. (2018). Measurement of Natural Radioactivity: Calibration and Performance of a High-Resolution Gamma Spectrometry Facility. Radiat. Measurements 120, 215–220. doi:10.1016/j.radmeas.2018.04.006
Murray, A. S., Marten, R., Johnston, A., and Martin, P. (1987). Analysis for Naturally Occuring Radionuclides at Environmental Concentrations by Gamma Spectrometry. J. Radioanal. Nucl. Chem. Articles 115, 263–288. doi:10.1007/bf02037443
Murray, A. S., and Wintle, A. G. (2000). Luminescence Dating of Quartz Using an Improved Single-Aliquot Regenerative-Dose Protocol. Radiat. Measurements 32, 57–73. doi:10.1016/S1350-4487(99)00253-X
Murray, A. S., and Wintle, A. G. (2003). The Single Aliquot Regenerative Dose Protocol: Potential for Improvements in Reliability. Radiat. Measurements 37, 377–381. doi:10.1016/S1350-4487(03)00053-2
Nazarova, L., Grebennikova, Т. А., Razjigaeva, N. G., Ganzey, L. А., Belyanina, N. I., Arslanov, K. А., et al. (2017). Reconstruction of Holocene Environmental Changes in Southern Kurils (North-Western Pacific) Based on Palaeolake Sediment Proxies from Shikotan Island. Glob. Planet. Change 159 (December), 25–36. doi:10.1016/j.gloplacha.2017.10.005
Nerem, R. S., Beckley, B. D., Fasullo, J. T., Hamlington, B. D., Masters, D., and Mitchum, G. T. (2018). Climate-change-driven Accelerated Sea-Level Rise Detected in the Altimeter Era. Proc. Natl. Acad. Sci. USA 115 (9), 2022–2025. doi:10.1073/pnas.1717312115
Notz, D., and Stroeve, J. (2016). Observed Arctic Sea-Ice Loss Directly Follows Anthropogenic CO2emission. Science 354 (6313), 747–750. doi:10.1126/science.aag2345
Osterkamp, T. E., Baker, G. C., Harrison, W. D., and Matava, T. (1989). Characteristics of the Active Layer and Shallow Subsea Permafrost. J. Geophys. Res. 94 (C11), 16227–16236. doi:10.1029/JC094iC11p16227
Osterkamp, T. E., Jorgenson, M. T., Schuur, E. a. G., Shur, Y. L., Kanevskiy, M. Z., Vogel, J. G., et al. (2009). Physical and Ecological Changes Associated with Warming Permafrost and Thermokarst in Interior Alaska. Permafrost Periglac. Process. 20 (3), 235–256. doi:10.1002/ppp.656
Oswald, W. W., Anderson, P. M., Brown, T. A., Brubaker, L. B., Hu, F. S., Lozhkin, A. V., et al. (2005). Effects of Sample Mass and Macrofossil Type on Radiocarbon Dating of Arctic and Boreal lake Sediments. The Holocene 15, 758–767. doi:10.1191/0959683605hl849rr
Overduin, P. P., Liebner, S., Knoblauch, C., Günther, F., Wetterich, S., Schirrmeister, L., et al. (2015). Methane Oxidation Following Submarine Permafrost Degradation: Measurements from a Central Laptev Sea Shelf Borehole. J. Geophys. Res. Biogeosci. 120 (5), 965–978. doi:10.1002/2014JG002862
Pawlowicz, R. (2012). The Electrical Conductivity of Seawater at High Temperatures and Salinities. Desalination 300, 32–39. doi:10.1016/j.desal.2012.06.001
Pedrazas, M. N., Cardenas, M. B., Demir, C., Watson, J. A., Connolly, C. T., and McClelland, J. W. (2020). Absence of Ice-Bonded Permafrost beneath an Arctic Lagoon Revealed by Electrical Geophysics. Sci. Adv. 6 (43), eabb5083. doi:10.1126/sciadv.abb5083
Peel, M. C., Finlayson, B. L., and Mcmahon, T. A. (2007). Updated World Map of the Köppen-Geiger Climate Classification. Hydrol. Earth Syst. Sci. 11, 1633–1644. doi:10.5194/hess-11-1633-2007
Pekel, J.-F., Cottam, A., Gorelick, N., and Belward, A. S. (2016). High-Resolution Mapping of Global Surface Water and its Long-Term Changes. Nature 540 (7633), 418–422. doi:10.1038/nature20584
Phillips, M. R., Burn, C. R., Wolfe, S. A., Morse, P. D., Gaanderse, A. J., ’Neill, H. B. O., et al. (2015). Improving Water Content Description of Ice-Rich Permafrost Soils, 7th Canadian Permafrost Conference. Available at: http://works.bepress.com/dan-shugar/9/.
Porter, C., Morin, P., Howat, I., Noh, M. J., Bates, B., Peterman, B., et al. (2018). ArcticDEM. doi:10.7910/DVN/OHHUKH
Proshutinsky, A., Pavlov, V., and Bourke, R. H. (2001). Sea Level Rise in the Arctic Ocean. Geophys. Res. Lett. 28 (11), 2237–2240. doi:10.1029/2000GL012760
R Core Team (2016). R: A Language and Environment for Statistical Computing. Vienna, Austria: R Foundation for Statistical Computing.
Reimer, P. J., Bard, E., Bayliss, A., Beck, J. W., Blackwell, P. G., Ramsey, C. B., et al. (2013). IntCal13 and Marine13 Radiocarbon Age Calibration Curves 0-50,000 Years Cal BP. Radiocarbon 55 (4), 1869–1887. doi:10.2458/azu_js_rc.55.16947
Romankevich, E. A., Vetrov, A. A., Belyaev, N. A., Sergienko, V. I., Semiletov, I. P., Sukhoverkhov, S. V., et al. (2017). Alkanes in Quaternary Deposits of the Laptev Sea. Dokl. Earth Sc. 472 (1), 36–39. doi:10.1134/S1028334X17010093
Romanovskii, N., Hubberten, H.-W., Gavrilov, A. V., Tumskoy, V. E., and Kholodov, A. L. (2004). Permafrost of the East Siberian Arctic Shelf and Coastal Lowlands. Quat. Sci. Rev. 23 (11), 1359–1369. doi:10.1016/j.quascirev.2003.12.014
Romanovskii, N. N., Gavrilov, A. V., Kholodov, A. L., Pustovoit, G. P., Hubberten, H. W., Niessen, F., et al. (1998). Map of Predicted Offshore Permafrost Distribution on the Laptev Sea Shelf. Nordicana, 55. Yellowknife, Canada, 6.
Romanovskii, N. N., Hubberten, H.-W., Gavrilov, A. V., Tumskoy, V. E., Tipenko, G. S., Grigoriev, M. N., et al. (2000). Thermokarst and Land-Ocean Interactions, Laptev Sea Region, Russia. Permafrost Periglac. Process. 11 (2), 137–152. doi:10.1002/1099-1530(200004/06)11:2<137::aid-ppp345>3.0.co;2-l
Romanovsky, V. E., Drozdov, D. S., Oberman, N. G., Malkova, G. V., Kholodov, A. L., Marchenko, S. S., et al. (2010). Thermal State of Permafrost in Russia. Permafrost Periglac. Process. 21 (2), 136–155. doi:10.1002/ppp.683
Ruppel, C. D., and Kessler, J. D. (2017). The Interaction of Climate Change and Methane Hydrates. Rev. Geophys. 55 (1), 126–168. doi:10.1002/2016RG000534
Ruz, M.-H., Héquette, A., and Hill, P. R. (1992). A Model of Coastal Evolution in a Transgressed Thermokarst Topography, Canadian Beaufort Sea. Mar. Geology 106, 251–278. doi:10.1016/0025-3227(92)90133-3
Schirrmeister, L., Froese, D., Tumskoy, V., Grosse, G., and Wetterich, S. (2013). “PERMAFROST and PERIGLACIAL FEATURES | Yedoma: Late Pleistocene Ice-Rich Syngenetic Permafrost of Beringia,” in Encyclopedia of Quaternary Science. Editors S A. Elias, and C J. Mock Second Edition (Amsterdam: Elsevier), 542–552. doi:10.1016/B978-0-444-53643-3.00106-0
Schirrmeister, L., Grigoriev, M. N., Strauss, J., Grosse, G., Overduin, P. P., Kholodov, A., et al. (2018). Sediment Characteristics of a Thermokarst Lagoon in the Northeastern Siberian Arctic (Ivashkina Lagoon, Bykovsky Peninsula). Arktos 4 (1), 13. doi:10.1007/s41063-018-0049-8
Schirrmeister, L., Kunitsky, V., Grosse, G., Wetterich, S., Meyer, H., Schwamborn, G., et al. (2011). Sedimentary Characteristics and Origin of the Late Pleistocene Ice Complex on north-east Siberian Arctic Coastal Lowlands and Islands - A Review. Quat. Int. 241 (1–2), 3–25. doi:10.1016/j.quaint.2010.04.004
Schirrmeister, L., Schwamborn, G., Overduin, P. P., Strauss, J., Fuchs, M. C., Grigoriev, M., et al. (2017). Yedoma Ice Complex of the Buor Khaya Peninsula (Southern Laptev Sea). Biogeosciences 14, 1261–1283. doi:10.5194/bg-14-1261-2017
Schirrmeister, L., Siegert, C., Kunitzky, V. V., Grootes, P. M., and Erlenkeuser, H. (2002). Late Quaternary Ice-Rich Permafrost Sequences as a Paleoenvironmental Archive for the Laptev Sea Region in Northern Siberia. Int. J. Earth Sci. 91 (1), 154–167. doi:10.1007/s005310100205
Schowalter, T. D. (2016). Chapter 14 - Decomposition and Pedogenesis. Insect Ecol., 4, 477–510. doi:10.1016/b978-0-12-803033-2.00014-5
Schuur, E. A. G., McGuire, A. D., Schädel, C., Grosse, G., Harden, J. W., Hayes, D. J., et al. (2015). Climate Change and the Permafrost Carbon Feedback. Nature 520 (7546), 171–179. doi:10.1038/nature14338
Segers, R., and Kengen, S. W. M. (1998). Methane Production as a Function of Anaerobic Carbon Mineralization: A Process Model. Soil Biol. Biochem. 30 (8), 1107–1117. doi:10.1016/S0038-0717(97)00198-3
Shakhova, N., Semiletov, I., and Chuvilin, E. (2019). Understanding the Permafrost-Hydrate System and Associated Methane Releases in the East Siberian Arctic Shelf. Geosciences 9 (6), 251. doi:10.3390/geosciences9060251
Shakhova, N., Semiletov, I., Gustafsson, O., Sergienko, V., Lobkovsky, L., Dudarev, O., et al. (2017). Current Rates and Mechanisms of Subsea Permafrost Degradation in the East Siberian Arctic Shelf. Nat. Commun. 8 (1), 15872. doi:10.1038/ncomms15872
Siegert, C., Schirrmeister, L., and Babiy, O. (2002). The Sedimentologieal, Mineralogieal and Geoehemieal Composition of Late Pleistoeene Deposits from the Lee Complex on the Bykovsky Peninsula, Northern Siberia. Permafrostforschung 70, 9., no.
Slagoda, E. A. (1993). “Genesis I Mikrostroenie Kriolitogennykh Otlozhenii Bykovskogo Polyostrova I Ostrova Muoastakh [Genesis and Microstructure of Cryolithogenic Deposits at the Bykovsky Peninsula and the Muostakh Island],” (Yakutsk: Permafrost Institute Yakutsk). Ph.D. thesis.
Slagoda, E. A. (2004). Kriogennye otlozheniya Primorskoi ravniny morya Laptebykh: litologiya i mikromorfologiya [Cryolithogenic Deposits of the Laptev Sea Coastal Plain: Lithology and Micromorphology]. Tyumen: Express, (in Russian).
Solomon, S., Mudie, P. J., Cranston, R., Hamilton, T., Thibaudeau, S. A., and Collins, E. S. (2000). Characterisation of marine and Lacustrine Sediments in a Drowned Thermokarst Embayment, Richards Island, Beaufort Sea, Canada. Int. J. Earth Sci. 89 (3), 503–521. doi:10.1007/s005310000126
Spangenberg, I., Overduin, P. P., Damm, E., Bussmann, I., Meyer, H., Liebner, S., et al. (2021). Methane Pathways in Winter Ice of a Thermokarst Lake–Lagoon–Coastal Water Transect in North Siberia. Cryosphere 15 (3), 1607–1625. doi:10.5194/tc-15-1607-2021
Strauss, J., Abbott, B. W., Hugelius, G., Schuur, E., Treat, C., Fuchs, M., et al. (2021). “Permafrost,” in Recarbonizing global soils: A technical manual of best management practices, Volume 2. Hot spots and bright spots of soil organic carbon (Rome, Italy: Food and agriculture Organization of the United Nations).
Strauss, J., Boike, J., Bolshiyanov, D. Y., Grigoriev, M. N., El-Hajj, H., Morgenstern, A., et al. (2018). Russian-German Cooperation: Expeditions to Siberia in 2017, Berichte zur Polar- und Meeresforschung = Reports on polar and marine research. Bremerhaven, Alfred Wegener Inst. Polar Mar. Res. 725, 296. EPIC. doi:10.2312/BzPM_0725_2018
Strauss, J., Schirrmeister, L., Grosse, G., Fortier, D., Hugelius, G., Knoblauch, C., et al. (2017). Deep Yedoma Permafrost: A Synthesis of Depositional Characteristics and Carbon Vulnerability. Earth-Science Rev. 172 (September), 75–86. doi:10.1016/j.earscirev.2017.07.007
Strauss, J., Schirrmeister, L., Grosse, G., Wetterich, S., Ulrich, M., Herzschuh, U., et al. (2013). The Deep Permafrost Carbon Pool of the Yedoma Region in Siberia and Alaska. Geophys. Res. Lett. 40 (23), 6165–6170. doi:10.1002/2013GL058088
Strauss, J., Schirrmeister, L., Mangelsdorf, K., Eichhorn, L., Wetterich, S., and Herzschuh, U. (2015). Organic-matter Quality of Deep Permafrost Carbon - a Study from Arctic Siberia. Biogeosciences 12, 2227–2245. doi:10.5194/bg-12-2227-2015
Strauss, J., Schirrmeister, L., Wetterich, S., Borchers, A., Davydov, S. P., and Davydov, S. P. (2012). Grain-size properties and organic-carbon stock of Yedoma Ice Complex permafrost from the Kolyma lowland, northeastern Siberia. Global Biogeochem. Cycles 26 (23). doi:10.1029/2011GB004104
Streletskaya, I. D. (1998). Yellowknife, Canada.Cryopeg Responses to Periodic Climate Fluctuations. Permafrost. Proceedings of the Seventh International Conference, Yellowknife, Canada, June 23–27, 1998.
Stuiver, M., Reimer, P. J., and Reimer, R. W. (2020). CALIB 7.1 [WWW Program]. http://calib.org (Accessed 02 12, 2020).
Subetto, D. A., Nazarova, L. B., Pestryakova, L. A., Syrykh, L. S., Andronikov, A. V., Biskaborn, B., et al. (2017). Paleolimnological Studies in Russian Northern Eurasia: A Review. Contemp. Probl. Ecol. 10 (4), 327–335. doi:10.1134/S1995425517040102
Tagliapietra, D., Sigovini, M., and Ghirardini, A. V. (2009). A Review of Terms and Definitions to Categorise Estuaries, Lagoons and Associated Environments. Mar. Freshw. Res. 60 (6), 497. doi:10.1071/MF08088
Tanski, G., Wagner, D., Knoblauch, C., Fritz, M., Sachs, T., and Lantuit, H. (2019). Rapid CO 2 Release from Eroding Permafrost in Seawater. Geophys. Res. Lett. 46 (20), 11244–11252. doi:10.1029/2019GL084303
Turetsky, M. R., Abbott, B. W., Jones, M. C., Anthony, K. W., Olefeldt, D., Schuur, E. A. G., et al. (2020). Carbon Release through Abrupt Permafrost Thaw. Nat. Geosci. 13 (2), 138–143. doi:10.1038/s41561-019-0526-0
Ulyantsev, A. S., Romankevich, E. A., Bratskaya, S. Y., Semiletov, I. P., and Avramenko, V. A. (2017). Organic and Carbonate Carbon in Permafrost and Thawed Deposits from Buor-Khaya Bay (Laptev Sea). Dokl. Earth Sc. 473 (2), 467–471. doi:10.1134/s1028334x17040237
Vyse, S. A., Herzschuh, U., Andreev, A. A., Pestryakova, L. A., Diekmann, B., Armitage, S. J., et al. (2020). Geochemical and Sedimentological Responses of Arctic Glacial Lake Ilirney, Chukotka (Far East Russia) to Palaeoenvironmental Change since ∼51.8 Ka BP. Quat. Sci. Rev. 247, 106607. doi:10.1016/j.quascirev.2020.106607
Walhert, L., Zimmermann, S., Blaser, P., Luster, J., and Lüscher, P. (2004). Waldböden der Schweiz 1: Grundlagen und Region Jura. (in German) [Forrest Soils of Swizerland, Chapter 1: Principles and the Jura Region]. Bern: hep verlag.
Walter Anthony, K., Schneider von Deimling, T., Nitze, I., Frolking, S., Emond, A., Daanen, R., et al. (2018). 21st-Century Modeled Permafrost Carbon Emissions Accelerated by Abrupt Thaw beneath Lakes. Nat. Commun. 9 (1), 3262. doi:10.1038/s41467-018-05738-9
Watson, C. S., White, N. J., Church, J. A., King, M. A., Burgette, R. J., and Legresy, B. (2015). Unabated Global Mean Sea-Level Rise over the Satellite Altimeter Era. Nat. Clim. Change 5 (6), 565–568. doi:10.1038/nclimate2635
Wetterich, S., Kuzmina, S., Andreev, A. A., Kienast, F., Meyer, H., Schirrmeister, L., et al. (2008). Palaeoenvironmental Dynamics Inferred from Late Quaternary Permafrost Deposits on Kurungnakh Island, Lena Delta, Northeast Siberia, Russia. Quat. Sci. Rev. 27, 1523–1540. doi:10.1016/j.quascirev.2008.04.007
Wetterich, S., Schirrmeister, L., Andreev, A. A., Pudenz, M., Plessen, B., Meyer, H., et al. (2009). Eemian and Late Glacial/Holocene Palaeoenvironmental Records from Permafrost Sequences at the Dmitry Laptev Strait (NE Siberia, Russia). Palaeogeogr. Palaeoclimatol. Palaeoecol. 279 (1), 73–95. doi:10.1016/j.palaeo.2009.05.002
Wetterich, S., Tumskoy, V., Rudaya, N., Andreev, A. A., Opel, T., Meyer, H., et al. (2014). Ice Complex Formation in Arctic East Siberia during the MIS3 Interstadial. Quat. Sci. Rev. 84, 39–55. doi:10.1016/j.quascirev.2013.11.009
Winkel, M., Mitzscherling, J., Overduin, P. P., Horn, F., Winterfeld, M., Rijkers, R., et al. (2018). Anaerobic Methanotrophic Communities Thrive in Deep Submarine Permafrost. Sci. Rep. 8 (1), 1291. doi:10.1038/s41598-018-19505-9
Keywords: talik, Arctic Siberia, Yedoma, inundation, permafrost carbon, OSL (optically stimulated luminescence), coastal erosion
Citation: Jenrich M, Angelopoulos M, Grosse G, Overduin PP, Schirrmeister L, Nitze I, Biskaborn BK, Liebner S, Grigoriev M, Murray A, Jongejans LL and Strauss J (2021) Thermokarst Lagoons: A Core-Based Assessment of Depositional Characteristics and an Estimate of Carbon Pools on the Bykovsky Peninsula. Front. Earth Sci. 9:637899. doi: 10.3389/feart.2021.637899
Received: 05 March 2021; Accepted: 15 June 2021;
Published: 23 July 2021.
Edited by:
Alexandra V Turchyn, University of Cambridge, United KingdomReviewed by:
Brendan O'Neill, Geological Survey of Canada, CanadaEdward A. Johnson, University of Calgary, Canada
Copyright © 2021 Jenrich, Angelopoulos, Grosse, Overduin, Schirrmeister, Nitze, Biskaborn, Liebner, Grigoriev, Murray, Jongejans and Strauss. This is an open-access article distributed under the terms of the Creative Commons Attribution License (CC BY). The use, distribution or reproduction in other forums is permitted, provided the original author(s) and the copyright owner(s) are credited and that the original publication in this journal is cited, in accordance with accepted academic practice. No use, distribution or reproduction is permitted which does not comply with these terms.
*Correspondence: Maren Jenrich, bWFyZW4uamVucmljaEBhd2kuZGU=