 Qingri Liu1,2
 Huiping Zhang1
 Youli Li2Feipeng Huang1Xudong Zhao1
 Jinghao Lei1,2Weilin Xin2
 Jianguo Xiong1*Peizhen Zhang1,3
- 1State Key Laboratory of Earthquake Dynamics, Institute of Geology, China Earthquake Administration, Beijing, China
- 2Key Laboratory of Earth Surface Processes of Ministry of Education, Peking University, Beijing, China
- 3Guangdong Provincial Key Laboratory of Geodynamics and Geohazards, School of Earth Science and Engineering, Sun Yat-sen University, Guangzhou, China
The height of a thrust-fault scarp on a fluvial terrace would be modified due to erosion and deposition, and these surface processes can also influence the dating of terraces. Under such circumstances, the vertical slip rate of a fault can be misestimated due to the inaccurate displacement and/or abandonment age of the terrace. In this contribution, considering the effect of erosion and deposition on fault scarps, we re-constrained the vertical slip rate of the west end of the Minle–Damaying Fault (MDF), one of the thrusts in the north margin of the Qilian Shan that marks the northeastern edge of the Tibetan Plateau. In addition, we tried to explore a more reliable method for obtaining the vertical fault displacement and the abandonment age of terraces with AMS 14C dating. The heights of the surface scarps and the displacements of the fluvial gravel layers exposed on the Yudai River terraces were precisely measured with the Structure from Motion (SfM) photogrammetry and the real-time kinematic (RTK) GPS. The Monte Carlo simulation method was used to estimate the uncertainties of fault displacements and vertical slip rates. Based on comparative analysis, the dating sample from the fluvial sand layer underlying the thickest loess in the footwall was suggested to best represent the abandonment age of the terrace, and the fluvial gravel layer could better preserve the original vertical fault displacement compared with the surface layer. Using the most reliable ages and vertical offsets, the vertical slip rate of the MDF was estimated to be 0.25–0.28 mm/a since 42.3 ± 0.5 ka (T10) and 0.14–0.24 mm/a since 16.1 ± 0.2 ka (T7). The difference between the wrong vertical slip rate and the right one can even reach an order of magnitude. We also suggest that if the built measuring profile is long enough, the uncertainties in the height of a surface scarp would be better constrained and the result can also be taken as the vertical fault displacement. Furthermore, the consistency of chronology with stratigraphic sequence or with terrace sequence are also key to constraining the abandonment ages of terraces. The fault activity at the study site is weaker than that in the middle and east segments of the MDF, which is likely due to its end position.
Key points
• The vertical slip rate of the Minle–Damaying Fault is re-estimated to be 0.25–0.28 mm/a since 42.3 ± 0.5 ka at the outlet of the Yudai River.
• The topographic profile extracted from the top of the faulted gravel layer and that with sufficient length from the faulted loess layer are suggested to be used to constrain the vertical fault displacement.
• The age of the fluvial sand layer underlying the thickest loess in the footwall of a thrust fault is suggested to best represent the abandonment age of the terrace.
Introduction
The vertical slip rate of a fault is a significant metric to quantify the intensity of tectonic activity (Tapponnier et al., 1990; Hetzel et al., 2002; Ai et al., 2017; Liu et al., 2017), reconstruct the behavior of the fault over time (Zheng W. J. et al., 2013; Xiong et al., 2017; Hetzel et al., 2019), evaluate the seismic risk (Ren et al., 2019; Lei et al., 2020), and understand the regional active deformation (Yang et al., 2018; Liu et al., 2019; Ren et al., 2019; Zhong et al., 2020). The estimation of vertical slip rates mostly depends on two factors: the magnitude of the offset and the age of offset landmarks (Burbank and Anderson, 2011). However, accurate determination of vertical slip rates is not easy because the complex surface processes including erosion and deposition would affect the estimation of the original displacement and the representation of the collected dating samples.
For thrust faults, the vertical displacement recorded by the geomorphic surface can be obtained by extracting the topographic profile perpendicular to the fault scarp (e.g., Hetzel, 2013; Wei et al., 2020). However, as the fault scarp degrades with time (Avouac, 1993; Hetzel, 2013; Jayangondaperumal et al., 2013), the hanging wall can be eroded and acts as the sediment source for the footwall (Stewart and Hancock, 1988). In addition, the stream that formed the terrace may shed sediments onto the footwall (Hetzel et al., 2004; Hetzel, 2013). Fluvial aggradation is also possible in the footwall due to the adjoining stream (Priyanka et al., 2017), and the footwall is also more likely to accumulate aeolian sediments (Avouac and Peltzer, 1993). Therefore, it is a consensus that vertical offsets derived from scarp profiles may underestimate the real displacement of a fault especially in areas with heavy loess cover (Wallace, 1980; Peterson, 1985; Stewart and Hancock, 1988; Hetzel, 2013; Liu et al., 2017; Yang et al., 2018). In recent years, as Laser Radar (Cunningham et al., 2006; Ren et al., 2016), high-resolution satellite optical image (e.g., QuickBird, WorldView, and Pleiades), and aerial photogrammetry (Matthews, 2008; Fraser and Cronk, 2009) are gradually gaining usage relative to the traditional total station and the tape measure, it becomes more accurate and efficient to acquire topographic profile based on large-scale and high-precision topographic data. Although many studies on the fault tend to focus on the resolution or precision of the topographic data (Blakely et al., 2009; McPhillips and Scharer, 2018; Hetzel et al., 2019), inadequate evaluation of surface processes may lead to errors or mistakes in the measurement of fault displacement. It has been suggested that we should select sites less affected by surface processes to extract profiles (Palumbo et al., 2009), calculate the vertical slip rate based on the offset of the top of the fluvial gravel layer in the trench (Liu et al., 2014; Ren et al., 2019), or attempt to estimate the effect of the surface processes to correct the height of the scarp (Priyanka et al., 2017; Yang et al., 2018). More often, however, researchers acknowledged the underestimation of the vertical displacement but did not discuss much about it (Blakely et al., 2009; McPhillips and Scharer, 2018; Hetzel et al., 2019). In different geomorphic conditions, how to choose more reasonable topographic profiles and obtain more accurate vertical displacements needs to be systemically understood.
Another challenge in constraining the vertical slip rate is chronology. Taking the Qilian Shan area as an example, geomorphic dating tends to be affected by loess cover and erosion. If we assume that the loess overlying the terrace surface begins to deposit immediately after the abandonment of the terrace, there will be no significant gap between the age of the bottom of the loess and that of the top of terrace deposition (Pan et al., 2003; Xu et al., 2010; Lu et al., 2018; Lu and Li, 2020). However, in most cases, the deposition of the loess layer usually lags behind the abandonment of the terrace, thus taking the bottom age of the loess as the abandonment age of the terrace will affect the estimated deformation rate (Stokes et al., 2003; Küster et al., 2006; Lu and Li, 2020). For example, when dating the same terrace of the Xie River, OSL age from the bottom of the loess is 12.7 ± 1.4 ka (Xiong et al., 2017), while 14C age from the floodplain sand layer is 16,405 ± 210 cal a BP (Lei et al., 2020). The age gap between the two results is ∼4 ka. The latter is the age of the uppermost fluvial sediment and is close to the abandonment age of the terrace, while the OSL age is younger due to the lagging deposition of loess mentioned previously. In the middle and western Qilian Shan, the loess deposition with a thickness less than 1.5 m is mostly younger than 13 ka by OSL dating (Stokes et al., 2003; Küster et al., 2006). The loess possibly has deposited since the Holocene, thus the bottom of the loess is significantly younger than the abandoned terrace (Hetzel et al., 2002, 2004; Hetzel, 2013). In addition, it is usually hard to find organic materials suitable for 14C dating in the front of the middle and western Qilian Shan due to the arid climate. Therefore, the 10Be exposure dating is widely used to constrain the terrace age (Hetzel et al., 2004, 2019; Liu et al., 2017; Yang et al., 2018). The shielding and erosion effect of the loess should still be considered when collecting the 10Be exposure dating samples (Hetzel, 2013). If the fluvial deposits are eroded or covered by loess after deposition, the nuclide concentration of surface samples would be relatively low (Hetzel, 2013). For this reason, the sampling site of the 10Be exposure dating should be selected in the hanging wall dominated by erosion (Hetzel, 2013), and in the profile without the cover of loess (Champagnac et al., 2010; Zheng W. et al., 2013; Liu et al., 2017, 2019; Hetzel et al., 2019), otherwise, the loess shielding effect must be corrected (Hetzel et al., 2004, 2006; Palumbo et al., 2009; Yang et al., 2018; Cao et al., 2019). Compared with the western Qilian Shan, the eastern Qilian is more humid (Geng et al., 2017; Cai et al., 2020) with abundant charcoal for 14C dating (Ai et al., 2017; Xiong et al., 2017; Lei et al., 2020; Zhong et al., 2020). However, the erosion and deposition processes can also make it difficult to collect 14C dating samples.
The Minle–Damaying Fault (MDF) is an active fault in the north margin of the Qilian Shan during the late Quaternary (Xiong et al., 2017; Lei et al., 2020; Zhong et al., 2020). A better constraint of its vertical slip rates is critical to understanding the northeastward propagation of the Tibetan Plateau (Figure 1; Institute of Geology and Lanzhou Institute of Seismology [IGLS], 1993; Xiong et al., 2017). The vertical slip rates of the MDF have been constrained at several sites (Figure 1B; Xiong et al., 2017; Lei et al., 2020; Zhong et al., 2020), but the influence of surface processes on fault scarps and the collection of dating samples has not been discussed in depth. Especially at the outlet of the Yudai River, the west end of the MDF, intense erosion and deposition seriously damaged the original morphology of the fault scarp, and also interfered with the collection of dating samples. As a result, measuring the height of the surface scarp would underestimate the vertical fault displacement and collecting the charcoal from the loess overlying the fluvial sediment would cause a relatively young abandonment age of the terrace (Lei et al., 2020). However, the clearly exposed fluvial gravel layers provide an opportunity to redetermine the vertical slip rate at this site.
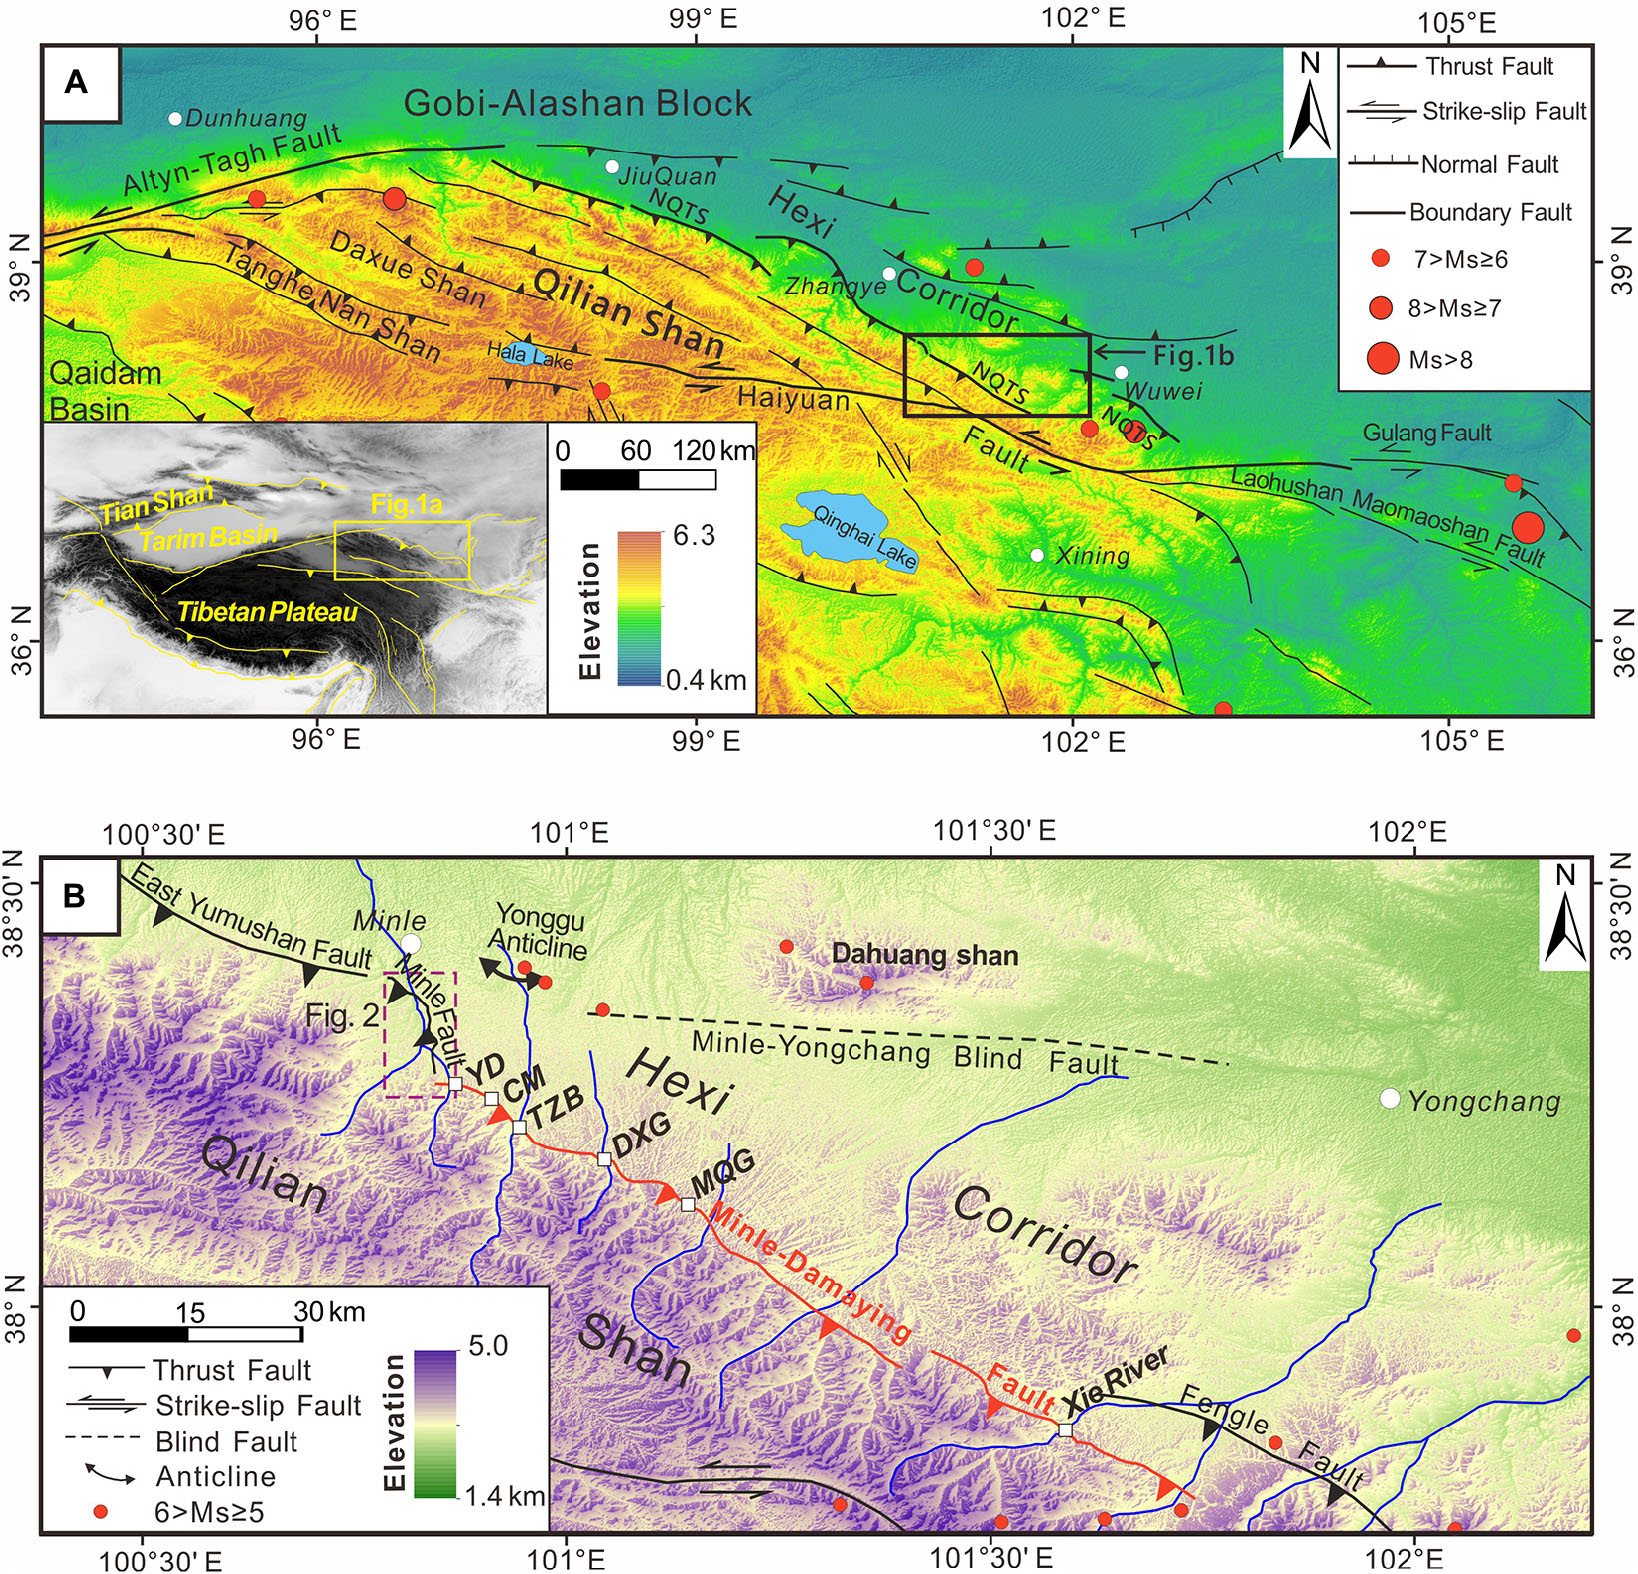
Figure 1. Topography and active tectonics of the study area. (A) Topography and active tectonics of the Hexi Corridor and its peripheral zone with an insert topographic map of inner Asia in the lower left (Yuan et al., 2013; Zheng W. et al., 2013). NQTS: north Qilian thrust system. (B) Active tectonics and river system around the MDF. The white box indicates study sites along the fault with a known slip rate. YD, Yudai River; CM, Chaomian site; TZB, Tongziba River; DXG, Daxiang Gully; MQG: Mingquan Gully. The earthquake data (since the year AD 1917) are downloaded from the website of USGS: http://earthquake.usgs.gov/earthquakes.
In this contribution, we studied the activity of the MDF at the outlet of the Yudai River. Structure from Motion (SfM) photogrammetry and real-time kinematic (RTK) GPS were used to constrain the height of the surface scarp and the displacement of the fluvial gravel layer exposed on the terrace. Combining them with AMS 14C dating, we aimed to (1) re-estimate the vertical slip rate of the MDF at the Yudai River site based on accurate ages and vertical offsets, (2) discuss the methods of obtaining accurate vertical offsets and reliable 14C dating samples in different geomorphic conditions, and (3) re-evaluate the spatial variation of shortening rates along the MDF strike. The method for obtaining correct vertical slip rates of thrust faults summarized in this paper can help researchers save time and money and better understand the properties of thrust faults.
Geological Setting
As an early Paleozoic orogenic belt, the Qilian Shan has been reactivated by a series of thrusts and folds due to the collision between India and Asia, with an average altitude of ∼4000 m (Tapponnier et al., 1990; Yin and Harrison, 2000; Hetzel et al., 2004). The Qilian fold–thrust belt marks the geomorphic feature in the north of the Tibetan Plateau and is considered as the growth front of the NE Tibetan Plateau (Tapponnier et al., 2001; Allen et al., 2017; Zheng et al., 2017). The northern front of the Qilian Shan has been inferred to be limited by large, south-dipping, active thrusts (Tapponnier et al., 1990), and they are collectively known as the North Qilian Thrust Belt (Figure 1A; Institute of Geology and Lanzhou Institute of Seismology [IGLS], 1993). The belt consists of a series of near-NW-striking parallel faults, including the Hanxia–Dahuanggou Fault, Yumen Fault, Fodongmiao–Hongyazi Fault, North Yumu Shan Fault, East Yumu Shan Fault, Minle Fault, MDF, and Huangcheng–Taerzhaung Fault (Figure 1A; Institute of Geology and Lanzhou Institute of Seismology [IGLS], 1993). They juxtapose the low-grade metamorphic early Paleozoic rocks (slates, phyllites, limestones, and volcanic and granitic rocks) over the Cenozoic sediments within the Hexi Corridor basin (Zheng et al., 2017).
As the boundary fault between the Qilian Shan and the Zhangye Basin, the MDF is a large thrust in the north margin of the Eastern Qilian Shan. It is an N50–60W-striking fault, extending from the eastern piedmont of the Yumu Shan in the west to the south of Huangcheng area in the east over a length of ∼120 km, with dip angles of 30–60° (Figure 1B; Institute of Geology and Lanzhou Institute of Seismology [IGLS], 1993; Lei et al., 2020). The fault may be divided into east and west segments, with lengths of 45 km and 75 km, respectively (Lei et al., 2020). Previous fieldwork shows that the tectonic activity of the MDF pushes the Paleozoic strata over the Miocene strata, indicating that the fault has been active since the late Tertiary, but it also suggests that the MDF has not been active since the Holocene (Institute of Geology and Lanzhou Institute of Seismology [IGLS], 1993). However, recent studies show that the fault has offset the Holocene fluvial terraces at many sites, and the vertical slip rates vary from 0.1 to 1.6 mm/a at different sites (Xiong et al., 2017; Lei et al., 2020; Zhong et al., 2020). At the outlet of the Yudai River, one tributary of the Hongshui River, the MDF offsets the terraces on both banks and pushes the Carboniferous and Pliocene strata over the late Quaternary fluvial gravels.
Materials and Methods
Terrace Classification
The Hongshui River and its tributary, the Yudai River, have formed the same terrace sequence since the late Pleistocene. Based on detailed fieldwork, the shapes of the terraces were recognized and mapped on the Google satellite imagery, and the terraces were graded according to their heights above the riverbed, stratigraphy, and distribution. RTK GPS survey was used to define the absolute elevation of all levels of terraces along the Yudai River to the lower part of the Hongshui River. The strata of the natural exposures on each terrace were divided by their colors, grain sizes, and components, and the TruPulse 200X laser rangefinder with an accuracy of 1 cm was used to accurately measure the thickness of each stratum. The terraces are divided into 14 levels according to their heights above the river level, stratigraphy, and distribution (Figure 2). On the whole, the terraces located in the hanging wall of the Minle Fault, especially on the west bank of the Hongshui River, are scattered and broken due to the effects of bedrock uplift and long-term erosion. The high-level terraces T14–T12 are only distributed on the west bank of the Hongshui River, terraces T11–T6 are widely distributed on both banks of the Hongshui and Yudai River, and the low-level terraces T5–T1 are distributed in the incised valley below the terrace T6 (Figure 2).
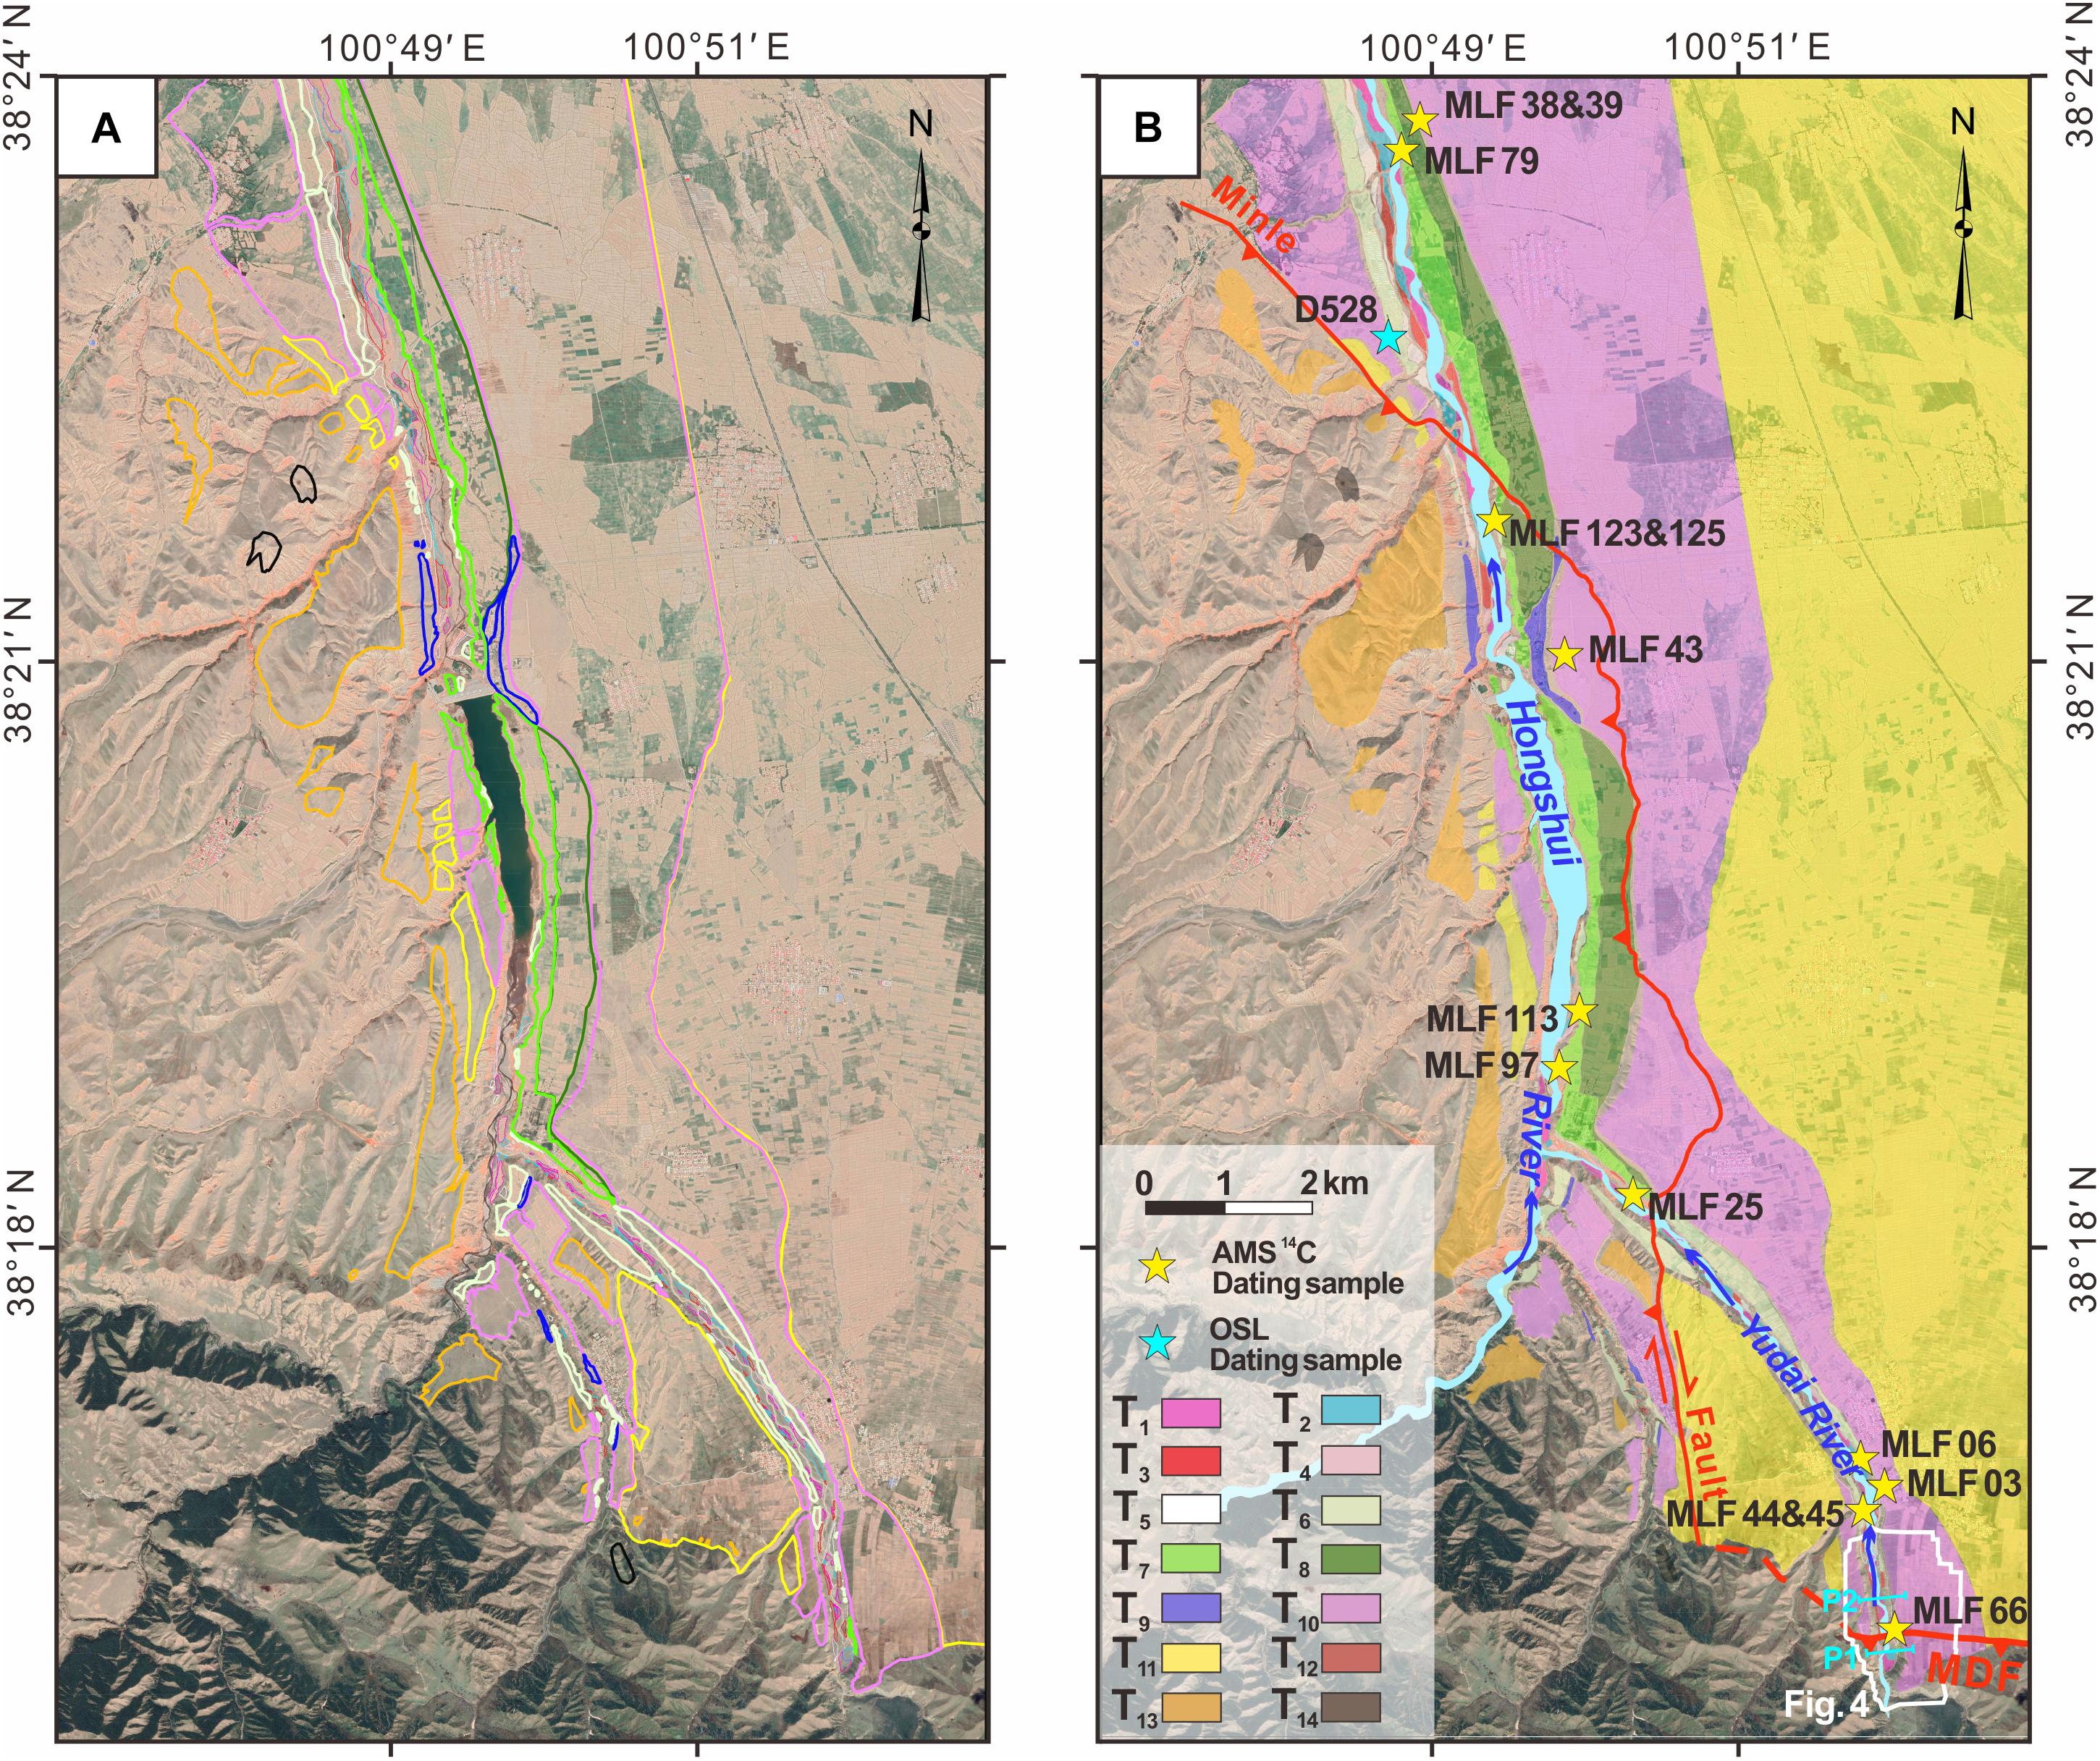
Figure 2. Terrace classification based on the Google image. (A) Google satellite image in the vicinity of the study site. (B) Terrace distribution of the Yudai River and the Hongshui River, and sampling sites of some samples. P1 and P2 show the locations of the sections in Figure 4.
At the outlet of the Yudai River, the MDF faulted T7 and T10 on the east bank and T10 on the west bank (Figures 2B, 3). The structure of the terraces was reflected in the river-terrace cross-section of the hanging wall and footwall (Figure 4). In the hanging wall, the structure of T10 could be divided as ∼3 m loess, ∼0.1 m fluvial sand, ∼14 m fluvial gravels, and the underlying bedrock from top to bottom. Due to serious erosion, a ∼0.9-m-thick mixture of loess and slope deposits overlying ∼2.9-m-thick fluvial gravels has deposited on the bedrock of T7 in the hanging wall. A layer of ∼2-m-thick fluvial sand has deposited on T5. Only a layer of 0.1–1-m-thick loess and/or fluvial sand has deposited on T4–T1, and the underlying bedrock was not exposed (Figure 4A). In the footwall, the thicknesses of the fluvial gravels, fluvial sand, and aeolian loess overlying the Jiuquan Conglomerate (Q2) (Zhao et al., 2001) of T10 were similar to those in the hanging wall. A loess layer has deposited on T7 in the footwall, with even a thickness of 3.8 m somewhere. T6 in the footwall was composed of ∼8 m fluvial gravels, 0.1–0.5 m fluvial sand, and ∼2.5 m loess depositing on the top of the Jiuquan Conglomerate (Q2) (Zhao et al., 2001). A layer of 0.1–1-m-thick loess and/or fluvial sand has deposited above the fluvial gravels of T4–T1 (Figure 4B).
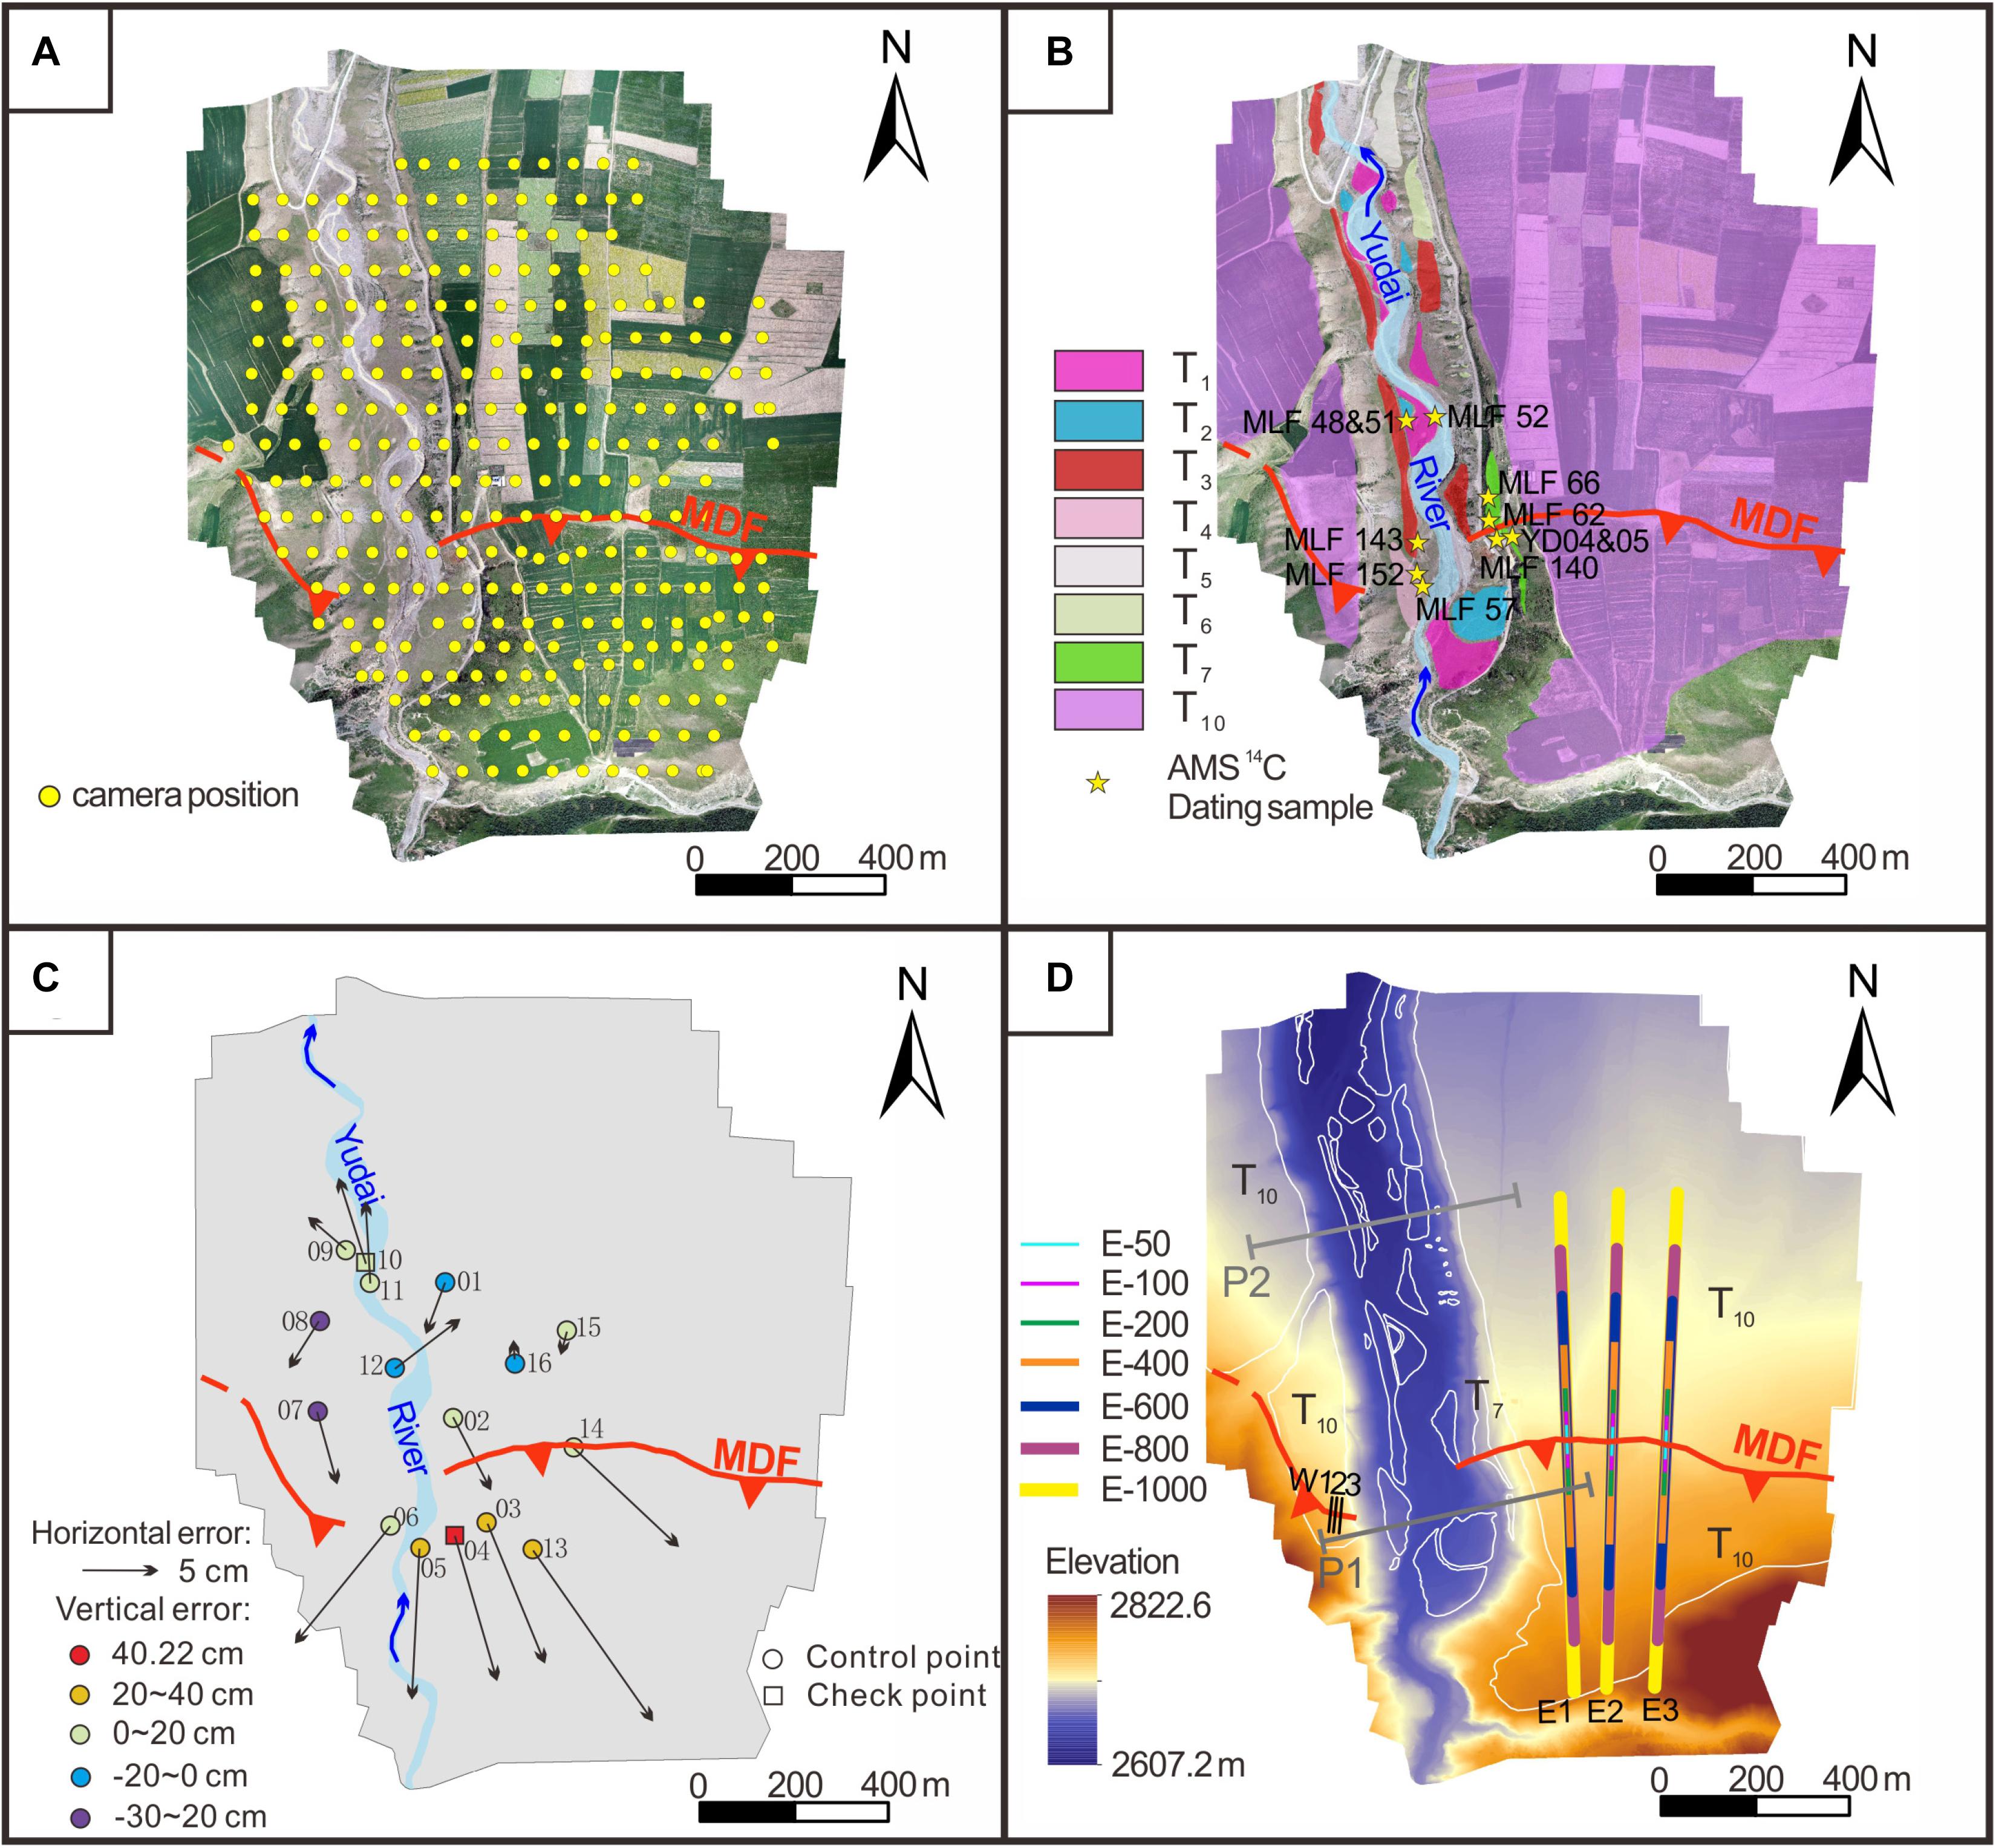
Figure 3. SfM post-image processing. (A) Orthoimage of the MDF at the outlet of the Yudai River taken by the UAV. Yellow dots show the camera positions of 260 m above the ground. (B) Interpretation of the terraces based on the high-resolution orthoimage and sampling sites of some samples. (C) Positions of the control points and checkpoints, with a total number of 16 with associated horizontal and vertical errors which control the precision of the DEM. (D) DEM generated from the Orthoimage. Three profiles (W1/W2/W3) were extracted from T10 on the west bank of the Yudai River, corresponding to those in Figure 10. Six profiles, with lengths of 50 m, 100 m, 200 m, 400 m, 600 m, and 800 m, respectively, were extracted from each site among the three sites (E1/E2/E3) on the east bank of T10 (taking E1-50 as an example, it represents the profile with a length of 50 m extracted across the fault at the site of E1), corresponding to those in Figure 9. P1 and P2 show the locations of the sections in Figure 4.
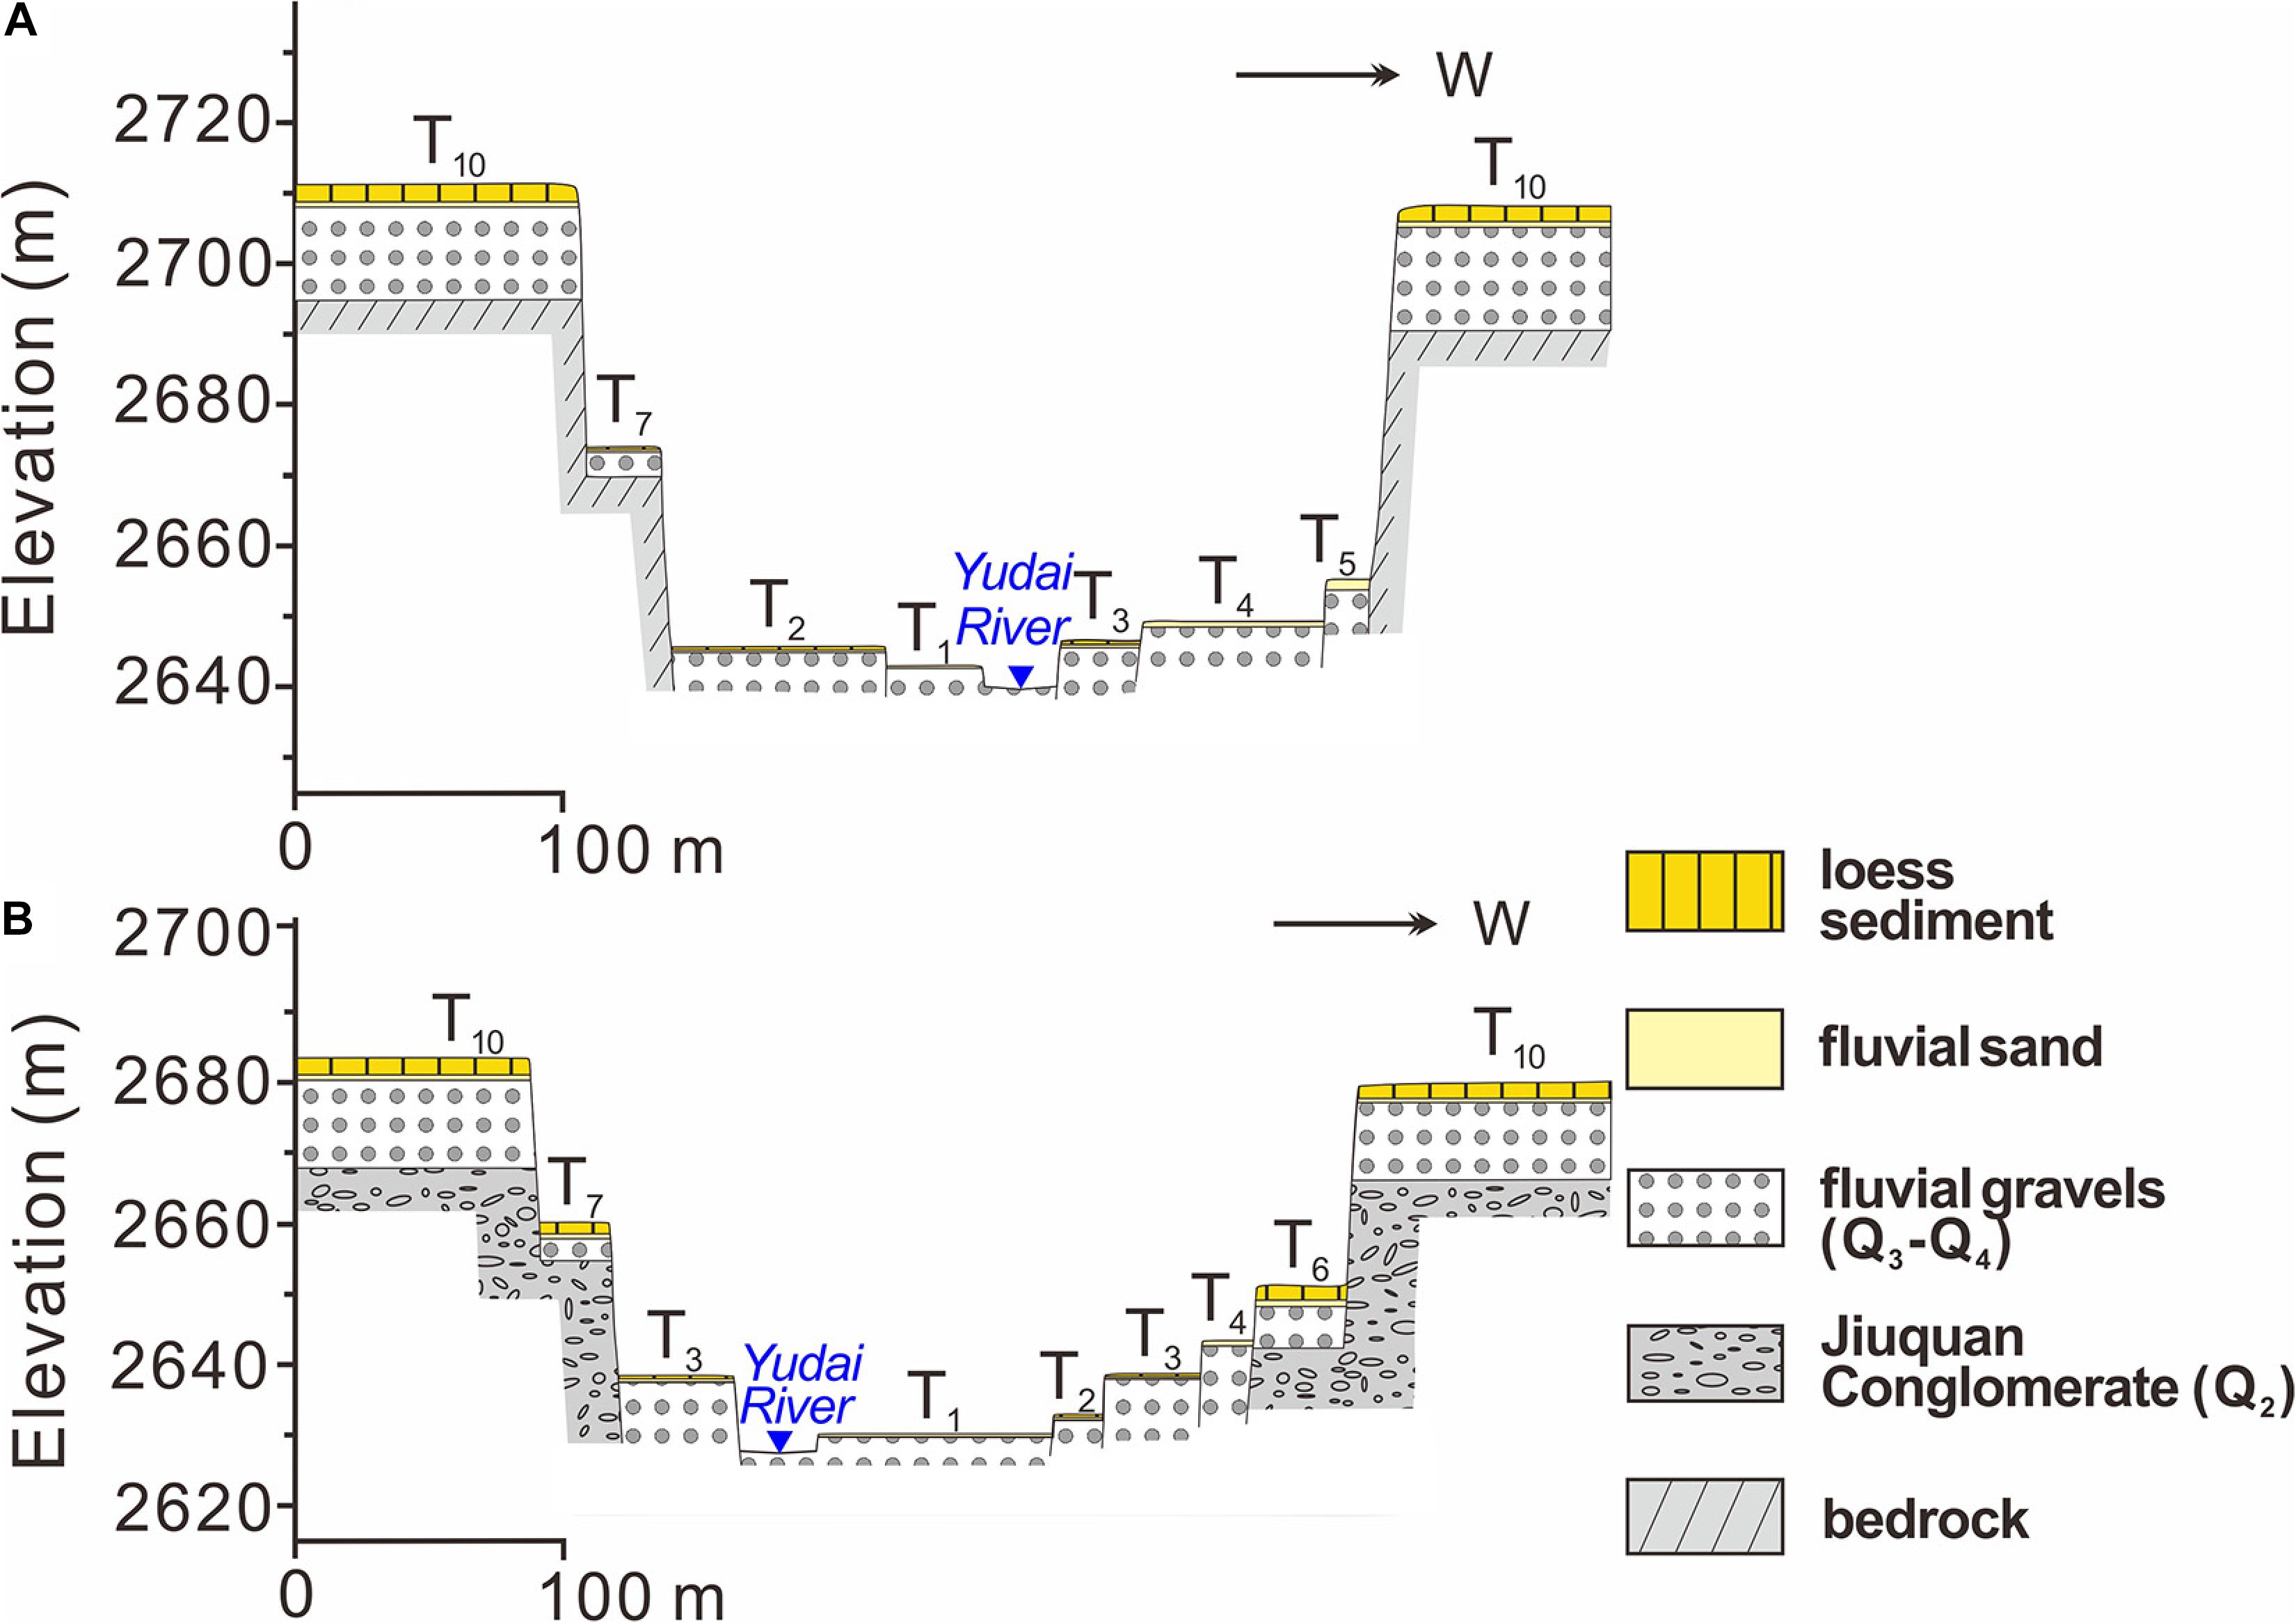
Figure 4. Terraces structure of the Yudai River. Panels (A,B) indicate the general structure of the terraces in the hanging wall and footwall of the MDF, respectively. The locations of the two sections are shown in Figures 2B, 3D.
Sampling Strategy
To determine the abandonment ages of the terraces, charcoal samples were collected from the natural exposures on each terrace. The hydrodynamic conditions are usually weak on the gravel layer when the river has just incised from it, thus floodplain materials with sand and silt may deposit above it. Therefore, the age of the charcoal collected from the fluvial sand on the top of the gravel layer is closest to the abandonment age of the terrace (Zhang et al., 2008; Xu et al., 2010; Xiong et al., 2017; Zhong et al., 2020). Sampling sites are shown in Figures 2, 3B, 5. Except for T5, T8, and T9, on which no suitable dating materials were found, the samples from the other terraces were sent to Beta Analytic Inc., United States, or AMS 14C Laboratory of Peking University for AMS 14C tests (Table 1). Samples of T1–T6 were all collected from the fluvial sand overlying or within the gravel and cobble layer. The fluvial sand layers are generally covered by silt and/or loess, and even a layer of pebbles (Figures 5A–G and Table 1). Among the seven samples of T7, five samples were collected near the fault scarp of the MDF: MLF62 was from the fluvial sand about 3 cm above the top of the gravel layer near the fault (Figure 5H), MLF66 was from the sand 15 cm above the top of gravel layer in the footwall of the fault (Figure 5I), and MLF140 was from the silt above the interface between the gravels and slope deposits in the hanging wall (Figure 5J). YD04 and YD05 were collected from the loess about 0.9 m and 0.1 m above the gravel layer, respectively (Figure 5K). The other two samples were collected from the fluvial sand overlying the gravel and cobble layer of the middle and lower reaches of the Hongshui River, respectively (Figures 2, 5L,M). Four samples were collected on T10. MLF38 and MLF39 were collected from the fluvial sand above and within the gravel layer at the same site, respectively (Figures 2, 5O). MLF03 was from the fluvial sand layer 15 cm above the gravel layer, and MLF43 was from the loess 5 cm above the gravel layer (Figure 5P).
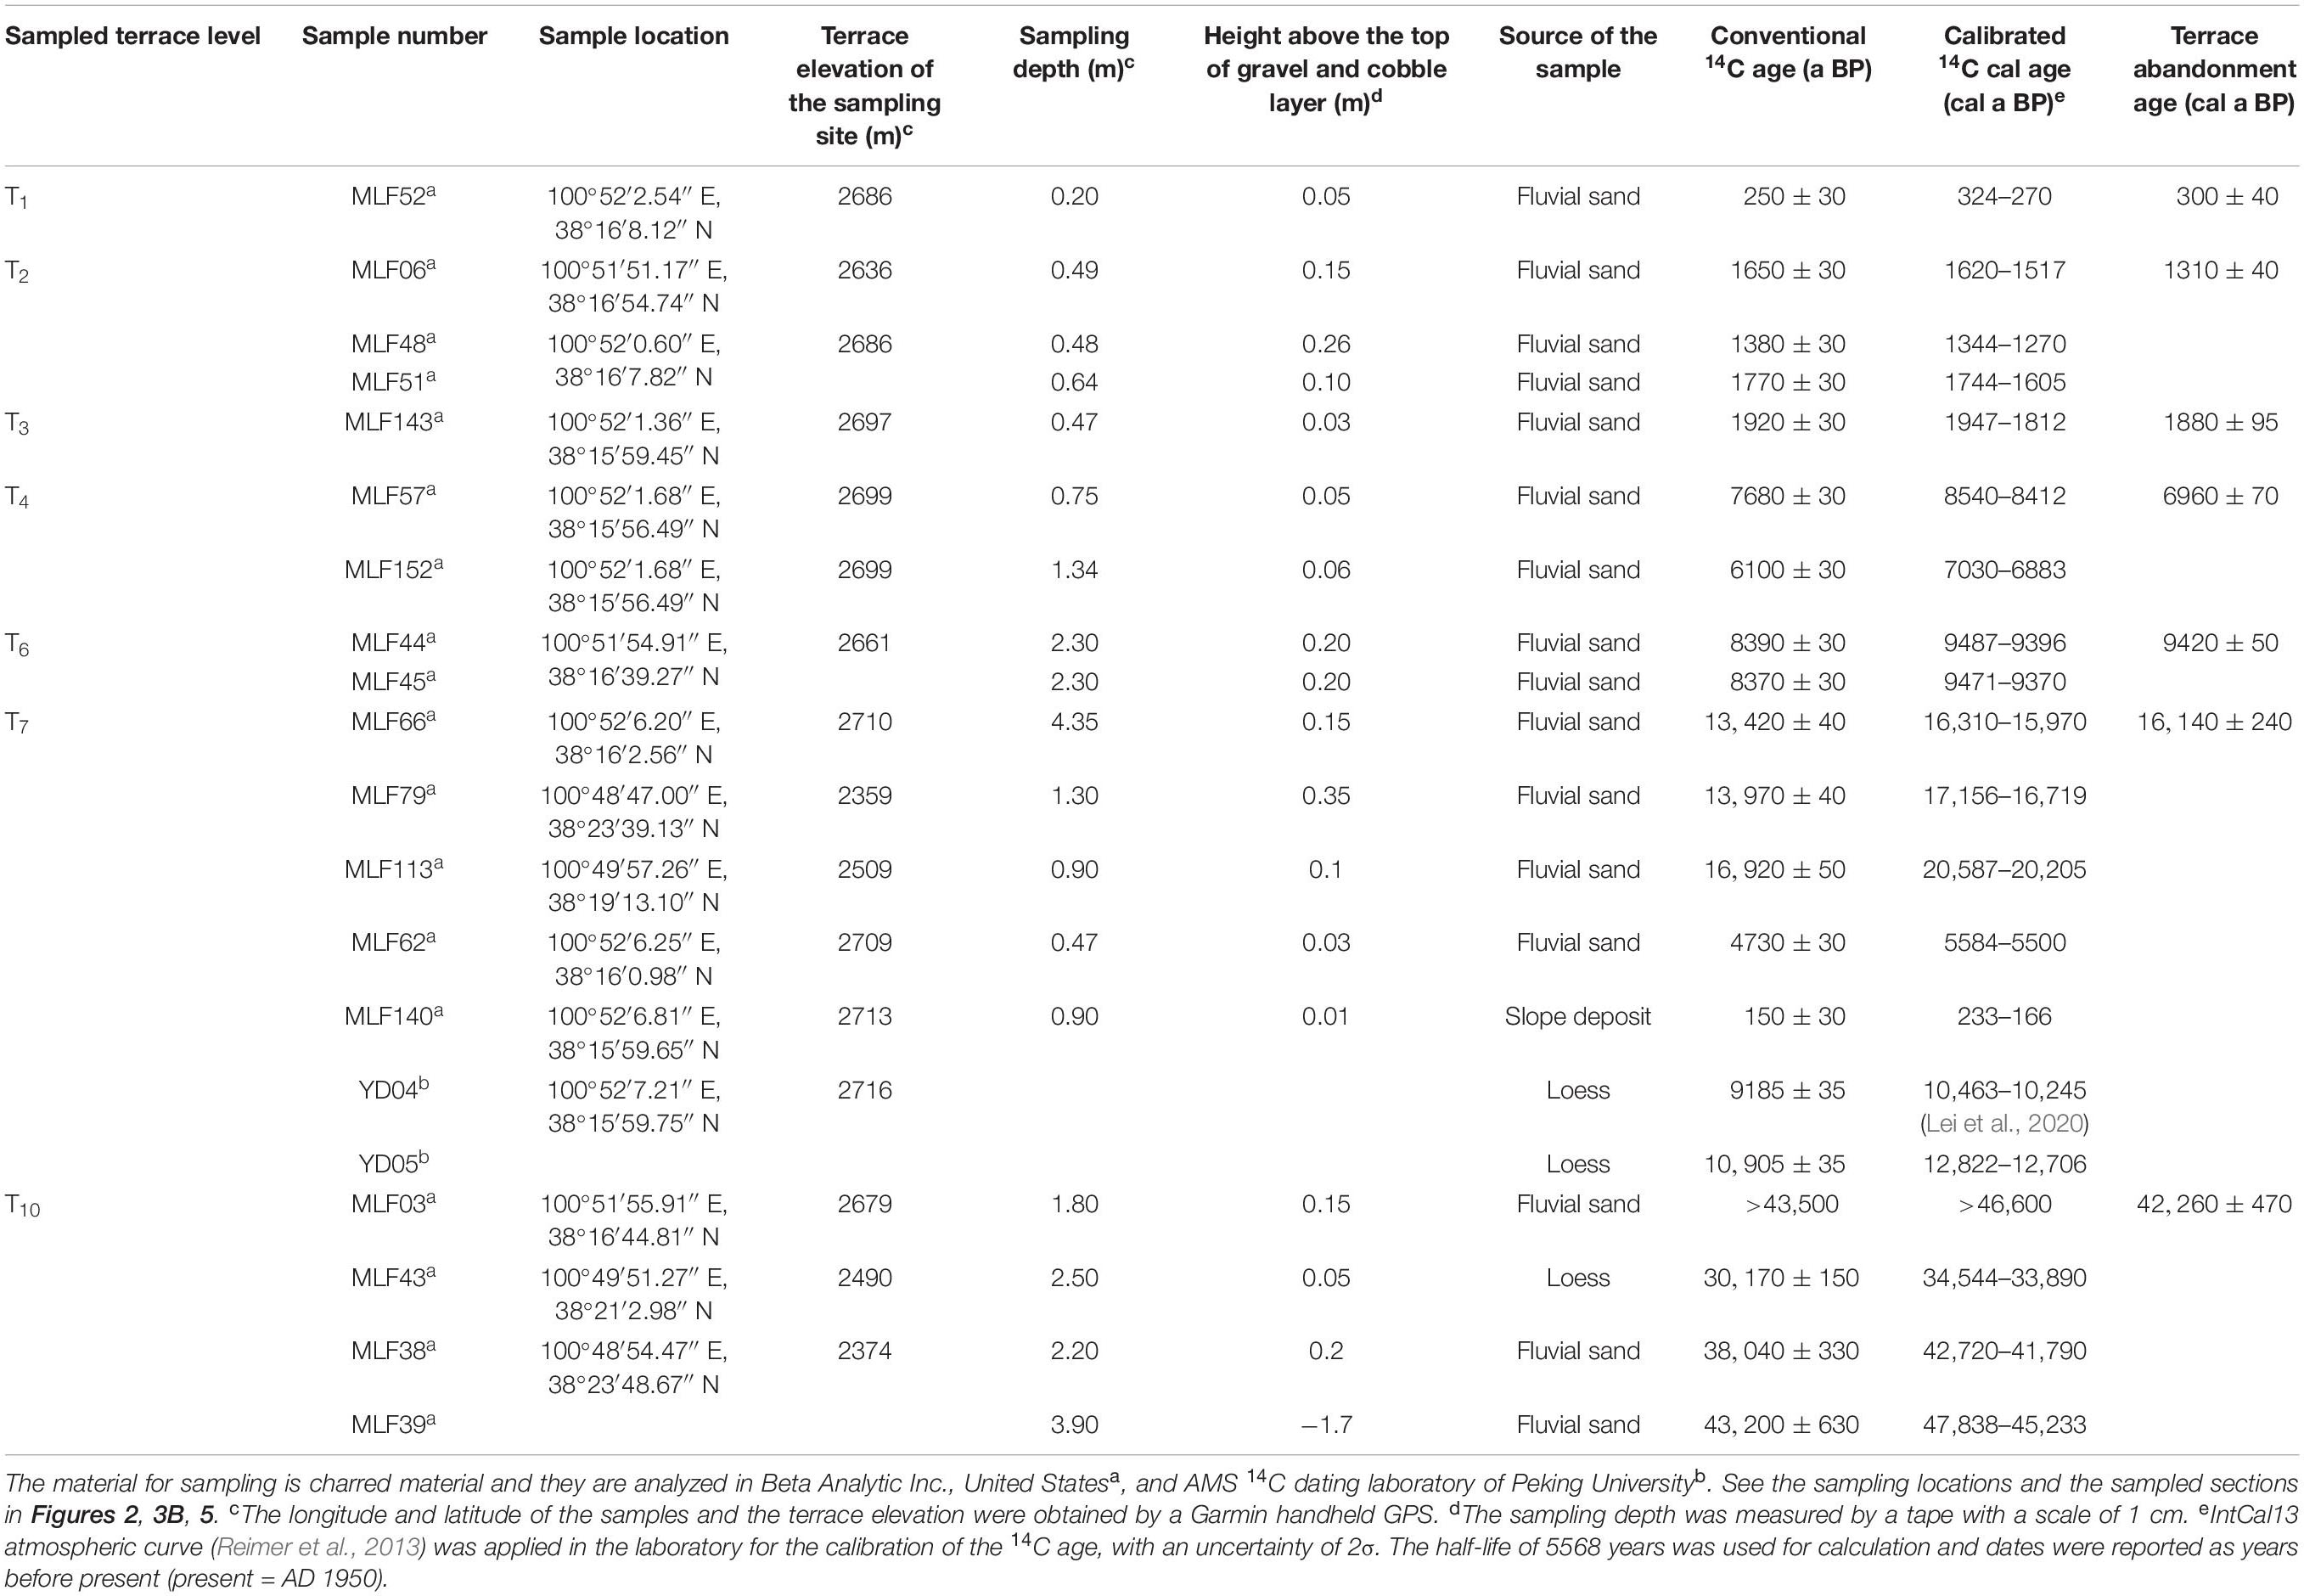
Table 1. AMS 14C dating data of the Yudai River and the Hongshui River terraces.
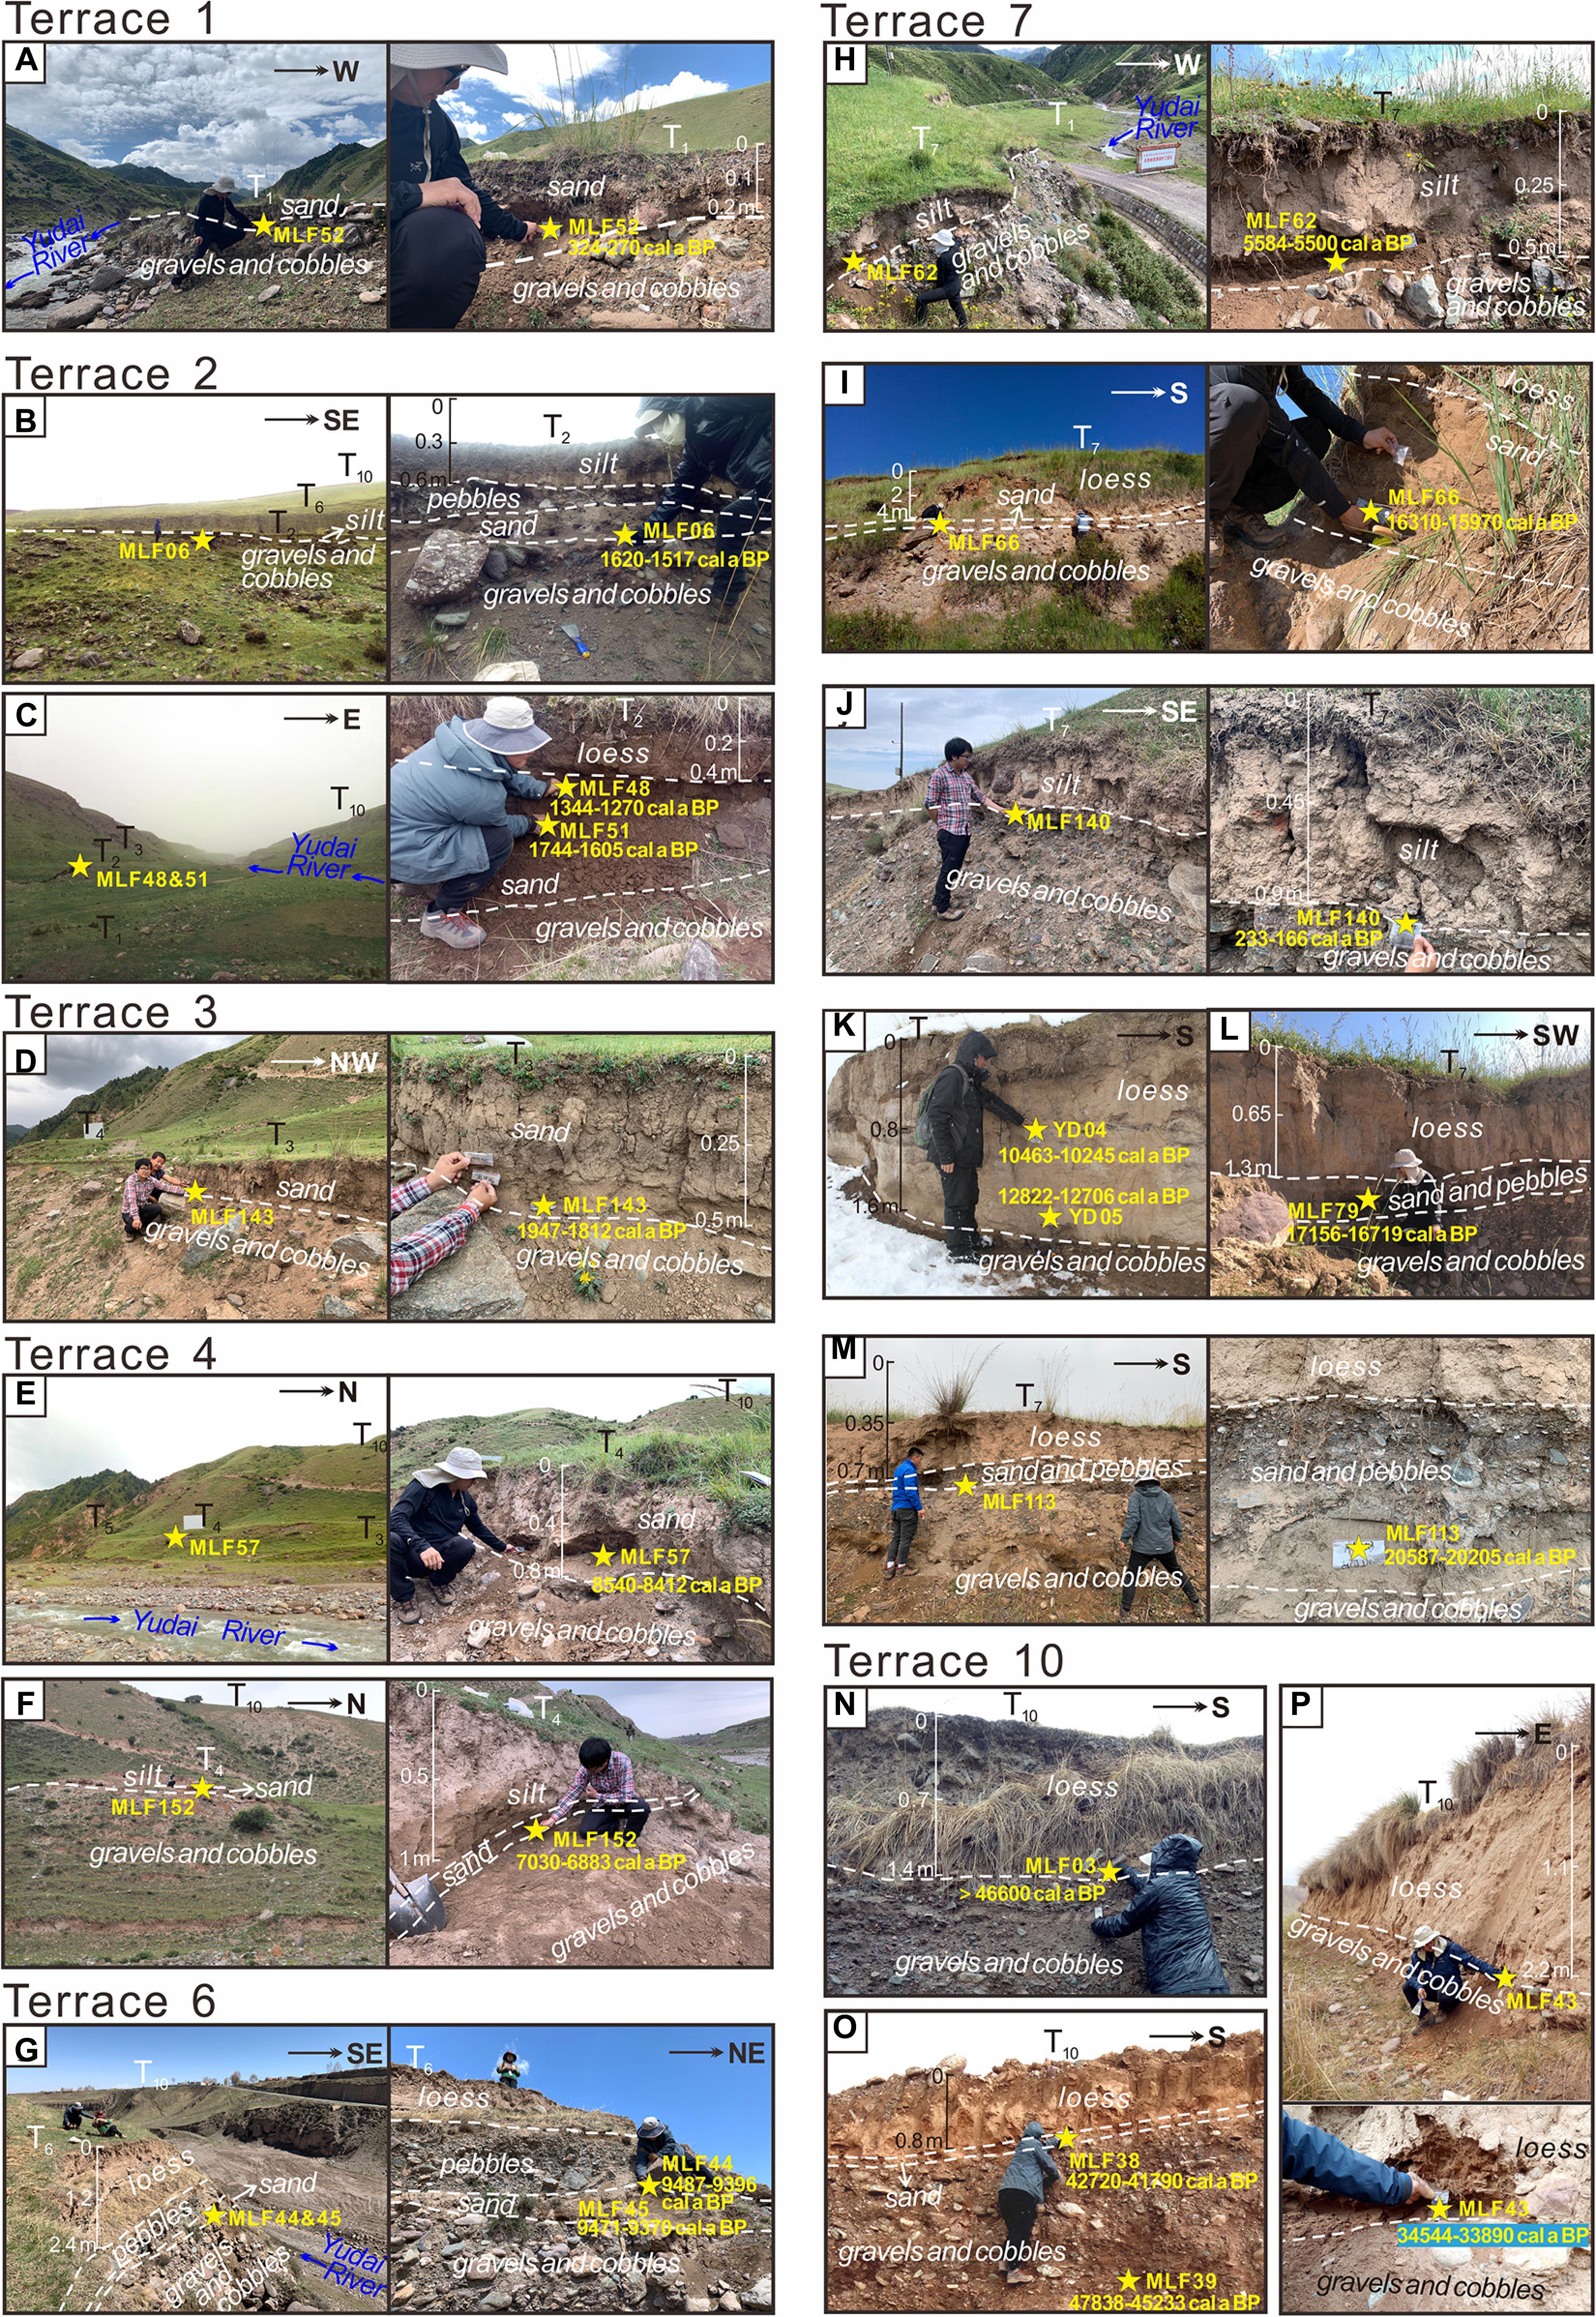
Figure 5. Sampling photos of terraces of the Yudai River and the Hongshui River. See Figures 2, 3B for sampling locations. (A) The dating sample of T1. (B–C) The dating samples of T2. (D) The dating sample of T3. (E–F) The dating samples of T4. (G) The dating samples of T6. (H–M) The dating samples of T7. (N–P) The dating samples of T10.
The laboratory treated the samples following the standard experimental procedure (De Vries and Barendsen, 1954). All the samples were pretreated with an acid–alkali–acid sequence to remove contaminants and then converted into graphite samples, which were used for the radiometric C determination by AMS.
Measurement of the Scarp Height
The tops of the loess layer and fluvial gravel layer were considered as the marker surfaces to obtain the topographic profiles across the fault for the scarp heights. In this study, two methods were used to obtain profiles across the fault.
The first was the SfM (Structure from Motion) photogrammetry. The rapidly popular unmanned aerial vehicles (UAVs) have provided platforms for SfM photogrammetry, which has been commonly used to measure the height of surface scarps (Priyanka et al., 2017; Xiong et al., 2017; Liu et al., 2019; Zhong et al., 2020). The high-precision orthoimages obtained from SfM photogrammetry can offer the most visualized fault morphology, and the produced DEM can be used to measure the accurate length and height (Harwin and Lucieer, 2012). To obtain the topographic profile of the top of the loess layer, the UAV of Dajiang phantom 4 Pro was used to carry out the photogrammetry at the outlet of the Yudai River. This type of UAV is equipped with a 1-inch outsole Sony Exmor R CMOS sensor of 20 megapixels and a satellite positioning module (GPS/GLONASS). Fourteen control points and two checkpoints were set in the planned area before the flight (Figure 3C). RTK GPS with centimeter precision was used to measure the coordinates of each point, and the vertical and horizontal precisions of the image were respectively controlled at 0.2 m and 0.08 m (Figure 3). Based on the produced DEM, topographic profiles across the MDF were extracted from the loess layer of the T10. Because T10 is limitedly distributed on the west bank of the Yudai River, especially on the hanging wall, only three parallel profiles with lengths of ∼80 m (W1/W2/W3) were extracted from it (Figures 3B,D). However, T10 distributed on the east bank is wide and flat. Thus, we extracted profiles with different lengths from three sites (E1/E2/E3). Seven lines were extracted from each site, with lengths of 50 m, 100 m, 200 m, 400 m, 600 m, 800 m, and 1000 m, respectively (Figure 3D).
The second method was to measure the scarp height with high-precision instruments, which was suitable for extracting profiles from the top of the gravel layer if the gravel layer is continuously exposed. RTKGPS with an accuracy of 5 cm was used to obtain the location and absolute elevation of a measuring point, and TruPulse 200X laser rangefinder with an accuracy of 1 cm was used to measure the relative height from the measuring point to the top of the gravel layer in the same location. In this way, the absolute elevation of the top of the gravel in the location was obtained. After measuring a series of points and calculating the distance between them, an elevation–distance profile was plotted (Figures 6B, 7B). As the gravel and loess layers of T7 on the east bank were exposed well, the top of the gravel and loess profiles were plotted with this method. However, part of the exposed gravels in the hanging wall was located at the trailing edge of T7. Because of the elevation difference between the trailing and leading edges of the terrace, a sudden turning point of elevation appeared in the profile. Therefore, the trendline of the leading edge of the terrace was taken as the reference line of the hanging wall (Figure 6). The outcrop on T7 also shows the contact interface between Tertiary red sandstone and Quaternary sediments on either side of the fault, and a dip angle of 42° was measured at the contact interface with a geological compass (Figure 6A). Considering the error of the instrument is 3°, the dip angle of the MDF at the outlet of the Yudai River was determined to be 42 ± 3° (Figure 6A). The gravels of T10 on the east bank were limitedly exposed, especially near the fault scarp, where the top of the original gravel layer in the hanging wall has suffered severe erosion (Figure 6A). Therefore, the complete profile topography could not be obtained by measuring the height of the scarp. However, the top of the gravel layer of T10 on the west bank was well exposed, and its profile could be used to measure the scarp height (Figure 7).
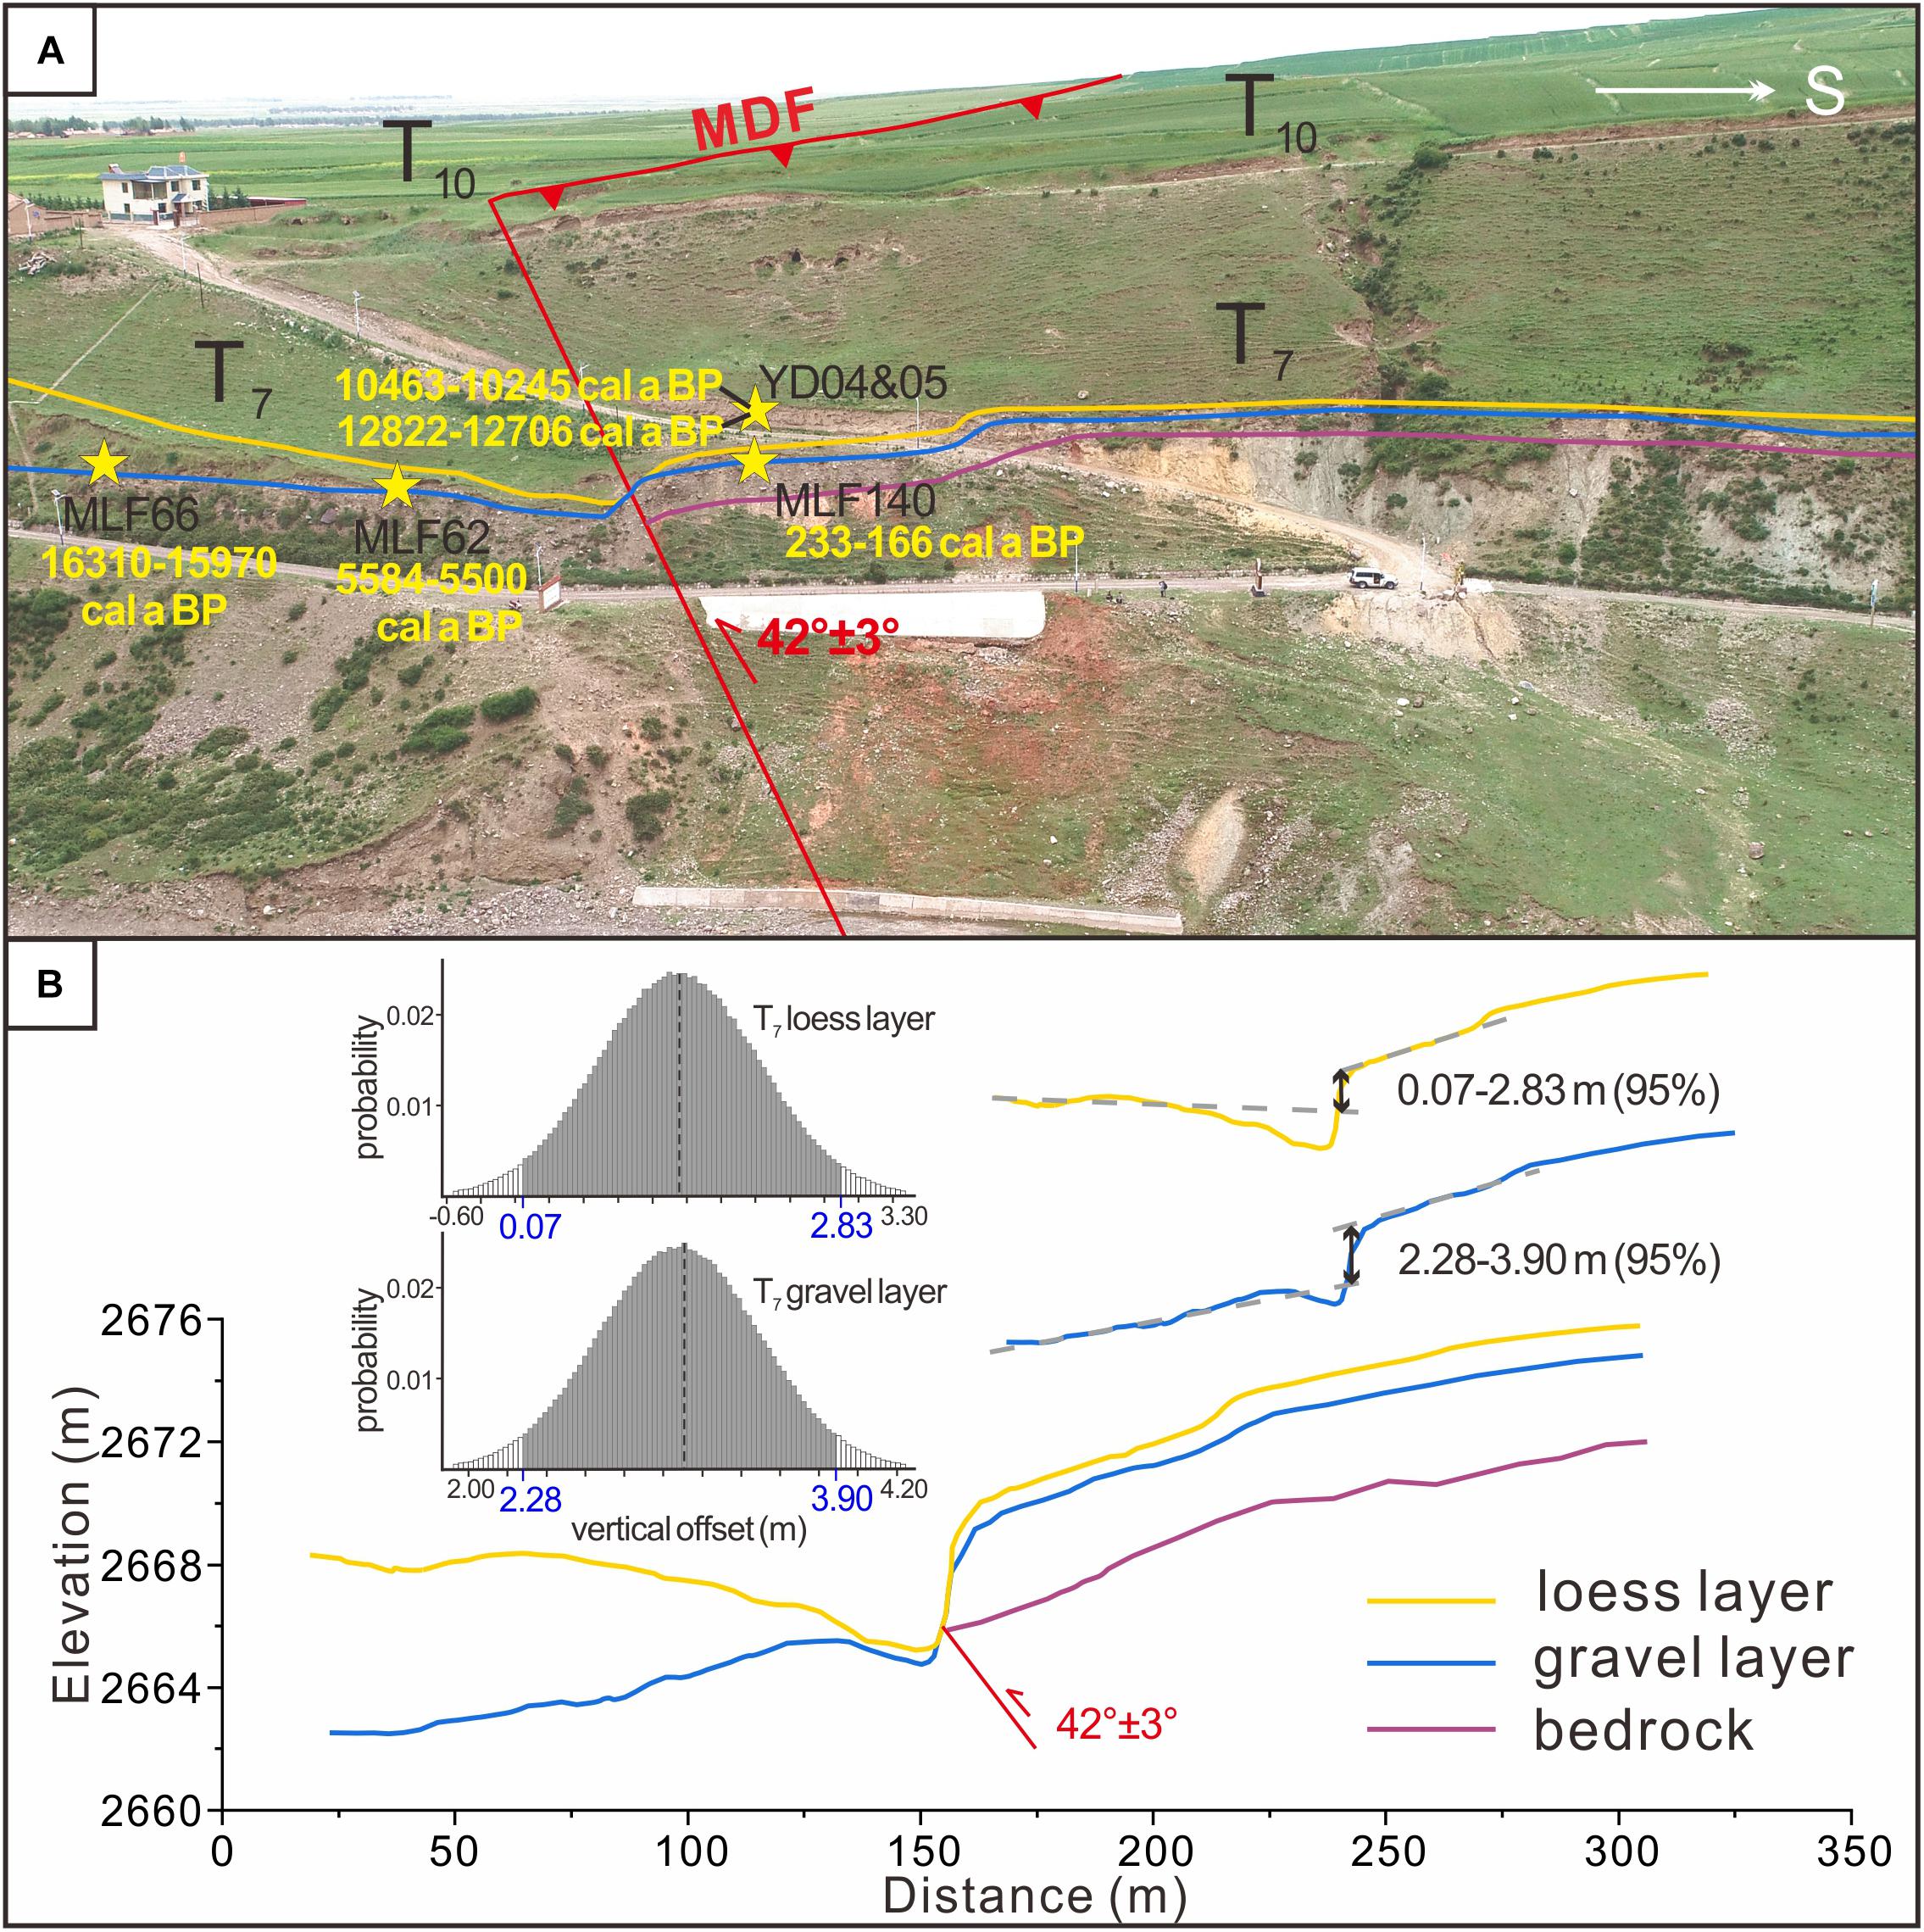
Figure 6. Measurement of the scarp height of T7 on the east bank. (A) Exposure profile of T7. The boundaries between layers are marked by solid lines in different colors. (B) Profile morphologies of the top of the loess layer, the fluvial gravel layer, and the bedrock layer. The profile was measured by differential GPS and the height of the scarp was obtained by Monte Carlo simulation.
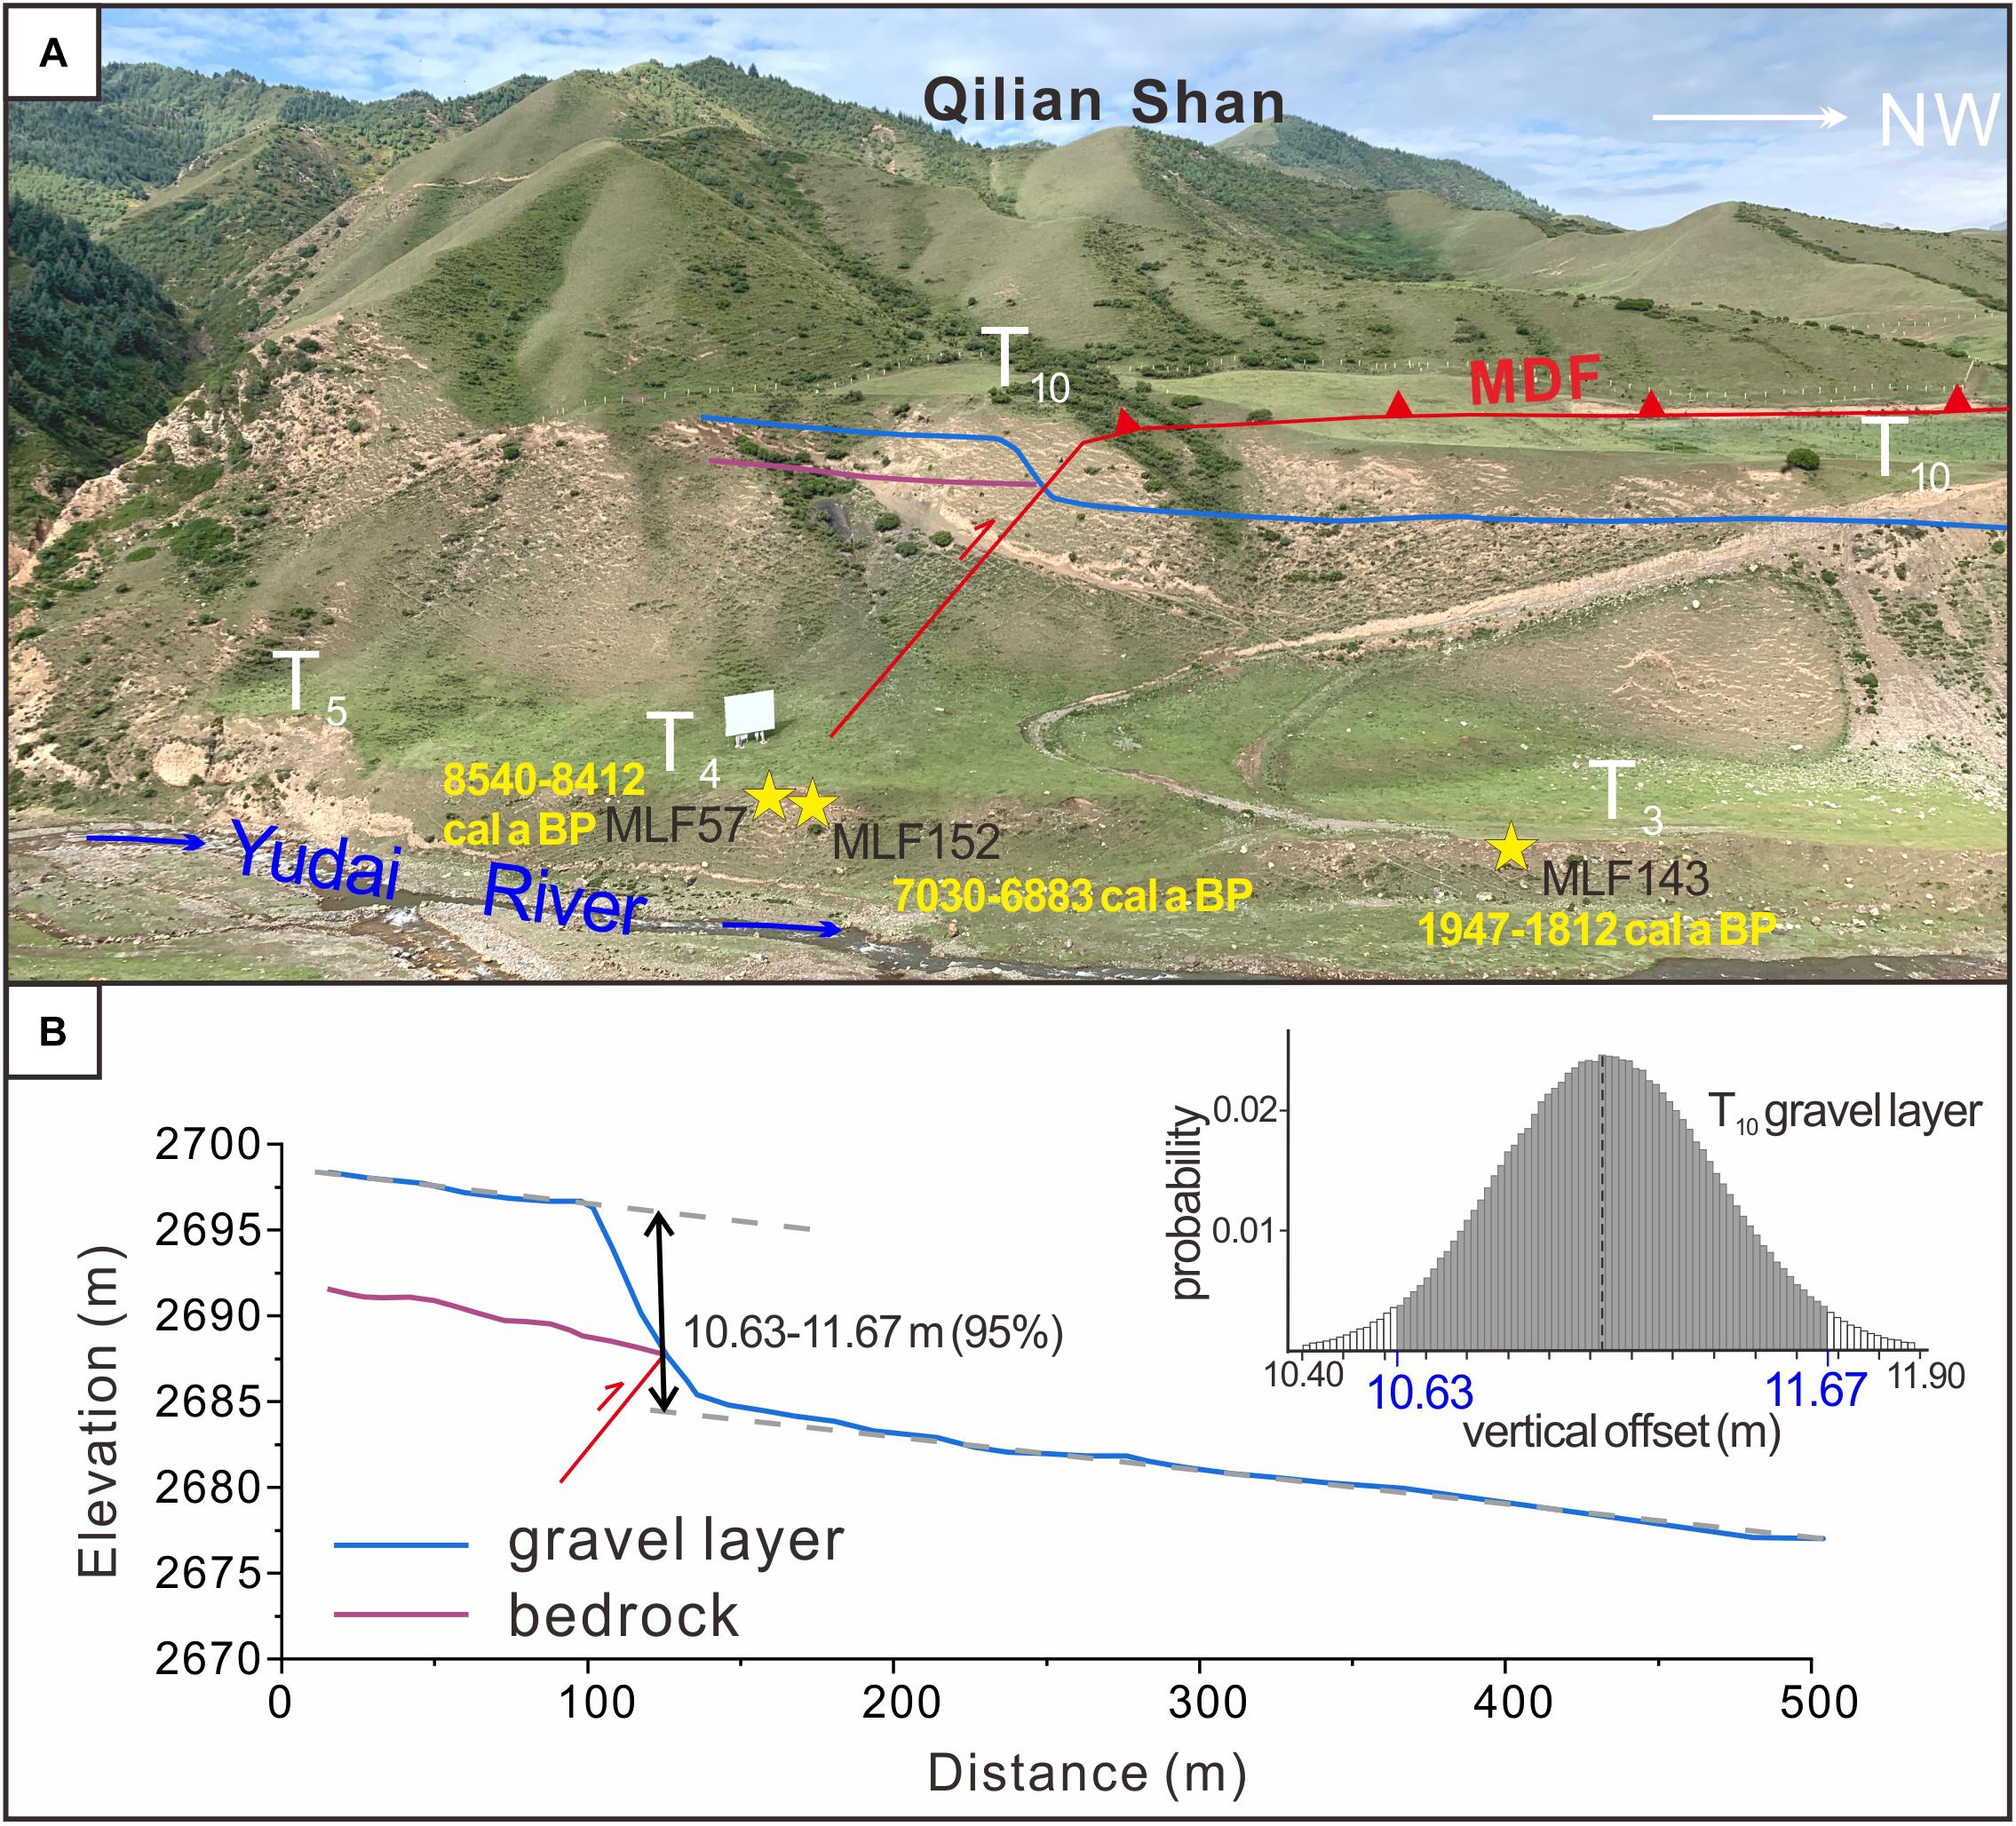
Figure 7. Measurement of the scarp height of T10 on the west bank. (A) Exposure profile of T10. The boundaries between layers are marked by solid lines in different colors. (B) Profile morphologies of the top of the gravel layer and the bedrock layer. The profile was measured by differential GPS and the height of the scarp was obtained by Monte Carlo simulation.
The model proposed by Thompson et al. (2002) was used to measure the vertical offset of the fault. First of all, the river terrace was considered to be originally planar. Field data were measurement points along the terrace surface and across the fault. To calculate the vertical offset of the fault, all field data were rotated and projected onto a vertical plane normal to the structural trend (Figure 8A). Least squares linear regressions of these points in an x–y coordinate system determined trendlines representing the hanging wall (y1 = a1x + b1), fault scarp (y2 = a2x + b2), and footwall (y3 = a3x + b3) (Figure 8A).
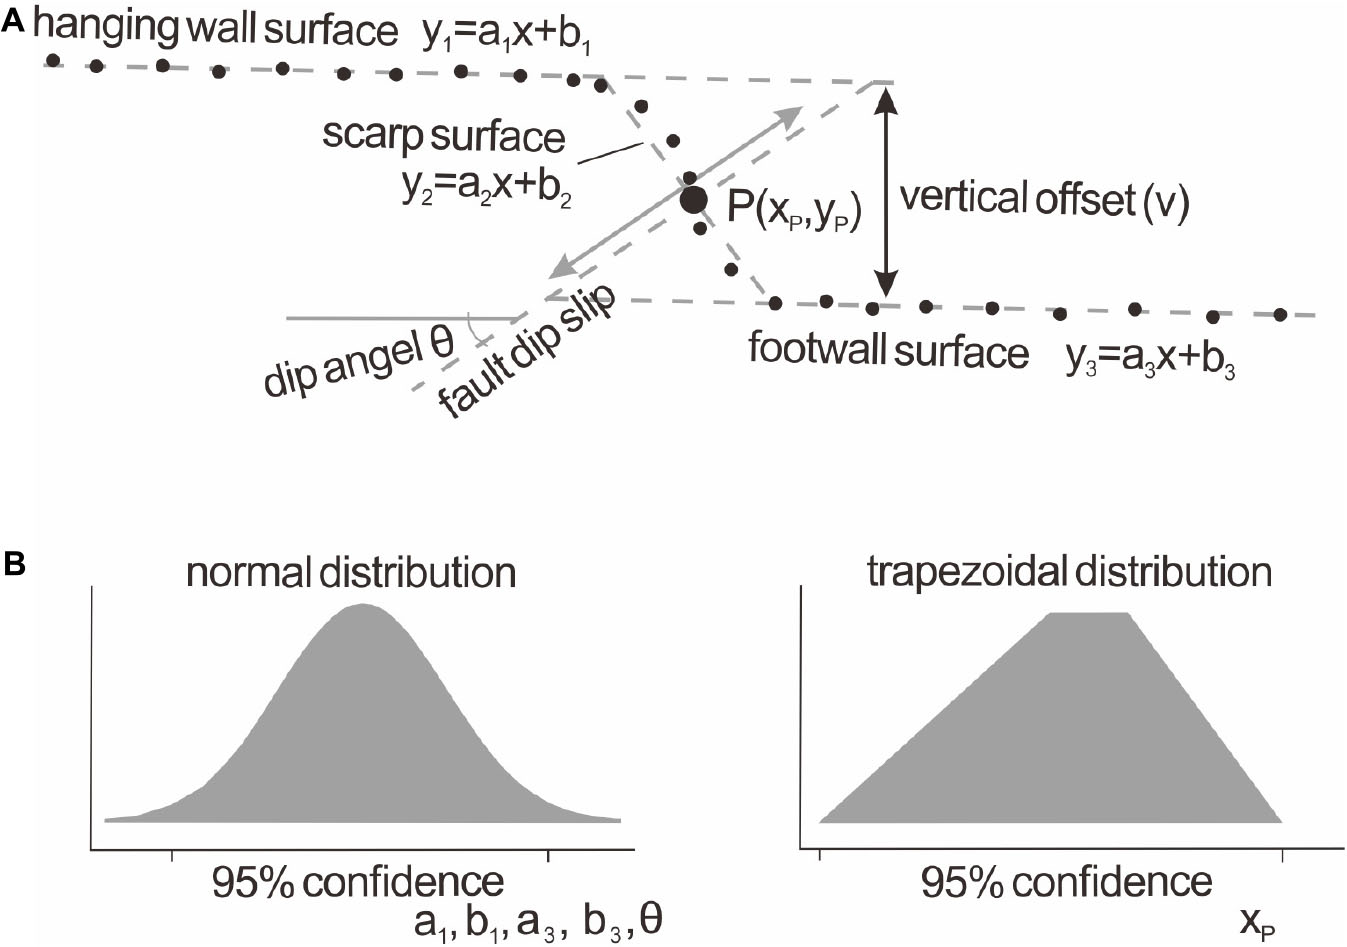
Figure 8. Measurement of the scarp height and uncertainty analysis. (A) The model for measuring the vertical offset of the fault proposed by Thompson et al. (2002). (B) The probability distribution of independent variables.
The vertical offset could be calculated by function (1) if the hanging wall was parallel to the footwall; otherwise, it could be calculated by function (2). The value xp is the abscissa of point P (xp, yp), at which the fault plane intersects the scarp plane.
Uncertainty Analysis
In this study, Monte Carlo simulation was implemented to calculate the uncertainties of vertical offsets and the rates of the fault. SEs of all the independent variables were taken into account in this method (Thompson et al., 2002). For independent variables in symmetric distributions such as a1, b1, a3, b3, and dip angle θ, a normal distribution was used when sampling them (Figure 8B; Thompson et al., 2002). For ease of calculation, 14C age was also assumed to be normally distributed (Figure 8B). Because the position of the intersection point P (xp, yp) between the fault plane and the scarp surface was unknown, the trapezoidal distribution was adopted. The probability of the location of point P is maximum within the range of 1/3 to 1/2 the distance along the scarp surface measured from the base of the scarp and diminishes to zero at the top and the base of the scarp (Figure 8B; Thompson et al., 2002). In the estimation of the fault scarp height and the vertical slip rate, 106 simulations were conducted for each result and a 95% CI was defined as the uncertainty.
Results
Determination of the Abandonment Ages of Terraces
MLF52 was collected from the fluvial sand overlying the gravel layer, only 5 cm above the boundary between the two layers, thus its age 300 ± 40 cal a BP can represent the abandonment age of T1 (Figure 5A and Table 1). Among the three samples of T2, MLF06 (1620–1517 cal a BP) is from the fluvial sand between the cobbles and pebbles layer, only ∼0.5 m below the surface, and its age is similar to that of MLF51 (1744–1605 cal a BP), which approaches the top of the gravel layer. In addition, the ages of these two samples are both older than that of MLF48 (1344–1270 cal a BP), which is from the upper fluvial sand. This is consistent with the stratigraphic sedimentary sequence. The deposition age of MLF48 (1310 ± 40 cal a BP) is closer to the abandonment age of the fluvial sand, which can be taken as the abandonment age of T2 (Figures 5B,C and Table 1). We take the age of 1880 ± 95 cal a BP of MLF143 as the abandonment age of T3, as the sample is from the upper fluvial sand (Figure 5D and Table 1). The deposition heights above the gravel layer of the two samples of T4 are similar, and they are both from the fluvial sand, thus we take the younger age of 6960 ± 70 cal a BP as the abandonment age of T4 (Figures 5E,F and Table 1). The ages of MLF44 (9487–9396 cal a BP) and MLF45 (9471–9370 cal a BP) are very close, thus the younger age of 9420 ± 50 cal a BP is taken to represent the abandonment age of T6 (Figure 5G and Table 1).
The terrace T7 has suffered severe reconstruction near the fault by surface processes so that the ages of the collected samples are greatly different (Table 1). MLF66 (16,310–15,970 cal a BP) is collected from the fluvial sand overlying the gravel layer in the footwall, and a 3.8-m-thick loess overlies the fluvial sand at this site, effectively protecting the fluvial sediments from erosion (Figures 5I, 6A). YD04 (10,463–10,245 cal a BP) and YD05 (12,822–12,706 cal a BP) are from the loess overlying the fluvial layer at the back of the terrace. Although they cannot represent the abandonment age of the terrace, they show good stratigraphic chronology with MLF66 (Figures 5K, 6A), indicating that the ages are reliable. In addition, the ages of the samples of T7 collected from different sites along the Yudai River and even the lower part of the Hongshui River [MLF79 (17,156–16,719 cal a BP) and MLF113 (20,587–20,205 cal a BP); Figures 2, 5L,M] are close to that of MLF66. In summary, the age 16,140 ± 240 cal a BP of MLF66 is used to represent the abandonment age of T7. MLF62 (5584–5500 cal a BP) is from the footwall sand layer near the fault, where the topography is concave (Figures 5H, 6A). A 0.5-m-thick sand layer overlies the gravel layer and the loess deposition is missing. Thus, we speculate that the site may have been eroded and redeposited by a small gully, which deposited the young charcoals in the sand layer, resulting in the younger age of MLF62 (Figures 5H, 6A). MLF140 (233–166 cal a BP) was collected from the interface between the gravel layer and the slope deposits. At this site, the primary aeolian loess has been completely eroded or never deposited. The fluvial gravel layer may also be eroded. Also, the overlying slope deposits composed of reformed loess and broken gravels are only 0.9 m thick, which may produce a very young age (Figures 5J, 6A). Therefore, the age of MLF140 cannot represent the abandonment age of T7.
The abandonment ages of T10 derived from AMS 14C (Table 1) and OSL (Table 2; Zhu, 2016) are all concentrated around 40 ka. MLF38 and MLF39 were collected from the same site, with MLF38 from the fluvial sand overlying the gravel layer and MLF 39 from the fluvial sand among the gravel layer. The ages of MLF38 (42,720–41,790 cal a BP) and MLF39 (47,838–45,233 cal a BP) are consistent with the sedimentary chronological sequence (Figure 5O). The age of D528 (40.3 ± 4.3 ka), an OSL sample collected from the sand layer among the top gravel layer (Table 2; Zhu, 2016), covers the age range of MLF38 but has greater uncertainty. MLF43 (34,544–33,890 cal a BP) is relatively younger than the other samples, probably because MLF43 was collected from the bottom of the loess (Figure 5P). In addition, MLF43 is located on a wall of a gully which means it was deposited by the gully after the abandonment of T10. Therefore, MLF43 is slightly younger (Figure 5P). Overall, the age 42,260 ± 470 cal a BP of MLF38 is suggested to represent the abandonment age of T10.

Table 2. OSL dating result of the terrace T10.
The Height of the Fault Scarp
After each profile was fitted to a Thompson et al. (2002) model, 106 trials were carried out in Monte Carlo simulation, and the vertical offsets on the 95% CI were obtained. Results show that by taking the leading edge of T7 as the reference to fit the profile morphology, the vertical offset recorded by the top of the gravel layer is 2.28–3.90 m. However, the vertical offset recorded by the loess of T7 is only 0.07–2.83 m because the loess layer has been seriously affected by surface processes (Figure 6). The vertical offset recorded by the gravel layer of T10 on the west bank is 10.63–11.67 m (Figure 7), while that recorded by the three profiles of T10 on the west bank is only 1.73–5.15 m (Figures 3D, 9). These data indicate that the topographic profile of the loess surface could be different from the original morphology more or less due to the effect of the subsequent surface processes. It cannot reflect the real vertical offset of the fault because it could be a little smaller in general. On the contrary, the gravel layer of the terrace is more likely to preserve the original offset morphology completely due to the protection of the overlying deposits.
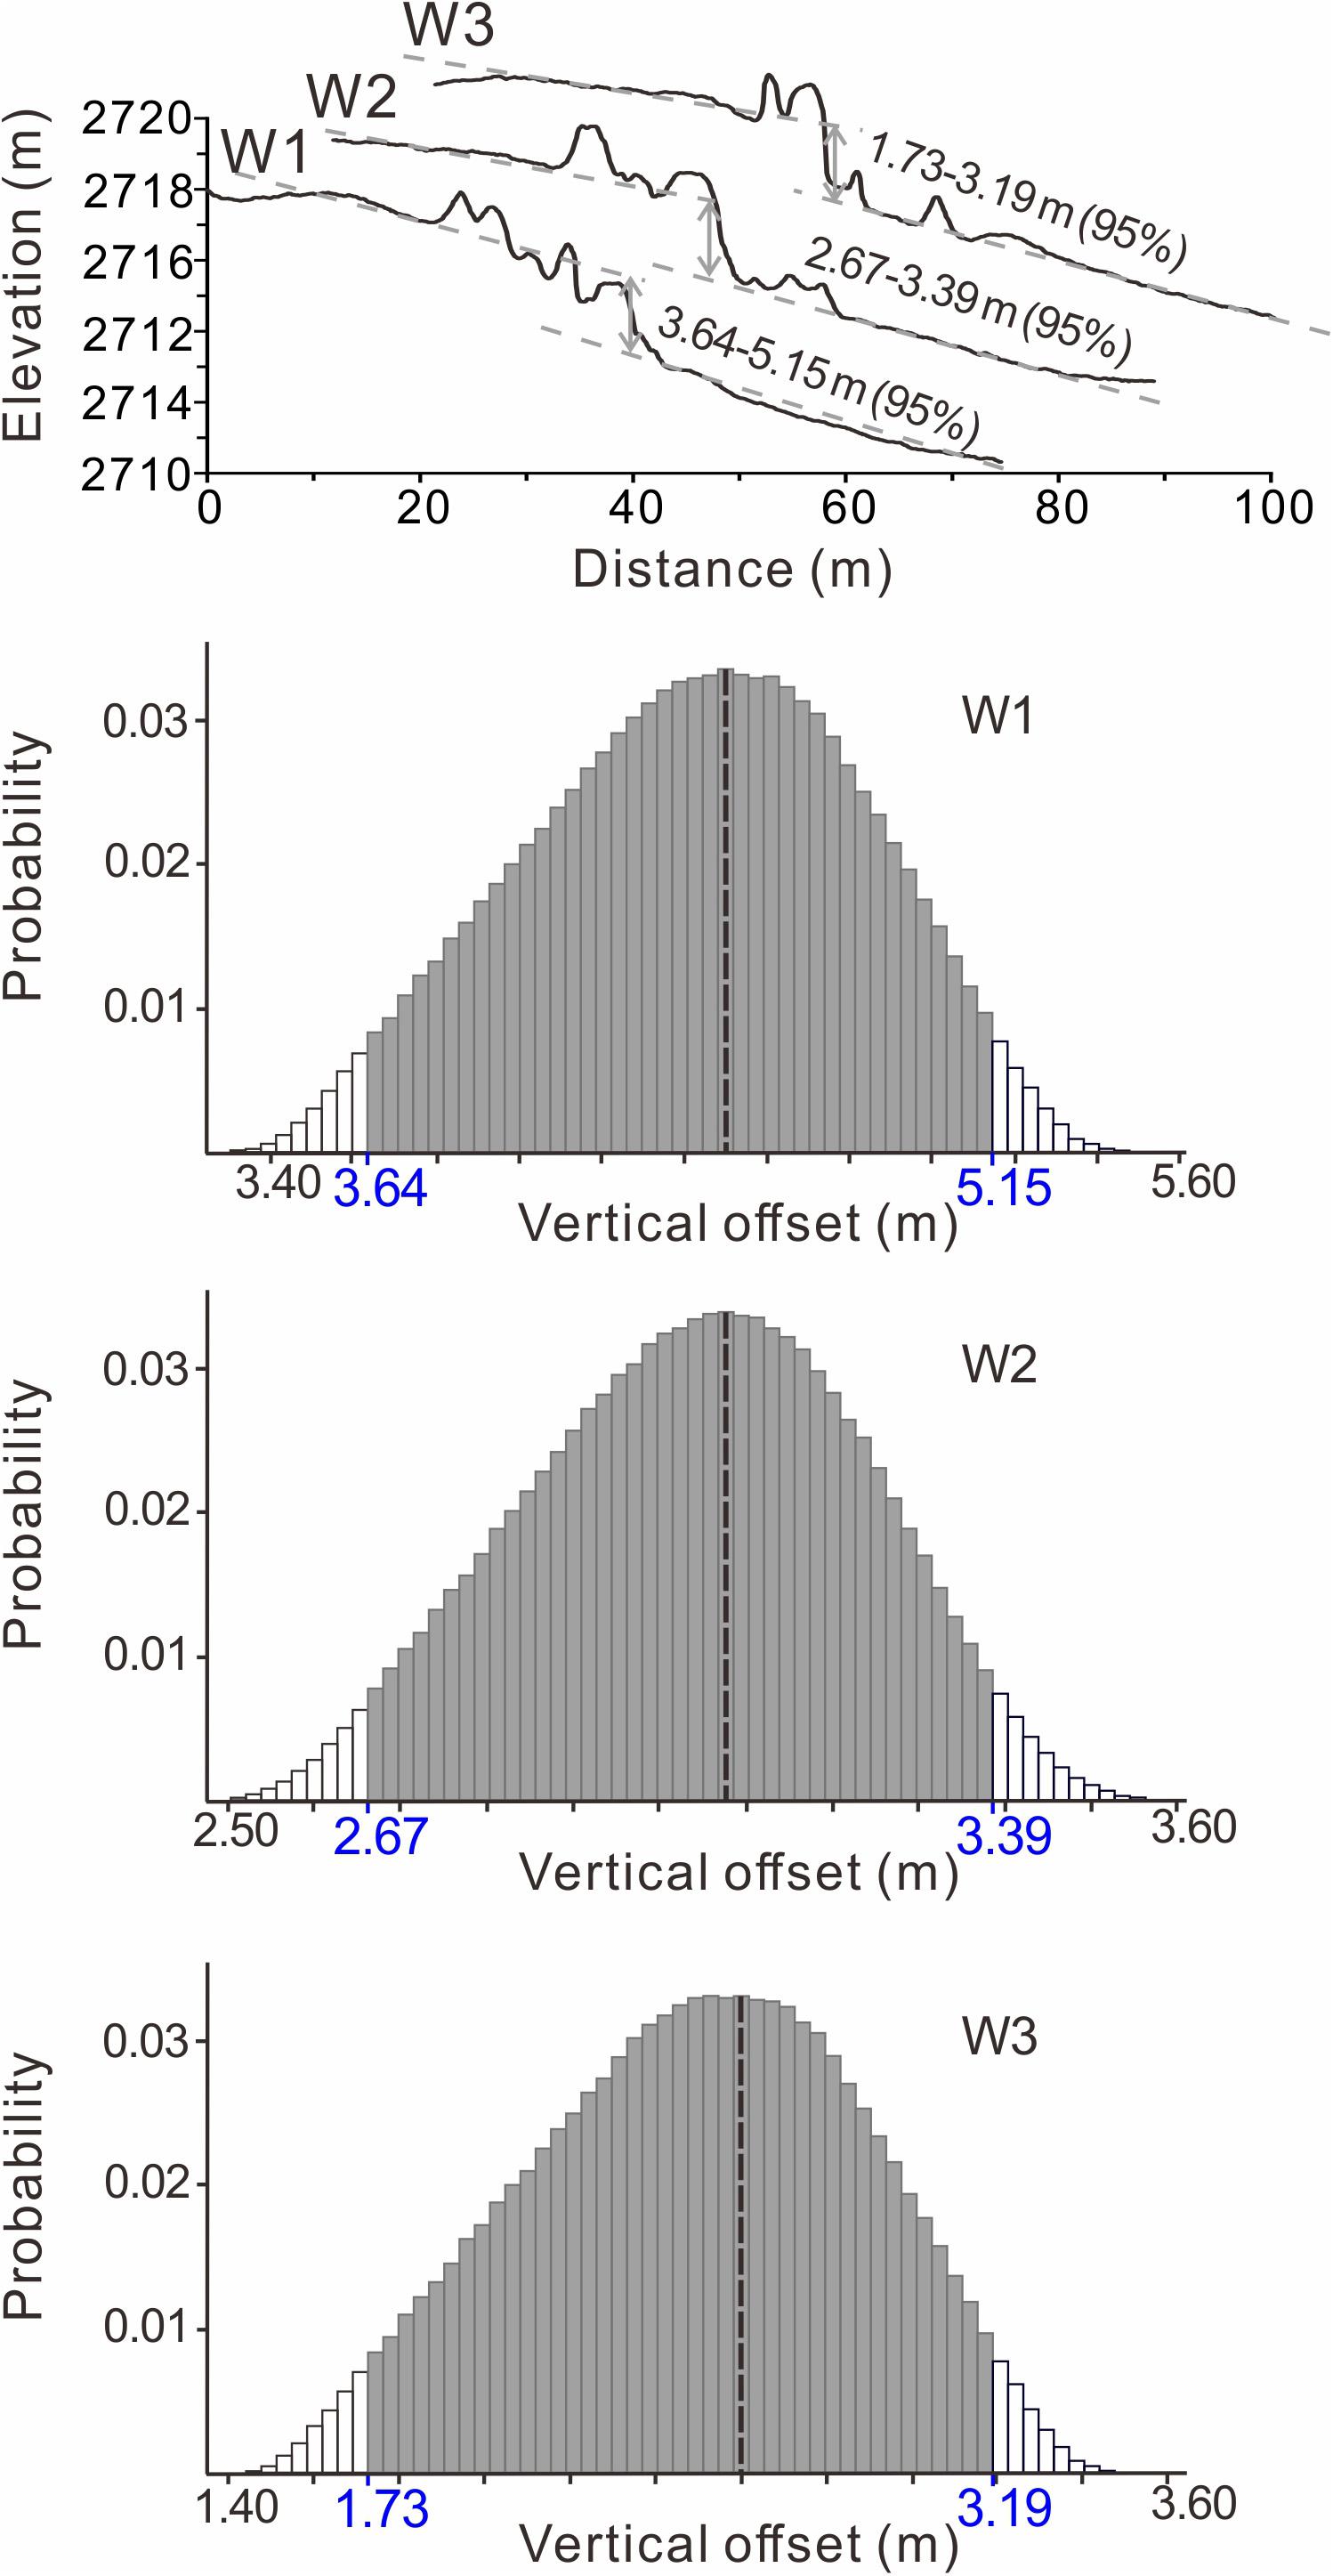
Figure 9. The height of the scarp obtained from three profiles of T10 on the west bank of the Yudai River. The probability distribution of the scarp height was obtained by Monte Carlo simulation, and the positions of profiles are shown in Figure 3D.
For T10 on the east bank, profiles with the same length extracted from different sites (E1/E2/E3) are different in the morphology but similar in the vertical offset (Figure 9). However, profiles with different lengths from the same site are different both in the morphology and the vertical offset (Figure 9). The morphology of the profile may further affect the fitting of the trendlines of the hanging wall and footwall. Exceptionally, the profiles in site E2 are significantly different from those in the other two sites, which may be related to local erosion (Figure 9). Without regard to E2, the vertical offsets of the profiles with different lengths are 1.97–3.00 m (50 m), 2.87–3.78 m (100 m), 4.30–5.41 m (200 m), 6.49–9.05 m (400 m), 8.37–11.74 m (600 m), 6.30–12.80 (800 m), and 2.78–9.82 (1000 m). Results show that with the increase of the length of the profiles at site E1 and E3, the calculated vertical displacement at the same site tends to increase. When the length of the profile is equal to or greater than 600 m, the height of the scarp remains steady, approaching the vertical displacement of the gravel layer on the west bank (10.63–11.67 m; Figure 7). However, in this case, the vertical offset derived from profiles with a length of 1000 m seems to be underestimated (Figure 9). This is because the 1000-m-long profiles go beyond T10 and almost reach the piedmont in the hanging wall, resulting in steeper trendlines of the hanging wall and smaller vertical offsets (Figures 3, 10).
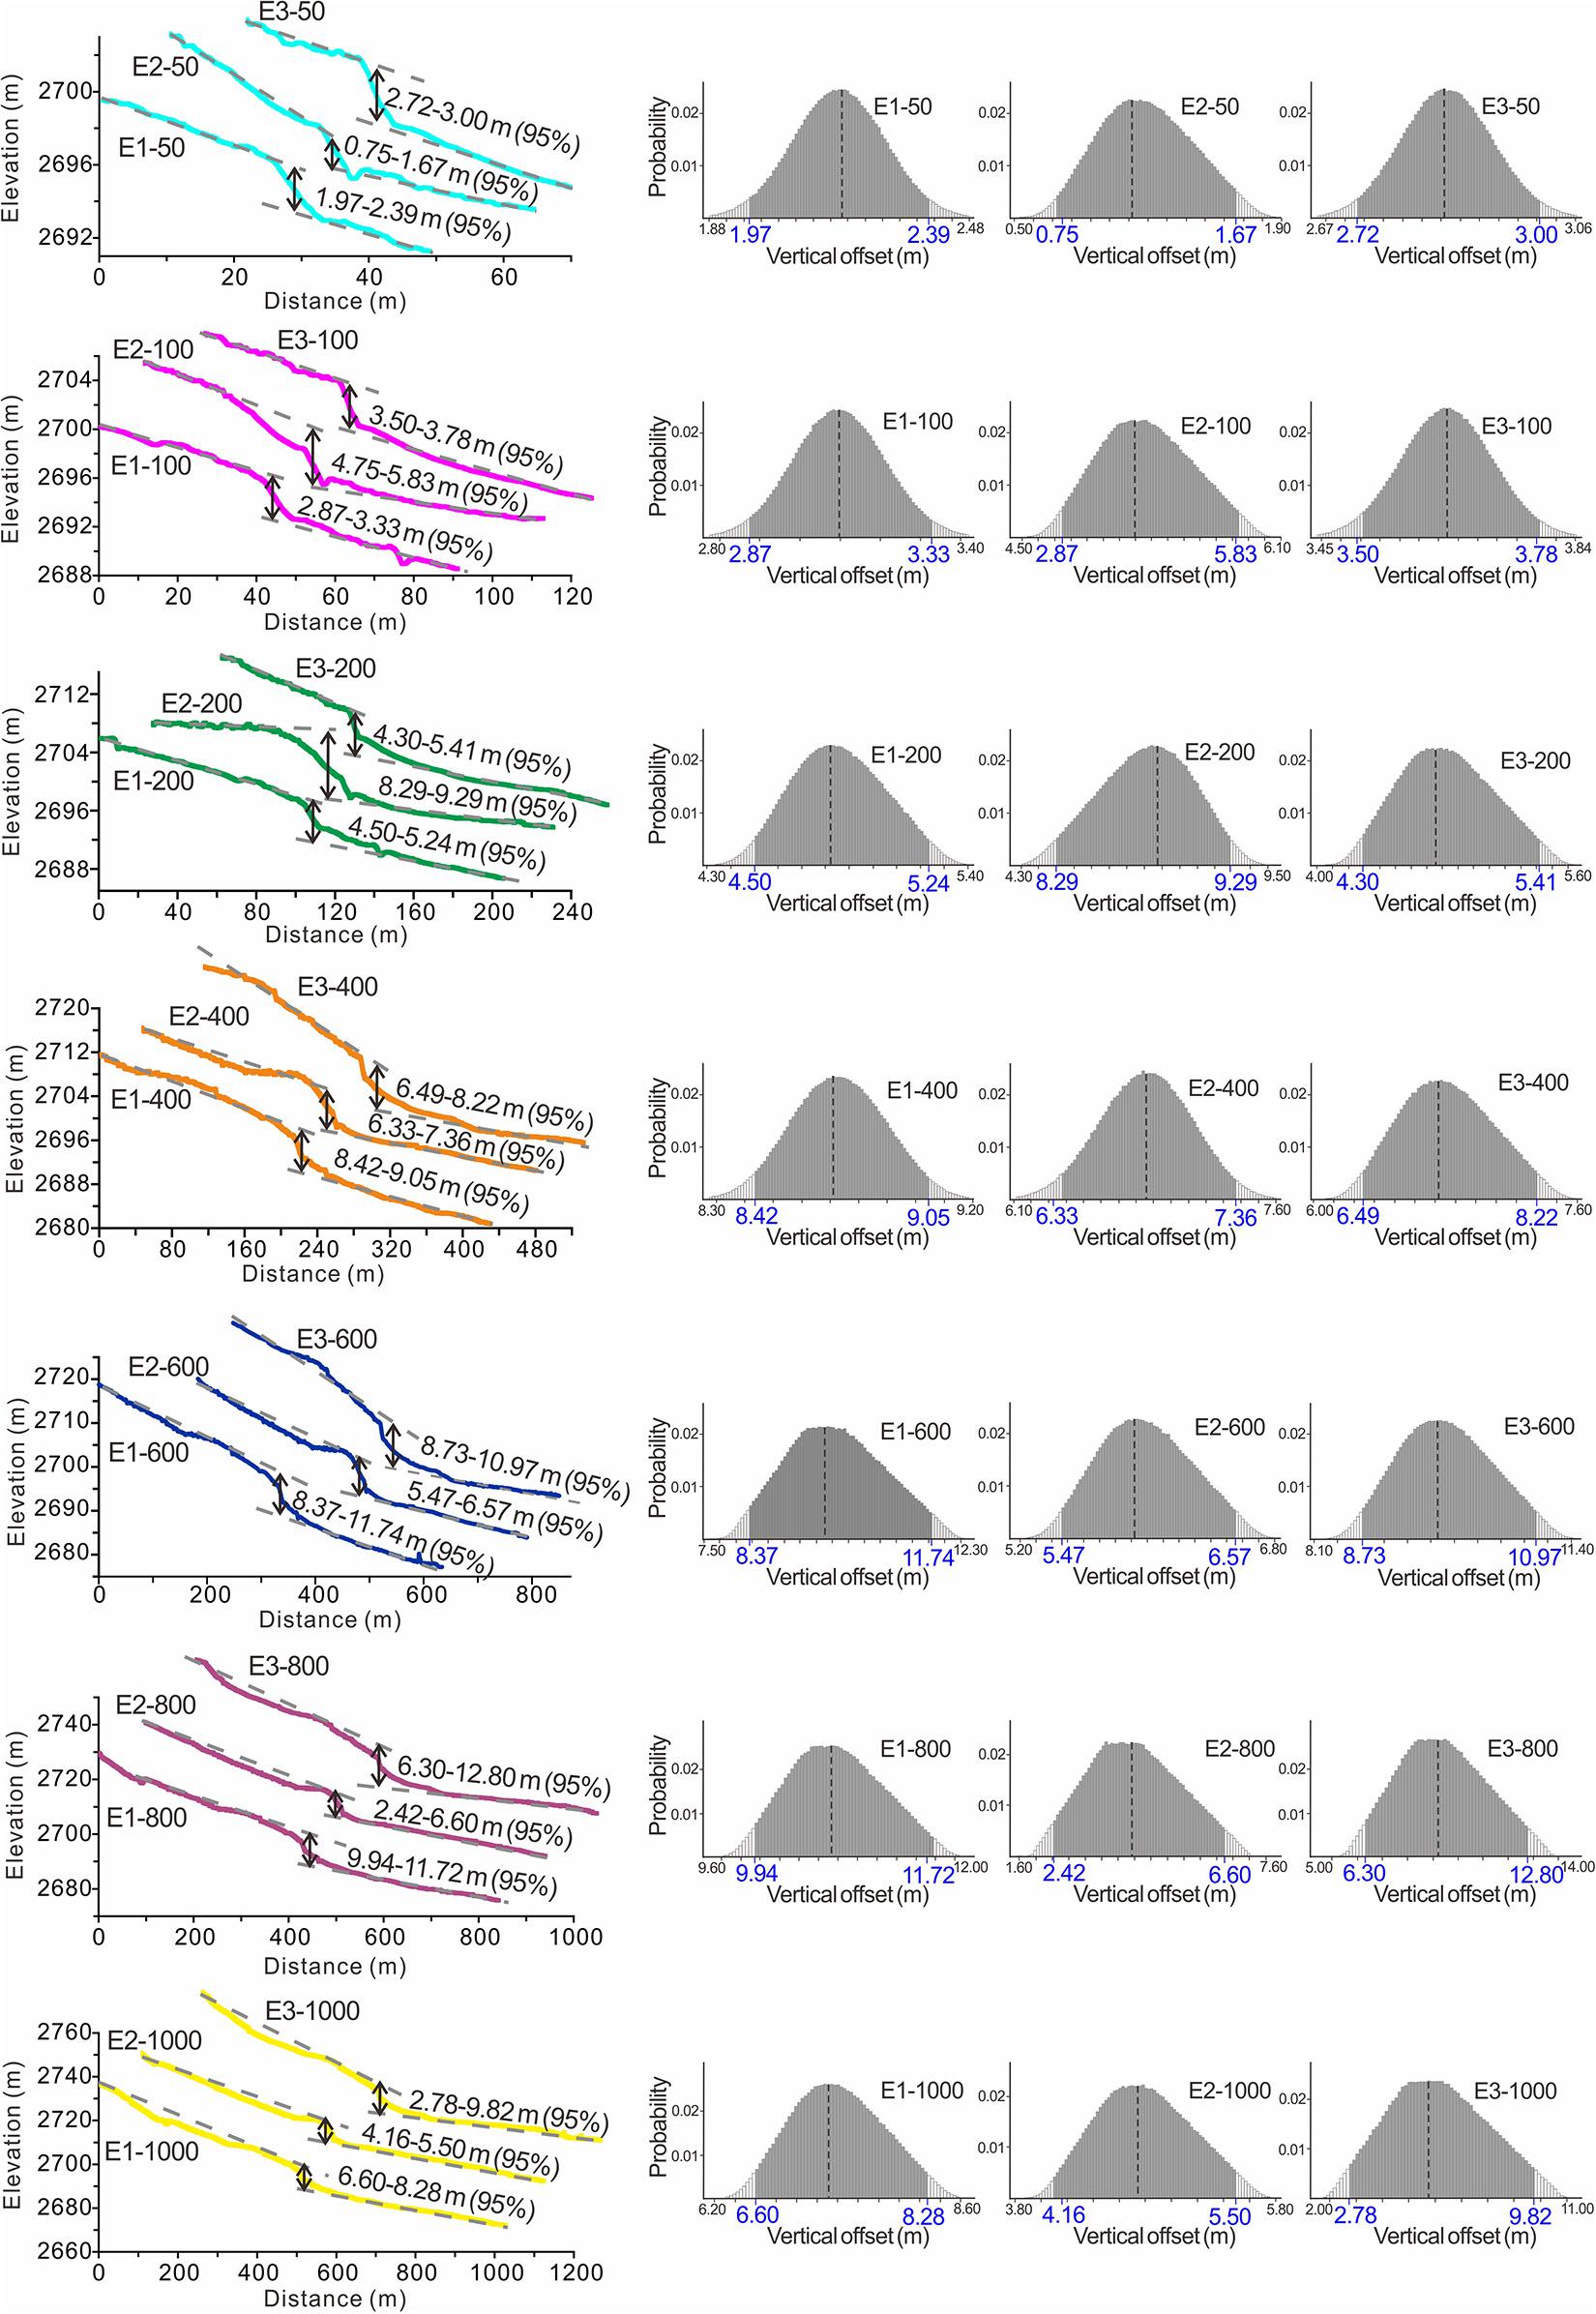
Figure 10. The height of the scarp obtained from three profiles of T10 on the east bank of the Yudai River. The probability distribution of the scarp height is obtained by Monte Carlo simulation, and the positions of profiles are shown in Figure 3D.
Discussion
Reasonable Rates of the MDF in the Yudai River Site
If all the vertical slip rates are accepted without regard to the reasonability of vertical offsets and ages, 14 and 100 results will be obtained since the abandonment of T7 and T10, respectively (Tables 3, 4). Even though we use the single most reasonable age according to the section “Determination of the Abandonment Ages of Terraces” and respectively determine the abandonment age of T7 and T10 to 16,140 ± 240 cal a BP (MLF66) and 42,260 ± 470 cal a BP (MLF38), the vertical slip rates calculated from different profiles of the same terrace still have apparent differences (Figure 11). The vertical slip rate (0.14–0.24 mm/a) obtained from the top of the T7 gravel layer is more reasonable than that from the surface scarp on T7 (Figure 9). The vertical slip rate (0.25–0.28 mm/a) obtained from the top of the T10 gravel layer can represent that of the fault since the terrace was abandoned, and it is similar to that (0.15–0.30 mm/a) from the long profile (E1/E3-600 and E1/E3-800) on the T10 surface (Figure 9). Combined with a dip angle of 42 ± 3° (Figure 6), it is considered that the shortening rates of the MDF are 0.24–0.36 mm/a and 0.15–0.29 mm/a since 42.3 ± 0.5 ka and 16.1 ± 0.2 ka, respectively. The vertical slip rate of the MDF in the Yudai River site seems to be smaller since ∼16 ka, compared with that since ∼42 ka. This is possibly because the activity of the MDF is weak in the west end of the fault (Nash, 2013), and a certain seismic event since ∼16 ka may not have been transmitted to the west end point of the fault to cause a surface rupture. Therefore, the omission of the seismic event has led to the small slip rate since ∼16 ka.
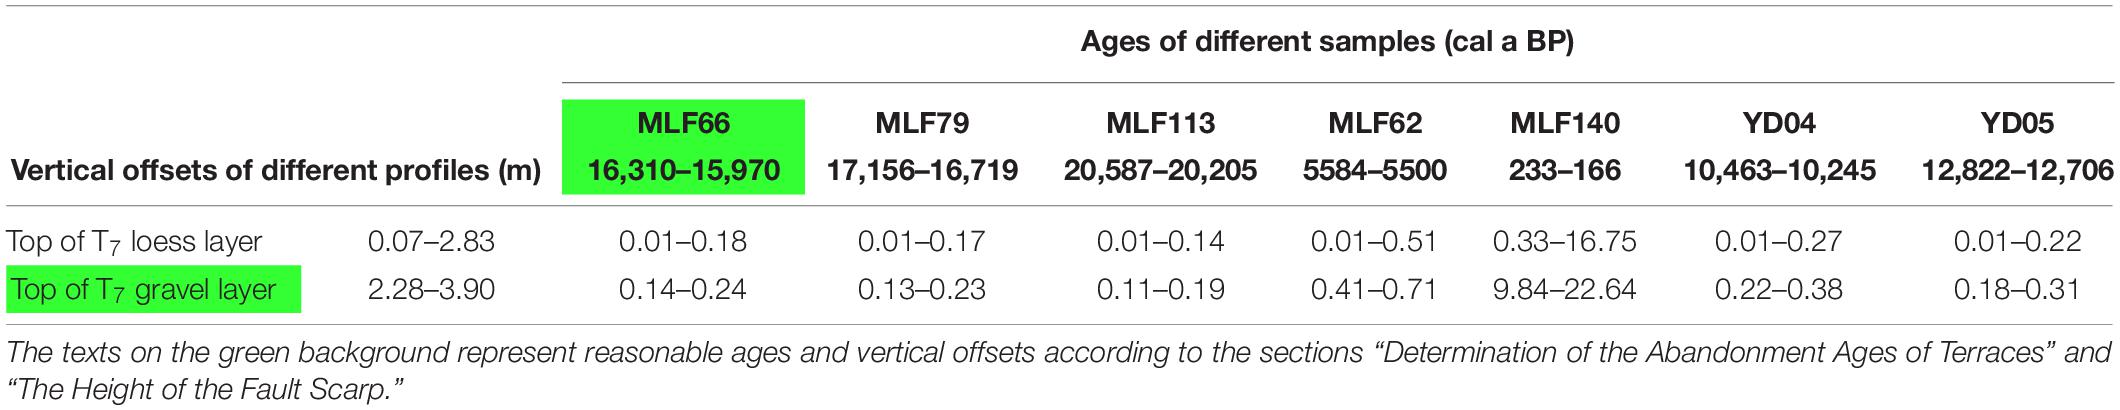
Table 3. All possible vertical slip rates of the MDF in the Yudai site since the abandonment of T7.
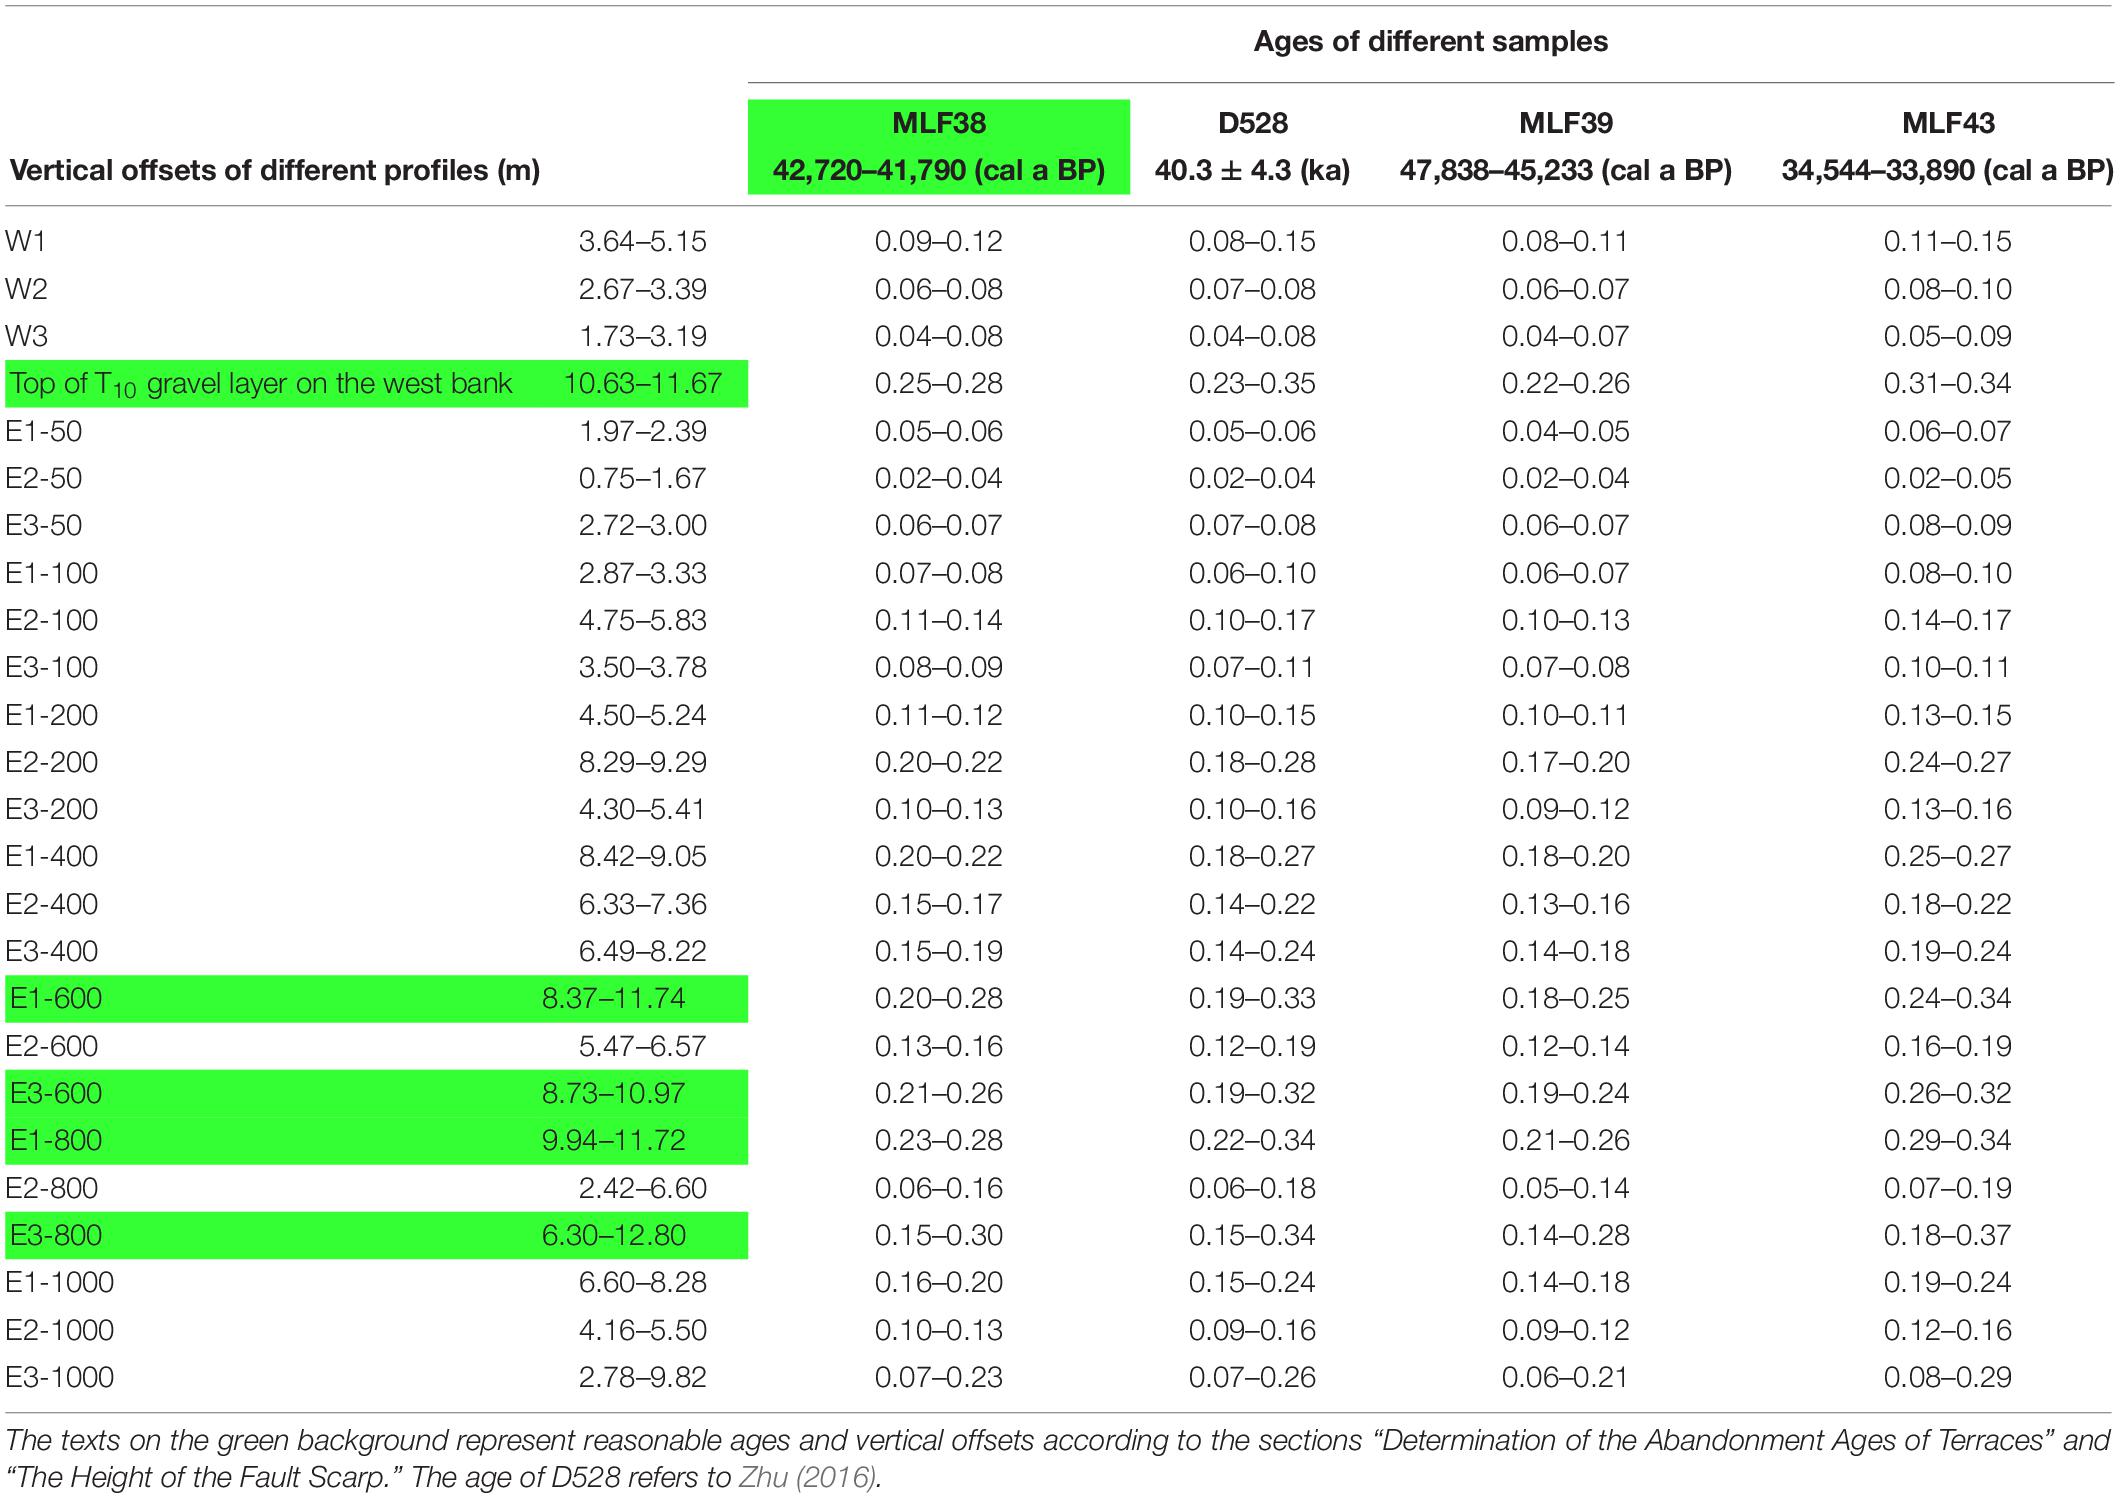
Table 4. All possible vertical slip rates of the MDF in the Yudai site since the abandonment of T10.
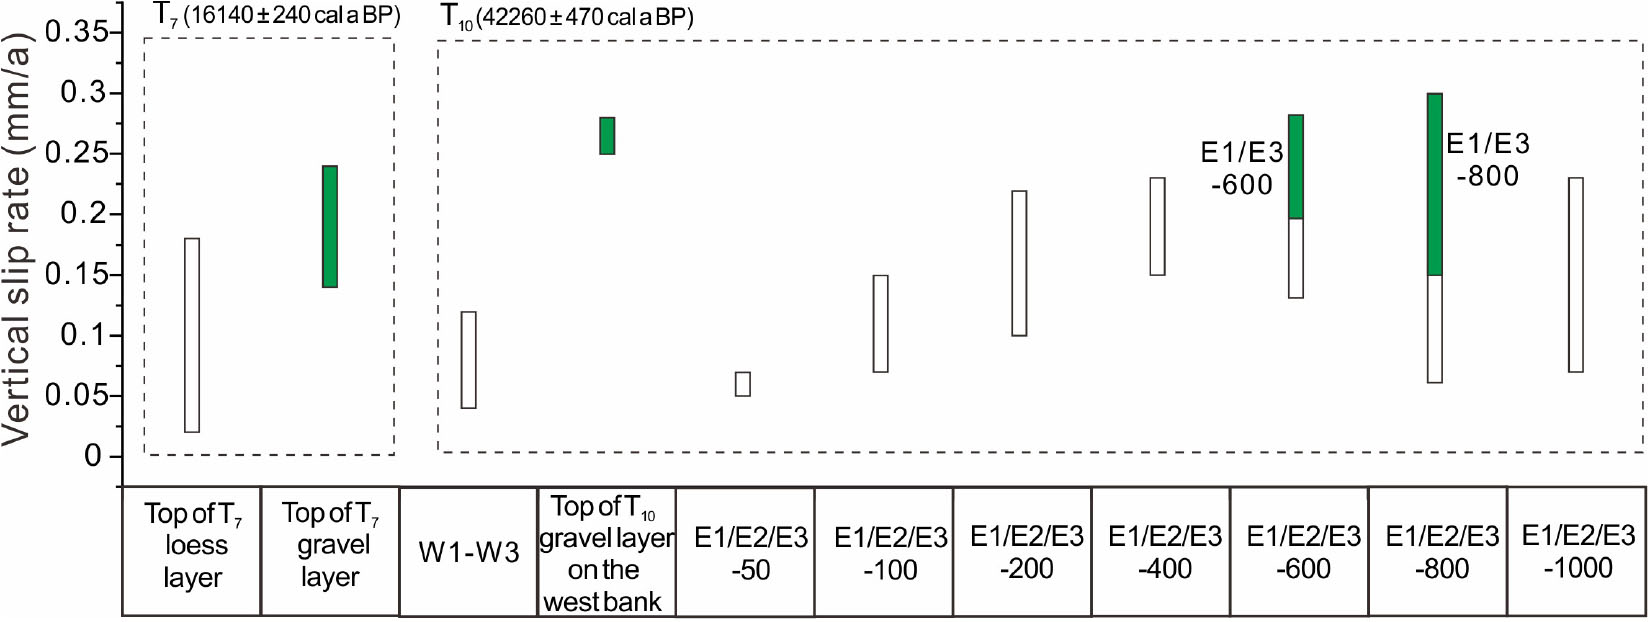
Figure 11. Vertical slip rates of the MDF derived from the correct ages and different measuring profiles. The green strips are reasonable rates.
In some cases, unreasonable displacements and ages can also generate numerically correct rates, but the results should not be adopted. The vertical slip rate of 0.14–0.24 mm/a since the abandonment of T7 is consistent with the vertical slip rate of 0.2 ± 0.1 mm/a derived from the same terrace by Lei et al. (2020). However, their vertical offset and age of the terrace are quite different from the ones we use in our study. The vertical offset of 2.2 ± 0.6 m in Lei et al. (2020) is based on the measurement of surface scarp height, thus it is less than the true vertical offset determined from the gravel layer (Figure 6B; 2.28–3.90 m). Sample YD04 was collected from the upper loess (Lei et al., 2020), but it is younger than the abandonment age of T7 as we have stated previously.
The difference between the wrong vertical slip rate and the right one can even reach an order of magnitude (Tables 3, 4). Avoiding mistakes in advance can save a lot of time and money. However, if the wrong results cannot be eliminated, the characteristics of the fault would be greatly misunderstood. Therefore, general methods are needed to accurately determine the vertical offset of a thrust fault and the abandonment ages of the terraces according to the examples in this paper and the previous studies.
The Accurate Vertical Displacement Constraint
To obtain accurate vertical displacement, it is necessary to select sites carefully and extract several parallel profiles across the same scarp (Tapponnier et al., 1990; Avouac, 1993; Palumbo et al., 2009; Xiong et al., 2017). The suitable site should be in good geomorphic condition, such as the clear vertical scarp, excellent geomorphic preservation of landform, exposure of landform unobscured by vegetation, and consistent landform trend on either side of the fault (Haddon et al., 2016). It should be noted that the loess cover contributes to the formation of such good geomorphic conditions. Therefore, the influence of the surface processes still needs to be taken seriously for the measurement of the thrust fault scarp, especially in areas with heavy loess cover.
Surface processes will degrade the fault scarp, which leads to the underestimation of the vertical displacement. In this study, the fluvial gravel layer of the terrace can completely preserve the original displacement of the fault because the gravels are usually protected by loess and other overlying deposits. For example, the T5 surface of the Hongshuiba River preserves only a 0.5-m-height scarp of the Fodongmiao–Hongyazi fault, while the gravel layer in the trench shows a vertical displacement of 1 m (Liu et al., 2014). The gravel layer in the southeast wall of the Heihekou trench is faulted by the East Yumu Shan Fault with a vertical displacement of ∼3.5 m, while the measured surface scarp height is only ∼1.9 m (Ren et al., 2019). The gravel layer in the southwest wall shows a displacement of ∼3.7 m, but the surface scarp is only ∼2.5 m high (Ren et al., 2019). Therefore, if conditions permit, it is more reliable to take the offset recorded by the fluvial gravels in the trench or on the outcrop as the vertical fault displacement.
In most cases, the fluvial gravel layer is buried, and the excavation of a trench costs a lot of time and money while the trench can only reflect the offset in the adjacent region (Burbank and Anderson, 2011). If the gravels of the terrace are not well exposed or the vertical offsets are largely varied along the fault, measuring the surface scarps to estimate the vertical fault displacement is a more efficient way. Some methods or models can minimize the estimated errors, and make the surface scarp height as close as possible to the real vertical displacement. The topographic profiles can be extracted directly in the area where the thicknesses of loess in the hanging wall and footwall are close (Xiong et al., 2017), and where the thickness of the footwall deposition is relatively thin (Palumbo et al., 2009). After comparing the differences in the slope gradient of the footwall and the present riverbed, the site with a small modification in the footwall can be chosen to measure the vertical offset (Palumbo et al., 2009; Yang et al., 2017). The height of the surface scarp can be revised by measuring the thickness of footwall aggradation (Priyanka et al., 2017) or estimating the thickness of the footwall aggradation according to the deposition rate and the age difference between the hanging wall and the footwall (Yang et al., 2018).
Furthermore, the angularities at the crest of the scarp will be rounded off and the curvature would increase, while the slope angle of the scarp face would decrease and the scarp will widen toward the two sides of the fault (Figure 12A; Wallace, 1977; Bucknam and Anderson, 1979; Stewart and Hancock, 1988). Surfaces of the hanging wall and footwall are significantly affected by the surface processes near the fault scarp, but the parts far away from the scarp are less affected. Therefore, it is necessary to extract longer profiles to obtain the true extension trend of the surface (Avouac, 1993; Wei et al., 2020). Shorter profiles will cause significantly underestimated results (Figure 12B; Yang et al., 2017). In our results, only short profiles with a length of about 80 m were extracted due to the limited distribution of T10 on the west bank, thus the measured result (1.73–5.15 m) is far less than the true vertical offset (10.63–11.67 m) (Figures 3D, 7, 8). The wide distribution of T10 with a steady surface on the east bank enables us to extract long profiles with sufficient length (≥600 m), which can produce a reliable offset (Figures 3D, 10). It seems that the height of the scarp is random to some extent when the profile is relatively short because the profile shape is not stable. As the length of the profile increases, the profile shape is gradually stable, and the scarp height is gradually close to the real vertical offset (Figures 3D, 10). Thus, on a broad geomorphologic surface, it is more likely to obtain accurate vertical offset if the profile is long enough on both sides of the fault. However, it is important to note that the maximum acceptable profile length should not exceed the terrace range.
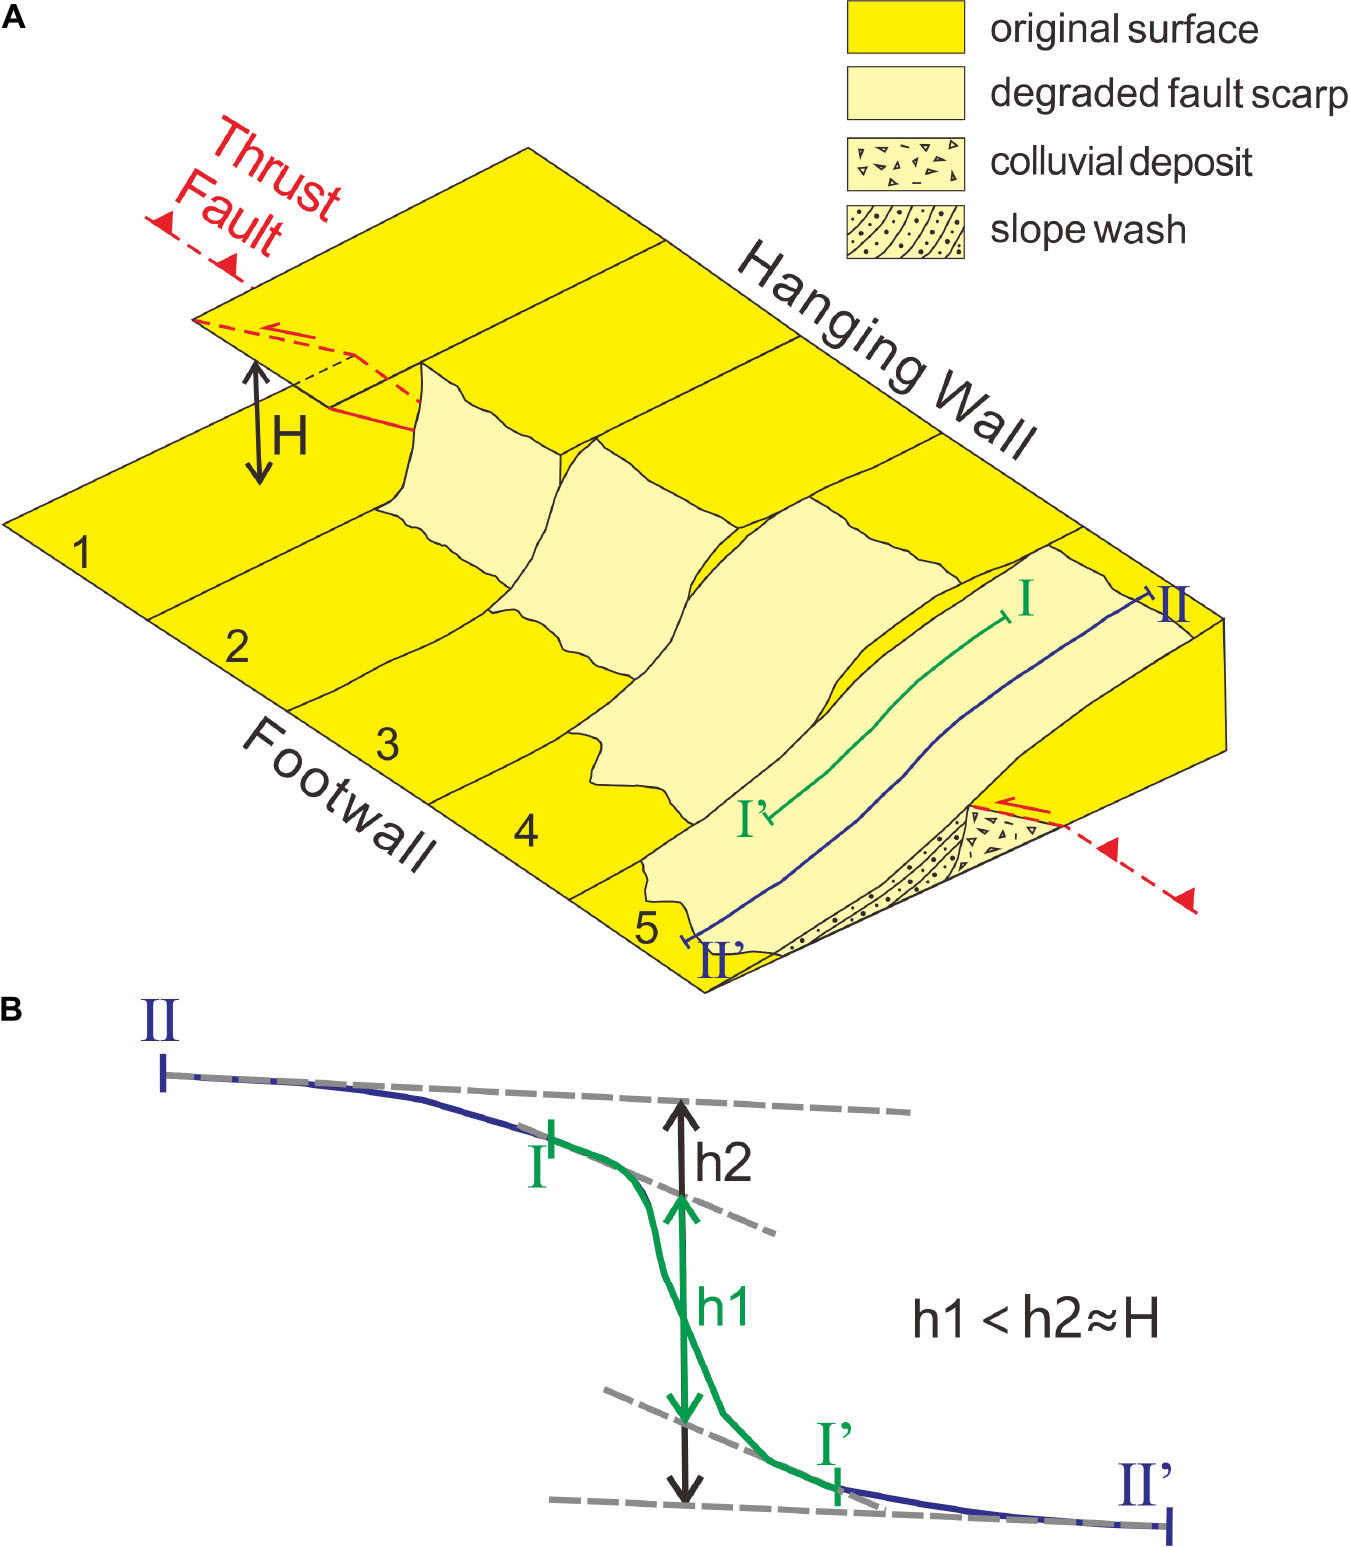
Figure 12. A model for the evolution and height measurement of the reverse fault scarp. (A) The model of scarp morphology with time (Stewart and Hancock, 1988). 1 to 5 represent the scarp morphologies in different periods. I–I′ and II–II′ are the short and long profiles showed in Figure 12B across the fault, respectively. H is the vertical displacement of the fault scarp. (B) Measurement of the scarp heights from two profiles with different lengths.
The Chronologic Establishment of the Terrace Sequence
A lot of vegetation in the humid eastern Qilian Shan potentially provides enough charcoal for 14C dating (Geng et al., 2017; Cai et al., 2020), but the sampling site should be carefully chosen considering the effect of geomorphic reconstruction. The age of the charcoal from the fluvial sand layer overlying the gravel layer is most close to the abandonment age of the terrace (Zhang et al., 2008; Xu et al., 2010; Xiong et al., 2017; Zhong et al., 2020). The age of the samples which were from the bottom of the loess overlying the fluvial deposits is usually younger (MLF 43, YD05 in Table 1 and Figures 5K,P) due to the age gap between the terrace abandonment and the loess deposition. After the formation of the terrace, gullies often develop on its surface with exposure profiles on both sides for easy sampling. Because the structure of the profiles may suffer erosion and redeposition of the gully, ages of the charcoals from such positions are usually younger than the abandonment age of the terrace (MLF43 in Table 1 and Figures 2, 5P). The region adjacent to the fault scarp is most likely to be affected by surface processes, and gullies are easy to develop along the scarp. Therefore, the charcoal near the scarp may deposit during the subsequent surface processes, and its age cannot represent the abandonment age of the terrace (MLF62 in Table 1 and Figures 3B, 5H, 6A). Fluvial deposition of the terrace in the hanging wall is easy to be eroded (Wallace, 1980; Stewart and Hancock, 1988; Nash, 2013) and then the hanging wall may be covered by a mixture of broken gravels and clay due to the surface processes. Charcoal in the mixed sediments may be too young to indicate terrace age (MLF140 in Table 1 and Figures 3B, 5J, 6A). The footwall far from the fault with thick overlying loess and well-preserved fluvial deposition is the most ideal for charcoal collection to determine the abandonment age of the terrace (MLF66 in Table 1 and Figures 3B, 5I, 6A).
Charcoal samples can be collected at different heights in the fluvial and aeolian layers of a terrace because the consistency of chronological and stratigraphic sequences could indicate the robust abandonment age of the terrace (Figures 5C,I,K,L). In addition, the consistency of grades and ages of terraces is also an effective means to constrain the abandonment age of terraces (Table 1).
Spatial Difference of the Rates of the MDF
The shortening rate (0.24–0.36 mm/a) since the late Quaternary in our study is less than that in the middle or eastern segment of the fault (Figure 13; Xiong et al., 2017; Lei et al., 2020; Zhong et al., 2020), which may be because the outlet of the Yudai River is located in the west end of the fault. The activity of the whole fault represented by the results in a single site may ignore the variation of slip rates along the strike, resulting in the omission of seismic events and the misjudgment of seismic risks. In addition, the study area is the most densely populated in the Qilian Shan–Hexi Corridor. Therefore, the activity and seismic risk of the large fault should be judged comprehensively after a multi-site study along the fault. However, in the east segment of the MDF, only the Xie River site has been studied (Xiong et al., 2017). Compared with the west segment of the MDF, the spatial-varied rates in the east segment require further research in the future.
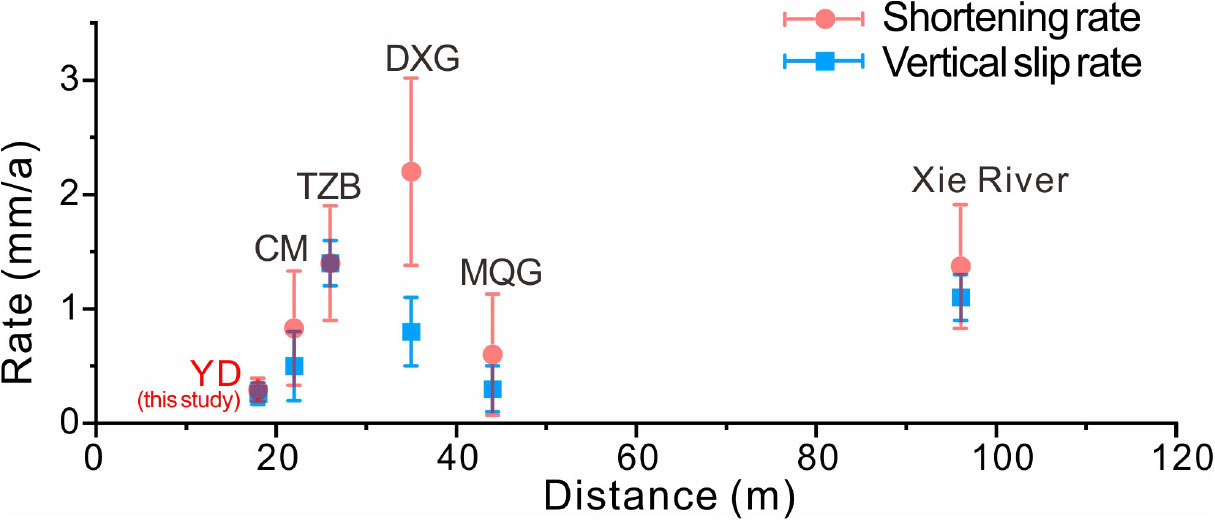
Figure 13. Rates of the MDF along its strike. Positions of study sites are shown in Figure 1B. The slip rate in the Yudai River site is derived from this study. Vertical slip rates in the Chaomian site (CM), Daxiang Gully (DXG), and Mingquan Gully (MQG) refer to Lei et al. (2020), and shortening rates in these sites are calculated combined with the dip angle in each site. Slip rates in the Tongziba River and Xie River site refer to Xiong et al. (2017) and Zhong et al. (2020), respectively.
According to the 10-year scale GPS data, the shortening rate between the Qaidam basin and the Gobi Alashan across the east Qilian Shan is 7.6 ± 1.5 mm/a (Zhong et al., 2020). Using the shortening rate of the MDF in the Xie River site (Figure 13) to represent that of the North Qilian Frontal Thrust System, we find that the system only accounts for 9–15% deformation across the Qilian Shan and its foreland basin. The other deformation should be absorbed by the orogenic interior and the faults or folds in the foreland basin (e.g., the Yonggu Anticline; Zhong et al., 2020). The deformation distribution in the Qilian Shan is very different from that in the Himalaya, where most of the shortening rate (20 ± 3 mm/a) seems to be absorbed mainly by the Main Frontal Thrust fault in its south margin (Lavé and Avouac, 2000). The difference may be due to the different tectonic positions of the two thrust systems. The Main Frontal Thrust fault is located at the India-Eurasian plate collision boundary, thus the high strain leads to the high shortening rate of the Main Frontal Thrust fault. The difference may be also related to the fact that the Main Frontal Thrust fault of the Himalaya (Lavé and Avouac, 2000) and the North Qilian Frontal Thrust System (Zuza et al., 2016) have different crustal structures, for example, the depth of the décollement.
Conclusion
Considering the effect of geomorphologic processes, we redetermine the vertical slip rate in the west end of the MDF, a part of the North Qilian Thrust System. The SfM photogrammetry and precise measurement with the RTK GPS were used to constrain the height of the surface scarp and the vertical displacement of the fluvial gravel layer exposed on the Yudai River terrace. AMS 14C dating was used to determine the abandonment ages of the terraces. Uncertainties were estimated by Monte Carlo simulation. We consider that the age of the dating samples from the fluvial sand layer underlying the thickest loess in the footwall can best represent the abandonment age of the terrace as the sample has been well protected. And it is more reasonable to take the gravel layer displacement as the fault offset because the layer is usually protected by overlying sediments. Using the most reliable ages and vertical offsets, the vertical slip rate of the MDF was estimated to be 0.25–0.28 mm/a since 42.3 ± 0.5 ka (T10) and 0.14–0.24 mm/a since 16.1 ± 0.2 ka (T7). The difference between the wrong vertical slip rate and the right one can even reach an order of magnitude. We also suggest that if the built measuring profile is long enough, the uncertainties in the height of a surface scarp would be better constrained and the result can also be taken as the vertical fault displacement. Furthermore, the consistency of chronology with stratigraphic sequence or with terrace sequence are also key to constraining the abandonment ages of terraces. The study site is less active compared with the middle and east segments of the MDF probably due to its end position.
Data Availability Statement
The raw data supporting the conclusions of this article will be made available by the authors, without undue reservation.
Ethics Statement
Written informed consent was obtained from the individual(s) for the publication of any potentially identifiable images or data included in this article.
Author Contributions
QL is responsible for field work, writing, drawing the figures, and editing. HZ and YL are responsible for writing, editing and helpful comments. FH, XZ, JL, and WX are responsible for field work and drawing the figures. JX is responsible for research plan, writing, editing, and field work. PZ is responsible for constructive comments. All authors contributed to the article and approved the submitted version.
Funding
This research was jointly financed by the Second Tibetan Plateau Scientific Expedition and Research Program (STEP, Grant No. 2019QZKK0704), the Fundamental Research Funds in the Institute of Geology, China Earthquake Administration (Grant No. IGCEA1915), the Natural Science Foundation of China (Grant No. 41702219), and the Foundation of the State Key Laboratory of Earthquake Dynamics (Grant No. LED2017A04).
Conflict of Interest
The authors declare that the research was conducted in the absence of any commercial or financial relationships that could be construed as a potential conflict of interest.
Acknowledgments
Yuezhi Zhong, Quanxing Luo, and Ailun Guo are appreciated for helpful comments on the article. Dr. Jinrui Liu is appreciated for his guidance in Monte Carlo simulations. Dr. Zifa Ma is appreciated for his help in the fieldwork. Special thanks are sent to three reviewers Dr. R. Jayangonda Perumal, Dr. Xingwang Liu, and Dr. Andrew V. Zuza, and two editors Dr. Fabien Graveleau and Dr. Gang Rao for their helpful comments.
References
Ai, S., Zhang, B., Fan, C., and Wang, Y. (2017). Surface tracks and slip rate of the fault along the southern margin of the Wuwei basin in the late quaternary. Seismol. Geol. 39, 408–422.
Allen, M. B., Walters, R. J., Song, S., Saville, C., De Paola, N., Ford, J., et al. (2017). Partitioning of oblique convergence coupled to the fault locking behavior of fold-and-thrust belts: evidence from the Qilian Shan, northeastern Tibetan Plateau. Tectonics 36, 1679–1698. doi: 10.1002/2017tc004476
Avouac, J. P. (1993). Analysis of scarp profiles: evaluation of errors in morphologic dating. J. Geophys. Res. Solid Earth 98, 6745–6754. doi: 10.1029/92jb01962
Avouac, J. P., and Peltzer, G. (1993). Active tectonics in southern Xinjiang, China: analysis of terrace riser and normal fault scarp degradation along the Hotan-Qira fault system. J. Geophys. Res. Solid Earth 98, 21773–21807. doi: 10.1029/93jb02172
Blakely, R. J., Sherrod, B. L., Hughes, J. F., Anderson, M. L., Wells, R. E., and Weaver, C. S. (2009). Saddle Mountain fault deformation zone, Olympic Peninsula, Washington: western boundary of the Seattle uplift. Geosphere 5, 105–125. doi: 10.1130/ges00196.1
Bucknam, R. C., and Anderson, R. E. (1979). Estimation of fault-scarp ages from a scarp-height–slope-angle relationship. Geology 7, 11–14. doi: 10.1130/0091-7613(1979)7<11:eofafa>2.0.co;2
Cai, S., Geng, H. P., Pan, B. T., Hong, Y., and Chen, L. P. (2020). Topographic controls on the annual runoff coefficient and implications for landscape evolution across semiarid Qilian Mountains, NE Tibetan Plateau. J. Mountain Sci. 17, 464–479. doi: 10.1007/s11629-019-5584-7
Cao, X., Hu, X., Pan, B., Zhang, J., Wang, W., Mao, J., et al. (2019). A fluvial record of fault-propagation folding along the northern Qilian Shan front, NE Tibetan Plateau. Tectonophysics 755, 35–46. doi: 10.1016/j.tecto.2019.02.009
Champagnac, J. D., Yuan, D. Y., Ge, W. P., Molnar, P., and Zheng, W. J. (2010). Slip rate at the north-eastern front of the Qilian Shan, China. Terra Nova 22, 180–187. doi: 10.1111/j.1365-3121.2010.00932.x
Cunningham, D., Grebby, S., Tansey, K., Gosar, A., and Kastelic, V. (2006). Application of airborne LiDAR to mapping seismogenic faults in forested mountainous terrain, southeastern Alps, Slovenia. Geophys. Res. Lett. 33, L20308. doi: 10.1029/2006GL027014
De Vries, H. L., and Barendsen, G. W. (1954). Measurements of age by the carbon-14 technique. Nature 174, 1138–1141. doi: 10.1038/1741138a0
Fraser, C. S., and Cronk, S. (2009). A hybrid measurement approach for close-range photogrammetry. ISPRS J. Photogramm. Remote Sens. 64, 328–333. doi: 10.1016/j.isprsjprs.2008.09.009
Geng, H., Pan, B., Huang, B., Cao, B., and Gao, H. (2017). The spatial distribution of precipitation and topography in the Qilian Shan Mountains, northeastern Tibetan Plateau. Geomorphology 297, 43–54. doi: 10.1016/j.geomorph.2017.08.050
Haddon, E. K., Amos, C. B., Zielke, O., Jayko, A. S., and Bürgmann, R. (2016). Surface slip during large owens valley earthquakes. G3 17, 2239–2269. doi: 10.1002/2015gc006033
Harwin, S., and Lucieer, A. (2012). Assessing the accuracy of georeferenced point clouds produced via multi-view stereopsis from unmanned aerial vehicle (UAV) imagery. Remote Sens. 4, 1573–1599. doi: 10.3390/rs4061573
Hetzel, R. (2013). Active faulting, mountain growth, and erosion at the margins of the Tibetan Plateau constrained by in situ-produced cosmogenic nuclides. Tectonophysics 582, 1–24. doi: 10.1016/j.tecto.2012.10.027
Hetzel, R., Hampel, A., Gebbeken, P., Xu, Q., and Gold, R. D. (2019). A constant slip rate for the western Qilian Shan frontal thrust during the last 200 ka consistent with GPS-derived and geological shortening rates. Earth Planet. Sci. Lett. 509, 100–113. doi: 10.1016/j.epsl.2018.12.032
Hetzel, R., Niedermann, S., Tao, M., Kubik, P. W., and Strecker, M. R. (2006). Climatic versus tectonic control on river incision at the margin of NE Tibet: 10Be exposure dating of river terraces at the mountain front of the Qilian Shan. J. Geophys. Res. Earth Surface 111:F03012. doi: 10.1029/2005JF000352
Hetzel, R., Niedermann, S., Tao, M., Kubik, P. W., Ivy-Ochs, S., Gao, B., et al. (2002). Low slip rates and long-term preservation of geomorphic features in Central Asia. Nature 417, 428–432. doi: 10.1038/417428a
Hetzel, R., Tao, M., Stokes, S., Niedermann, S., Ivy-Ochs, S., Gao, B., et al. (2004). Late Pleistocene/Holocene slip rate of the Zhangye thrust (Qilian Shan, China) and implications for the active growth of the northeastern Tibetan Plateau. Tectonics 23:TC6006. doi: 10.1029/2004TC001653.
Institute of Geology and Lanzhou Institute of Seismology [IGLS] (1993). The Qilian Shan-Hexi Corridor Active Fault System. Beijing: Seismological Press, 76–115.
Jayangondaperumal, R., Mugnier, J. L., and Dubey, A. K. (2013). Earthquake slip estimation from the scarp geometry of himalayan frontal thrust, western himalaya: implications for seismic hazard assessment. Int. J. Earth Sci. 102, 1937–1955. doi: 10.1007/s00531-013-0888-2
Küster, Y., Hetzel, R., Krbetschek, M., and Tao, M. (2006). Holocene loess sedimentation along the Qilian Shan (China): significance for understanding the processes and timing of loess deposition. Quat. Sci. Rev. 25, 114–125. doi: 10.1016/j.quascirev.2005.03.003
Lavé, J., and Avouac, J. P. (2000). Active folding of fluvial terraces across the siwaliks hills, himalayas of central Nepal. J. Geophys. Res. Solid Earth 105, 5735–5770. doi: 10.1029/1999jb900292
Lei, J., Li, Y., Oskin, M. E., Wang, Y., Xiong, J., Xin, W., et al. (2020). Segmented thrust faulting: example from the northeastern margin of the Tibetan Plateau. J. Geophys. Res. Solid Earth 125:e2019JB018634.
Liu, X. W., Yuan, D. Y., and Su, Q. (2017). Late pleistocene slip rate of the northern qilian shan frontal thrust, western Hexi Corridor, China. Terra Nova 29, 238–244. doi: 10.1111/ter.12270
Liu, X., Yuan, D., and He, W. (2014). Preliminary study of palaeo-earthquakes on the fodongmiaohongyazi fault in the north margin of qilian mountain. Technol. Earthq. Disaster Prevention 9, 411–419.
Liu, X., Yuan, D., Zheng, W., Shao, Y., Liu, B., and Gao, X. (2019). Holocene slip rate of the frontal thrust in the western Qilian Shan, NE Tibetan Plateau. Geophys. J. Intl. 219, 853–865. doi: 10.1093/gji/ggz325
Lu, H., and Li, Y. (2020). Development of tectonic geomorphology study promoted by new methods in China: a viewpoint from reviewing the Tian Shan researches. Adv. Earth Sci. 35, 594–606. (in Chinese with English abstract). doi: 10.11867/j.issn.1001-8166.2020.052
Lu, H., Cheng, L., Wang, Z., Zhang, T., Lü, Y., Zhao, J., et al. (2018). Latest Quaternary rapid river incision across an inactive fold in the northern Chinese Tian Shan foreland. Quat. Sci. Rev. 179, 167–181. doi: 10.1016/j.quascirev.2017.10.017
Matthews, N. A. (2008). Aerial and Close-Range Photogrammetric Technology: Providing Resource Documentation, Interpretation, and Preservation. Colorado: US Department of the Interior, Bureau of Land Management, National Operations Center.
McPhillips, D., and Scharer, K. M. (2018). Quantifying uncertainty in cumulative surface slip along the Cucamonga Fault, a crustal thrust fault in southern California. J. Geophys. Res. Solid Earth 123, 9063–9083. doi: 10.1029/2018jb016301
Nash, D. (2013). “Tectonic geomorphology of normal fault scarps,” in Treatise on Geomorphology, eds J. Shroder and L. A. Owen (San Diego: Academic Press), CA49.
Palumbo, L., Hetzel, R., Tao, M., Li, X., and Guo, J. (2009). Deciphering the rate of mountain growth during topographic presteady state: an example from the NE margin of the Tibetan Plateau. Tectonics 28, 1–18. doi: 10.1016/j.geomorph.2019.02.003
Pan, B., Burbank, D., Wang, Y., Wu, G., Li, J., and Guan, Q. (2003). A 900 ky record of strath terrace formation during glacial-interglacial transitions in northwest China. Geology 31, 957–960. doi: 10.1130/g19685.1
Peterson, J. F. (1985). “Equilibrium tendency in piedmont scarp denudation, Wasatch Front, Utah,” in Tectonic Geomorphology Proceedings of the 15th Annual Binghamton Geomorphology Symposium, eds M. Morisawa and J. T. Hack (Boston: Allen & Unwin), 209–233.
Priyanka, R. S., Jayangondaperumal, R., Pandey, A., Mishra, R. L., Singh, I., Bhushan, R., et al. (2017). Primary surface rupture of the 1950 Tibet-Assam great earthquake along the eastern Himalayan front, India. Sci. Rep. 7, 1–12.
Reimer, P. J., Bard, E., Bayliss, A., Beck, J. W., Blackwell, P. G., Ramsey, C. B., et al. (2013). IntCal13 and Marine13 radiocarbon age calibration curves 0–50,000 years cal BP. Radiocarbon 55, 1869–1887. doi: 10.2458/azu_js_rc.55.16947
Ren, J., Xu, X., Zhang, S., Ding, R., Liu, H., Liang, O., et al. (2019). Late Quaternary slip rates and Holocene paleoearthquakes of the eastern Yumu Shan fault, northeast Tibet: implications for kinematic mechanism and seismic hazard. J. Asian Earth Sci. 176, 42–56. doi: 10.1016/j.jseaes.2019.02.006
Ren, Z., Zhang, Z., Chen, T., Yan, S., Yin, J., Zhang, P., et al. (2016). Clustering of offsets on the Haiyuan fault and their relationship to paleoearthquakes. Bulletin 128, 3–18.
Stewart, I. S., and Hancock, P. L. (1988). Normal fault zone evolution and fault scarp degradation in the Aegean region. Basin Res. 1, 139–153. doi: 10.1111/j.1365-2117.1988.tb00011.x
Stokes, S., Hetzel, R., Bailey, R. M., and Mingxin, T. (2003). Combined IRSL-OSL single aliquot regeneration (SAR) equivalent dose (De) estimates from source proximal Chinese loess. Quat. Sci. Rev. 22, 975–983. doi: 10.1016/s0277-3791(03)00044-1
Tapponnier, P., Meyer, B., Avouac, J. P., Peltzer, G., Gaudemer, Y., Shunmin, G., et al. (1990). Active thrusting and folding in the Qilian Shan, and decoupling between upper crust and mantle in northeastern Tibet. Earth Planet. Sci. Lett. 97, 382–403. doi: 10.1016/0012-821x(90)90053-z
Tapponnier, P., Zhiqin, X., Roger, F., Meyer, B., Arnaud, N., Wittlinger, G., et al. (2001). Oblique stepwise rise and growth of the Tibet Plateau. Science 294, 1671–1677. doi: 10.1126/science.105978
Thompson, S. C., Weldon, R. J., Rubin, C. M., Abdrakhmatov, K., Molnar, P., and Berger, G. W. (2002). Late quaternary slip rates across the central Tien Shan, Kyrgyzstan, central Asia. J. Geophys. Res. Solid Earth 107, ETG 7-1–ETG 7-32.
Wallace, R. E. (1977). Profiles and ages of young fault scarps, north-central Nevada. Geol. Soc. Am. Bull. 88, 1267–1281. doi: 10.1130/0016-7606(1977)88<1267:paaoyf>2.0.co;2
Wallace, R. E. (1980). Degradation of the Hebgen Lake fault scarps of 1959. Geology 8, 225–229. doi: 10.1130/0091-7613(1980)8<225:dothlf>2.0.co;2
Wei, Z., He, H., Sun, W., Zhuang, Q., and Liang, Z. (2020). Investigating thrust-fault growth and segment linkage using displacement distribution analysis in the active Duzhanzi thrust fault zone, Northern Tian Shan of China. J. Struct. Geol. 133:103990. doi: 10.1016/j.jsg.2020.103990
Xiong, J., Li, Y., Zhong, Y., Lu, H., Lei, J., Xin, W., et al. (2017). Latest Pleistocene to Holocene thrusting recorded by a flight of strath terraces in the eastern Qilian Shan, NE Tibetan Plateau. Tectonics 36, 2973–2986. doi: 10.1002/2017tc004648
Xu, X., Yeats, R. S., and Yu, G. (2010). Five short historical earthquake surface ruptures near the Silk Road, Gansu Province, China. Bull. Seismol. Soc. Am. 100, 541–561. doi: 10.1785/0120080282
Yang, H., Yang, X., and Huang, X. (2017). A preliminary study about slip rate of middle segment of the northern Qilian thrust fault zone since late quaternary. Seismol. Geol. 39, 20–42.
Yang, H., Yang, X., Huang, X., Li, A., Huang, W., and Zhang, L. (2018). New constraints on slip rates of the Fodongmiao-Hongyazi fault in the Northern Qilian Shan, NE Tibet, from the 10Be exposure dating of offset terraces. J. Asian Earth Sci. 151, 131–147. doi: 10.1016/j.jseaes.2017.10.034
Yin, A., and Harrison, T. M. (2000). Geologic evolution of the Himalayan-Tibetan orogen. Annu. Rev. Earth Planet. Sci. 28, 211–280. doi: 10.1146/annurev.earth.28.1.211
Yuan, D. Y., Ge, W. P., Chen, Z. W., Li, C. Y., Wang, Z. C., Zhang, H. P., et al. (2013). The growth of northeastern Tibet and its relevance to large-scale continental geodynamics: a review of recent studies. Tectonics 32, 1358–1370. doi: 10.1002/tect.20081
Zhang, P., Li, C., and Mao, F. (2008). Strath terrace formation and strike-slip faulting. Seismol. Geol. 30, 44–57.
Zhao, Z., Fang, X., Li, J., Pan, B., Yan, M., and Shi, Z. (2001). Paleomagnetic dating of the Jiuquan Gravel in the Hexi Corridor: implication on mid-Pleistocene uplift of the Qinghai-Tibetan Plateau. Chinese Sci. Bull. 46, 2001–2005. doi: 10.1007/bf02901916
Zheng, D., Wang, W., Wan, J., Yuan, D., Liu, C., Zheng, W., et al. (2017). Progressive northward growth of the northern Qilian Shan–Hexi Corridor (northeastern Tibet) during the Cenozoic. Lithosphere 9, 408–416. doi: 10.1130/l587.1
Zheng, W., Zhang, H., Zhang, P., Molnar, P., Liu, X., and Yuan, D. (2013). Late Quaternary slip rates of the thrust faults in western Hexi Corridor (Northern Qilian Shan, China) and their implications for northeastward growth of the Tibetan Plateau. Geosphere 9, 342–354. doi: 10.1130/ges00775.1
Zheng, W. J., Zhang, P. Z., Ge, W. P., Molnar, P., Zhang, H. P., Yuan, D. Y., et al. (2013). Late Quaternary slip rate of the South Heli Shan Fault (northern Hexi Corridor, NW China) and its implications for northeastward growth of the Tibetan Plateau. Tectonics 32, 271–293. doi: 10.1002/tect.20022
Zhong, Y., Xiong, J., Li, Y., Zheng, W., Zhang, P., Lu, H., et al. (2020). Constraining late quaternary crustal shortening in the eastern qilian shan from deformed river terraces. J. Geophys. Res. Solid Earth 125:e2020JB020631.
Zhu, W. (2016). Study on Fluvial Geomorphology at the Eastern Margin of Yumu Mountain in Hexi Corridor. Master’s degree thesis. Beijing: China University of Geosciences.
Keywords: erosion and deposition, vertical slip rate, vertical offset, terrace abandonment age, Minle–Damaying Fault
Citation: Liu Q, Zhang H, Li Y, Huang F, Zhao X, Lei J, Xin W, Xiong J and Zhang P (2021) Effects of Erosion and Deposition on Constraining Vertical Slip Rates of Thrust Faults: A Case Study of the Minle–Damaying Fault in the North Qilian Shan, NE Tibetan Plateau. Front. Earth Sci. 9:635702. doi: 10.3389/feart.2021.635702
Received: 30 November 2020; Accepted: 05 March 2021;
Published: 29 April 2021.
Edited by:
Fabien Graveleau, Université de Lille, FranceReviewed by:
Xingwang Liu, Lanzhou National Observatory of Geophysics, ChinaR. Jayangonda Perumal, Wadia Institute of Himalayan Geology, India
Andrew V. Zuza, University of Nevada, Reno, United States
Copyright © 2021 Liu, Zhang, Li, Huang, Zhao, Lei, Xin, Xiong and Zhang. This is an open-access article distributed under the terms of the Creative Commons Attribution License (CC BY). The use, distribution or reproduction in other forums is permitted, provided the original author(s) and the copyright owner(s) are credited and that the original publication in this journal is cited, in accordance with accepted academic practice. No use, distribution or reproduction is permitted which does not comply with these terms.
*Correspondence: Jianguo Xiong, eGlvbmdqZ0Bwa3UuZWR1LmNu