 Reyes Giménez
 Miguel Bartolomé3
 Fernando Gázquez
- 1Department of Geoenvironmental Processes and Global Change, Pyrenean Institute of Ecology, IPE-CSIC, Zaragoza, Spain
- 2Department of Earth Sciences, University of Zaragoza, Zaragoza, Spain
- 3Department of Geology, National Museum of Natural Science, MNCN-CSIC, Madrid, Spain
- 4Water Resources and Environmental Geology Research Group, Department of Biology and Geology, University of Almería, Almería, Spain
- 5Andalusian Centre for the Monitoring and Assessment of Global Change (CAESCG), University of Almería, Almería, Spain
- 6Department of Geology, University of Oviedo, Oviedo, Spain
Studies of rainfall isotopic composition in the Iberian Peninsula are scarce, and to date, none of them have provided analyses of the triple oxygen isotopes, preventing from the complete understanding of current atmospheric processes in this region. We investigate the rainwater δ17O, δ18O, and δD and derived parameters 17O-excess and d-excess in a mountain site in the Central South Pyrenees (Villanúa, Huesca, Spain) to identify the main factors (regional and local) controlling the isotopic composition of precipitation at event scale. The samples were collected on a rainfall-event basis during 2 years (from July 2017 to June 2019), and meteorological variables [temperature, relative humidity (RH), and rainfall amount] were monitored at the sampling site. The δ17O, δ18O, and δD values were higher during summer and lower during the rest of the year. In contrast, the 17O-excess and d-excess were lower during summer and higher during the remaining months. We found that the isotopic parameters are weakly correlated with rainfall amount during each event, but they strongly depend on changes in air temperature and moderately on RH. We consider other factors affecting the isotopic composition of rainfall events that resulted to have an important role, such as the influence of the moisture source and trajectory throughout the variations in the synoptic pattern during rainfall events. This dataset can be useful for further comprehensive atmospheric and hydrological studies, with application to paleoclimatic investigations.
Introduction
The oxygen and hydrogen isotopes composition [18O/16O and 2H/1H or δ18O and δD when standardized to the international water standard Vienna-Standard Mean Ocean Water (V-SMOW)] of rainwater has been widely used as a tracer of the hydrological cycle. In high latitudes, δ18O and δD are mostly correlated with temperature, whereas in the tropics, they are dominated by the amount of precipitation of each rainfall event, also known as the amount effect (Dansgaard, 1964; Rozanski et al., 1993). However, there are other factors controlling the isotopic ratios in rainwater, which are associated with evaporation and condensation processes along the different phases of the hydrologic cycle. Indeed, the δ18O and δD in rainfall are mostly a result of the history of specific air masses and particular meteorological conditions prevailing at the time of cloud formation (Craig, 1961; Dansgaard, 1964). Some effects on the isotope composition of precipitation are stable for a particular location at short-term, such as altitude or continental effects. In contrast, other effects depend on variables that change with time for a specific location (such as temperature, amount of precipitation, and moisture source), which result in seasonal oscillations of the isotope composition of precipitation at the site. In addition to the primary parameters δ18O and δD, the deviation of a given sample with respect to the Global Meteoric Water Line (GMWL), also known as deuterium excess (d-excess = δD – 8 δ18O) (Craig, 1961; Dansgaard, 1964), has been widely used to define moisture source characteristics, such as the relative humidity (RH) and the temperature of the sea surface at the time of water vapor formation (Merlivat and Jouzel, 1979).
More recently, analytical advances have permitted obtaining precise measurements of the triple oxygen isotope composition (δ17O and δ18O) of natural waters (Barkan and Luz, 2005; Steig et al., 2014). Deviations with respect to the δ17O–δ18O GMWL, with a slope of 0.528, are expressed as 17O-excess [17O-excess = ln(δ18O/1,000 + 1) – 0.528 ∗ ln(δ17O/1,000 + 1)] (Barkan and Luz, 2005; Luz and Barkan, 2010). This parameter has been found to mostly reflect variations in the RH at the moisture source, with smaller temperature dependence than d-excess (Barkan and Luz, 2005, 2007; Luz and Barkan, 2010). Therefore, it is expected that 17O-excess of precipitation represents more directly the signal acquired during the formation of water vapor, being a function of the normalized RH at the moisture source, as observed in polar regions (Risi et al., 2010). Coherently, a recent study in a subtropical island demonstrated that 17O-excess in rainwater can also be a tracer of isotope diffusional fractionation during evaporation (Uechi and Uemura, 2019) and suggests that, in the typical humid climate of tropical and subtropical regions, the 17O-excess in precipitation is a unique quantitative tracer for the RH at the oceanic moisture source. In contrast, an investigation in a dry African region showed that the 17O-excess in precipitation is strongly influenced by re-evaporation during convective activity (Landais et al., 2010). When strong convection occurs, rain re-evaporation and convective downdrafts result in lower oxygen and hydrogen isotopic ratios of precipitation (Risi et al., 2008). These processes are not fully explored in mid-latitude regions where a complex situation governed by multiple factors is expected, thus resulting in a higher variability on the isotopic composition of rainfall.
In areas, such as the Iberian Peninsula (IP), where atmospheric dynamics are influenced by the combination of prevailing westerly winds, the subtropical anticyclone belt and the polar front oscillations (Lionello et al., 2006), the resulting isotopic composition of rainfall is thus controlled by several factors. Despite the high regional and temporal variabilities of the isotopic composition of rainfall in the IP, the Global Network of Isotopes in Precipitation (GNIP) stations collecting isotopic data in precipitation are still scarce, and few studies of rainfall isotopic composition are currently available (Araguás-Araguás and Diaz Teijeiro, 2005; Krklec and Domínguez-Villar, 2014; Moreno et al., 2014). The lack of data in elevated areas, such as the Pyrenees, is particularly notorious. To understand the main factors controlling the isotopic variability of rainfall on a specific site, present-day observations are necessary in many areas far from the GNIP stations. Besides, very few sites collect and measure rainfall isotopes at a per-event basis. Indeed, datasets of stable isotopes in rainfall with high temporal resolution recording significant rain events are still uncommon.
We provide here the first database of triple oxygen and hydrogen stable isotopes of rainwater in Central South Pyrenees, based on a rainfall-event sampling, which has allowed us to obtain a very detailed rainfall isotopic record during 2 years. We investigate the local rainfall isotopic variability in a mountain site (957 m; Villanúa, Huesca, NE Spain) characterized by a transitional Mediterranean–Oceanic climate and identify the main factors controlling the isotopic composition of rainwater. Other factors affecting the isotopic composition of rainfall events are considered, including changes in the moisture source in order to understand the atmospheric information recorded by the triple oxygen isotopes of rainfall. We explore the use of the 17O-excess signal of Pyrenean rainfall as a further application on paleo-records to identify wet/dry periods in connection with local and regional climate conditions.
Site Description and Climate Setting
This study was conducted in Villanúa (Huesca), a village located at the western end of Central South Pyrenees (northeastern IP) (Figure 1). Villanúa is situated at the Aragon Valley, a north–south valley in an area with a height gradient close to 2,000 m, where the highest zones correspond to the Internal Ranges representing a significant geographical barrier northern to the sampling site. Monitoring was conducted at the interpretation center of “Las Güixas” touristic cave (42°40′59′′N; 0°31′56′′W; 957 m a.s.l.) (Figure 1).
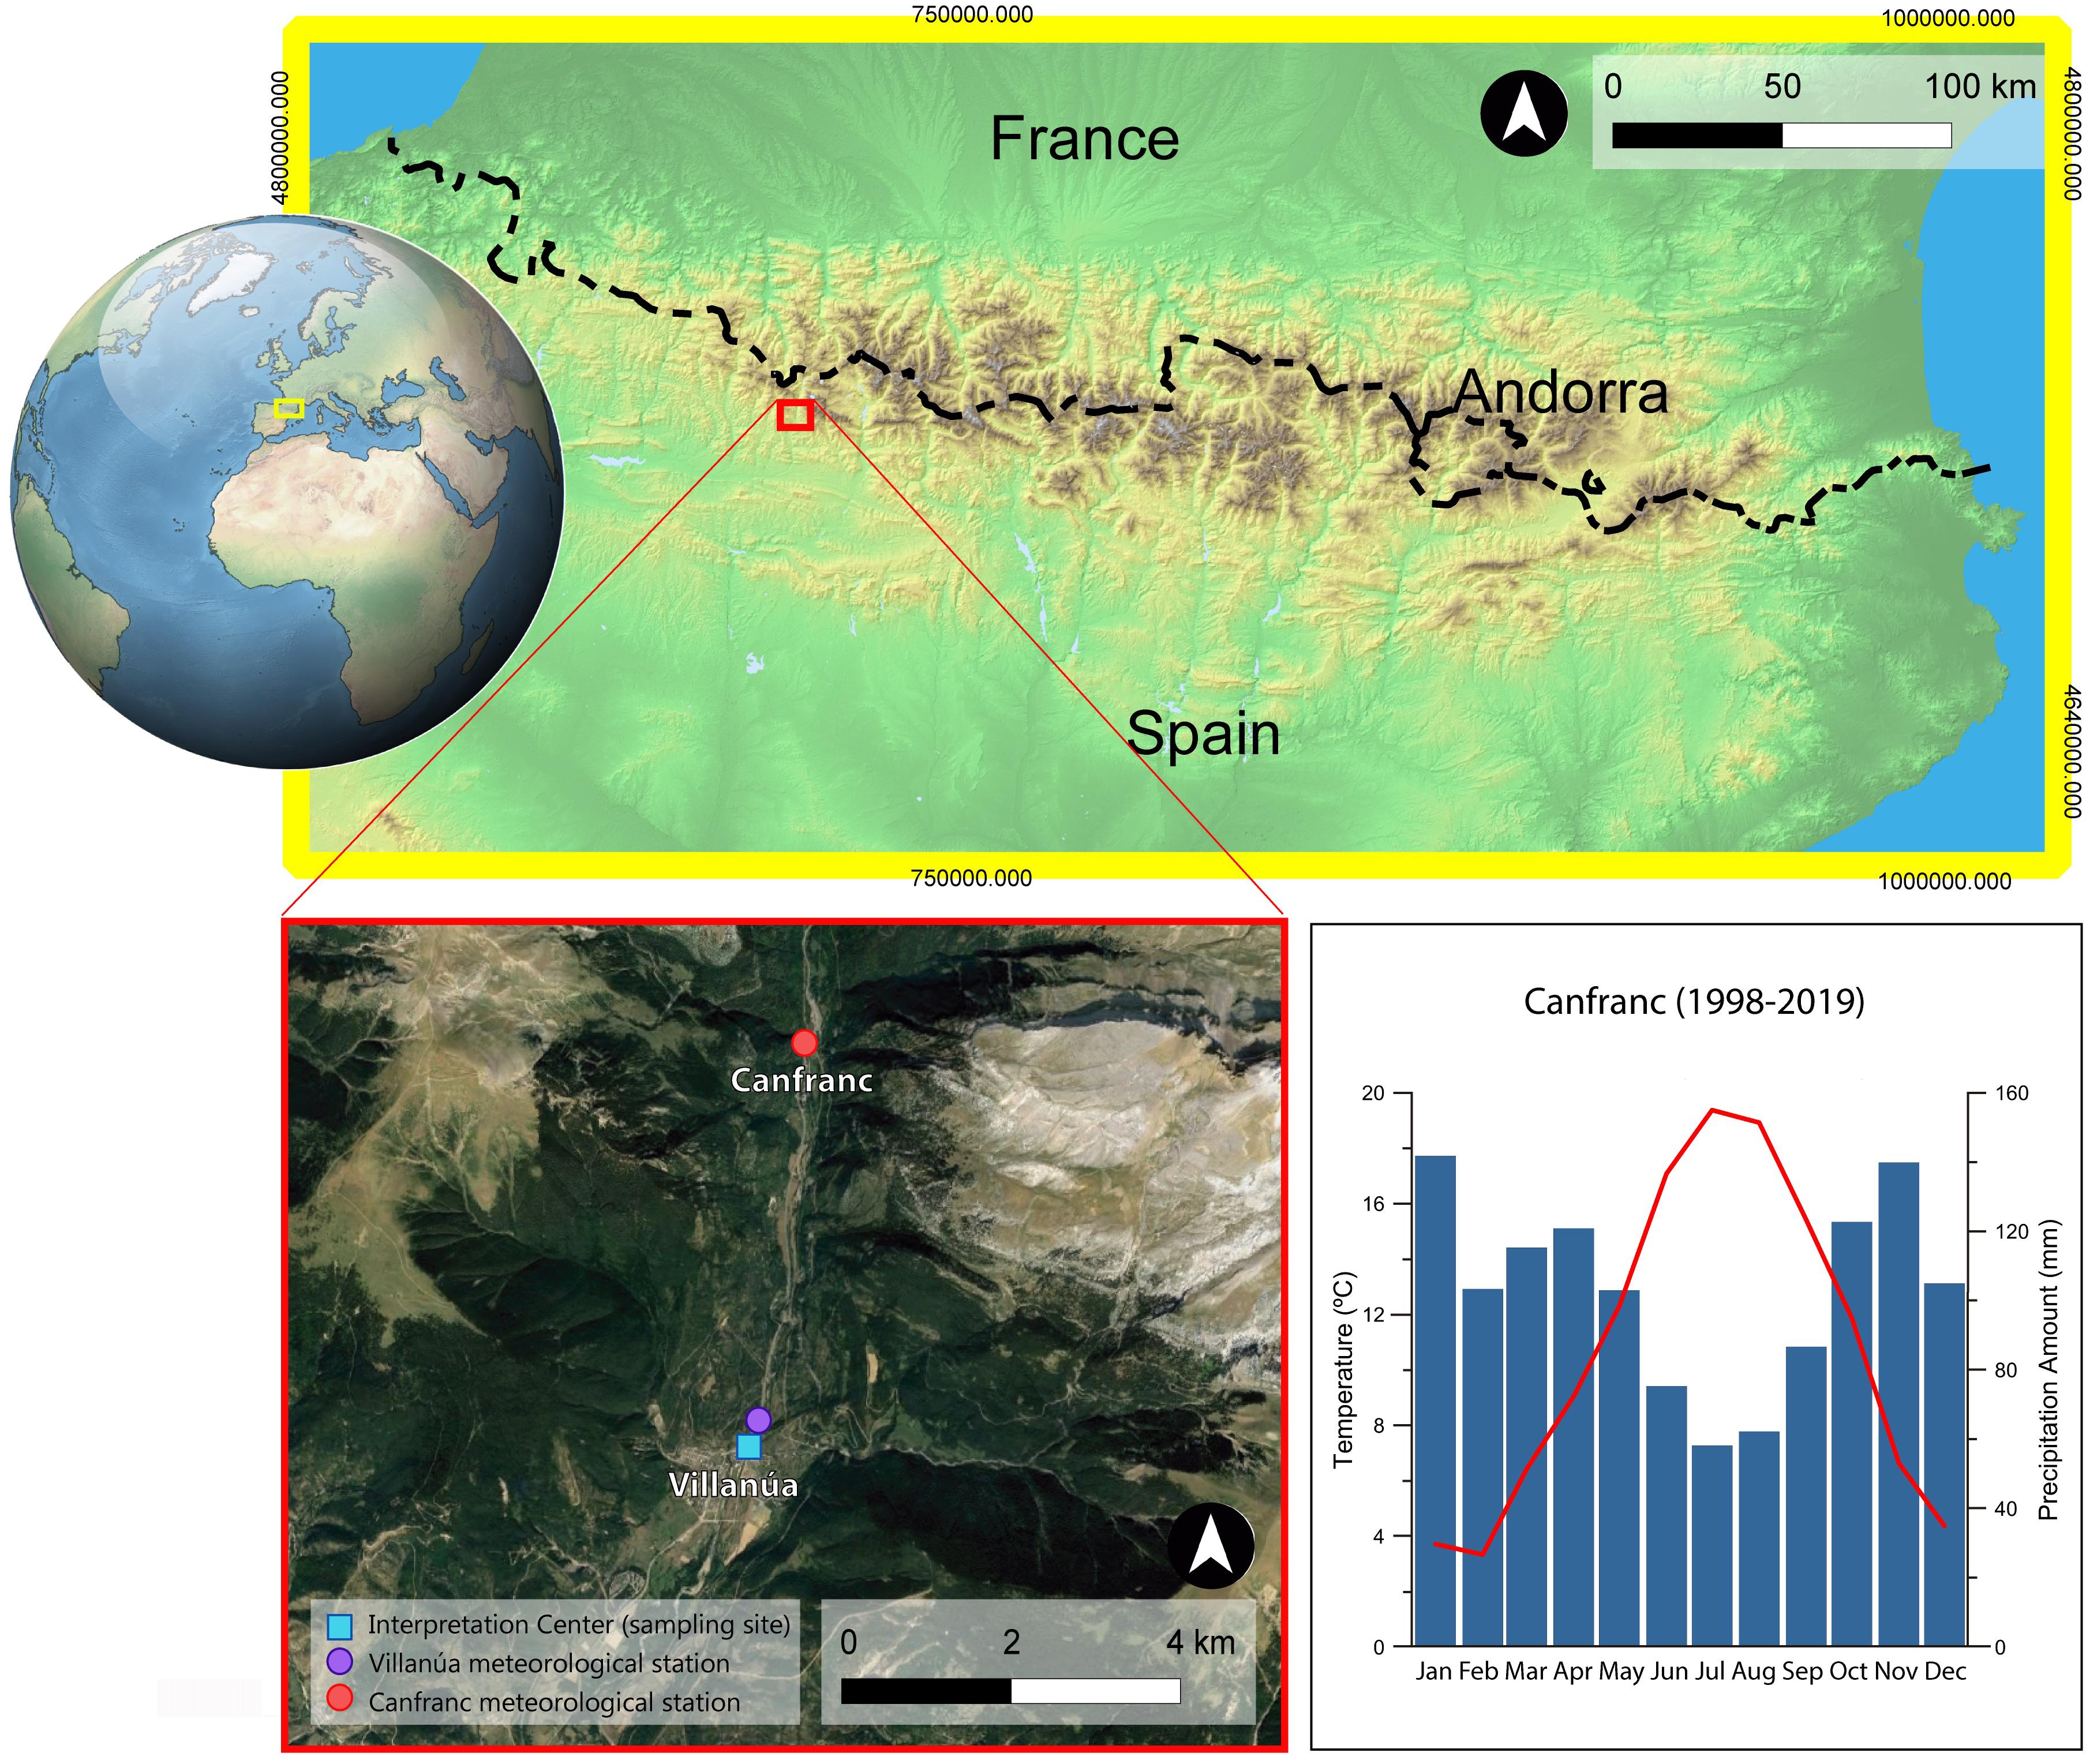
Figure 1. Location of the precipitation sampling site in Villanúa and meteorological stations (DGT station in Villanúa and SAIH—Ebro station in Canfranc) in the Aragon Valley (Central South Pyrenees). Pyrenees map from ASTER GDEM (NASA v3, 2019) and aerial view of Aragon Valley from Google Earth. Ombrothermic diagram shows monthly precipitation amount averaged over 22 years (from 1998) and air temperature averaged over 18 years (from 2002) based on climatological data obtained from the meteorological station at Canfranc village. This location is 4 km to the north of the precipitation sampling site in Villanúa, having similar mean annual air temperature (10.7°C) and slightly higher precipitations (1,235 mm).
This mountain area is characterized by a Cfb climate (temperate climate without dry season and warm summer) according to the Köppen classification (Peel et al., 2007), with a mean annual temperature of 10°C and an annual accumulated precipitation of ∼1,100 mm occurring mainly in spring, autumn, and during part of the winter, for which being April, November, and January the rainiest months (Figure 1).
Precipitation from October to May is mainly controlled by the presence of westerly winds and the passage of Atlantic fronts. The area is exposed to the entrance of Atlantic fronts that cannot move southwards due to the barrier effect exerted by the surrounding mountains, dropping a large amount of precipitation in this area and generating a seasonal maximum in rainfall. During the warmest months (July and August), the jet stream retreats northward so subtropical high pressure systems control the weather evolution. The Azores anticyclone keeps off the entry of the Atlantic storms allowing atmospheric stability; however, convective events associated with the combination of warm conditions and strong orography are able to produce rainfall events during this period. The transition periods between these two situations, spring and autumn, are affected by both alternating dynamics systems, causing a changing and unstable rainy weather, mainly in spring. Spring is a period of strong contrasts with a maximum of rainfall in April–May when, together with the entrance of seasonal frontal rains, the first convective rainfall events linked to the local topography occur. In early June, precipitation may be important, but decreases with the onset of summer. At the autumn onset, the southwards retreat of Azores anticyclone allows the entrance of western low pressure systems, and an increase of rainfall is produced. This detailed description about rainfall in the area (Martín et al., 2007) is reinforced by the record and detailed observations made during the rainfall sampling for this study (Figure 2). Accordingly, precipitation in Villanúa exhibits a mix of the Atlantic, Mediterranean, and convective precipitation regimes. Precipitation in winter is characterized by the dominance of Atlantic fronts, whereas autumn and spring are highly variable with different precipitation origins, even Mediterranean regime taking place. In summer, the dominant precipitations are of convective origin.
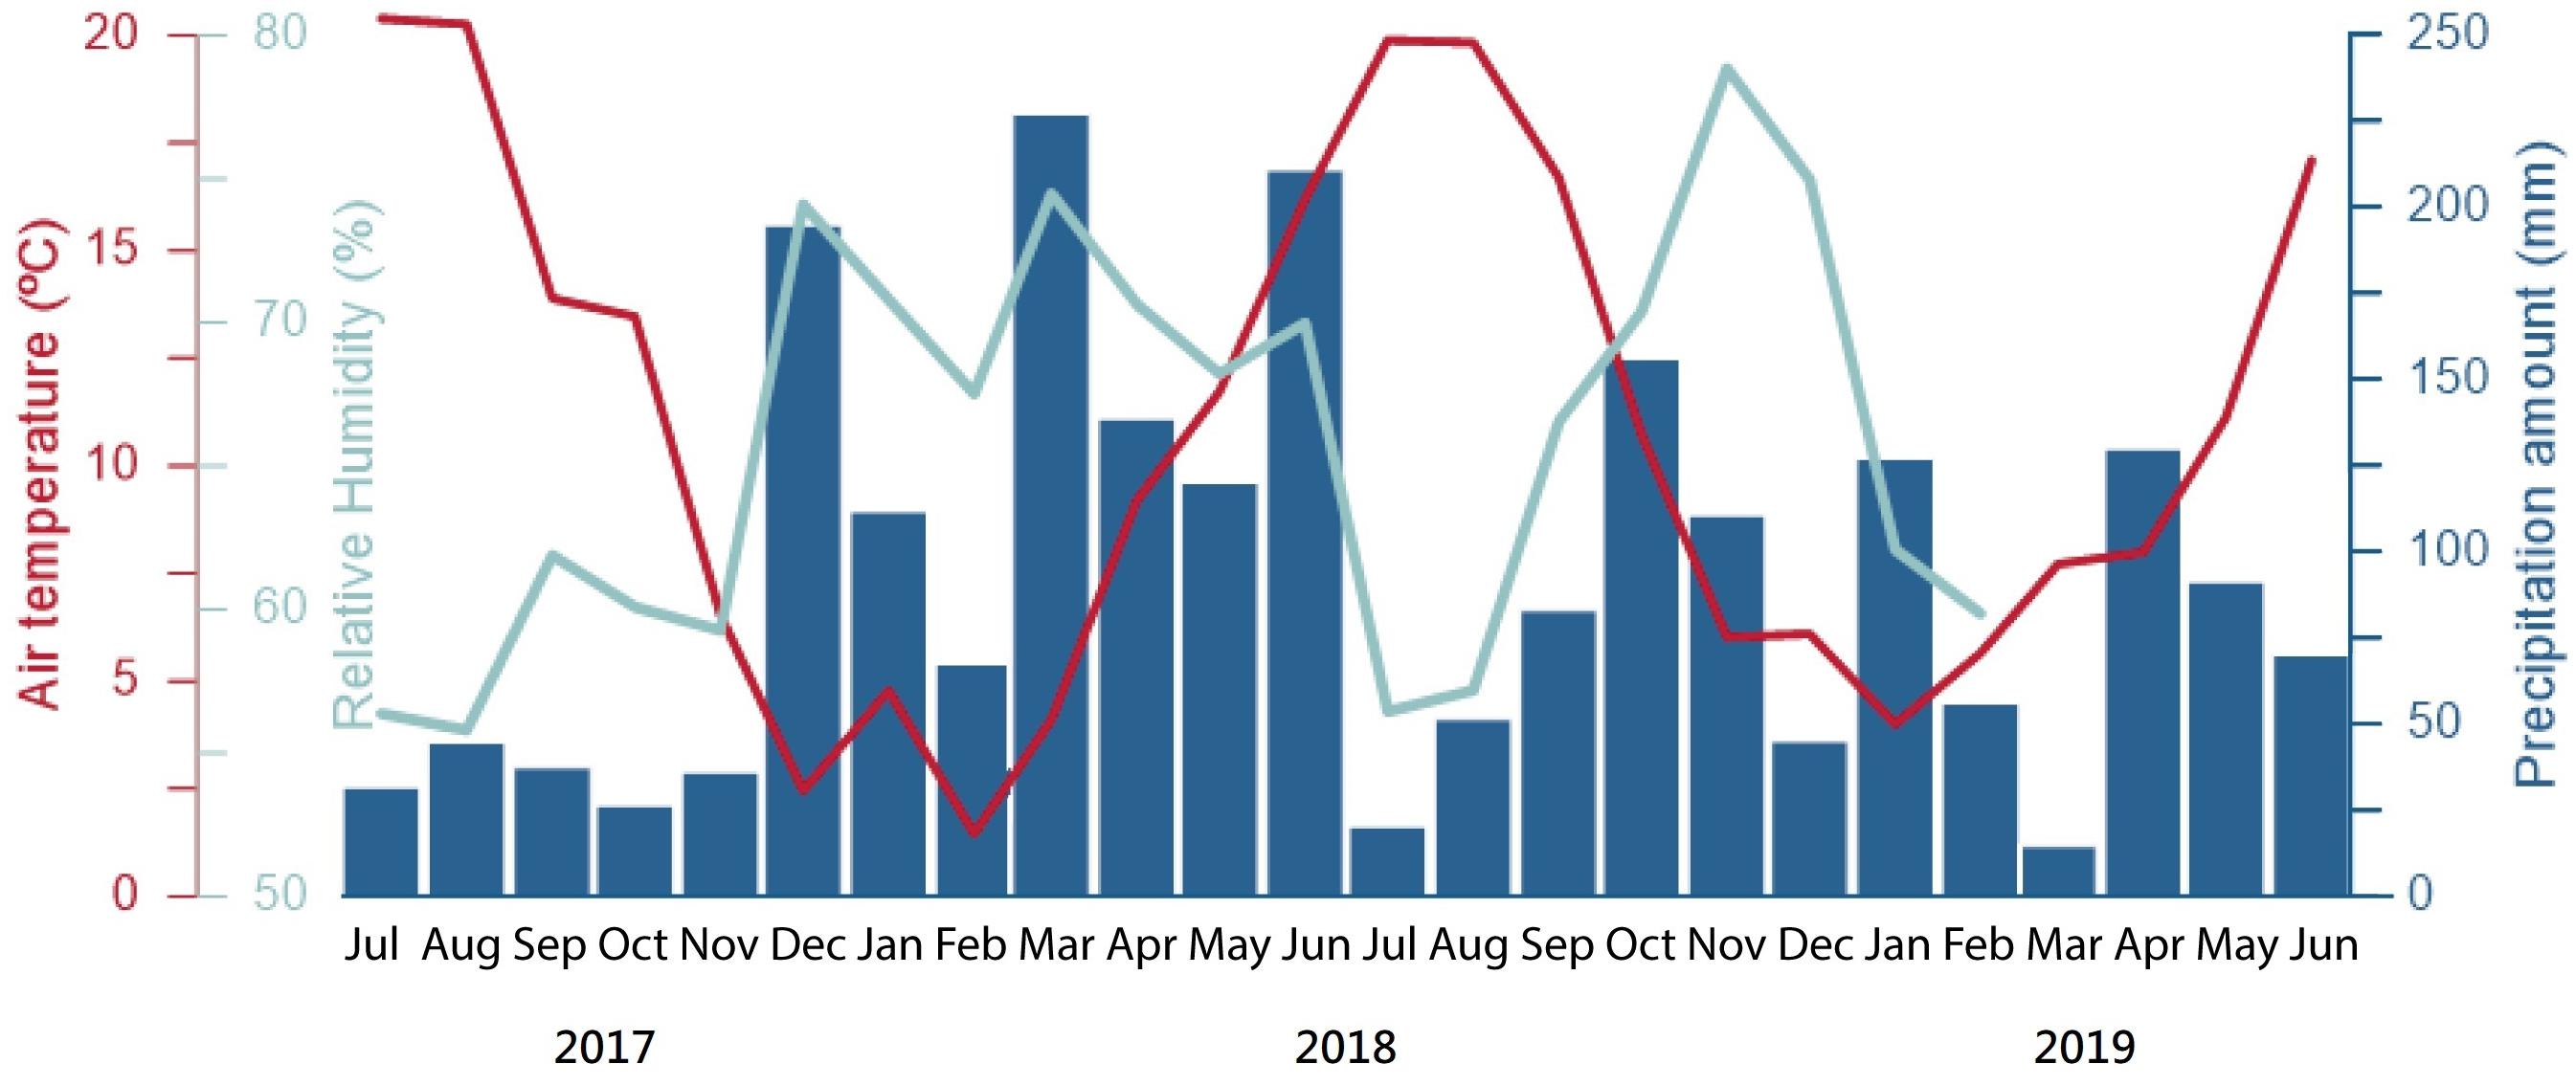
Figure 2. Monthly precipitation amount at the sampling site, mean monthly air temperature, and mean monthly relative humidity based on data obtained from DGT meteorological station at Villanúa during the 2-year monitoring period.
Air temperature varies seasonally, with maximum values in summer (∼20°C as average monthly value), and RH varies according to the air temperature and especially with rainfall amount (Figure 2). The lowest values of RH (∼56% as average monthly value) occur in summer with the highest temperatures and the lowest rainfall amount. In contrast, the oceanic influence in winter brings a high RH (∼75% as average monthly value). In spring, with increasing temperature, high RH values can be observed as a result of enhanced evapotranspiration (Figure 2). Another factor influencing RH is the high incidence of wind in Villanúa, dominated by the Föhn effect from the north that dries up the environment and lowers the RH values.
Methodology
Rainfall Sampling and Meteorological Data
Rainfall samples were collected on a per-event basis from July 2017 to June 2019 (n = 216, Supplementary Table 1) at the interpretation center of “Las Güixas” touristic cave in Villanúa. A rain gauge was installed outside the interpretation center, which allows measuring the amount of rain and water collection. Precipitation events greater or equal to 1 mm were sampled with the total event precipitation homogenized. The collected water was filtered at the time of sampling, stored in 5 ml polypropylene tubes sealed with screw cup without air inside, and kept cold in a refrigerator until isotopic analysis. Rainfall samples were collected at the end of each precipitation event, immediately afterward whenever possible or after a few hours, in order to minimize evaporation. In addition, a record has been made of the amount of precipitation in the form of rain or snow, the temperature of the sample, and the date and time at which it was collected.
Meteorological data including air temperature, precipitation amount, air RH, wind speed, and wind direction, monitored every 10 min, were obtained from the DGT meteorological station that is only 120 m far from the sampling site (Figure 1). Average temperature, RH, wind speed, and wind direction were calculated for each event (Supplementary Table 1).
Isotopic Measurement
The oxygen and hydrogen isotopes composition (δ17O, δ18O, and δD) of rainwater was measured using cavity ring down spectroscopy (CRDS) (Steig et al., 2014) on a Picarro L2140-i at the Laboratory of Stable Isotopes at the University of Almería, Spain. The results were normalized to the V-SMOW scale by analyzing internal standards before and after a set of measurements of 12–15 samples. Three internal water standards (JRW, BOTTY, and SPIT; isotope values are shown in Supplementary Table 4) were calibrated against V-SMOW and Standard Light Antarctic Precipitation (SLAP), using δ17O values of 0.0 and −29.69865‰, respectively, and δ18O values of 0.0 and −55.5‰, respectively (Schoenemann et al., 2013). This standardization considers 17O-excess = 0 for both international standards. δD was calibrated against V-SMOW, Green Ice Sheet Precipitation (GISP), and SLAP. All isotopic deviations are reported in parts per thousand (‰) relative to V-SMOW. 17O-excess values are given in per meg units (0.001‰), where 17O-excess = δ′17O - 0.528 δ′18O, where δ′17O is ln(δ17O/1,000 + 1), and δ′18O is ln(δ18O/1,000 + 1) (Angert et al., 2004). The 17O-excess expresses a small δ17O deviation (normally a few per meg units) of a water sample with respect to the GMWL for triple oxygen isotopes, for which the slope is 0.528 (Luz and Barkan, 2010). The d-excess describes the deviation for δ18O and δD of a given sample with respect to the GMWL (δD-8 ∗ δ18O; Craig, 1961).
The long-term precision (1σ) of oxygen and hydrogen isotope analyses was evaluated by measuring an internal standard (BOTTY) every 5–6 samples. The long-term precision was ± 0.03, ± 0.05, and ± 0.4‰ for δ17O, δ18O, and δD, respectively (n = 55). The long-term precision for the d-excess parameter was ±0.3‰ and for 17O-excess was ±10 per meg.
Backward Trajectories
Backward-trajectory analysis was performed using the Hybrid Single-Particle Lagrangian Integrated Trajectories (HYSPLIT) Model (Draxler and Rolph, 2010) and following a similar methodology to Baldini et al. (2010). The model was run for all precipitation events of this study. Trajectories were calculated with hourly resolution, 120 h back from the end of every rain event, as most of the moisture uptake for the IP occurs within this time interval (Gimeno et al., 2010). Backward trajectories were computed for each rainfall event at 850, 700, and 500 hPa atmospheric levels [approximately equivalent to 1,500, 3,015, and 5,575 m above the ground level (AGL), respectively, depending on pressure conditions over the region]. These atmospheric levels (850 and 700 hpa) were selected according to Air Resources Laboratory (ARL) recommendations1 as a good first approximation of the levels from which frontal and synoptic precipitation are identified. Although most of the moisture in the atmosphere is thought to be in the first 2,000 m AGL (Bershaw et al., 2012), 500 hPa atmospheric level was chosen to support the presence of convection and to have meteorological conditions over high tropospheric levels, taking into account orographic conditions close to the studied region.
Meteorological Synoptic Conditions
Synoptic pattern classification has been developed using a simple classification method that takes into account specific rainfall events in the north of the IP and averages meteorological conditions on a synoptic scale during these types of events (see Valenzuela et al., 2018 for more details). Seven parameters have been considered: (i) 500 hPa temperature (°C), (ii) 850 hPa temperature (°C), (iii) sea level pressure (hPa), (iv) 300 hPa geopotential height (m), (v) 500 hPa geopotential height (m), (vi) 925 hPa specific humidity (kg H2Ov kg air–1), and (vii) 925 hPa wind direction. Composites showing the average values of these parameters during each event have been developed using data measured every 6 h. Taking into account these considerations, four different synoptic patterns related with precipitation events have been identified in the north of the IP (previously published in Valenzuela et al., 2018): (i) Strong Atlantic Anticyclone (SAA) pattern, (ii) Atlantic Depression (AD) pattern, (iii) Anticyclonic Ridge pattern (AR), and (iv) Cut-off Low (CL) pattern.
Results
Rainfall Isotope Results
The variation of δ17O, δ18O, δD, d-excess, and 17O-excess of the precipitation in Villanúa during the monitoring period is displayed in Figure 3, whereas their average, maximum, and minimum values are indicated in Table 1 at seasonal and annual scales covering the 2 years of sampling.
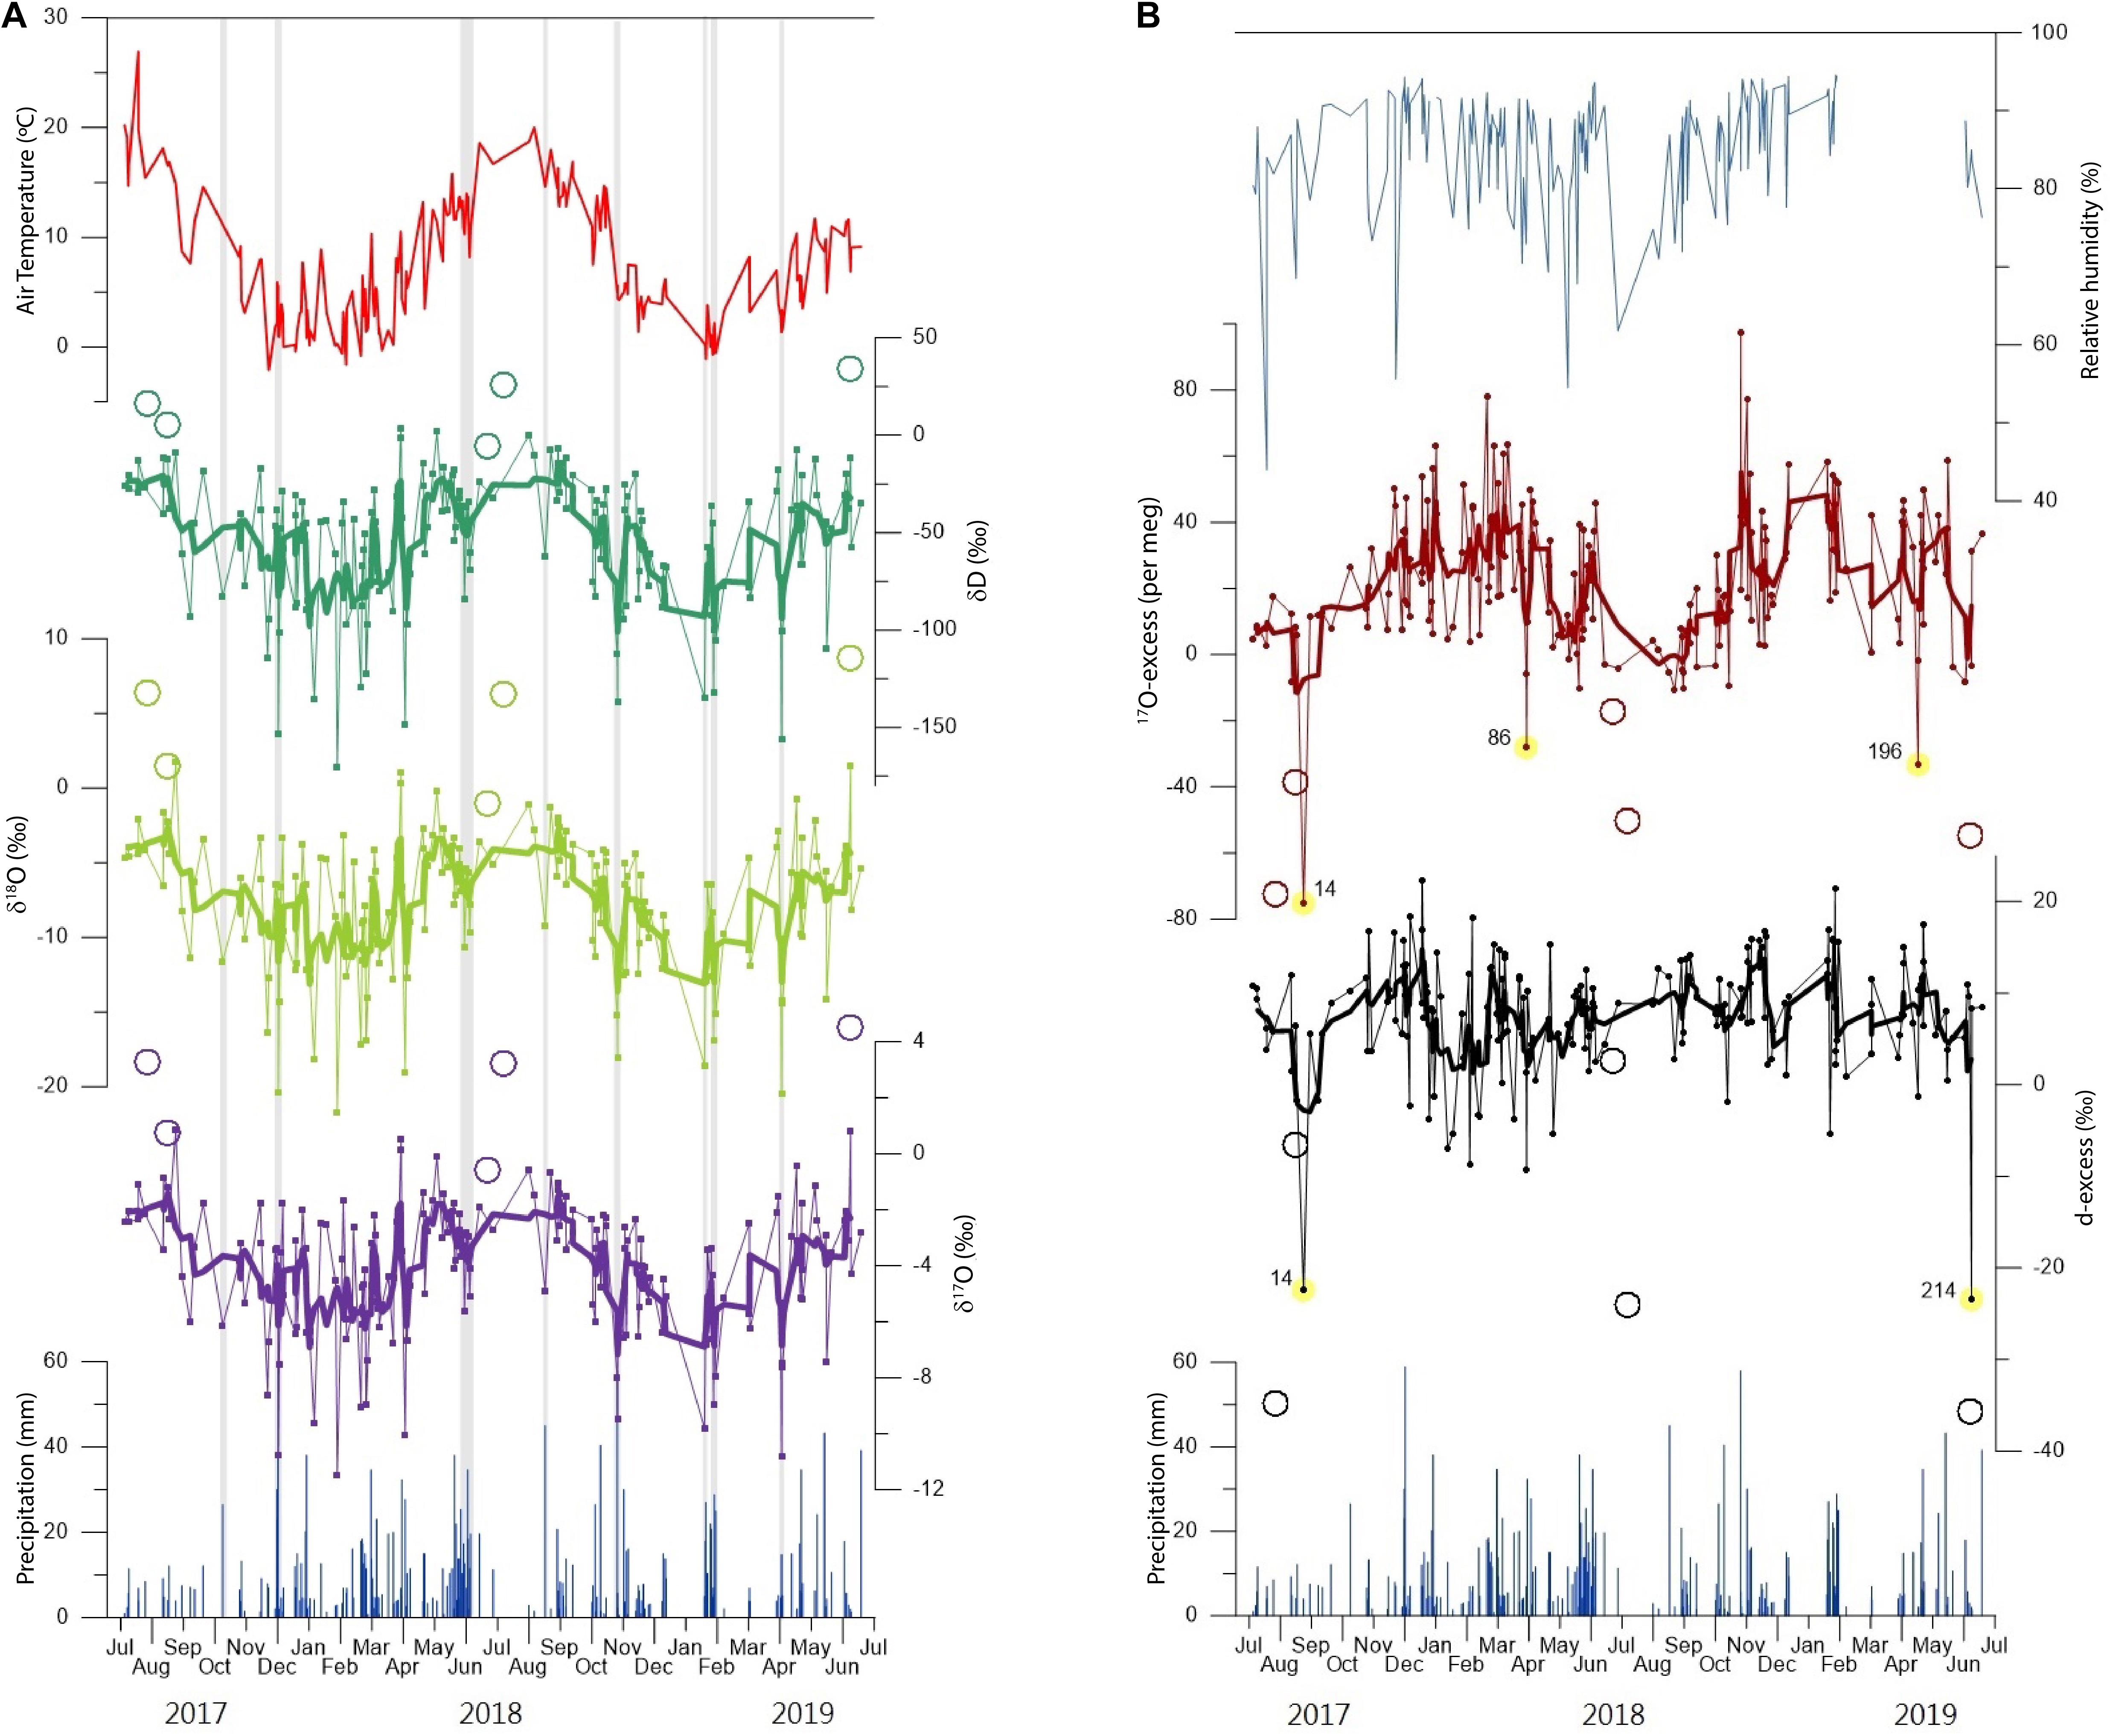
Figure 3. (A) Variation with time of δ17O, δ18O, and δD of the precipitation events in Villanúa during the 2-year monitoring period. Dots show precipitation events, and thick lines are produced as five-samples weighted averages. Precipitation amount of each event and event average temperature were calculated from data of Villanúa meteorological station. Shaded areas indicate rainfall events with high precipitation amount and that cause isotope lightening. (B) Deuterium-excess and 17O-excess series in Villanúa rainfall. The d-excess and 17O-excess values are represented by dots, and thick lines are produced as 5-samples weighted averages. RH at the precipitation site of each event was obtained from data of Villanúa meteorological station. Yellow shaded circles indicate d-excess and 17O-excess outliers without evidence of evaporation due to sampling that have been considered for calculations. For both graphs, unfilled circles correspond to rainfall waters that underwent evaporation prior to sampling and were not considered for the calculations of the weighted average.
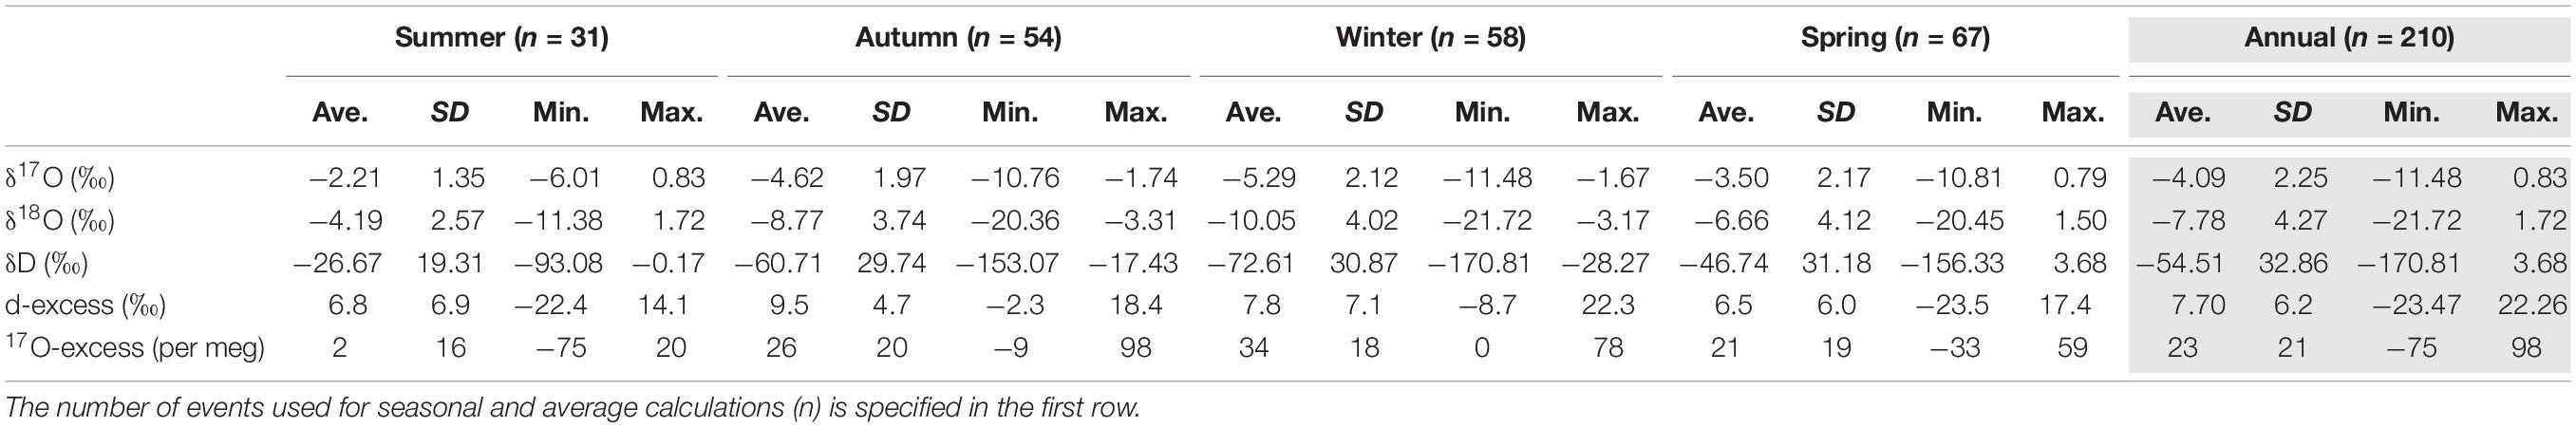
Table 1. Average (Ave.), standard deviation (SD), minimum (Min.), and maximum (Max.) values of δ17O, δ18O, δD, d-excess, and 17O-excess at seasonal and annual scales (shaded).
The δ17O, δ18O, and δD values were higher during the dry period of summer (June to September; means of −2.55 ± 1.39, −4.83 ± 2.65, and −32.09 ± 19.57‰, respectively; n = 51) and were lower during the rest of the year (means of −4.59 ± 2.25, −8.72 ± 4.27, and −61.70 ± 33.06‰, respectively; n = 159), showing a seasonal variation (Figure 3A) with total amplitudes of 12, 23, and 174‰, respectively (see maximum and minimum values in Table 1). The range of amplitude also varies seasonally, being greater in spring, slightly lower in winter and, and very low in summer. Five samples with very high values of δ17O, δ18O, and δD (unfilled circles in Figure 3A) correspond to summer events that underwent evaporation prior to sampling procedures because they could not be collected right after precipitation. These samples have not been considered in the calculations and correlations.
The deuterium excess (d-excess) of the precipitation events in Villanúa averaged 7.7 ± 6.2‰, ranging 45.7‰, between −23.5 and 22.3‰ (Table 1). Figure 3B shows the time series variation of d-excess in Villanúa rainfall indicating lower values during summer (6.6 ± 7.1‰) and higher (8.1 ± 5.9‰) during the remaining months. Two extremely low values stand out (−22.4 and −23.5‰) marked by yellow shade in Figure 3B.
The Local Meteoric Water Line (LMWL) in Villanúa is defined as δD = 7.56⋅δ18O + 4.33 (n = 210; R2 = 0.97). The slope of the LMWL is close to that of the GMWL (Rozanski et al., 1993), and the d-excess is lower than that of the GMWL. The LMWL in Villanúa is shown in Figure 4 where dots in different colors represent rainfall events in the four seasons. Thus, summer events appear grouped in the most positive values of the LMWL, whereas the other seasons are not so clearly differentiated and appear along the line. Five samples showing very high values of δ18O and δD were identified to have suffered evaporation prior to sampling (red dots), and they were not considered in the calculation of the LMWL. There are other four samples with positive δ18O values where no evidences of evaporation prior to sampling were observed but show particular characteristics. Firstly, two rainfall events from April 2018 corresponding to a southern rain front carrying Saharan dust (brown dots in Figure 4). Secondly, events 14 and 214 (enclosed by a circle in Figure 4) that are represented well outside the LMWL and have extreme low d-excess values (corresponding with the events with yellow shade in Figure 3B).
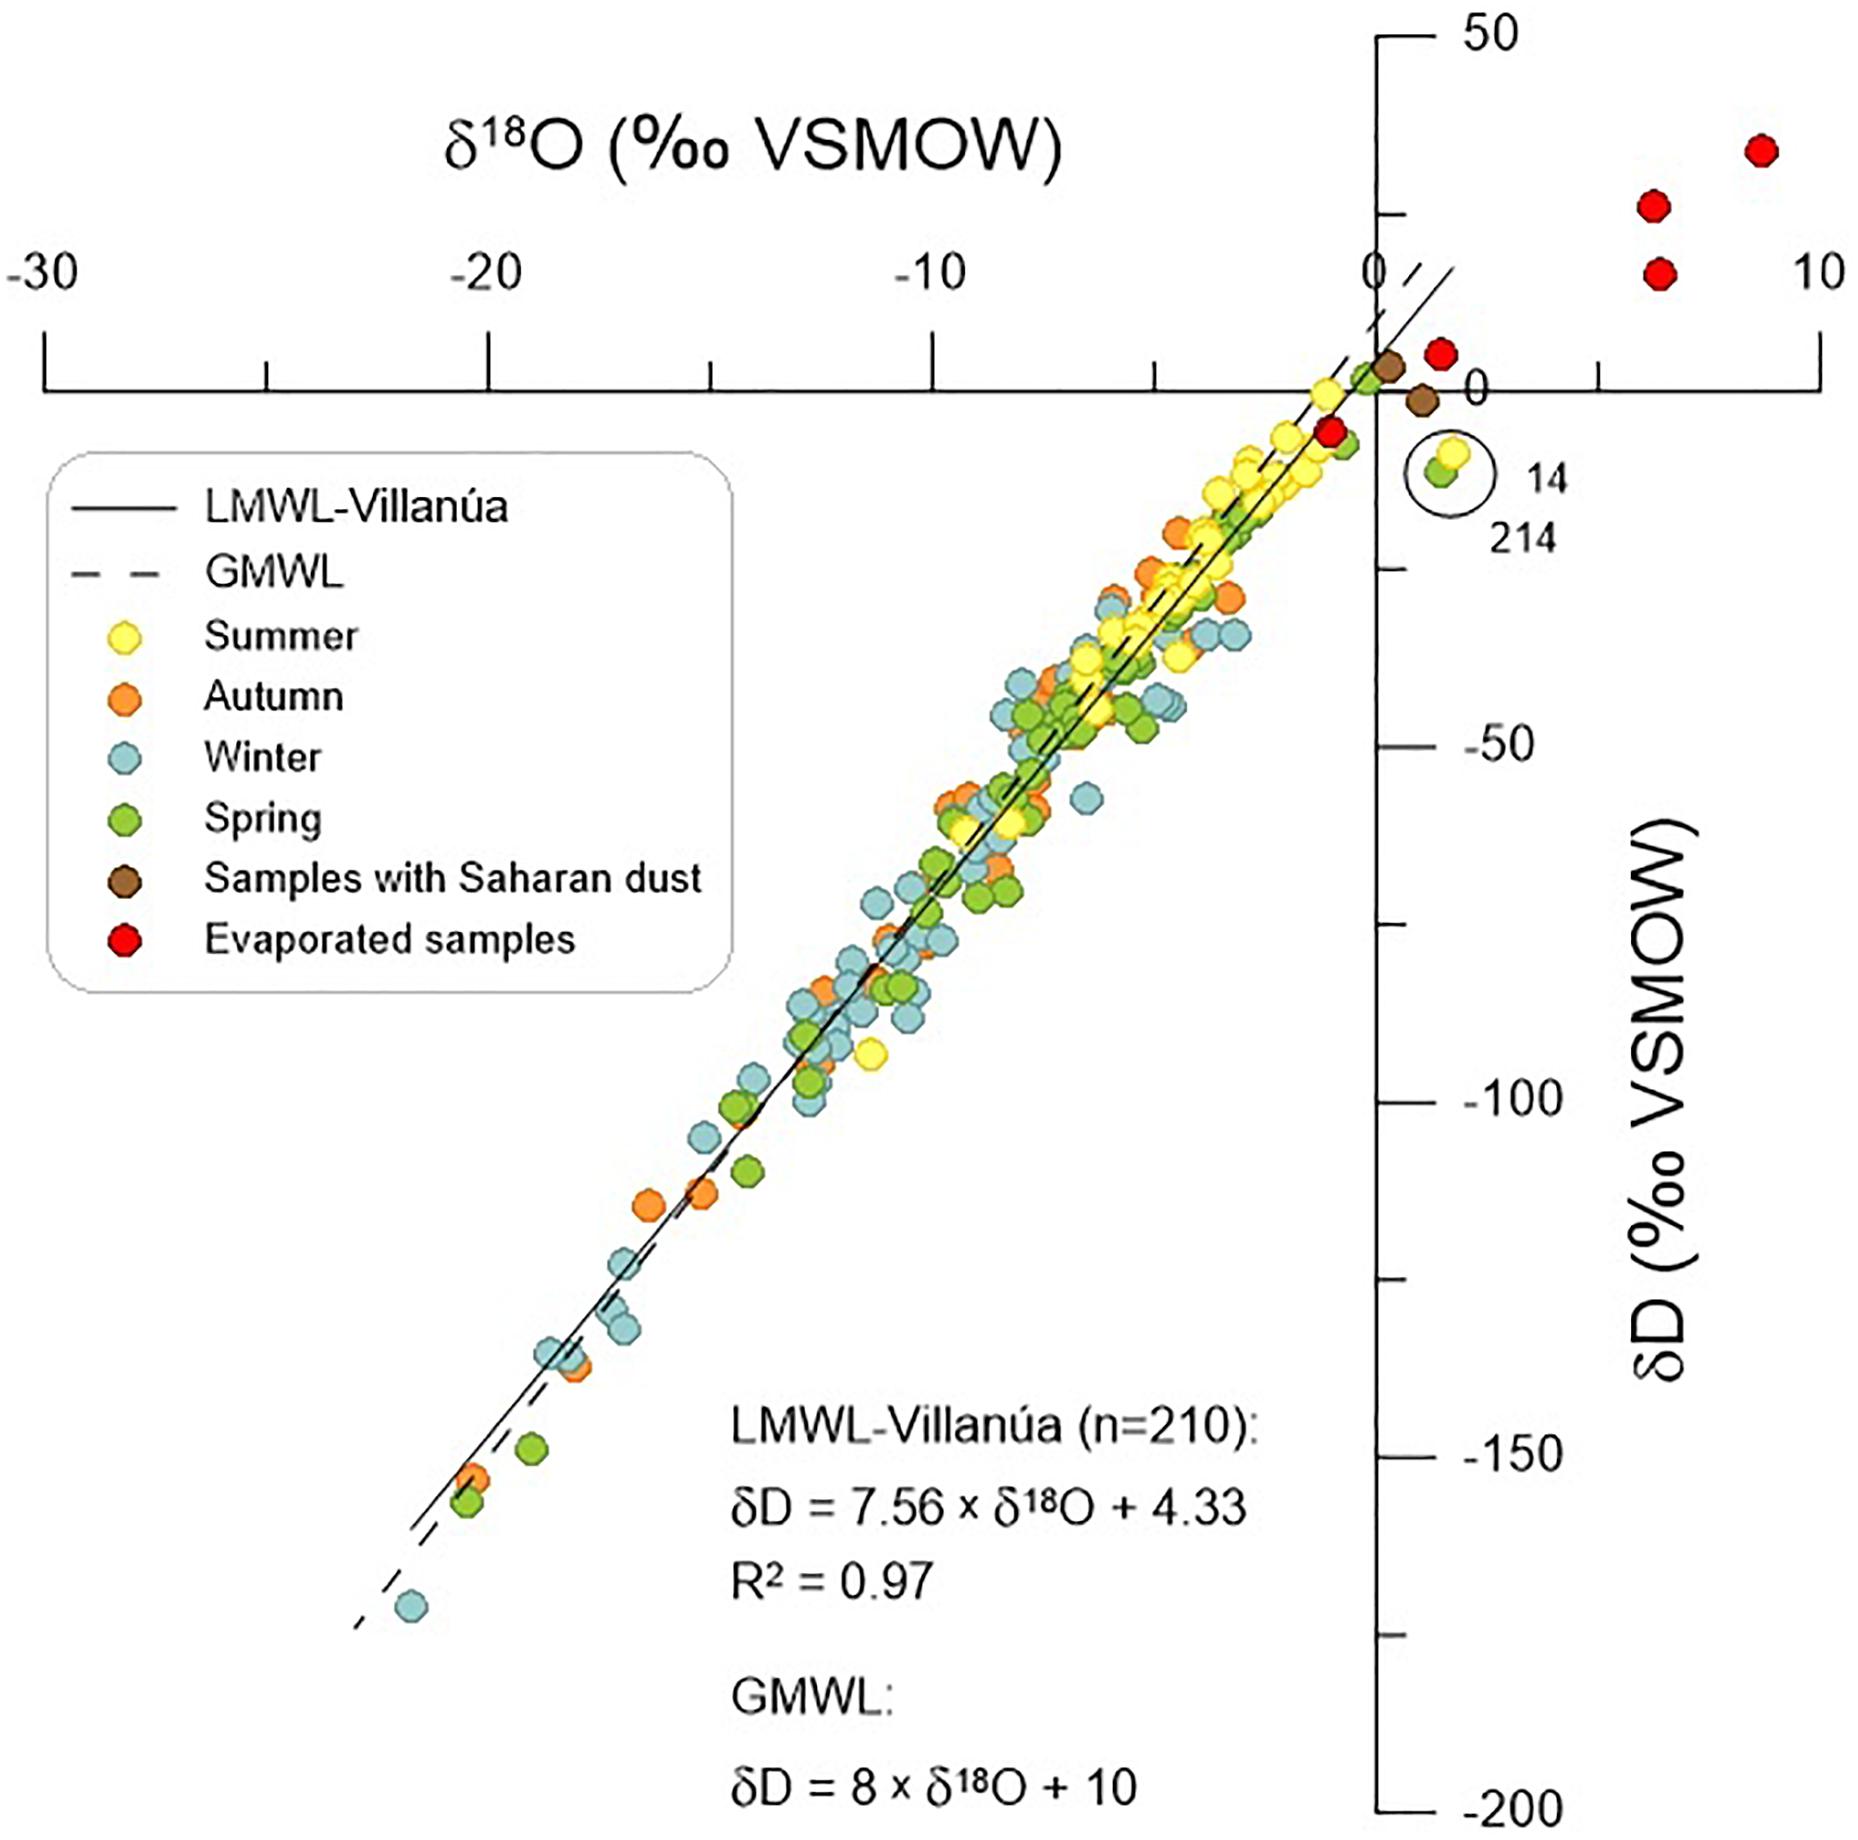
Figure 4. δD and δ18O values of precipitation events in Villanúa. The Local Meteoric Water Line (LMWL) is based on a linear regression through precipitation isotope dataset (black line). Red circles represent samples that suffered evaporation prior to sampling, and they have not been considered for the LMWL. The Global Meteoric Water Line (GMWL) is also indicated (dashed line). Samples enclosed by a circle indicate outliers without evidence of evaporation due to sampling.
The 17O-excess of the precipitation events in Villanúa averaged 23 ± 21 per meg. It shows a clear seasonality opposite to the δ17O, δ18O, and δD values (Figure 3) with an amplitude of 173 per meg, between −75 and 98 per meg (Table 1). The 17O-excess values were lower during summer (9 ± 18 per meg) and higher (28 ± 20 per meg) during the remaining months, similar as in d-excess values. The 17O-excess results yield two outliers (samples 86 and 196) with remarkably low 17O-excess values of −28 and −33 per meg, respectively, and an extremely low 17O-excess value in summer of −75 per meg (sample 14) corresponding also with a low d-excess value (−22.4‰) as is shown in Figure 3B. On the other hand, the relationship between δ′17O and δ′18O values in rainwater generates a line with a slope of 0.524.
Correlation of Isotope Values With Meteorological Parameters
To explore the statistical relationship between isotopic values in precipitation and meteorological parameters (rainfall amount, air temperature, RH, wind intensity, and wind direction at the sampling site), we used Spearman’s rank correlation analysis applying Bonferroni correction to prevent data from incorrectly appearing to be statistically significant by making an adjustment during comparison testing and using the Past software (Hammer et al., 2001) (Supplementary Table 2). In general, the isotopic parameters strongly depend on air temperature, and they are moderately correlated with RH and weakly correlated with rainfall amount at event scale (annual values at Table 2).
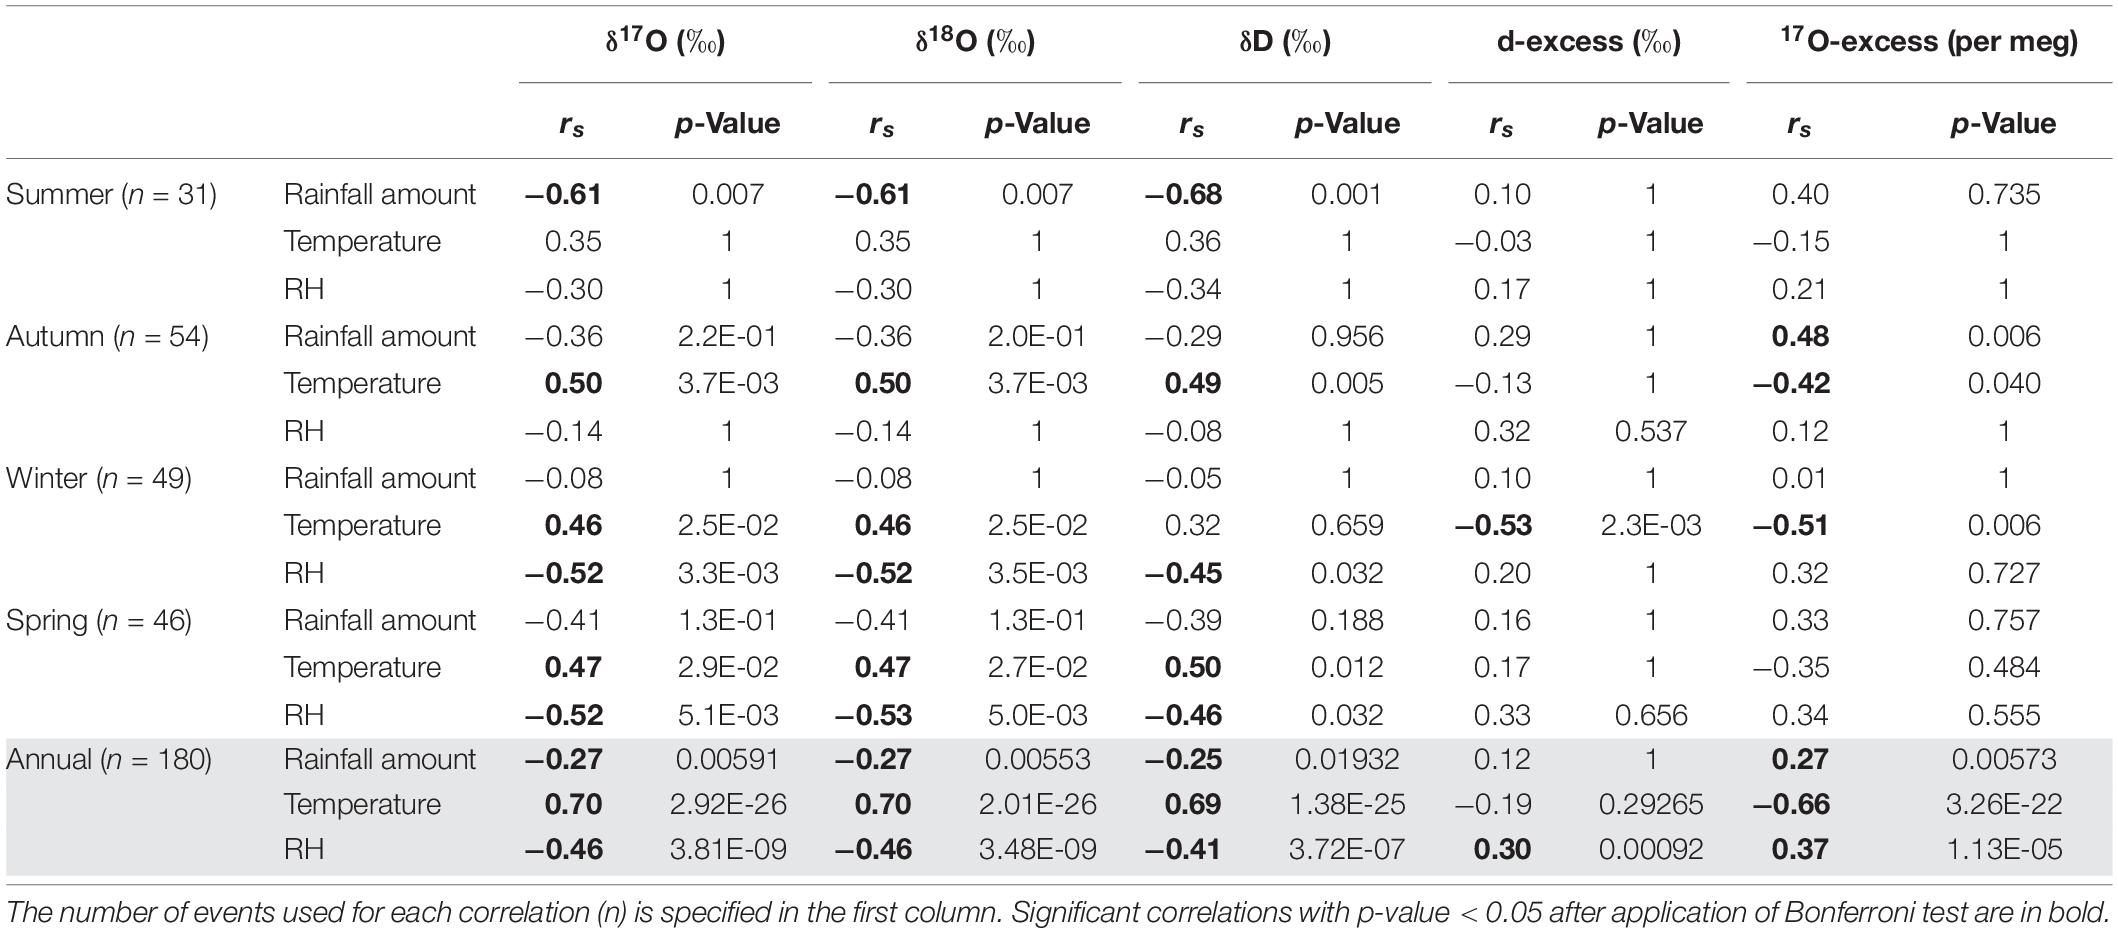
Table 2. Spearman’s correlation coefficients (rs) and significance levels (p-value) between isotopic parameters and environmental parameters at the sampling site [air temperature, precipitation amount, and relative humidity (RH)] at event scale for the 2-year monitoring period (shaded) and for the different seasons.
Temperature exerts an important control on event isotope values. δ17O, δ18O, and δD values have a clearly positive relation with air temperature (Figure 3A and annual values at Table 2). Besides the lower isotopic values occurring at low temperatures, the snow precipitation events in winter also show relative low δ17O, δ18O, and δD values (not shown). Apparently, the rainfall amount does not strongly control the isotopic values (annual values at Table 2), but analyzing the δ18O variation through time, added to the strong dependence on air temperature, it is clearly observed how the most intense rainfall events together with the longest lasting rain events (several days) resulted in an isotopic lightening (Figure 3A). Thus, these results suggest that rainfall amount is modulating δ18O values. On the other hand, δ17O, δ18O, and δD values show a moderate negative relationship with RH at the sampling site (Table 2). Conducting an analysis of these relationships on different seasons, it is shown that temperature controls δ17O, δ18O, and δD values in all seasons except in summer, when the most significant control is rainfall amount (Table 2). Regarding the relationship with RH, it only occurs in winter and spring (Table 2).
As for second order parameters, 17O-excess shows a strong negative correlation with air temperature and a weak positive correlation with rainfall amount, whereas these environmental parameters do not appear to exert a direct influence on d-excess. Both d-excess and 17O-excess exhibit a positive correlation with RH at the sampling site (annual values at Table 2), that is higher for 17O-excess. Nevertheless, if we consider these relationships grouped by the different seasons, 17O-excess correlation with RH is not found, and a significant negative correlation with temperature is only shown in winter. Significantly, temperature correlates negatively with the RH also in winter (Supplementary Table 2). Finally, the positive correlation of 17O-excess with rainfall amount is only shown in autumn.
Considering meteorological variables, a negative correlation of RH with temperature and wind speed occurs, which is moderate for temperature (rs = −0.39; p-value = 2.74e–6) and strong for wind speed (rs = −0.54; p-value = 2.08e–13) (Supplementary Table 2). Analyzing this relationship in the different seasons, it is observed how these correlations intensify in winter and do not occur in other seasons, except in autumn when a strong negative correlation between RH and wind speed is also observed. Besides, it is worth to note that a seasonal behavior is not a characteristic of wind intensity, since this parameter is highly variable on a smaller time scale (event scale or even hourly scale).
Backward-Trajectory Analysis
We perform an analysis of backward trajectories of rainfall events to evaluate the origin and trajectory of the air mass and their influence on precipitation isotopic content. The backward trajectories calculated have similar tracks for the three different starting altitudes for 48% of the events, mostly winter events. In contrast, during the rest of the year, and mostly in summer, trajectories at different altitudes follow different paths, being common that the trajectory at the highest elevation shows longer paths due to generally higher wind speeds at higher altitudes. Trajectories at 850 and 700 hPa follow similar paths for 66% of the events.
In this study, we analyze back-trajectories at 850 hPa for each precipitation event. Their representation is grouped by season (Supplementary Figure 1) showing in every case the dominance of the different sources and paths followed by the air masses throughout the year. A classification of these back-trajectories at 850 hPa according to their source origin and their mean direction until they reach the study site in the IP has been performed (Table 3). The main criterion chosen in this classification is the mean direction of the trajectory until it reaches the study site. Trajectories that fit on described types and directions have been used in this comparison. However, some trajectories that do not fit with this classification (20%), either because they experience sudden trajectory changes, or because they present a looped trajectory with scarce displacement, have not been considered for this analysis. Trajectories with Atlantic origin represent 70% of trajectories throughout the year, accounting for 75% of the total amount of precipitation, with a δ18O mean value of −8.48‰ and a large δ18O variation range of 20‰. The number of events with trajectories coming from the Mediterranean is smaller (∼30%), with a δ18O mean value of −3.26‰ and a lower δ18O variation range (10.1‰).
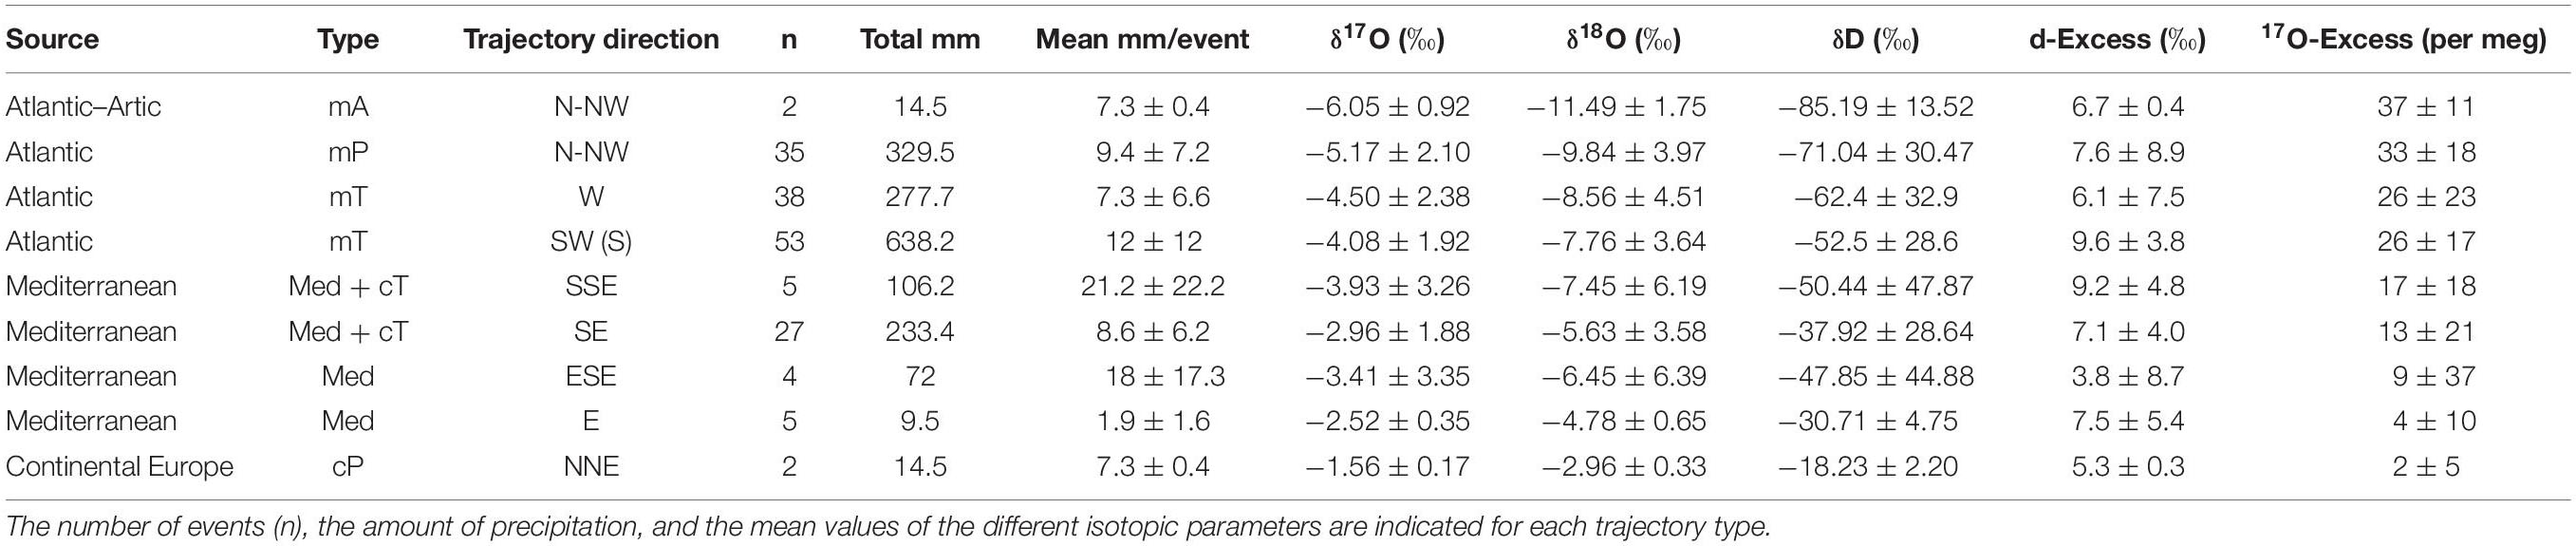
Table 3. Classification of the analyzed backward trajectories according to their source origin (Atlantic Arctic, Atlantic, Mediterranean, Continental Europe) and their mean direction until reaching the study site.
A predominant Atlantic source is observed in winter trajectories with three dominant maritime (m) types: (i) an Arctic cold and low humidity air trajectory (mA) arriving from the N-NW and reaching the Pyrenees from the Cantabrian Sea or crossing France before; (ii) the polar wet and cold air trajectory (mP) with origin on northern positions of the Atlantic (Greenland, Canada) that usually enter the IP by the west, around Galicia and North Portugal, and sometimes from a NW position through the Cantabrian Sea; and (iii) the subtropical warmer and humid air flows (mT) from lower latitudes on the N Atlantic that enter IP from the SW between Lisboa and Cádiz and cross central IP before reaching the Pyrenees, providing less negative δ18O values compared with the previous two (Table 3).
During the rest of the year, the trajectories are more variable, adding also wet air masses arriving from the Mediterranean (Med). Most of the trajectories with a Mediterranean source origin enter the peninsula through southern Catalonia. In summer and spring, several air masses come from North Africa (cT) and cross the Mediterranean before entering the IP. In spring, the entrance of continental cool air masses coming from North of Europe (cP) occurs occasionally and provides the most positive δ18O values of this classification (Table 3). Interestingly, the other isotopic parameters, such as 17O-excess, appear with similar organization following the different sources and trajectories as the δ18O values (Table 3).
Meteorological Synoptic Patterns Analysis
Considering the four main meteorological patterns defined by Valenzuela et al. (2018) (graphical description in Supplementary Figure 2), a synoptic pattern has been assigned to every rainfall event at Villanúa (Supplementary Table 1).
The SAA pattern shows the presence of a strong Atlantic high-pressure system extended to the north of Azores and a low-pressure system over the Mediterranean Sea. It is characterized by polar and artic maritime air masses, frontal and post-frontal rainfall with high orographic forcing and moderate precipitation, and strong winds from the NW-N in all the troposphere over the IP. It has been identified in 44 out of 216 events along the whole year, although it is more common in winter and autumn that conforms around 25% of events (Table 4).
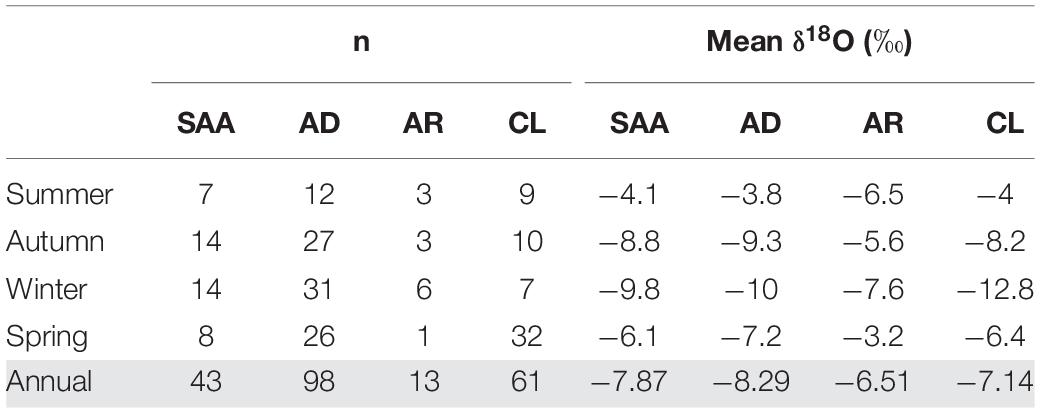
Table 4. Number of events (n) and average of δ18O values that correspond to the different synoptic patterns (SAA, AD, AR, and CL) analyzed for the 2-year monitoring period (annual) and specified for the different seasons.
The AD pattern is defined by the presence of one or several deep depressions near the Britannic Islands moving toward the East and a weak Azores high pressure system displaced southward. It is characterized by polar maritime air masses, frontal rainfall with moderate orographic forcing and moderate precipitation values, and very strong zonal winds in all the troposphere from the W-NW affecting the IP. This is the most common pattern at our study site, identified in 98 out of 216 events along the whole year, with maximum occurrence in winter and autumn representing 53 and 50% of the events, respectively (Table 4).
The AR pattern is defined by the presence of a strong Azores high pressure system, extended as a ridge, affecting the North IP. AR pattern is characterized by subtropical air masses, low stratiform orographic precipitation values associated with the tail-end of weak fronts, and weak winds from the W-NW-N in all the troposphere, affecting the IP. It has been identified in 13 events along the whole year with a greater occurrence in winter (Table 4).
The CL pattern represents the presence of a cut-off low extended down to the surface over or near the IP. It is characterized by a weak polar air mass surrounded by a subtropical air mass, producing an intense thermodynamic instability over the region, high convective precipitation values, and weak close-circulation winds in all the troposphere with predominance of N-NW components. CL pattern has been identified in 61 out of 216 events, occurring mainly in spring (with 47% of the events) and in summer (33% of the events) (Table 4).
δ18O values of rainfall events associated to every pattern are indicated in Table 4, where a strong influence of seasonality is observed. Although there are no large differences in the δ18O values between the different synoptic patterns, in general, events classified as SAA, AD and CL patterns show the more negative values, and events classified in AR pattern show the higher values. Summer is the exception to this rule when events associated with the AR pattern show the lowest δ18O values.
In Table 5, the relationships among synoptic patterns and the different trajectories are indicated. Thus, the SAA pattern is mostly associated with trajectories with Atlantic origin and NW directions, and the AD pattern is also fundamentally associated with trajectories of Atlantic origin but mostly from SW directions. AR pattern is associated with trajectories of more scattered directions, although trajectories with Atlantic origin and NW direction are the predominant ones. In contrast, CL pattern is related to trajectories of Mediterranean origin, although other trajectories are also observed. This pattern is also the most widely distributed throughout the year and at the same time the one with the least incidence in winter. Trajectories that occur more frequently in winter are predominantly related to the SAA and AD patterns, whereas trajectories that occur most frequently in summer are predominantly related to AD and CL patterns, thus indicating the role of both the meteorological situation (synoptic pattern) and the seasonality to explain the link between isotopic composition and air mass trajectory.
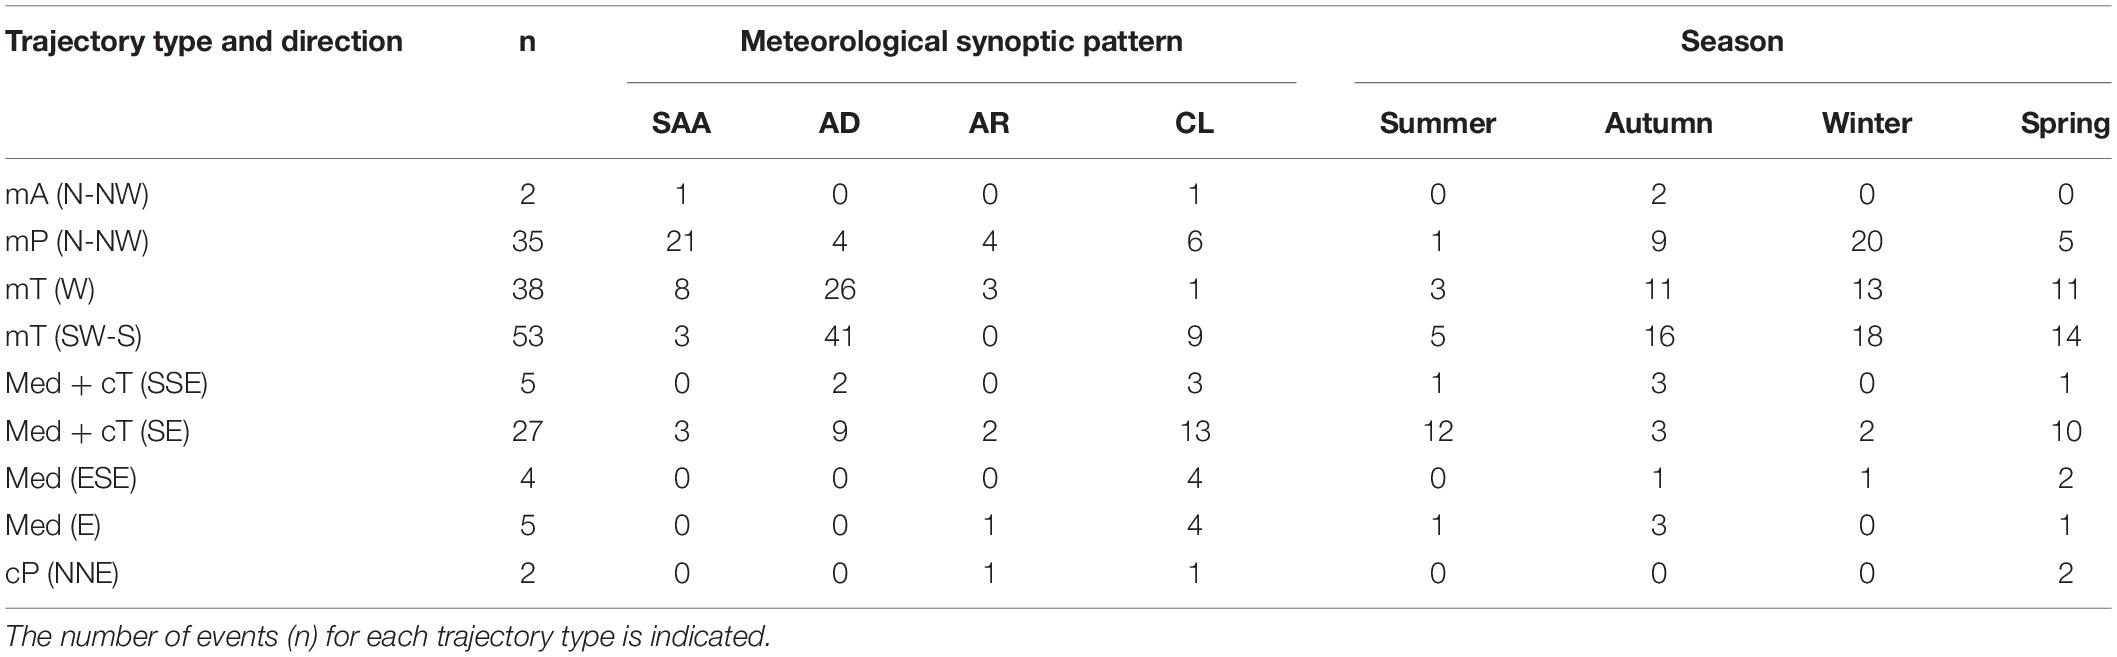
Table 5. Number of events that correspond to the different synoptic patterns analyzed and to the different seasons, indicated for each trajectory type and direction.
Discussion
Influence of Geographical Setting on Rainfall Isotopic Values in an Alpine Site
Mean rainfall isotope values collected in Villanúa site are in the range of previous studies from the IP but with generally lower δ18O values (Araguás-Araguás and Diaz Teijeiro, 2005). This is likely due to the altitudinal effect that influences precipitation isotope ratios at this particular site, compared with most of the available GNIP data from IP. The altitude effect is associated with the decreasing temperatures of condensation and to the progressive Rayleigh distillation as the air mass is lifted over an orographic barrier (Lachniet, 2009). δ18O values decrease with an increase in altitude and its consequent decrease in mean annual temperature along the mountain slope (Clark and Fritz, 1997). Indeed, mean rainfall δ18O values in Villanúa are similar to those found in other locations situated inland the IP at a relative high elevation (average altitude of 660 m) (δ18O ranging from −7 to −10‰) and that present a progressive depletion as distance to the coast and elevation increase, as a result of the continental effect (Araguás-Araguás and Diaz Teijeiro, 2005). δD values are between those found on the IP (δD ranging from −40 to −67‰) with a continental influence (Araguás-Araguás and Diaz Teijeiro, 2005). Similarly, mean d-excess values in Villanúa rainfall are in the range of the mean weighted values observed in rain samples over the IP (+7 to +14‰), which reflects the importance of Atlantic air masses as major factors controlling the isotope values over the IP (Araguás-Araguás and Diaz Teijeiro, 2005). The 17O-excess values are similar to those of mid-latitude rains analyzed in other studies (Luz and Barkan, 2010). The linear relationship described by the values of δ′17O and δ′18O in rainwater generates a slope of 0.524, slightly lower than the slope for rainwater at a global scale that is around 0.528 (Luz and Barkan, 2010) but similar to that one from waters slightly evaporated (Luz and Barkan, 2010; Aron et al., 2020).
Comparing these results with other rainfall isotopic studies from nearby Pyrenean sites, an altitude effect is clearly observed, with a decrease of isotopic values when altitude increases. This relation is shown in Figure 5 where mean δ18O value in Villanúa rainfall is compared with other nearby rainfall sampling sites located at different elevations. The lowest locality in Figure 5 is Borrastre where rainfall sampling site is located at 770 m a.s.l. Rainfall has been collected in Borrastre at per-event basis from June 2011 to May 2016 (Moreno et al., 2020). The weighted average of rainfall-event values is −6.9‰ for δ18O and −46.8‰ for δD (n = 373). δ18O and δD weighted average values in Villanúa (−8.6 and −60.1‰, respectively) are more negative than those found in Borrastre rainfall, according to their altitude difference. Other sites in Figure 5 (Góriz and Parador) are rainfall sampling sites located in PNOMP (Ordesa and Monte Perdido National Park), a high mountain area immediately north to Borrastre, where rainfall was sampled between 2014 and 2016 in Parador house and between 2013 and 2015 in Góriz mountain hut (Jódar et al., 2016). Although the averaged data from these four localities correspond to different periods, it is still possible to observe the elevation influence when comparing averaged δ18O values (Figure 5).
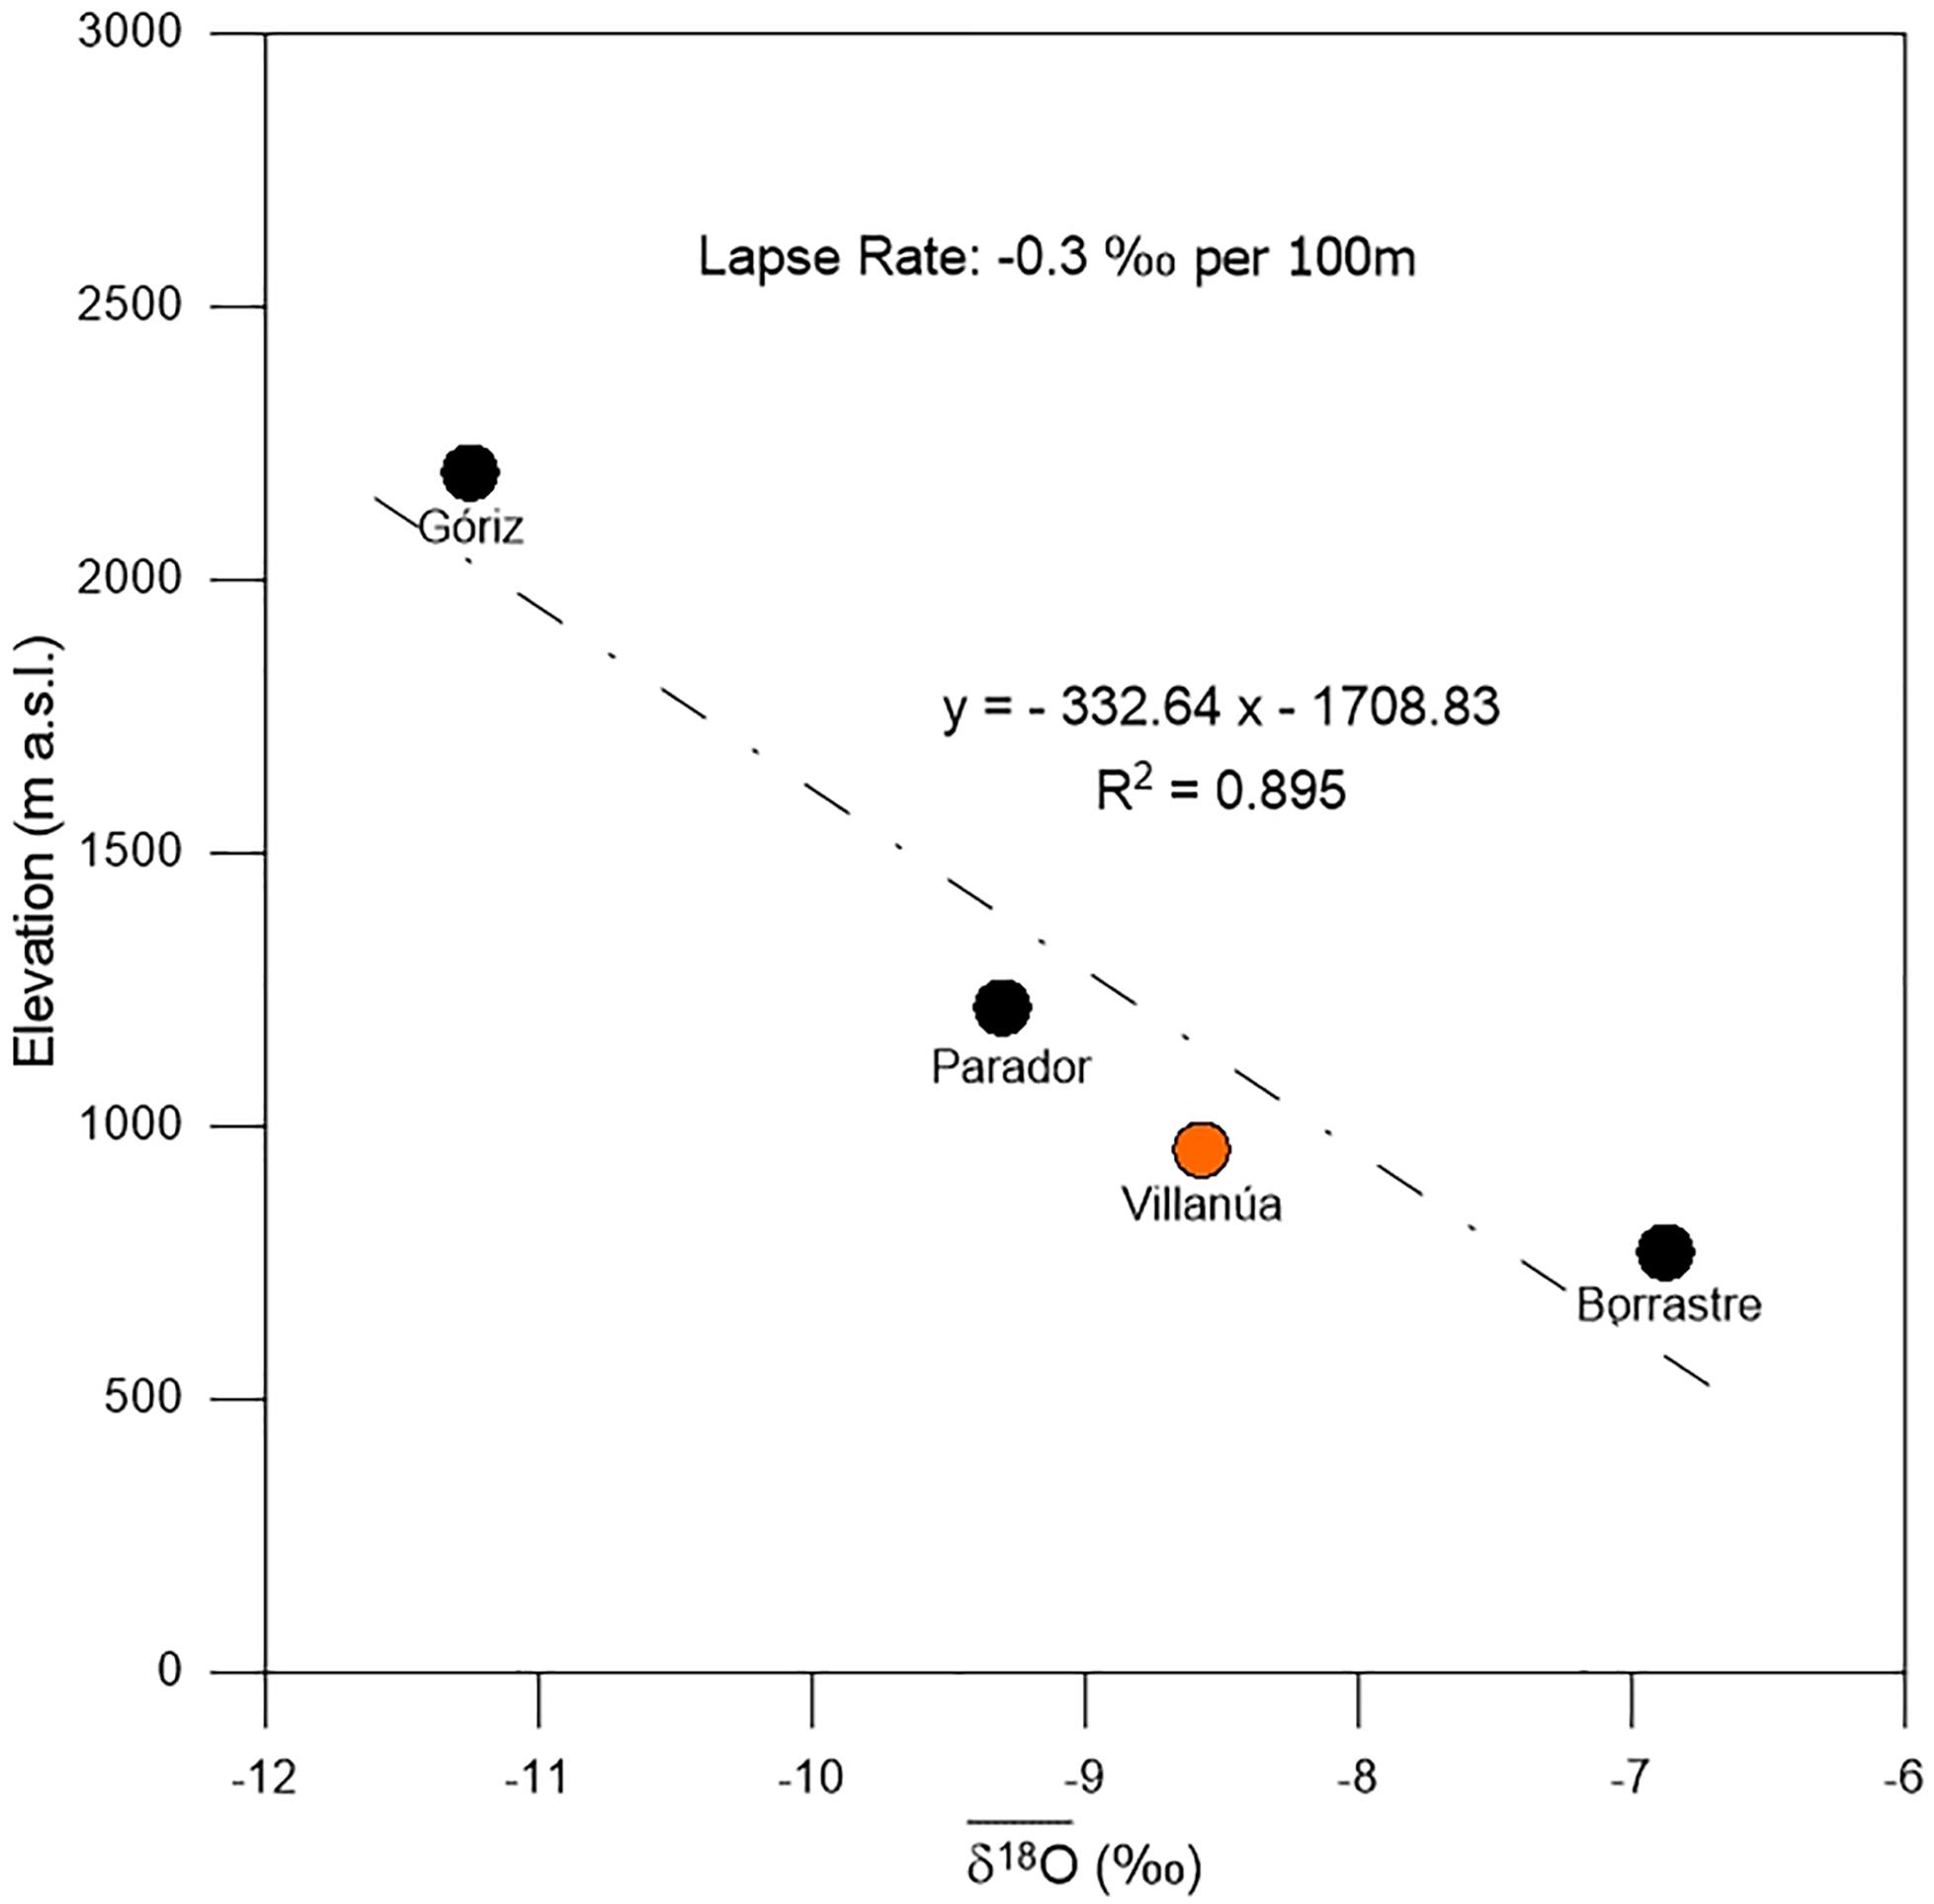
Figure 5. Relationship between elevation and δ18O of different rainfall sampling sites in Pyrenees. δ18O rainfall mean values are obtained by the weighted average of rain events values in Borrastre (n = 373) and Villanúa (n = 210). For Góriz and Parador, δ18O values of rainfall samples are seasonal averaged and calibrated with a sinusoidal equation (Jódar et al., 2016).
The elevation gradient determined from the comparison of Pyrenean δ18O data is −0.3‰ per 100 m (Figure 5), similar to values found in other areas in Spain (Julian et al., 1992; Andreo et al., 2004), the same value that is found in most mountain areas in the Alps (∼0.3‰ per 100 m) (Poage and Chamberlain, 2001 and references therein) and consistent with the gradient values from most mountain regions of the world (∼0.28‰ per 100 m) (Poage and Chamberlain, 2001). Nevertheless, this comparison has some limitations. One limitation resides in the fact that rainfall data from the presented sampling sites correspond to different periods. In addition, the particular location of Borrastre, due to its eastern position with a greater influence of the Mediterranean climate and further away from the highest orographic barriers located northwards, shows slightly more positive δ18O values than those occurring if only elevation was considered (Figure 5).
Meteorological Controls on the δ18O Variability of Rainfall
The meteorological parameters at the studied site control the isotopic composition through different effects. Condensation of atmospheric vapor that forms clouds is an equilibrium process where the heaviest isotope is preferentially incorporated into the liquid phase, leading to the isotopic depletion of the remaining vapor. This process of progressive condensation and lowering of precipitation isotopic ratios is known as Rayleigh distillation, an effect that is mediated by surface air temperature (Clark and Fritz, 1997; Lachniet, 2009). The isotopic composition of Villanúa rainfall is strongly dependent on air temperature, leading to more negative δ18O values in winter and more positive in summer (Figure 3A) and thus indicating a seasonal variation. The observed correlation between δ18O and air temperature at event scale is also verified at monthly scale with weighted averaged values (rs = 0.7; p-value = 3.9 × 10⁻⁵; n = 24) (see monthly values in Supplementary Table 3). The same relationship is found at yearly scale, thus supporting this dependence on air temperature. Other important control on δ18O rainfall composition is the amount effect, which is defined as the observed decrease in rainfall δ values with increased rainfall amount (Dansgaard, 1964; Rozanski et al., 1993; Bony et al., 2008; Risi et al., 2008). In Villanúa, the “amount effect” modulates δ rainfall values as observed in the isotopic lightening during the longest lasting rainfall events (e.g., event of October 19, 2017, δ18O = −11.64‰; event of December 10–11, 2017, δ18O = −20.36‰; event of October 31, 2018, δ18O = −18.6‰; and the isotopic decrease after 9 days of rain from May 30, 2018 to June 07, 2018) (Figure 3). It is also worth to highlight the influence of the amount effect on rainfall isotope values during summer, when the positive isotopic characteristics of the few events that occur are only interrupted by low values corresponding to a heavy rain event (event of August 23, 2018, 45 mm of precipitation in 2 h, δ18O = −9.23‰). The mechanisms underlying the amount effect of this summer precipitation events are tightly related to convective processes (Risi et al., 2008). The strong climatic seasonality of the study area has an important influence on the correlations with isotopic signal in precipitation that show an annual cycle (Table 2). Temperature controls strongly the isotopic composition of rainfall, whereas rainfall amount modulates this composition, both factors strongly depending on the seasonality. In order to explore the variability controlled by the combination of these two parameters, we conducted a multiple regression model on event precipitation δ18O data (n = 210). This analysis results in the following equation:
where T (°C) is the event averaged temperature and p (mm) is the event rainfall amount. This exercise supports the dominant role of temperature, whereas the amount effect is likely important during specific rain events (Figure 3). There is a moderate negative correlation of isotopic ratios with RH that for δ18O is only significant in winter and spring (Table 2). This negative correlation is inherent to the fact that δ18O correlates positively with temperature that at the same time correlates negatively with RH. Winter is the only season when a real dependence between temperature and RH is shown. There is also a strong correlation between RH and wind speed suggesting an important role of the wind on RH variations during this period (Supplementary Table 2).
Moisture Source Effect Revealed by Backward-Trajectory Analysis and Synoptic Patterns
Besides temperature and rainfall amount, the moisture source also controls the isotope composition of precipitation at event timescale (Krklec and Domínguez-Villar, 2014; Moreno et al., 2014). The source effect depends on the isotope composition of the different ocean surface waters, the different conditions of temperature and RH at the source, and also on varying air mass histories when moisture uptake takes place. Different paths followed by air masses, derived from different moisture sources, control the isotopic values of the rainfall events. The effect of seasonality is particularly relevant in the IP since the two dominant sources of moisture exert their influence on a different season. The Atlantic source is dominant in winter, whereas the Mediterranean source occurs mainly in summer. In consequence, backward-trajectory analysis clearly shows that Villanúa receives atmospheric moisture from two dominant sources: The Atlantic Ocean that provides lower δ18O values in precipitation and the Mediterranean Sea that provides enriched values (Table 3). This situation was previously evidenced in other IP sites by several authors (Celle-Jeanton et al., 2001; Araguás-Araguás and Diaz Teijeiro, 2005).
The analysis of stable isotopes in rainfall and backward trajectory of air masses enables to differentiate the two dominant moisture sources and several frequent trajectories (Table 3). Thus, analyzing the isotope values of rainfall coming from the different trajectories, a clear change of rainfall δ18O values is observed, going from more negative values associated to the northern and northwestern trajectories to less negative values when the trajectories come from the south, southeast, and finally northeast (Table 3). This is certainly the reflect of a gradual mixing of sources, with Atlantic source being the more negative one and the continental air trajectories coming from Northern Europe the less negative one (Table 3). The δ18O variation reflects a parallel evolution with air temperature associated with both the decrease in the latitudinal trajectory of the air masses and its temporal occurrence. The seasonal variation correlates with several parameters and with rainfall δ18O content around the year and is also related to the source. Therefore, the Mediterranean influence takes place in summer, when the temperature is higher and leads to more positive rainfall δ18O values. Fewer Mediterranean rain events occur compared with the occurrence of Atlantic rains (70% of events throughout the year). However, the influence of Mediterranean source is noticeable because of the high amount of rain provided in each event (Table 3).
Considering the trajectories with an Atlantic source, an increase of δ18O values when the source is moving southwards is observed (Table 3). This δ18O increase occurs in parallel to the increase of the distance traveled over land since the air masses cross over the entire IP before reaching the Pyrenees. The δ18O values increase associated to the contribution of re-evaporated land moisture to the water vapor moving inland, as already observed by Krklec and Domínguez-Villar (2014). Owing to this inland contribution, rains with an Atlantic origin present a notable δ18O variability (variation range of 20‰), whereas rainfall events originated in the Mediterranean, with shorter distances traveled over the IP, present a lower δ18O variation range (10.1‰). Otherwise, the scarce continental air trajectories coming from North of Europe throw the most enriched δ18O values (−2.96 ± 0.33‰) (Table 3), likely due to the inland contribution of re-evaporated moisture, as found in other regions where the trajectories are really long and there is incorporation of recycled moisture (Chakraborty et al., 2016).
The different types of trajectories obtained in this classification appear associated to one of the synoptic patterns obtained (Table 5), indicating the important role the meteorological situation is playing on controlling the influence of air mass trajectory on rainfall isotopic composition. As trajectories change from Atlantic origin to Mediterranean origin, the occurrence of synoptic patterns also changes from SAA and AD conditions to AR and CL patterns, so the influence of the trajectory on the rainfall δ18O values is certainly mediated by the meteorological situation.
Controls on 17O-Excess and d-Excess: Source Effect vs. RH
The d-excess and 17O-excess records of Villanúa rainwaters are correlated during some periods; however, some opposite pattern can be observed in some intervals, such as during spring–summer 2018 (Figure 3B). These differences suggest that different mechanisms control the d-excess and 17O-excess variabilities. Both parameters are largely determined by kinetic effects during evaporation of the sea water. Detailed analyses have shown that d-excess is influenced by surface air temperature and RH at the moisture source (Merlivat and Jouzel, 1979), whereas 17O-excess in rainfall is mainly control by the RH of the atmosphere at the boundary layer where evaporation occurs, while the effect of temperature is negligible (Tian et al., 2018; Uechi and Uemura, 2019).
Previous studies on 17O-excess during the water evaporation process have shown that the water vapor acquires higher values of 17O-excess, whereas the liquid phase presents negative values as the volume of water decreases (Luz and Barkan, 2010). Higher RH values generate water vapor with lower 17O-excess, whereas when sea surface evaporation occurs under conditions of lower RH, the expected 17O-excess value in the vapor is higher (Uechi and Uemura, 2019). During the condensation of water vapor in the clouds, there is hardly any change in the value of 17O-excess. Therefore, precipitation should reflect moisture source 17O-excess values (Uechi and Uemura, 2019) that at the same time, depend on the RH at the moisture source that controls the amount of 17O-excess gained during sea surface evaporation. Hence, 17O-excess values in precipitation increase when evaporation occurs in more arid conditions (i.e., lower RH) at the moisture source. In consequence, a negative correlation between the 17O-excess of rainfall and RH at the moisture source would be expected. This behavior has been observed in a detailed study on rainfall isotopes collected on Okinawa subtropical island, where there is an inverse relationship between 17O-excess and RH with the lowest RH occurring in winter (Uechi and Uemura, 2019). These authors claimed that RH measured in Okinawa at the sampling site is similar to that at the moisture source, and that the variability in the rainwater 17O-excess reflects seasonal changes in seasonal RH during the evaporation process (Figure 6A).
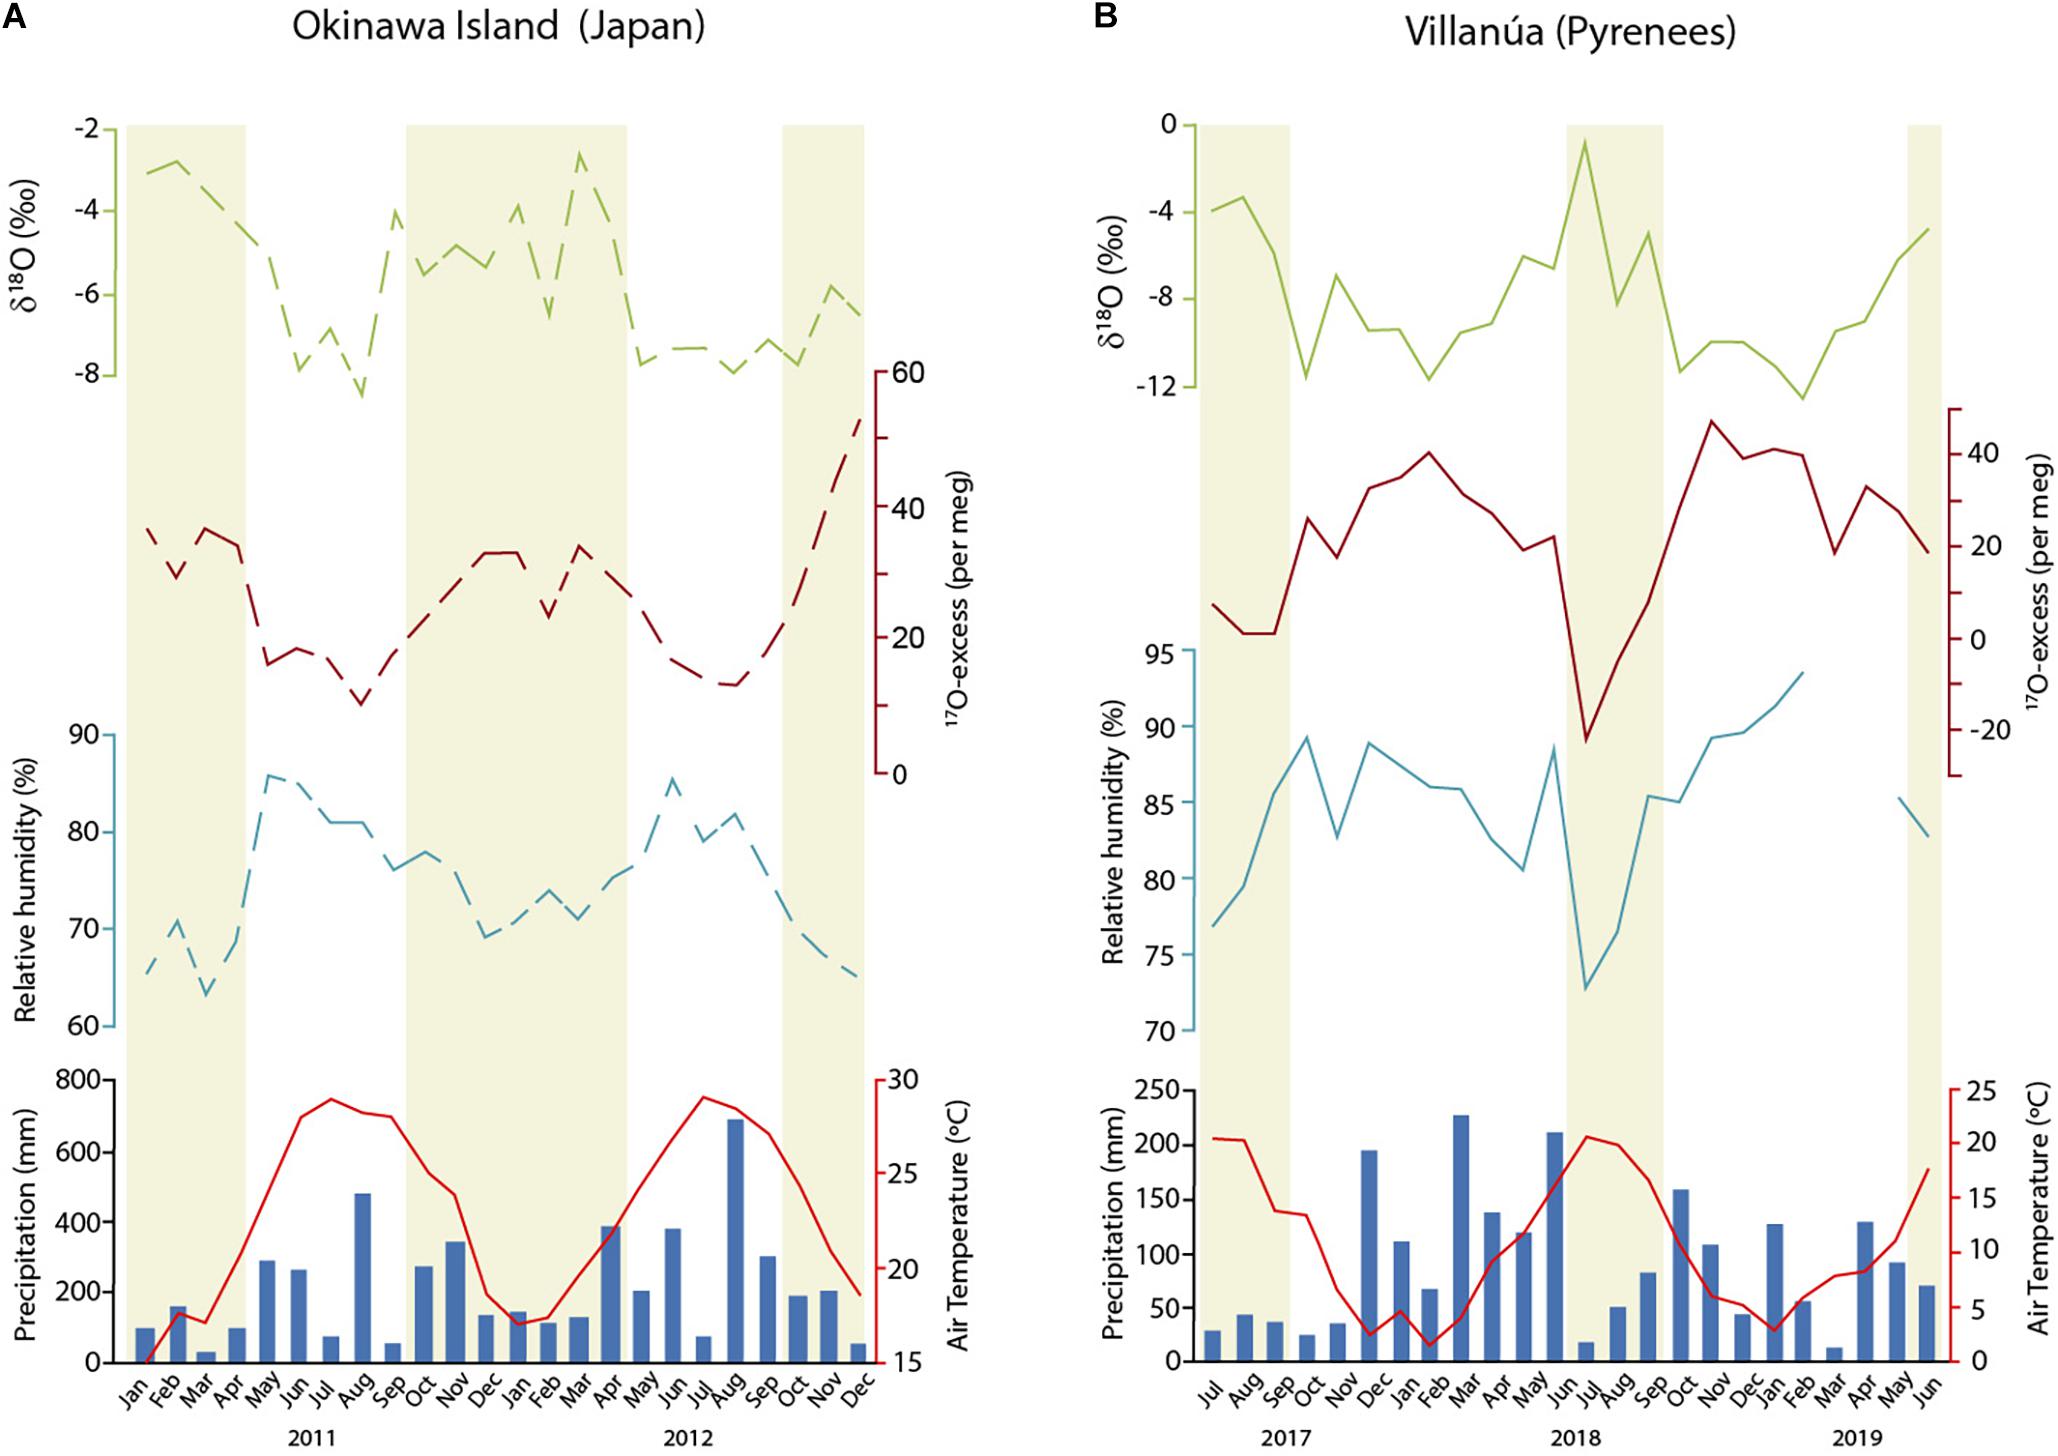
Figure 6. Temporal variation of monthly precipitation-weighted average values of δ18O and 17O-excess and meteorological data (monthly RH, monthly precipitation amount, and monthly mean air temperature) (A) at Okinawa Island (modified from Uechi and Uemura, 2019) and (B) at Villanúa (average RH of the rainfall events for every month). Shaded areas indicate time periods of low RH.
Although the RH values in the moisture source have not been identified for our study, a variation in the origin of the source has been revealed by the analysis of the backward trajectories. A variation throughout the year for 17O-excess values has also been determined, showing a decrease as the trajectories change from Atlantic sources in winter to Mediterranean sources in summer (Table 3). Villanúa sampling site has a rainfall pattern characterized by rains that occur mostly in cold and transition periods, when the highest RH in the source (Atlantic origin) occurs. Thus, it would be expected that rains will present lower 17O-excess values in winter–spring, when the RH is higher, and higher 17O-excess values in summer, with lower RH. However, the opposite pattern is observed: 17O-excess values of precipitation in Villanúa are higher during the humid period than during the dry period (summer) (Figure 6B). This contrasts with the observations of Uechi and Uemura (2019) in Okinawa Island. In contrast, the positive correlation between 17O-excess and RH is in agreement with the pattern observed in precipitation of West Africa (Landais et al., 2010). These authors found that, under lower RH conditions, rainwater shows lower 17O-excess values, interpreted as a result of re-evaporation of rainwater droplets in a dry air column.
The positive correlation between the RH and 17O-excess points to a raindrop evaporation effect, as that observed in West Africa (Landais et al., 2010). In a raindrop re-evaporation model (Bony et al., 2008) when the RH is low, kinetic effects during rain evaporation are enhanced, and thus the vapor has a higher 17O-excess, leaving a progressively lower 17O-excess in the remaining rain water. Therefore, when the RH in the precipitation site is low, a raindrop evaporation effect occurs resulting in a fractionation process that decreases precipitation 17O-excess. This means that, during the dry months, 17O-excess rising during evaporation from the source may be balanced by 17O-excess lowering in raindrop evaporation. Therefore, during the driest periods in the Pyrenees and when the RH is lower (summer), the values of the 17O-excess in the rain will be more negative, whereas, in the winter rains, when the RH is high, the secondary evaporation of the raindrops is reduced, and 17O-excess values are higher. Consequently, 17O-excess in rainwater in the studied area is controlled by two parameters: (1) changes in the RH in the source where the moisture is generated, which is mainly from Atlantic origin and (2) the humidity conditions at the time of precipitation in the surroundings of the rainfall sampling site. Unlike the study of Uechi and Uemura (2019), the results of Villanúa suggest that the RH at local scale controls the variability of 17O-excess in the rainfall of this region, in agreement with the results of the African rains of Landais et al. (2010). Precipitation 17O-excess in Villanúa shows a positive correlation with RH at the sampling site (Figure 7A) although this correlation is only found when analyzed at an annual scale (Table 2). Additionally, RH variation occurs on a sub-seasonal scale conditioned by factors that occur on this scale, such as wind speed. In this regard, the geographical conditions of the sampling site with an important Föhn effect facilitate the important role of the wind throughout the year in reducing the RH. As for the relationship between 17O-excess and d-excess, there is a weak correlation between both parameters (R2 = 0.16), but this correlation is strong and significant considering only summer data (R2 = 0.55; with a slope of 1.3 per meg%–1), suggesting that in this period, the variability of 17O-excess and d-excess is controlled by processes that have a similar impact on both parameters: i.e., either RH at the moisture source or RH during rain evaporation.
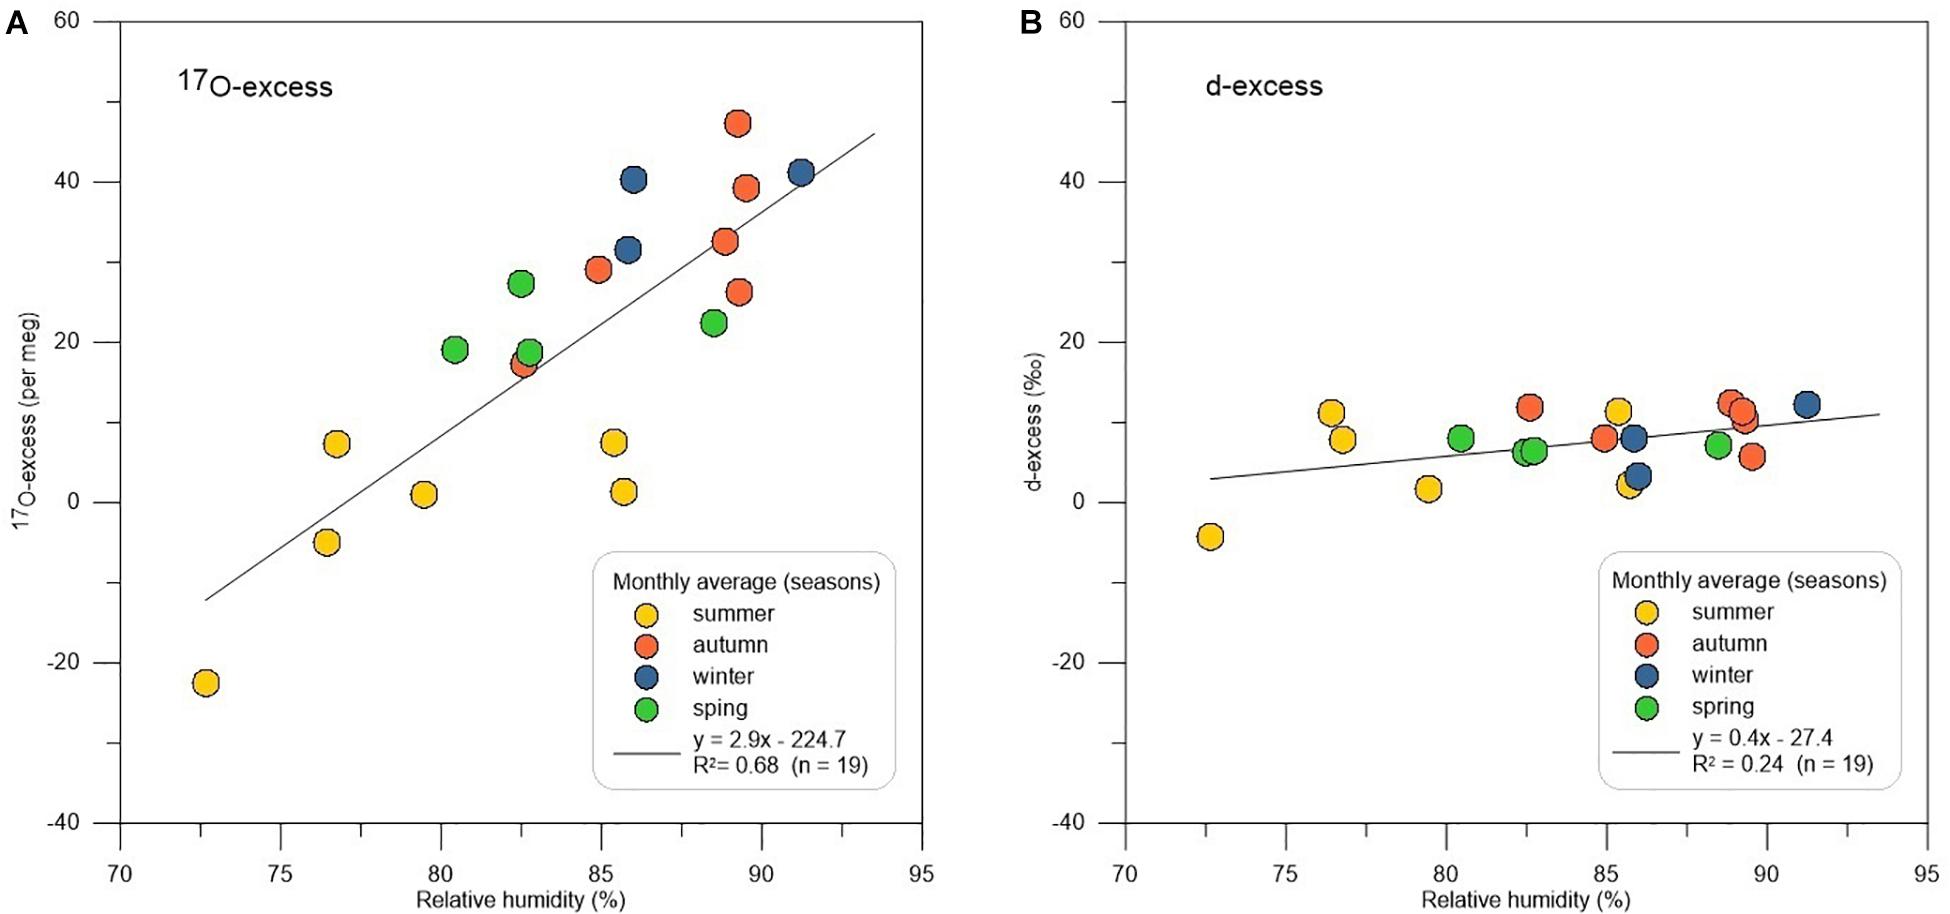
Figure 7. (A) Monthly 17O-excess precipitation variation versus RH at the sampling site. (B) Monthly d-excess precipitation variation versus RH at the sampling site.
The relationship between 17O-excess and RH at event scale (rs = 0.37; p-value = 1.13e–05) is slightly higher than the relationship between d-excess and RH (rs = 0.30; p-value = 0.00092). The slopes of the 17O-excess vs. RH and d-excess vs. RH linear relationships are also very different. At monthly scale this behavior is also shown (Figure 7). These results suggest that other factors besides re-evaporation processes, such as the origin of air masses or fractionation processes along the distillation pathway from the evaporation sources (continental recycling), were contributing to the evolution of d-excess. Monitoring of triple oxygen and hydrogen isotopes in rainwater and water vapor at sites closer to the moisture sources (Atlantic Ocean vs. Mediterranean Sea) may shed light on the importance of local RH and moisture sources changes on the isotopic composition of precipitation in the Pyrenees. Monitoring the water vapor will allow to directly quantify the effect of rain evaporation and to better understand controlling factors.
Conclusion
We present the first database of triple oxygen and hydrogen stable isotopes of precipitation events in the Pyrenees. Main regional and local factors controlling the isotopic composition of rainwater have been explored. Our results show the importance of an altitude effect on the isotopic composition of rainfall, when comparing mean δ18O and δD values with other Pyrenean sites. As for local controls, temperature has been identified as the main factor controlling δ18O and δD of rainfall and determines their seasonal variability. Rainfall amount only exerts a noticeable control in summer, when convective storms take place in the Pyrenees. Backward-trajectory analysis shows that Villanúa receives atmospheric moisture from two different sources, the Atlantic Ocean and the Mediterranean Sea, although the Atlantic source supplies ∼75% of the total precipitation amount. Rainfall events with Atlantic origin show lower δ18O values, whereas they are less negative when the trajectory indicates a Mediterranean source. Additionally, the different identified synoptic patterns are associated to the described trajectories, thus also influencing the rainfall isotopic values.
Based on previous theoretical and empirical studies that demonstrate that 17O-excess of rainwater is controlled by the surface RH at the moisture source, we suggest that 17O-excess in precipitation at our study site is controlled by the RH, both at the humidity source (ocean) and local air column at the time of precipitation. The lowest 17O-excess values in summer, when the RH is low in the Pyrenees, suggest an important effect of the re-evaporation of raindrops, as has been observed in West Africa. This indicates that 17O-excess may be a good proxy of aridity conditions in this area at different time scales. Additional analysis of the RH conditions at the moisture source and its changes along the trajectories would be very useful to further understand the effect controlling the precipitation 17O-excess. Equally, monitoring the water vapor at the rainfall site would allow to directly quantifying the effect of rain evaporation.
This new dataset of triple oxygen and hydrogen isotopes of rainfall is helpful to fully understand the influence of atmospheric features in isotopic rainfall composition at local and regional scales and can be highly useful for further interpretation of paleoclimate records based on isotopic data in this region.
Data Availability Statement
The original contributions presented in the study are included in the article/Supplementary Material, further inquiries can be directed to the corresponding author/s.
Author Contributions
MB and AM planned the structural work and the samples collection. RG performed the collection of rainfall samples and processed the meteorological data. FG performed stable isotope analyses. MI performed the analysis of the air masses backward trajectories and the meteorological synoptic patterns analysis. RG wrote the manuscript, with significant contributions by all the authors and drew all the figures with contributions by all the authors. All authors contributed to the data processing, result discussion, and final interpretation, reviewed the manuscript, and approved its submission to Frontiers in Earth Sciences.
Conflict of Interest
The authors declare that the research was conducted in the absence of any commercial or financial relationships that could be construed as a potential conflict of interest.
Funding
This work was supported by the Spanish Government and the European Regional Development Funds [projects CGL2016-77479-R (SPYRIT) and PID2019-106050RB-I00 (PYCACHU)] and Villanúa Council economical support. MB was supported by a postdoctoral fellowship in the Juan de la Cierva Formation program provided by the Spanish Ministry of Science (ref.: FJCI-2017-31725). FG was financially supported by the “HIPATIA” research program of the University of Almería. We acknowledge support of the publication fee by the CSIC Open Access Publication Support Initiative through its Unit of Information Resources for Research (URICI).
Acknowledgments
We thank Sandra Brunet, Alberto Zárate, Maria José Ezquerra, and Lope Ezquerro for their help with rainfall sampling. We are indebted to DGT (Dirección General de Tráfico) and CHE (Confederación Hidrográfica del Ebro) for climatic data from Villanúa and Canfranc. We are also grateful to CR and ML for their helpful comments and constructive criticism that improved the manuscript.
Supplementary Material
The Supplementary Material for this article can be found online at: https://www.frontiersin.org/articles/10.3389/feart.2021.633698/full#supplementary-material
Supplementary Figure 1 | Hundred and twenty hour backward-trajectory analysis at 850 hPa for each precipitation event of this study, clustered by seasons. Earth model from Google Earth.
Supplementary Figure 2 | Graphical description of the four meteorological patterns associated with rainfall events in Villanúa during the study period, using maps of 300 hPa geopotential height and 500 hPa (right column) and sea level pressure and 850 hPa temperature (left column). SAA, Strong Atlantic Anticyclone pattern. AD, Atlantic Depression pattern. AR, Anticyclonic Ridge pattern, and CL, Cut-off Low pattern.
Footnotes
References
Andreo, B., Liñán, C., Carrasco, F., Jiménez de Cisneros, C., Caballero, F., et al. (2004). Influence of rainfall quantity on the isotopic composition (18O and 2H) of water in mountainous areas. application for groundwater research in the yunquera-nieves karst aquifers (S Spain). Appl. Geochem. 19, 561–574. doi: 10.1016/j.apgeochem.2003.08.002
Angert, A., Cappa, C. D., and DePaolo, D. J. (2004). Kinetic 17O effects in the hydrologic cycle: indirect evidence and implications. Geochimica et Cosmochimica Acta 68, 3487–3495. doi: 10.1016/j.gca.2004.02.010
Araguás-Araguás, L. J., and Diaz Teijeiro, M. F. (2005). “Isotope composition of precipitation and water vapour in the Iberian Peninsula,” in Isotopic Composition of Precipitation in the Mediterranean Basin in Relation to air Circulation Patterns and Climate, (Vienna: International Atomic Energy Agency), 173–191.
Aron, P. G., Levin, N. E., Beverly, E. J., Huth, T. E., Passey, B. H., Pelletier, E. M., et al. (2020). Triple oxygen isotopes in the water cycle. Chem. Geol. 563: 120026.
Baldini, L. M., McDermott, F., Baldini, J. U. L., Fischer, M. J., and Möllhoff, M. (2010). An investigation of the controls on Irish precipitation δ18O values on monthly and event timescales. Clim. Dyn. 35, 977–993. doi: 10.1007/s00382-010-0774-6
Barkan, E., and Luz, B. (2005). High precision measurements of 17O/16O and 18O/16O ratios in H2O. Rapid Commun. Mass Spectrom. 19, 3737–3742. doi: 10.1002/rcm.2250
Barkan, E., and Luz, B. (2007). Diffusivity fractionations of HO/HO and HO/HO in air and their implications for isotope hydrology. Rapid Commun. Mass Spectrom. 21, 2999–3005. doi: 10.1002/rcm.3180
Bershaw, J., Penny, S. M., and Garzione, C. N. (2012). Stable isotopes of modern water across the Himalaya and eastern Tibetan Plateau: implications for estimates of paleoelevation and paleoclimate. J. Geophys. Res. Atmos. 117:2110.
Bony, S., Risi, C., and Vimeux, F. (2008). Influence of convective processes on the isotopic composition (δ18O and δD) of precipitation and water vapor in the tropics: 1. radiative-convective equilibrium and Tropical Ocean–Global atmosphere–coupled ocean-atmosphere response experiment (TOGA-COARE) simulations. J. Geophys. Res. Atmos. 113:D19306.
Celle-Jeanton, H., Travi, Y., and Blavoux, B. (2001). Isotopic typology of the precipitation in the Western Mediterranean Region at three different time scales. Geophys. Res. Lett. 28, 1215–1218. doi: 10.1029/2000gl012407
Chakraborty, S., Sinha, N., Chattopadhyay, R., Sengupta, S., Mohan, P. M., and Datye, A. (2016). Atmospheric controls on the precipitation isotopes over the Andaman Islands. Bay Bengal. Sci. Rep. 6:19555.
Clark, I. D., and Fritz, P. (1997). Environmental Isotopes in Hydrogeology. Baco Raton, FL: CRC Press.
Craig, H. (1961). Isotopic variations in meteoric waters. Science 133, 1702–1703. doi: 10.1126/science.133.3465.1702
Dansgaard, W. (1964). Stable isotopes in precipitation. Tellus 16, 436–468. doi: 10.1111/j.2153-3490.1964.tb00181.x
Draxler, R. R., and Rolph, G. D. (2010). HYSPLIT (HYbrid Single-Particle Lagrangian Integrated Trajectory) Model Access via Noaa Arl Ready. Available online at: http://ready.arl.noaa.gov/HYSPLIT.php. [Accessed November 23, 2017]
Gimeno, L., Nieto, R., Trigo, R. M., Vicente-Serrano, S. M., and López-Moreno, J. I. (2010). Where does the iberian peninsula moisture come from? an answer based on a lagrangian approach. J. Hydrometeorol. 11, 421–436. doi: 10.1175/2009jhm1182.1
Hammer, Ø., Harper, D. A. T., and Ryan, P. D. (2001). PAST: paleontological statistics software package for education and data analysis. Palaeontologia Electronica 4, 1–9.
Jódar, J., Custodio, E., Lambán, L. J., Martos-Rosillo, S., Herrera-Lameli, C., and Sapriza-Azuri, G. (2016). Vertical variation in the amplitude of the seasonal isotopic content of rainfall as a tool to jointly estimate the groundwater recharge zone and transit times in the Ordesa and Monte Perdido National Park aquifer system, north-eastern Spain. Sci. Total Environ. 573, 505–517. doi: 10.1016/j.scitotenv.2016.08.117
Julian, J. C.-S., Araguas, L., Rozanski, K., Benavente, J., Cardenal, J., Hidalgo, M. C., et al. (1992). Sources of precipitation over South-Eastern Spain and groundwater recharge. Isotopic Study. Tellus B 44, 226–236. doi: 10.1034/j.1600-0889.1992.t01-2-00005.x
Krklec, K., and Domínguez-Villar, D. (2014). Quantification of the impact of moisture source regions on the oxygen isotope composition of precipitation over Eagle cave, central Spain. Geochim. Cosmochim. Acta 134, 39–54. doi: 10.1016/j.gca.2014.03.011
Lachniet, M. S. (2009). Climatic and environmental controls on speleothem oxygen-isotope values. Quat. Sci. Rev. 28, 412–432. doi: 10.1016/j.quascirev.2008.10.021
Landais, A., Risi, C., Bony, S., Vimeux, F., Descroix, L., Falourd, S., et al. (2010). Combined measurements of 17Oexcess and d-excess in African monsoon precipitation: implications for evaluating convective parameterizations. Earth Planet. Sci. Lett. 298, 104–112. doi: 10.1016/j.epsl.2010.07.033
Lionello, P., Malanotte-Rizzoli, P., Boscolo, R., Alpert, P., Artale, V., Li, L., et al. (2006). “The mediterranean climate: an overview of the main characteristics and issues,” in Developments in Earth and Environmental Sciences Mediterranean, eds P. Lionello, P. Malanotte-Rizzoli, and R. Boscolo (Amsterdam: Elsevier).
Luz, B., and Barkan, E. (2010). Variations of 17O/16O and 18O/16O in meteoric waters. Geochim. Cosmochim. Acta 74, 6276–6286. doi: 10.1016/j.gca.2010.08.016
Martín, F. L., Millet, M. C., and Prats, J. M. C. (2007). Atlas climático de Aragón. Diputación General de Aragón. Available online at: https://dialnet.unirioja.es/servlet/libro?codigo=281219 [accessed November 6, 2020].
Merlivat, L., and Jouzel, J. (1979). Global climatic interpretation of the deuterium-oxygen 18 relationship for precipitation. J. Geophys. Res. Oceans 84, 5029–5033. doi: 10.1029/jc084ic08p05029
Moreno, A., Iglesias, M., Azorin-Molina, C., Pérez-Mejías, C., Bartolomé, M., Sancho, C., et al. (2020). Spatial variability of northern Iberian rainfall stable isotope values: investigating climatic controls on daily and monthly timescales. Atmos. Chem. Phys. Discuss. [Preprint], doi: 10.5194/acp-2020-861.
Moreno, A., Sancho, C., Bartolomé, M., Oliva-Urcia, B., Delgado-Huertas, A., Estrela, M. J., et al. (2014). Climate controls on rainfall isotopes and their effects on cave drip water and speleothem growth: the case of Molinos cave (Teruel. NE Spain). Clim. Dyn. 43, 221–241. doi: 10.1007/s00382-014-2140-6
Peel, M. C., Finlayson, B. L., and McMahon, T. A. (2007). Updated world map of the Köppen-Geiger climate classification. Hydrol. Earth Syst. Sci. 11, 1633–1644. doi: 10.5194/hess-11-1633-2007
Poage, M. A., and Chamberlain, C. P. (2001). Empirical relationships between elevation and the stable isotope composition of precipitation and surface waters: considerations for studies of paleoelevation change. Am. J. Sci. 301, 1–15. doi: 10.2475/ajs.301.1.1
Risi, C., Bony, S., and Vimeux, F. (2008). Influence of convective processes on the isotopic composition (δ18O and δD) of precipitation and water vapor in the tropics: 2. Physical interpretation of the amount effect. J. Geophys. Res. Atmos. 113, 1–12.
Risi, C., Landais, A., Bony, S., Jouzel, J., Masson-Delmotte, V., and Vimeux, F. (2010). Understanding the 17O excess glacial-interglacial variations in Vostok precipitation. J. Geophys. Res. Atmos. 115:D10112.
Rozanski, K., Araguás-Araguás, L., and Gonfiantini, R. (1993). Isotopic patterns in modern global precipitation. Geophys. Monogr. Ser. 78, 1–36. doi: 10.1029/gm078p0001
Schoenemann, S. W., Schauer, A. J., and Steig, E. J. (2013). Measurement of SLAP2 and GISP δ17O and proposed VSMOW-SLAP normalization for δ17O and 17Oexcess. Rapid Commun. Mass Spectrom. 27, 582–590. doi: 10.1002/rcm.6486
Steig, E. J., Gkinis, V., Schauer, A. J., Schoenemann, S. W., Samek, K., Hoffnagle, J., et al. (2014). Calibrated high-precision <sup>17</sup>O-excess measurements using cavity ring-down spectroscopy with laser-current-tuned cavity resonance. Atmos. Meas. Tech. 7, 2421–2435.
Tian, C., Wang, L., Kaseke, K. F., and Bird, B. W. (2018). Stable isotope compositions (δ 2 H, δ 18 O and δ 17 O) of rainfall and snowfall in the central United States. Sci. Rep. 8:6712.
Uechi, Y., and Uemura, R. (2019). Dominant influence of the humidity in the moisture source region on the 17O-excess in precipitation on a subtropical island. Earth Planet. Sci. Lett. 513, 20–28. doi: 10.1016/j.epsl.2019.02.012
Keywords: rainfall events, water isotopes, cpsdummy17O-excess, Pyrenees, triple oxygen isotopes, mountain climate, environmental monitoring, Iberian Peninsula
Citation: Giménez R, Bartolomé M, Gázquez F, Iglesias M and Moreno A (2021) Underlying Climate Controls in Triple Oxygen (16 O, 17 O, 18 O) and Hydrogen (1 H, 2 H) Isotopes Composition of Rainfall (Central Pyrenees). Front. Earth Sci. 9:633698. doi: 10.3389/feart.2021.633698
Received: 25 November 2020; Accepted: 08 March 2021;
Published: 21 May 2021.
Edited by:
Ramanathan Alagappan, Jawaharlal Nehru University, IndiaReviewed by:
Markus Christian Leuenberger, University of Bern, SwitzerlandCamille Risi, UMR 8539 Laboratoire de Météorologie Dynamique (LMD), France
Copyright © 2021 Giménez, Bartolomé, Gázquez, Iglesias and Moreno. This is an open-access article distributed under the terms of the Creative Commons Attribution License (CC BY). The use, distribution or reproduction in other forums is permitted, provided the original author(s) and the copyright owner(s) are credited and that the original publication in this journal is cited, in accordance with accepted academic practice. No use, distribution or reproduction is permitted which does not comply with these terms.
*Correspondence: Ana Moreno, YW1vcmVub0BpcGUuY3NpYy5lcw==; Reyes Giménez, cmVpZXNnaW1lbmV6QGdtYWlsLmNvbQ==