 Xinyi Guo
 Bihong Fu1*
 Jie Du
 Pilong Shi
- 1Key Laboratory of Digital Earth Science, Aerospace Information Research Institute, Chinese Academy of Sciences, Beijing, China
- 2University of Chinese Academy of Sciences, Beijing, China
- 3Jiuzhaigou Administration Bureau, Sichuan, China
Monitoring the change of post-seismic landslides could provide valuable information for geological disaster treatment. The 2017 Jiuzhaigou Ms 7.0 earthquake has triggered a large number of landslides in the Jiuzhaigou United Nations Educational, Scientific and Cultural Organization (UNESCO) Natural Heritage site, which provides a unique opportunity for monitoring the spatio-temporal characteristics and exploring the impact factors of post-seismic landslides change. In this study, the spatio-temporal characteristics of landslides and their post-seismic changes are analyzed using multi-source, multi-temporal, and multi-scale remote sensing data combining with the field study. The Support Vector Machine classification, visual interpretation, field investigation, and Geographic Information System technology are employed to extract landslides and analyze their spatial distribution patterns. Moreover, the Certainty Factor method is used to explore the susceptibility of landslides and to find key impact factors. Our results show that the net increase area of landslide is 1.2 km2 until September 27th, 2019, which are induced by the expansion of coseismic landslide, the post-seismic landslide, and the expansion of vegetation degradation. Moreover, the area expansion of the coseismic and post-seismic landslides is mainly related to the increase of debris flow induced by the post-seismic torrential rainfalls. The highest net increase rate of post-seismic landslide change does not distribute on the regions with the highest density of coseismic landslides. The susceptibility of post-seismic landslide change is greatly influenced by slope, altitude, aspect, peak ground acceleration fault, and strata. It is higher in the coseismic landslide area with low susceptibility. This study also suggests that the potential landslides will most likely occur in the unstable slope region affected by the additional driving force. Therefore, great attention should be paid to identify and prevent the potential landslides on unstable slopes in addition to treatments of the sliding slopes. This study provides a good example for the monitoring and assessment of post-seismic landslides in mountainous regions with a steep slope and deep valley.
Highlights
(1) Both coseismic landslides and post-seismic landslide change are concentrated in Jiuzhaitiantang-Panda Lake;
(2) The susceptibility of post-seismic landslide change is mainly influenced by slope, altitude, aspect, PGA, fault, and strata;
(3) The risk of post-seismic landslide change reduces in the high susceptibility area of coseismic landslide, but it increases in the low susceptibility area of coseismic landslide.
Introduction
This general term of landslides comprises almost all varieties of mass movements on slopes, including some, such as debris flows, rock falls, and rock slides (Varnes, 1984; Cruden and Varnes, 1996; Fan et al., 2019). In this study, landslides refer to the exposed rocks and soil area caused by mass movements on slopes, including their provenance, scraping, and accumulation areas, which are secondary disasters related to the seismic events. According to the triggers, the landslides related to earthquakes can be divided into 1) The slopes slide due to the strong force generated by earthquakes, which are called coseismic landslides; 2) The loose and unstable slopes affected by earthquakes are triggered by additional forces, such as heavy rainfall and other forces. They are called post-seismic landslides (Wang, 2004; Fan et al., 2018). In this study, the post-seismic landslide changes include the increase of landslides and the decrease of landslides after the earthquake, such as post-seismic landslides and restored landslides.
The strong earthquake will trigger large-scale coseismic landslides, which will cause great damage to people, buildings, natural and cultural heritages, such as the Ms 7.6 Chi-Chi earthquake in 1999 (Khazai and Sitar, 2004), the Ms 7.6 Pakistan earthquake in 2005 (Khattak et al., 2010), the Ms 8.0 Wenchuan earthquake in 2008 (Yin et al., 2009), the Ms 8.1 Nepal earthquake in 2015 (Regmi et al., 2016), and the Ms 7.0 Jiuzhaigou earthquake in 2017 (Dai et al., 2017; Fan et al., 2018). However, the effect of destructive earthquakes on landslides is not only in the coseismic stage but also in several years after the earthquake. Because of the destruction of earthquakes, the rock and soil are broken and the stability of slopes is reduced, resulting in active post-seismic landslides. The disaster activity time may last more than 10 years (Cui et al., 2011). Nakamura et al. (2000) studied the landslides for the periods after the 1923 M 7.9 Kanto Earthquake in Japan and considered that the most active stage of landslides was 15 years after the earthquake. The stage made the landslide area in a constantly changing process of increasing and recovering. To summarize the change characteristics of landslides and analyze the susceptibility of the impact factors can obtain the trend and the change rules of landslides, which has great significance for the post-seismic landslide treatment and ecological restoration.
At present, the previous studies on the post-seismic landslide change using multi-temporal remote sensing images have become a common concern in seismic landslide researches. The studies on different landslides show that the characteristics of post-seismic landslide change are as follows: 1) The restoration of landslide collapse area is worse than that of accumulation area (Lin et al., 2008); 2) The restoration ratio of landslides in two years after the earthquake is low (Khattak et al., 2010); 3) There is a good correlation between landslide restoration and terrain factors such as slope and altitude (Lu et al., 2012); 4) The restoration of landslides is related to lithology (Li et al., 2016). There are also some studies on the change characteristics of post-seismic landslide susceptibility, but the number of studies is small.
The post-seismic landslide change is still regarded as a part of coseismic landslides in the previous studies. There are essential differences between post-seismic landslides and coseismic landslides. Generally, the factors affecting landslides are mainly divided into background factors and trigger factors. Background factors are the necessary conditions for landslide occurrence, and trigger factors are the sufficient conditions for landslide occurrence (Qiao, 2010). For coseismic landslides, ground motion during earthquakes is the direct trigger factor. For post-seismic landslides, earthquake shaking is the background factor, which breaks the critical stability of the slope, and the trigger factors which directly trigger sliding are often external dynamic conditions such as heavy rainfall. Therefore, the post-seismic landslides should be studied as a separate landslide event and choose impact factors. Currently, since the post-seismic landslide changes and coseismic landslides are not considered separately, the characteristics of post-seismic landslide change obtained from the previous studies are not prominent enough, and the applicability of the characteristics is not common among different research areas.
There are few susceptibility studies on the selection of factors in the susceptibility analysis and the susceptibility change law of each factor in the process of landslide change after the earthquake. In previous studies, because the influence of some factors which are chosen is not significant, these factors have little contribution to susceptibility evaluation and the laws summarized from one impact factor can only be applied to this impact factor. There are almost no laws from the previous studies that can be used in different factors. Therefore, it is necessary to further study how to choose the factors and summarize the laws of the factors of the post-seismic landslide change.
On August 8th, 2017, a Ms 7.0 earthquake struck Jiuzhaigou, Sichuan Province, China. This earthquake triggered a large number of landslides (Wu et al., 2018), causing great damage to the Jiuzhaigou UNESCO Natural Heritage site. It is of great significance to study post-seismic landslide change for implementing the landslide treatments and the heritage site restoration. At the same time, because of detailed observation, dense vegetation, and significant change, the Jiuzhaigou area can provide a natural laboratory for studying the characteristics and impact factors of post-seismic landslide change. In the process of the dynamic change of landslide after the earthquake, it is necessary to extract landslides quickly and effectively, analyze their spatial distribution, summarize the characteristics of post-seismic landslide change, discuss the impact factors of post-seismic landslide change, conduct the multi-stage susceptibility analysis, and put forward the scientific treatment suggestions, which are of great significance and value for the reconstruction of landslide areas.
In the Jiuzhaigou area with dense vegetation, bare land can be used as a symbol to identify landslides and even accurately extract the location and area of landslides. In this study, landslides are extracted by combining the SVM classification, visual interpretation, and field investigation. This study will analyze the pattern of spatial distribution and control factors of the post-seismic landslide change and the coseismic landslide. Then, the susceptibility of the landslide is explored by using the CF method, and the change rule is found out, the reasons for the change are summarized, and reasonable treatment suggestions are put forward.
Study Area and Data
Study Area
Jiuzhaigou is located in the northeastern Tibetan Plateau. The terrain is high in the South and low in the North. It is the transition zone from the Tibetan Plateau to the Sichuan Basin and is also the turning point in front of the ridge of the highest terrain step in China (Guo et al., 2000). The area features deep-incized gullies and high mountains, the maximum peak is over 4700 m a.s.l. the minimum elevation is about 1200 m a.s.l. and the slope gradient is higher than 30° (Fan et al., 2018) (Figure 1).
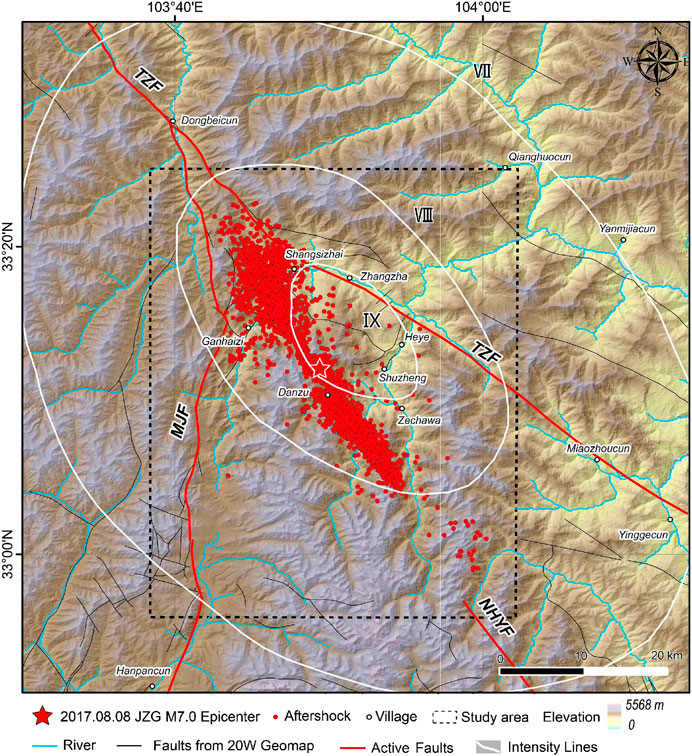
FIGURE 1. Active tectonic map of the 2017 Jiuzhaigou Earthquake. MJF: Minjiang Fault, NHYF: North Huya Fault, TZF: Tazang Fault.
The study area features outcrops of Devonian to Triassic sedimentation. The most representative lithology is a thick sequence of deep marine deposits, including limestone, flysch complex, and sandstone. The main lithology of Devonian strata is stratiform limestone and massive dolomite, the main lithology of Carboniferous stratum is layered and dense massive limestone, the main lithology of Permian stratum is siliceous limestone and sandy limestone, the lithology of Triassic stratum is mainly limestone and sandstone, and Quaternary loose deposits are distributed in river valleys (Dai et al., 2017).
At 21:19:46 on August 8th, 2017, a Ms 7.0 earthquake occurred in Jiuzhaigou County, Aba Autonomous Prefecture, Sichuan Province, China with an epicenter of (33.20°N, 103.82°E). The area affected by the Jiuzhaigou earthquake is more than 4,000 km2 (VII degrees earthquake intensity and above). Due to the high magnitude, shallow source, and high intensity of the earthquake, as well as the fragile geological environment (high slope gradient, fragile lithology), the earthquake triggered thousands of landslides (Dong et al., 2020).
Data Description
To study the quantity, scale, and spatial distribution characteristics of post-seismic landslides, we used Sentinel-2 images (10 m) before and after the earthquake for preliminary identification of landslides. Erial images (1 m and 0.16 m) and a series of pre-earthquake images including Google Earth were used for more careful identification and verification. In this study, three Sentinel-2 images with low cloud and good data quality were selected and processed. Before the earthquake, the image on July 29th, 2017, was selected. After the earthquake, to ensure that the phenological differences have the least impact on the change detection results, the images on September 7th, 2017, and September 27th, 2019, in the same season after the earthquake were selected. All images cover the area of VII degree Jiuzhaigou earthquake intensity and above, where most of the disasters are distributed. The ortho-level erial remote sensing image of emergency observation after the earthquake is from the large aircraft of the Bureau of Surveying and mapping on August 10th, 2017, with a spatial resolution of 1 m. It covers the Shuzheng Gully Jianzhu Lake area about 97.17 km2. The ortho-level unmanned erial vehicle (UAV) image after the earthquake is from the UAV (CW-15) image taken on June 10th, 2020, with a spatial resolution of 0.16 m. It covers the Shuzheng Gully Five Flower Lake area about 92.06 km2. The images on Google Earth are from remote sensing images on August 13th, 2013, and October 21st, 2015. Terrain data, stratigraphical data, and seismic data are used to analyze the control factors of disasters and to evaluate their susceptibility. Terrain data are downloaded from ALOS DEM with a spatial resolution of 12.5 m. Stratigraphical data come from the 1:200,000 geological map. Seismic data obtained from the open data of the Jiuzhaigou earthquake on the USGS website (http://earthquake. usgshakemap.gov).
Data Preprocessing
The Sentinel-2 images in this study are L1C products, which are the top of atmosphere (TOA) reflectance products. They have been corrected by radiometric correction and orthorectification. This study uses the Sen2Cor plug-in provided by ESA for atmospheric correcting which converts TOA reflectance products into surface reflectance products (L2A products). The data resampled and format conversion are processed by SNAP. Finally, image products are under WGS 1984 coordinate system and UTM projection.
There may be geometric distortion and offset between the images in 2017 and 2019, which may cause errors in change detection. This study uses ENVI to register remote sensing images until the accuracy of registration is higher than 0.5 pixels, which can meet the requirements of landslide change detection.
Methods
Landslide Identification
The Jiuzhaigou area has dense vegetation, with a coverage rate of 85.5% (Deng, 2011). In most landslide events, the vegetation on the slopes will be destroyed. So, it is easy to identify the bare land where vegetation is damaged by landslides. However, the vegetation of the area above 3700 m a.s.l. is sparse due to frost weathering and permanent snow. Previous studies have shown that landslides above 3700 m are rare in the Jiuzhaigou area (Wu et al., 2018). Therefore, this study extracts landslides in areas lower than 3,700 m a.s.l.
In landslide identification studies, visual interpretation is the most reliable method to identify landslides (Sun et al., 2020). However, due to the large number of landslides induced by the earthquake, the visual interpretation of landslides requires a large number of human resources and consumes a lot of time, which limits the landslide identification efficiency. We used a more efficient method to identify landslides. Firstly, based on Sentinel-2 and UAV remote sensing images, this study uses SVM classification (Vapnik, 1998) which selects samples manually and automatically classifies them by software with high accuracy and efficiency to extract the bare land within 2055 km2 of the Jiuzhaigou area. It obtains the preliminary classification results of the bare land. Then, visual interpretation is used to verify the bare land represents the landslide results or not, and eliminate the false detection areas. For key areas or uncertain areas, field investigation is carried out to verify the results.
Change Detection
The accuracy of the image preprocessing results in Data Preprocessing is verified before the change detection. This study found that the error of the total area of landslide changes obtained by change detection can be controlled within 10−3 when the registration accuracy is within 0.5 pixels. It can meet the accuracy of change detection.
After obtaining the accurate landslides extraction results of 2017 and 2019, this study used the 2017 landslide area to erase the 2019 landslide area and used the 2019 landslide area to erase the 2017 landslide area, obtaining the new landslide area and the restored landslide area respectively, by the ArcGIS-Analysis-Erase tool, as shown in Figure 2.
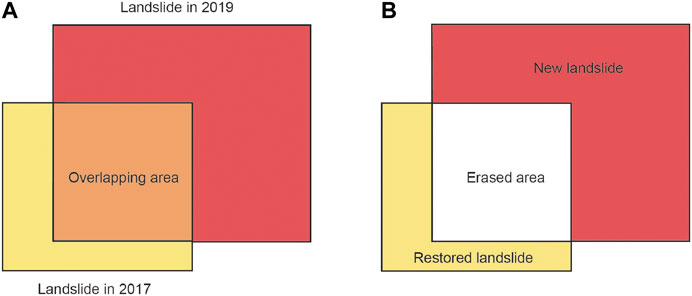
FIGURE 2. Principle of change detection (A) Assumed range of landslides in 2017 and 2019 (B) Change detection of the new landslide and the restored landslide.
The change of the total landslide area is the net change which is the sum of the new landslide area and the restored landslide area. The net change is the result of the difference between the new landslide area in 2019 and the restored landslide area in 2017. This study also named it the net increase. When the net increase was positive, it meant that the landslide area of 2019 increased; when the net increase was negative, it meant that the landslide area of 2019 recovered. This study assumes that the landslide area in 2019 is increased by “
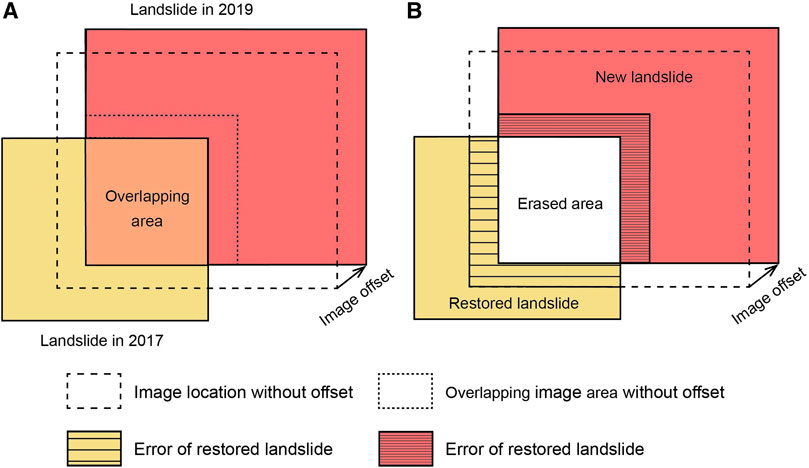
FIGURE 3. Principle of change detection with offset (A) Dislocation in the two images (B) Change detection of landslide with image offset. The error of restored landslide: The change detection error of the new landslide is caused by an image offset. The error of restored landslide: The change detection error of the restored landslide is caused by an offset.
Influencing Factors Selection and Net Increase Rate Calculation
Previous studies suggested that landslides related to earthquakes are mainly affected by seismic factors, topographic factors, and geological factors (Keefer, 2000; Huang and Li, 2008). The post-seismic landslide change is affected not only by seismic factors, topographical factors, and geological factors but also by external factors such as rainfall and the human’s engineering treatments after earthquakes. However, the rainfall for the susceptibility of post-seismic landslide change is a trigger factor, not a background factor, and is difficult to predict in advance. So, this study does not select rainfall and selects the other eight factors. Seismic factors, topographic factors, and geological factors include PGA, slope, aspect, altitude, strata, and distance to the fault. Considering that landslide treatment work and human activities mainly distribute on both sides of the roads and rivers, the distance to the rivers and roads is also selected as an influencing factor.
In terms of slope, the slopes below 30° are divided by 10° intervals, and the slopes above 30° with dense landslides are divided by 5° interval; in terms of altitude, all the factors are divided by 200 m; in terms of aspect, it is divided by 45° interval, and the flat area without downhill direction is divided into Flat; in terms of strata, the strata are divided, according to stratigraphic age; in terms of PGA, when PGA is lower than 0.24 g, it is divided by an equal interval of 0.04 g, and when PGA is higher than 0.24 g, it is divided by an equal interval of 0.02 g; in terms of fault, rivers, and roads, as they are all linear elements, buffer zones with an equal interval of 1 km are generated on both sides. The spatial distribution histogram of landslides in 2017 was analyzed by GIS.
To conveniently display the landslide density under each classification, this study calculates the relative probability of landslide in the classification subsets of every factor, which is called the landslide area density (Landslide area/Classification area). Then this study normalizes it and colored it according to the normalized index (Dai et al., 2017).
In terms of post-seismic landslide change, this study defines a net increase rate to measure the change range of landslide under the classification subsets of every factor based on the net increase area. Eq. 1 is listed as follows:
Where
Susceptibility Calculation
The CF method is a probability function. It was first proposed by Shortliffe and Buchanan (Shortliffe and Buchanan, 1987) to analyze the susceptibility of various factors affecting the occurrence of an event. Lan et al. applied the CF method to the susceptibility analysis of regional landslides (Lan and Wu, 2002). Eq. 2 is listed as follows:
Where
Results
Inventories of Coseismic Landslide and Post seismic Landslide Change
This study extracted the landslides in the Jiuzhaigou area within 2055 km2. This scope almost covers the whole Jiuzhaigou landslide area. There were 4,456 landslides with an area of 13.7 km2 in September 2017 (Figure 4) and 4,076 landslides with an area of 14.9 km2 in September 2019 (Figure 5). In terms of post-seismic landslide change, the net increase area is 1.2 km2, including the increased area of 3.6 km2 (Figure 6) and the restored area of 2.4 km2 (Figure 7).
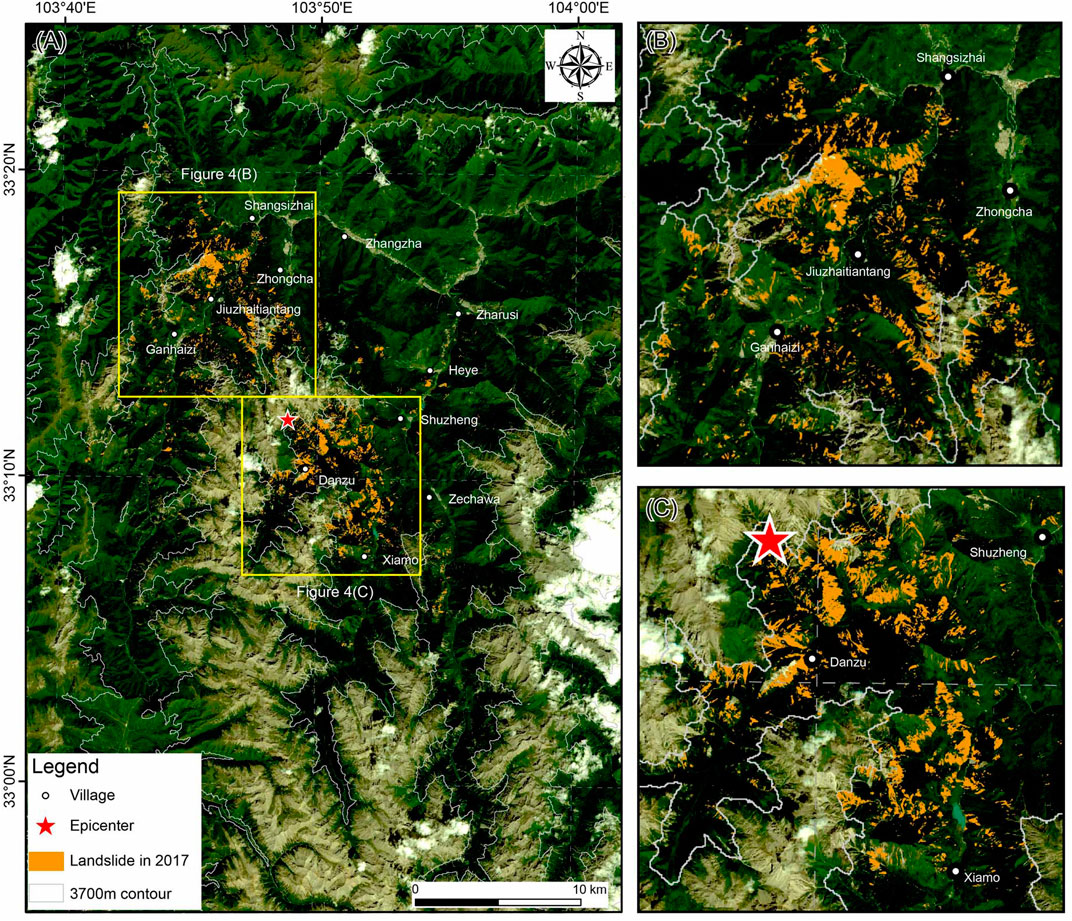
FIGURE 4. Inventory map of the landslide in 2017 (A) Landslide map (B) Landslide map of Jiuzhaitiantang (C) Landslide map of Panda Lake.

FIGURE 5. Inventory map of the landslide in 2019 (A) Landslide map (B) Landslide map of Jiuzhaitiantang (C) Landslide map of Panda Lake.
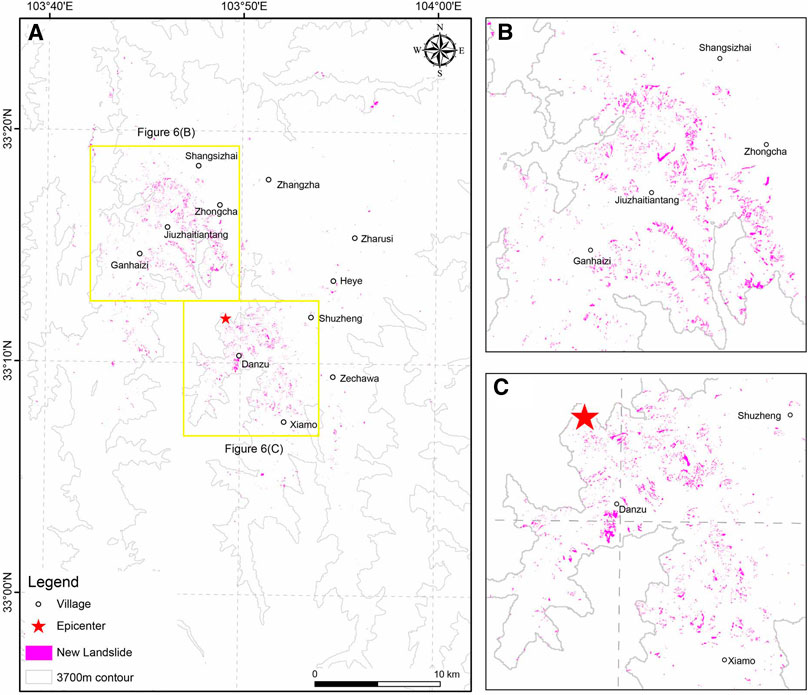
FIGURE 6. Inventory map of new landslide area (A) New landslide map (B) New landslide map of Jiuzhaitiantang (C) New landslide map of Panda Lake.
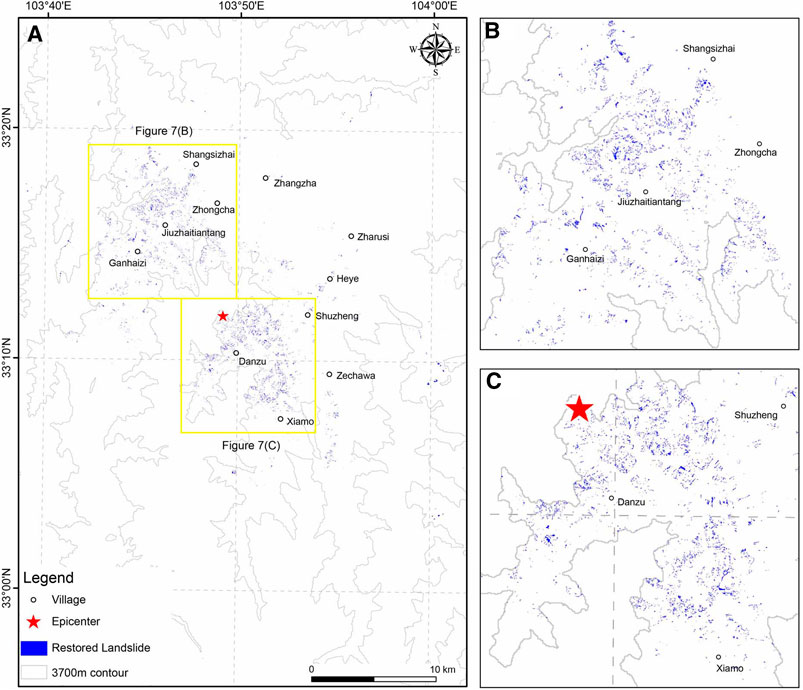
FIGURE 7. Inventory map of the restored landslide area (A) Restored landslide map (B) Restored landslide map of Jiuzhaitiantang (C) Restored landslide map of Panda Lake.
Spatial Distribution of Coseismic and Post-seismic Landslides
The post-seismic landslide changes include the increased and restoration of landslides. They are distributed in the whole landslide area and are similar to the landslide distribution of 2017 and 2019. There are two gathering areas in space. One of the gathering areas is the area of Jiuzhaitiantang which is outside the scenic area, the other gathering area is the area of Panda Lake which is in the scenic area. There are a small number of landslides along Shuzheng Gully and Zechawa Gully (Figure 6, Figure 7).
The post-seismic landslide changes type contains the expansion of coseismic landslide, the new post-seismic landslide, the expansion of vegetation degradation, and the landslide restoration. The expansion of coseismic landslide and the new post-seismic landslide belong to the post-seismic landslides which are mainly triggered by rainfall in the Jiuzhaigou area. The expansion of vegetation degradation is the result of vegetation damages caused by coseismic landslides. The landslide restoration is caused by natural succession or human treatments.
For the new landslide area, through remote sensing images and field investigation, it is found that the increased area comes from the expansion of coseismic landslide, the new post-seismic landslide, and the expansion of vegetation degradation. The expansion of coseismic landslide mostly occurs on the slopes with accumulated landslide materials (Figure 8), and the area is the largest; the new post-seismic landslides with significant changes are distributed in the whole disaster area (Figure 9), and the area is less than the expansion of the coseismic landslide area; the expansion of vegetation degradation which is affected by landslides on the slope is common (Figure 10), and the area is the smallest.
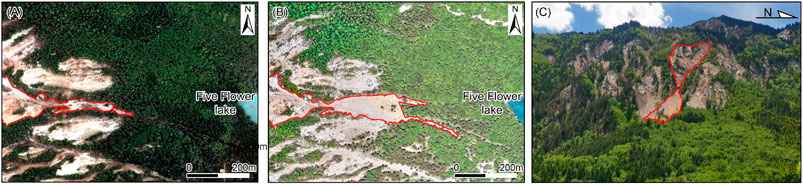
FIGURE 8. Expansion of coseismic landslide (A) Coseismic landslide in 2017 (B) Expansion of coseismic landslide in 2020 (C) Field photo showing the expansion of coseismic landslide.
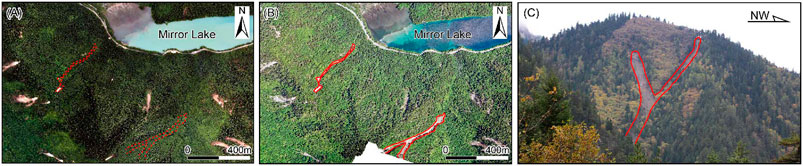
FIGURE 9. Post-seismic landslide (A) Slope in 2017 (B) Post-seismic landslide in 2020 (C) Field photo showing the post-seismic landslide.
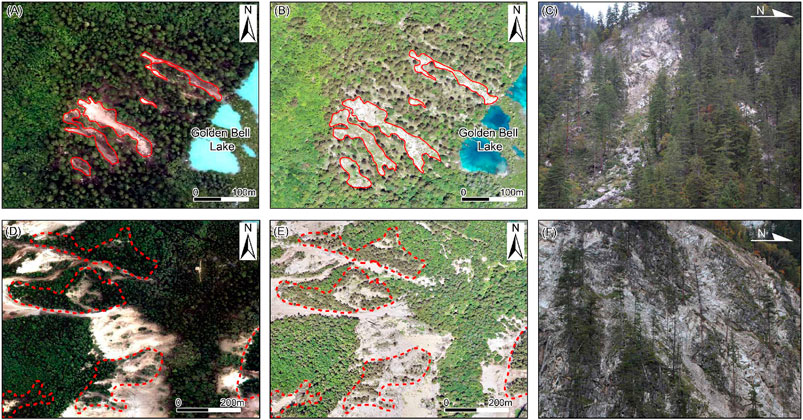
FIGURE 10. Expansion of vegetation degradation (A) Coseismic landslides in 2017 (B) Hidden damage of landslide appears in 2020 (C) Field photo showing the damage caused by coseismic landslides (D) Vegetation damaged by the coseismic landslides in 2017 (E) Vegetation degradation on landslides in 2020 (F) Field photo showing the vegetation degradation caused by landslides.
Through remote sensing images and field investigation, the landslide restoration caused by natural succession is distributed in all landslide areas and the landslide restoration caused by the engineering treatments is mainly distributed around roads, scenic spots, and residential areas, which is the most significant (Figure 11).
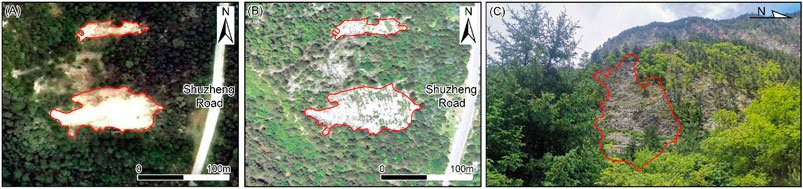
FIGURE 11. Landslide restoration after treatment (A) Coseismic landslides in 2017 (B) The landslides with vegetation in 2020 (C) Field photo showing the landslide with vegetation.
The relationship between the distribution of coseismic landslides, post-seismic landslide changes and seismic factors, topographic factors, geological factors, and human activities is shown in Figure 12.
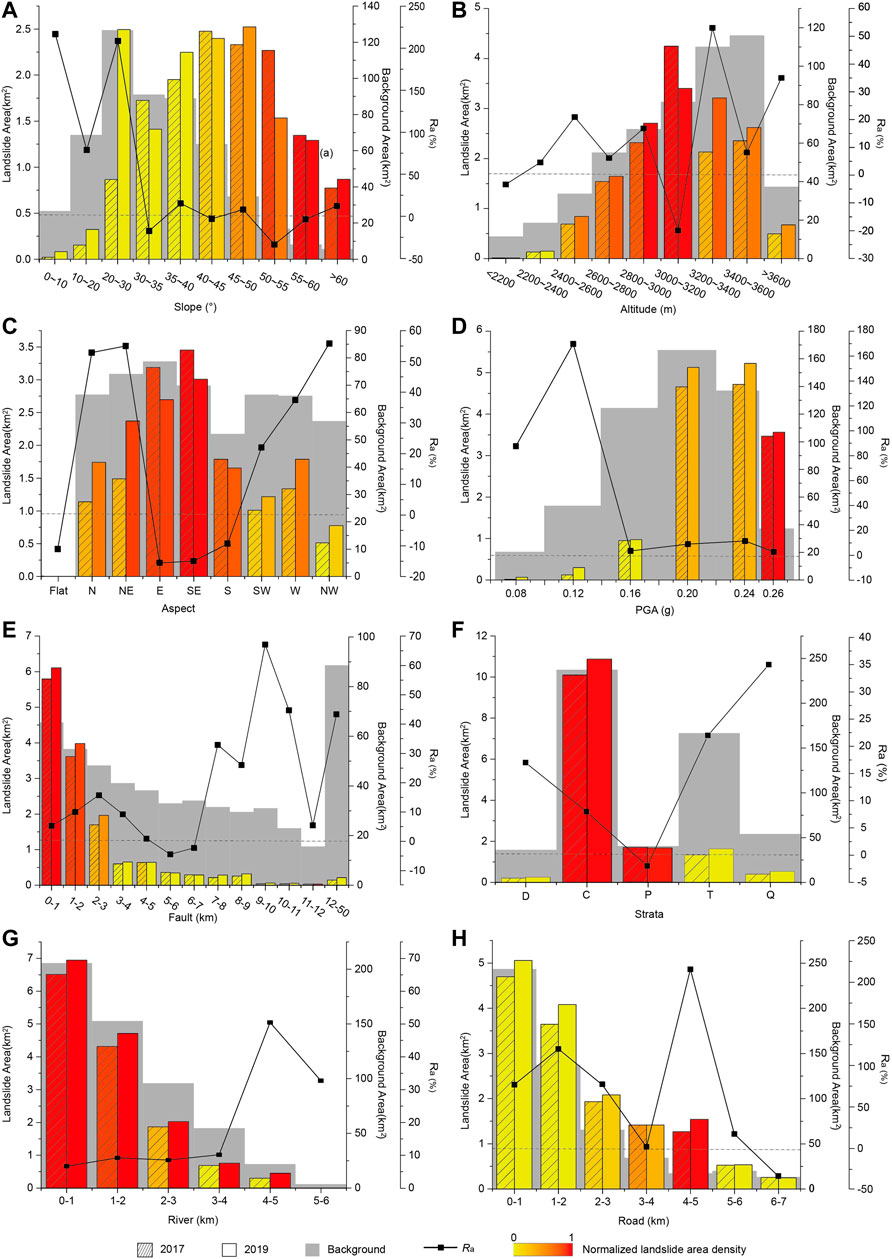
FIGURE 12. Distribution of coseismic landslides and post-seismic landslide change (A) Slope (B) Altitude (C) Aspect (D) PGA (E) Distance to fault (F) Strata (G) Distance to rivers (H) Distance to roads.
Slope: Coseismic landslides are mainly distributed on the slopes of 30°–55° (Figure 12A) which is consistent with previous study results (Fan et al., 2018; Wang et al., 2018). However, for post-seismic landslide change, the slopes of 0°–10° and 20°–30° are the areas of landslide increasing significantly. On the slopes of 0°–10°, the net increase area is 0.0476 km2 and the net increase rate is 216%. On the slopes of 20–30°, the net increase area is 1.6522 km2 and the net increase rate is 209%. The net increase area and the net increase rate are both very large on the slope of 20–30°. The reason is that the post-seismic increase of landslide area in the Jiuzhaigou area is mainly caused by the expansion of coseismic landslide whose deposits will expand to the area with gentle slope under the additional force. This phenomenon also occurred in the process of post-seismic landslide change after the 2008 Ms 8.0 Wenchuan earthquake (Li, et al., 2018). With the increase of the slope and the landslide density, the net increase rate of landslide decreases. When the slopes above 50° have high landslide density, landslides hardly increase or even recover.
Altitude: Coseismic landslides are mainly distributed on the slopes of 2,800–3,600 m a.s.l. (Figure 12B). However, for post-seismic landslide change, there is a great difference between the post-seismic landslide changes of 3,000–3,200 m a.s.l. and that of 3,200–3,400 m a.s.l. showing an opposite change pattern. The landslides of 3,000–3,200 m a.s.l. with the highest density show a significant recovery with a net increase rate of -20%. But, the landslides of 3,200–3,400 m a.s.l. with low landslide density show a significant increase with a net increase rate of nearly 60%.
Aspect: Coseismic landslides have a “back-slope effect” (Dai et al., 2017; Xie et al., 2018). They are mainly concentrated in the NE-S direction (Figure 12C). However, for post-seismic landslide change, the increase of post-seismic landslides is mainly concentrated on the slopes of SW, W, NW N, and NE which have low landslide density. The net increase rates of NW, N, and NE-facing slopes are high, with an average net increase rate of about 55%. On the slopes of E-S with high landslide density, the change of landslide shows a significant recovery. The landslides of flat land also recover.
PGA: Coseismic landslides are mainly concentrated in the area where the PGA is greater than 0.20 g (Figure 12D) (Yi et al., 2020). However, for post-seismic landslide change, the net increase rate of the landslide on the slopes of 0.2 g–0.26 g is not very high. The net increase rate of the landslide is 88% at 0.08 g and 170% at 0.12 g. The increase rate is 3% at 0.26 g, which is close to the constant state.
Fault: Coseismic landslides are mainly concentrated within 2 km away from the fault (Figure 12E) (Fan et al., 2018). With the increase of distance, the area and density of landslides decrease. However, for post-seismic landslide change, the net increase rate of landslides within 2 km is not very high. The net increase rate of landslides peaks at 67% in 9–10 km.
Strata: Coseismic landslides are mainly distributed in the area of Carboniferous and Permian strata (Figure 12F). The main lithology in the Carboniferous and Permian strata is limestone and dolomite. For post-seismic landslide change, the net increase rate of landslides in the strata of Carboniferous is 8% and in Permian is −2%, while that in the strata of Devonian, Triassic, and Quaternary with low landslide density are 17, 22, and 35% respectively.
Rivers: Coseismic landslides are mainly concentrated within 2 km away from the rivers (Figure 12G). With the increase of distance, the area and density of landslides decreases. However, for post-seismic landslide change, the net increase rate of landslides in 0–2 km is not very high. The net increase rate peaks at 50% at 4–5 km.
Roads: Coseismic landslides are mainly concentrated within 2 km from the roads (Figure 12H). However, for post-seismic landslide change, the net increase rate of landslides in 0–2 km is close to the average net increase rate, which is not high. The net increase rate peaks at 22% in the area from the roads about 4–5 km.
The Susceptibility of Coseismic Landslide and Post-seismic Landslide Change
The susceptibilities of eight factors related to coseismic landslides and post-seismic landslide change are shown in Figure 13.
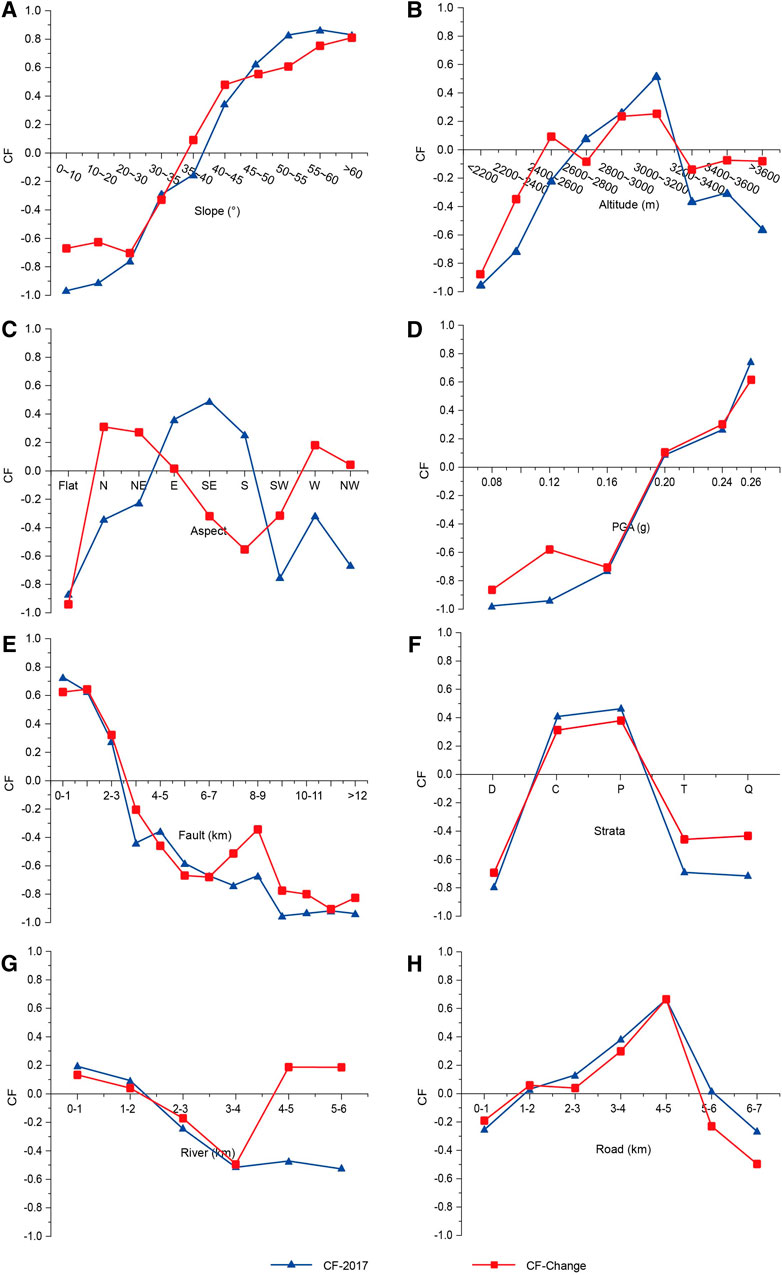
FIGURE 13. Susceptibility of coseismic landslides and post-seismic landslide change (A) Slope (B) Altitude (C) Aspect (D) PGA (E) Distance to fault (F) Strata (G) Distance to rivers (H) Distance to roads.
Slope: For coseismic landslides, the range of CF values is from −0.96−0.86. The CF values increase rapidly with the increase of slope and peak on the slope of 55°–60° (Figure 13A). The steeper the slope is, the more likely the landslide will slide. For post-seismic landslide change, the trend of CF values is consistent with that of coseismic landslides. However, the range of CF values is from −0.67 to 0.81, which is smaller than that of coseismic landslides. The CF values of post-seismic landslide change are higher than that of coseismic landslides on the slope within 45°, and the CF values of change landslides are less than that of coseismic landslides on the slope above 45°. The susceptibility of landslide varies widely and is significantly affected by the slope.
Altitude: For coseismic landslides, the range of CF values is from −0.96 to 0.52 (Figure 13B). The CF values increase with the increase of altitude when the altitude is lower than 3,000–3,200 m a.s.l. and decreases with the increase of altitude when the altitude is higher than 3,000–3,200 m a.s.l. The CF value peaks at 3,000–3,200 m a.s.l. indicating that the possibility of slope sliding is the highest. For post-seismic landslide change, the trend of CF values is consistent with that of coseismic landslides. However, the range of CF values is from −0.88 to 0.25, which is smaller than that of coseismic landslides. Within the altitude of 2,800 m a.s.l. coseismic landslides are not easy to slide. The CF values of post-seismic landslide change is a little higher than that of coseismic landslides in this area. Above 3,200 m a.s.l. the CF values have similar characteristics.
Aspect: For coseismic landslides, the range of CF values is from −0.87 to 0.49 (Figure 13C). The CF values on E, SE, and S-facing slopes are positive, which indicates that the slopes may slide. The CF value peaks on SE-facing slopes, indicating that SE-facing slopes have the highest possibility of sliding. They are negative in other aspects and flat, which shows that these slopes are not easy to slide. However, for post-seismic landslide change, the range of CF value of landslides is smaller than that of coseismic landslides, ranging from −0.94 to 0.31. In the slopes where coseismic landslides are not easy to slide, post-seismic landslides are more likely to slide. In the slopes where coseismic landslides are easy to slide, post-seismic landslides are not easy to slide. The CF values of N, NE, W, and NW-facing slopes are positive, which indicates that the landslide may slide. The CF value peaks on the N-facing slope, which indicates the sliding probability is higher. The CF values of other slopes are negative or close to 0, which indicates the sliding probability is low.
PGA: For coseismic landslides, the range of CF values is from −0.98 to 0.75 (Figure 13D). The CF values increase with the increase of PGA and peak at the maximum of PGA, indicating that the larger the PGA is, the more likely the landslide will slide. For post-seismic landslide change, the trend of CF values is consistent with that of coseismic landslides. However, the range of the CF values is from −0.89 to 0.61. It is smaller than the CF values of coseismic landslides. The susceptibility of the landslide is significantly affected by PGA.
Fault: For coseismic landslides, the range of CF values is from −0.95 to 0.73 (Figure 13E). The CF values decrease with the increase of the distance to the fault. It indicates that the closer the distance is to the fault, the more likely the landslide will slide. For post-seismic landslide change, the trend of CF values is consistent with that of coseismic landslides. However, the range of CF values is from −0.91 to 0.64. It is smaller than the CF values of coseismic landslides.
Strata: For coseismic landslides, the range of CF values is from −0.72 to 0.46 (Figure 13F). The CF values are high in the area of Carboniferous and Permian strata, and they are 0.41 and 0.46 respectively. The CF values are −0.80, −0.69, −0.72 respectively in areas of Devonian, Triassic, and Quaternary strata, which means the possibilities of sliding in those areas are low. For post-seismic landslide change, the trend of CF values is consistent with that of coseismic landslides while the range of CF values which is from −0.70 to 0.38 is a little smaller than that of coseismic landslides.
Rivers: For coseismic landslides, with the increase of the distance to the rivers, the CF values vary slightly, ranging from −0.53 to 0.19 (Figure 13G). Within 2 km away from the rivers, the CF values are positive, which is beneficial to slide, but the possibility is not too high. The CF values are negative over 2 km, which is not easy to slide. However, for post-seismic landslide change, the CF values within 2 km or more than 4 km are positive. The maximum of CF values is only 0.19, and the susceptibility is not very high. The CF values change with the change of the distance to the fault is not significant. So, there is no significant correlation between the susceptibility and the distance to the rivers.
Roads: For coseismic landslides, the range of CF values is from −0.66 to 0.27 (Figure 13H). The CF values increase with the increase of the distance within 4 km away from the roads and decrease with the increase of the distance over 5 km. It peaks at 0.66 when the range of distance is 4–5 km, indicating that the possibility of landslide sliding is the highest. It is positive when the distance is between 2 and 6 km, which shows that it is easy to slide. For post-seismic landslide change, the trend of CF values is consistent with that of coseismic landslides. However, the range of CF values is a little bigger than that of coseismic landslides.
Discussion
Integrity and Accuracy of the Coseismic Landslide Database and Spatial Distribution
Incomplete landslide databases may mislead the studies of landslide distribution and they may mislead the studies of susceptibility assessment (Xu and Xu, 2014). A complete landslide database can provide accurate information for fault studies or other studies, such as assisting in identifying the blind fault on the unexposed surface of the Jiuzhaigou earthquake (Fan et al., 2018). In the previous studies of Jiuzhaigou, their landslide areas are not consistent. It indicates that their landslide databases may be incomplete, which leads to inconsistencies in landslide distribution studies, such as the studies of Tian et al. (2019), Dai et al. (2017), Wu et al. (2018), and Liang et al. (2019). In these studies, the results of the distribution are incompletely consistent, especially the slope distribution.
Landslides are extracted from the satellite and erial remote sensing images by the monitoring technology of integrated space-air-ground. SVM classification is used to extract landslides. Visual interpretation and field investigation are used to verify the extracted result. This method can improve the speed and accuracy of landslide interpretation. It avoids the problem that visual interpretation needs the cooperation of many people with different interpretation experience which is easy to get inaccurate interpretation results. Therefore, the landslides extracted in this study is more comprehensive and the distribution results are more accurate.
Post-seismic Landslide Change
Causes of Post-seismic Landslide Change
The landslide area of Jiuzhaigou is larger in 2019 than that in 2017. A previous study on the landslides related to the 2008 Wenchuan earthquake shows that the frequency of the landslides increased significantly within 5 years after the earthquake. Compared with the pre-seismic records, the number of post-seismic landslides is 2–5 times higher than that before the earthquake (Huang and Li, 2014). Strong earthquakes not only trigger a large number of coseismic landslides but also induce relaxation and cracks in the rocks and soils which make these rocks and soils vulnerable to instability during subsequent aftershocks or rainfall events (Fu et al., 2020). Some cracks can become the boundary of the post-seismic landslides and the main permeable path for subsequent rainwater (Huang et al., 2019). Moreover, coseismic landslides will also produce a large number of loose deposits on the slope. The deposits on the slope can remobilize and turn into debris flow during heavy rainy seasons. Three heavy rainfall events occurred in September 2017, August 2018, and August 2019 after the 2017 Jiuzhaigou earthquake, all of which induced mass geological disasters (Huang et al., 2020). When the speed of landslide occurrence is faster than that of landslide recovery, the landslide area will increase. Only 2 years after the 2017 Jiuzhaigou earthquake, the post-seismic recovery needs a longer period. Therefore, the landslide area will increase in recent and future times.
Rules and Causes of Spatial Distribution of Post-seismic Landslide Change
In this study, the net increase rate is used to measure the post-seismic landslide change. The spatial distribution pattern of post-seismic landslide change and coseismic landslides is quite different in the factors of earthquake, topography, geology, and human activities. This study suggests that the areas with high landslide density are most affected by the strong earthquake shaking and the unstable slopes have already slipped during the earthquake. Thus, there are almost no new landslides in these areas within two years after the earthquake. In other areas, the earthquakes did not trigger too many coseismic landslides. But these slopes (Delgado et al., 2011) and their ecological environment (Lu et al., 2012) have been weakened by the earthquakes. The earthquakes induced relaxation and cracks and produced deposits on them. Therefore, these slopes become the main increase areas of landslides triggered by other additional forces after the earthquake. There is a general rule across the factors: the highest net increase rate of post-seismic landslide change does not distribute on the regions with the highest density of coseismic landslides; on the contrary, the areas with the highest density of coseismic landslides show that the net increase rates of landslides are close to 0. For slope and PGA, the net increase rate is close to 0 in the area with the highest density of coseismic landslides. For altitude and aspect, the net increase rate is negative in the area with the highest density of coseismic landslides. For faults, strata, and rivers, the net increase rate in the areas with the highest density of coseismic landslides is small and not more than 10%.
The increase areas of landslides can be divided into three cases as described in Spatial Distribution of Coseismic and Post-seismic Landslides: 1) Some landslides with deposits on the slope do not reach the state of stress balance, which is conducive to expansion under the trigger of additional driving forces, such as rainfall after the earthquake. This case is the most common in the Jiuzhaigou area, such as the landslide areas around Five Flower Lake (Figure 8); 2) There is no landslide on the slope weakened by the earthquake, but if the slope is affected by additional driving forces, post-seismic landslides will happen in this area, which changes most significantly, such as the post-seismic landslide at Mirror Lake (Figure 9); 3) There has been small collapse or displacement on the slopes due to the earthquake. But the damage is not easy to be detected due to the shelter of the vegetation. So, the impact is not significant in the early stage after the earthquake. However, the change of slope will cause some disturbance to the adjacent or overlying vegetation. The vegetation will degenerate with time (Guo et al., 2020), and then landslides can be detected. This case is also very common, but the area is not too big (Figure 10).
Rules and Causes of Susceptibility of Post-seismic Landslide Change
In this study, the susceptibilities of the coseismic landslides and the post-seismic landslide change are calculated respectively. The susceptibility of post-seismic landslide change changed significantly with slope, altitude, aspect, PGA, fault, and strata (Figure 13). Reasons for the susceptibility anomaly of post-seismic landslide change are consistent with the spatial distribution anomaly. From the distribution of susceptibility, there are general rules across the factors: the susceptibility peak value of the post-seismic landslide change is lower than that of the coseismic landslide; the susceptibility of the post-seismic landslide change is lower than that in the coseismic landslide area with high susceptibility, which indicates that the landslide risk reduces; the susceptibility of the post-seismic landslide change is higher than that in the coseismic landslide area with low susceptibility, which indicates that the landslide risk increases.
The potential landslides in the area with high landslide density have already slipped in the earthquake, which results in that the susceptibility decrease. In the original low susceptibility areas which have been weakened by the earthquake events, new landslides will occur due to the influence of additional driving force after the earthquake, which results in that the susceptibility increase.
In the process of post-seismic landslide change, rainfall is one of the important forces that trigger the post-seismic landslide change, especially the expansion of coseismic landslide. It will remobilize the deposits on the slope which will expand to the area with a more gentle slope and lower altitude and cause damage to these areas. It results in the susceptibility of these areas with low susceptibility increases. This dynamic situation will last for a long time in the future.
Suggestions for the Investigation and Mitigation of the Post-seismic Landslides
This study suggests that landslides are investigated by the monitoring technology of integrated space-air-ground which includes multi-source, multi-temporal, and multi-scale remote sensing data and field study. The SVM classification, visual interpretation, field investigation, and GIS technology are employed in this study. They can create complete and accurate landslide inventories and analyze the spatio-temporal characteristics of landslides and their post-seismic changes.
According to the characteristics of spatial distribution and susceptibility, this study proposes some opinions for the treatments of landslides in the post-seismic change process. For the coseismic landslides, the expansion is caused by the remobilization of landslide deposits on slopes, accounting for the largest proportion of the increase of landslide area. These slopes should be reinforced and the landslide deposits should be cleared. However, because of the huge amount of landslide deposits, it is difficult to clear them in a short time. We suggest that reasonable dredging and reuse treatments of deposits should be implemented. For the small-scale coseismic collapses or potential post-seismic landslides triggered by the additional driving force, they are difficult to be found with the shelter of the vegetation. But, vegetation anomalies can be used as good indicators to identify them in the concealed unstable slopes. Great attention should be paid to extract the potential landslides by identifying the vegetation anomaly in the concealed unstable slopes. These unstable slopes also should be reinforced to prevent sliding.
Conclusion
Coseismic landslides and post-seismic landslide change are concentrated in the Jiuzhaitiantang-Panda Lake area. The increased area of the landslide is 3.6 km2, the restored area is 2.4 km2, and the net increase area is 1.2 km2, compared with the coseismic landslide, until September 27th, 2019. The expansion includes the expansion of coseismic landslide, the post-seismic landslide, and the expansion of vegetation degradation. The area expansion of the coseismic and post-seismic landslides is mainly related to the increase of debris flow induced by the post-seismic torrential rainfalls. The reduction contains the restoration caused by natural succession or the engineering treatments.
The susceptibility of post-seismic landslide change is greatly influenced by slope, altitude, aspect, PGA, fault, and strata. Due to the post-seismic changes of stress and slope stability, the risk of post-seismic landslide change reduces in the high susceptibility area of coseismic landslide and it increases in the low susceptibility area of coseismic landslide.
The slope with coseismic landslides should be reinforced and the landslide deposits should be cleared, dredged, or reused. The concealed unstable slope which may have potential landslides should be paid great attention to identify the potential landslides by extracting the vegetation anomaly to prevent potential landslides.
Data Availability Statement
The original contributions presented in the study are included in the article/Supplementary Material, further inquiries can be directed to the corresponding author.
Author Contributions
XG and BF designed this study, analyzed the data, and wrote the manuscript; Jie D, PS, JL, ZL, Jia D, QC, and HF worked on the processing of remote sensing data and field investigations. All authors approved the final version of the manuscript.
Funding
This work was funded by the Second Tibetan Plateau Scientific Expedition and Research Program (STEP, Grant No. 2019QZKK0901) and Project on Integrated Space-Air-Ground of Jiuzhaigou World Natural Heritage Site supported by the Jiuzhaigou Administration Bureau (Grant No. E0H20501).
Conflict of Interest
The authors declare that the research was conducted in the absence of any commercial or financial relationships that could be construed as a potential conflict of interest.
Acknowledgments
We are grateful for the helpful discussion with Yueren Xu of the Institute of Earthquake Forecasting, China Earthquake Administration. We really appreciate the constructive comments and suggestions from three reviewers, which are helpful to improve the quality of our manuscript.
References
Cruden, D. M., and Varnes, D. J. (1996). Landslide types and processes. Special Report. Transportation Research Board, National Research Council, 247, 36–75. Available at: https://onlinepubs.trb.org/Onlinepubs/sr/sr247/sr247-003.pdf (Accessed August 17, 1996).
Cui, P., He, S. M., Yao, L. K., Wang, Z. Y., and Chen, X. Q. (2011). Formation mechanism and risk control of mountain disaster caused by the Wenchuan earthquake. Science Press, 2.
Dai, L. X., Xu, Q., Fan, X. M., Chang, M., Yang, Q., Yang, F., et al. (2017). A preliminary study on spatial distribution patterns of landslides triggered by Jiuzhaigou earthquake in Sichuan on August 8th, 2017, and their susceptibility assessment. J. Eng. Geol. [in Chinese, with English summary].
Delgado, J., Garrido, J., López-Casado, C., Martino, S., and Peláez, J. A. (2011). On far field occurrence of seismically induced landslides. Eng. Geol. 123 (3), 204–213. doi:10.1016/j.enggeo.2011.08.002
Deng, G. P. (2011). Study of Tourism Geosciences Landscape Formation and Protection of Jiuzhaigou World Natural Heritage Site. Dissertation/doctor’s thesis. Chengdu (China): Chengdu University of Technology.
Dong, X. J., Xu, Q., She, J. X., Li, W. L., Liu, F., and Zou, X. X. (2020). Preliminary study on interpretation of geological hazards in Jiuzhaigou based on multi‐source remote sensing data. Geomatics and Information Science of Wuhan University, 45 (3), 432–441 [in Chinese, with English summary]. doi:10.13203/j.whu-gis20130532
Fan, X. M., Scaringi, G., Korup, O., West, A. J., Westen, C. J. V., Tanyas, H., et al. (2019). Earthquake-induced chains of geologic hazards: patterns, mechanisms, and impacts. Rev. Geophys. 57, 421–503. doi:10.1029/2018RG000626
Fan, X. M., Scaringi, G., Xu, Q., Zhan, W. W., Dai, L. X., Li, Y. S., et al. (2018). Coseismic landslides triggered by the 8th August 2017 MS 7.0 Jiuzhaigou earthquake (sichuan, China): factors controlling their spatial distribution and implications for the seismogenic blind fault identification. Landslides 15 (5), 967–983. doi:10.1007/s10346-018-0960-x
Fu, X. D., Sheng, Q., Li, G., Zhang, Z. P., Zhou, Y. Q., and Du, Y. X. (2020). Analysis of landslide stability under seismic action and subsequent rainfall: a case study on the Ganjiazhai giant landslide along the Zhaotong-Qiaojia road during the 2014 Ludian earthquake, Yunnan, China. Bull. Eng. Geol. Environ. 79, 5229–5248. doi:10.1007/s10064-020-01890-z
Guo, J. Q., Peng, D., Cao, J., and Yang, J. Y. (2000). Geomorphology and quaternary geology in Jiuzhai Valley. Acta geologica sichuan [in Chinese, with English summary].
Guo, X. Y., Guo, Q., and Feng, Z. K. (2020). Relationship between landslide creep and vegetation anomalies in remote sensing images. J. Remote Sens. 24 (6), 776–786 [in Chinese, with English summary]. doi:10.11834/jrs.20208330
Huang, D., Li, Y. Q., Song, Y. X., Xu, Q., and Pei, X. J. (2019). Insights into the catastrophic Xinmo rock avalanche in Maoxian county, China: combined effects of historical earthquakes and landslide amplification. Eng. Geol. 258, 105158. doi:10.1016/j.enggeo.2019.105158
Huang, H., Shi, S. W., Yang, S., Tian, Y., Yang, D. X., and Liu, J. K. (2020). Study on the debris flow mitigation engineering damage in the national parks caused by the 8th August 2017 Jiuzhaigou earthquake. Chinese J. Rock Mech. Eng. [in Chinese, with English summary]. doi:10.13722/j.cnki.jrme.2020.0099
Huang, R. Q., and Li, W. L. (2014). Post-earthquake landsliding and long-term impacts in the Wenchuan earthquake area, China. Eng. Geol. 182, 111–120 [in Chinese, with English summary]. doi:10.1016/j.enggeo.2014.07.008
Huang, R. Q., and Li, W. L. (2008). Research on development and distribution rules of geohazards induced by Wenchuan earthquake on 12th May 2008. Chin. J. Rock Mech. Eng. 27 (12), 2585–2592 [in Chinese, with English summary].
Keefer, D. K. (2000). Statistical analysis of an earthquake-induced landslide distribution—the 1989 Loma Prieta, California event. Eng. Geol. 58 (3), 231–249. doi:10.1016/S0013-7952(00)00037-5
Khattak, G. A., Owen, L. A., Kamp, U., and Harp, E. L. (2010). Evolution of earthquake-triggered landslides in the Kashmir Himalaya, northern Pakistan. Geomorphology 115 (1–2), 102–108. doi:10.1016/j.geomorph.2009.09.035
Khazai, B., and Sitar, N. (2004). Evaluation of factors controlling earthquake-induced landslides caused by Chi-Chi earthquake and comparison with the Northridge and Loma Prieta events. Eng. Geol. 71, 79–95. doi:10.1016/S0013-7952(03)00127-3
Lan, H. X., and Wu, F. Q. (2002). Analysis on susceptibility of gis based landslide triggering factors in Yunnan Xiaojiang watershed. Chin. J. Rock Mech. Eng. 21 (10), 1500–1506 [in Chinese, with English summary].
Li, C. R., Wang, M., and Liu, K. (2018). A decadal evolution of landslides and debris flows after the wenchuan earthquake. Geomorphology 323, 1–12. doi:10.1016/j.geomorph.2018.09.010
Li, L. J., Yao, X., Zhang, Y., Zhang, Y. S., Iqbal, J., Chen, J., et al. (2016). Surface recovery of landslides triggered by 2008 Ms 8.0 wenchuan earthquake (China): a case study in a typical mountainous watershed. Landslides 13 (4), 787–794. doi:10.1007/s10346-015-0594-1
Liang, J., Pei, X. J., Wen, Y., Luo, L. G., and Qin, D. J. (2019). Research on development and distribution rules of geohazards in Jiuzhaigou earthquake in 2017. J. Nat. Disasters 28 (05), 181–188.
Lin, W. T., Chou, W. C., and Lin, C. Y. (2008). Earthquake-induced landslide hazard and vegetation recovery assessment using remotely sensed data and a neural network-based classifier: a case study in central taiwan. Nat. Hazards 47 (3), 331–347. doi:10.1007/s11069-008-9222-x
Lu, T., Zeng, H. C., Luo, Y., Wang, Q., Shi, F. S., Sun, G., et al. (2012). Monitoring vegetation recovery after China's May 2008 Wenchuan earthquake using Landsat TM time-series data: a case study in Mao County. Ecol. Res. (27), 955–966. doi:10.1007/s11284-012-0976-y
Nakamura, H., Tsuchiya, S., Inoue, K., and Ishikawa, Y. (2000). Sabo against earthquakes. Tokyo: Kokon Shoin, 190–220 [in Japanese, with English summary].
Qiao, J. P. (2010). Theory and practice of landslide risk zoning. Sichuan University Press, 173 [in Chinese, with English summary].
Regmi, A. D., Dhital, M. R., Zhang, J. Q., Su, L. J., and Chen, X. Q. (2016). Landslide susceptibility assessment of the region affected by the 25 April 2015 Gorkha earthquake of Nepal. J. Mt. Sci. 13 (011), 1941–1957. doi:10.1007/s11629-015-3688-2
Shortliffe, E. H., and Buchanan, B. G. (1987). A model of inexact reasoning in medicine. Math. Biosci. 23 (3–4), 351–379. doi:10.1016/0025-5564(75)90047-4
Sun, G. Q., Chen, F., Yu, B., and Wang, N. (2020). Landslide change and its influence factors in central Nepal from 2001 to 2017. J. Univ. Chin. Acad. Sci. 37 (3), 308–316 [in Chinese, with English summary].
Tian, Y. Y., Xu, C., Ma, S. Y., Xu, X. W., Wang, S. Y., and Zhang, H. (2019). Inventory and spatial distribution of landslides triggered by the 8th August 2017 MW 6.5 Jiuzhaigou earthquake, China. J. Earth Sci. 30 (1), 206–217. doi:10.1007/s1258.3-018-0869-2
Vapnik, V. N. (1998). “Statistical learning theory,” in Encyclopedia of the sciences of Learning. 41 (4), 3185.
Varnes, D. J. (1984). Landslide hazard zonation: a review of principles and practice. Natural Hazards 3.
Wang, G. X. (2004). Landslide science and landslide control technology. China Railway Press, 100 [in Chinese, with English summary].
Wang, J., Jin, W., Cui, Y., Zhang, W., Wu, C., and Alessandro, P. (2018). Earthquake-triggered landslides affecting a UNESCO natural site: the 2017 Jiuzhaigou earthquake in the World national park, China. J. Mt. Sci. 15 (7), 1412–1428. doi:10.1007/s11629-018-4823-7
Wu, C. H., Cui, P., Li, Y. S., Irasema, A. A., Huang, C., and Yi, S. J. (2018). Seismogenic fault and topography control on the spatial patterns of landslides triggered by the 2017 Jiuzhaigou earthquake. J. Mt. Sci. 15 (4), 793–807, doi:10.1007/s11629-017-4761-9
Xie, Z. J., Zheng, Y., Yao, H. J., Fang, L. H., Zhang, Y., Liu, C. L., et al. (2018). Preliminary analysis on the source properties and seismogenic structure of the 2017 Ms 7.0 Jiuzhaigou Earthquake. Sci. China Earth Sci. 61, 339–352 [in Chinese, with English summary]. doi:10.1007/s11430-017-9161-y
Xu, C., and Xu, X. (2014). Statistical analysis of landslides caused by the MW 6.9 yushu, China, earthquake of April 14, 2010. Nat. Hazards 72 (2), 871–893. doi:10.1007/s11069-014-1038-2
Yi, Y. N., Zhang, Z. J., Zhang, W. C., Jia, H. H., and Zhang, J. Q. (2020). Landslide susceptibility mapping using multiscale sampling strategy and convolutional neural network: a case study in Jiuzhaigou region. Catena 195, 104851. doi:10.1016/j.catena.2020.104851
Keywords: jiuzhaigou earthquake, post-seismic landslide, spatio-temporal variation, certainty factor method, Susceptibility analysis
Citation: Guo X, Fu B, Du J, Shi P, Li J, Li Z, Du J, Chen Q and Fu H (2021) Monitoring and Assessment for the Susceptibility of Landslide Changes After the 2017 Ms 7.0 Jiuzhaigou Earthquake Using the Remote Sensing Technology. Front. Earth Sci. 9:633117. doi: 10.3389/feart.2021.633117
Received: 24 November 2020; Accepted: 18 January 2021;
Published: 24 February 2021.
Edited by:
Chong Xu, Ministry of Emergency Management (China), ChinaReviewed by:
Jia-wen Zhou, Sichuan University, ChinaFenghuan Su, Institute of Mountain Hazards and Environment (CAS), China
Muhammad Shafique, University of Peshawar, Pakistan
Copyright © 2021 Guo, Fu, Du, Shi, Li, Li, Du, Chen and Fu. This is an open-access article distributed under the terms of the Creative Commons Attribution License (CC BY). The use, distribution or reproduction in other forums is permitted, provided the original author(s) and the copyright owner(s) are credited and that the original publication in this journal is cited, in accordance with accepted academic practice. No use, distribution or reproduction is permitted which does not comply with these terms.
*Correspondence: Bihong Fu, ZnViaEBhaXJjYXMuYWMuY24=