 Sate Ahmad
 Haojie Liu
 Shajratul Alam2
 Gerald Jurasinski
 Bernd Lennartz
- 1Soil Physics, Faculty of Agricultural and Environmental Sciences, University of Rostock, Rostock, Germany
- 2Statistics, Jack Baskin School of Engineering, University of California, Santa Cruz, Santa Cruz, CA, United States
- 3Landscape Ecology and Site Evaluation, Faculty of Agricultural and Environmental Sciences, University of Rostock, Rostock, Germany
Fens belong to the most threatened ecosystems in Europe. Maintaining a high water table through rewetting is an effective measure to rehabilitate many of their ecosystem functions. However, the impact of meteorological conditions such as vapor pressure deficit (VPD) and precipitation on water tables is still unclear for rewetted fens. Here, we compare the impact of meteorological factors on water table dynamics in a drained and a rewetted fen, using multiple regression with data from continuous high-resolution (temporal) water level monitoring and weather stations. We find that an increase in the daily mean VPD causes a higher drop in the water table at the drained and degraded fen compared to the rewetted fen. Precipitation contributes to recharge, causing the water table to rise higher at the drained site than at the rewetted site. We attribute the differential influence of meteorological conditions on water table dynamics to different soil specific yield values (i.e., water storage capacity) largely driven by lower water table position at the drained site. Our study underlines the importance of understanding how and why water tables in peatlands vary in response to meteorological factors for management decisions (e.g., rewetting). Continuous monitoring of water table and vegetation development in rewetted fen peatlands is advisable to ensure long-term success especially under climate change conditions and associated drought events.
Introduction
Over the past century, about 90% of minerotrophic peatlands (fens; groundwater-fed peatlands) in Central Europe have been degraded through artificial drainage and deforestation (Joosten and Couwenberg, 2001). As a result, fens have been recognized as one of the most threatened ecosystems in Europe (Schrautzer et al., 2007). Maintenance of water table at or near the peat surface prevents carbon mineralization, allows peat accumulation (Michaelis et al., 2020; Mrotzek et al., 2020), and improves ecosystem functions such as hydrological buffering, water purification, erosion protection, and climate regulation (Kimmel and Mander, 2010; Lennartz and Liu, 2019; Ahmad et al., 2020c; Günther et al., 2020). Therefore, restoration of degraded peatlands is an important climate change mitigation measure, as peatlands store much of the global terrestrial carbon stock. Although hydrological restoration of peatlands has been implemented throughout Europe and North America (Lamers et al., 2015), rewetted peatlands are under pressure from climate change (Levison et al., 2014). Shifting precipitation patterns and increasing evapotranspiration resulting from global warming may further degrade peatlands (Tarnocai, 2009; Nijp et al., 2015; Helbig et al., 2020). However, the impact of a changing climate on peatland ecohydrology through extreme weather events such as droughts is likely not uniform over different spatial scales and climatic zones. Part of this variability is due to a variation in local meteorological conditions and differences in land management.
Meteorological factors such as temperature, precipitation and relative humidity may affect the water table in peatlands through several processes such as recharge and evapotranspiration (Bridgham et al., 1999; Ferone and Devito, 2004; Menberu et al., 2016; Cooper et al., 2019). The combined effect of air temperature and relative humidity on evapotranspiration and thus on water table fluctuation can be understood by computing the vapor pressure deficit (VPD). VPD is the difference between the amount of moisture in the air and how much of it the air can hold when at saturation at a certain temperature. VPD is considered an accurate indicator of the actual evaporative capacity of the air (Allen et al., 1998).
The effect of such meteorological parameters on water table fluctuation may also be modified by microtopography, vegetation, soil properties, and land management (Dunne et al., 1991; Baldocchi et al., 2004). Peat soils are highly heterogeneous porous media (Rezanezhad et al., 2016; Ahmad et al., 2020b; Liu et al., 2020a) with hydraulic conductivities that may vary over two orders of magnitudes within the same peat horizon (Liu and Lennartz, 2019). The spatial differences in soil properties can cause different responses of the water table to precipitation at different locations within a peatland. Furthermore, peatland rewetting can alter the prevailing vegetation structure and composition (Schrautzer et al., 2013; Malhotra et al., 2016), which can further modify the interactions between meteorological factors and the water table. For example, the relationship between temperature and water loss may be modulated by stands of dominant vegetation, with high evapotranspirative demand (Bridgham et al., 1999).
Water management regimes in peatlands are of key importance and can modify how the water table reacts to meteorological controls by altering peat properties and water table position. In terms of peat properties, specific yield, which is the amount of water that would drain from a unit of soil if the water table would drop by a unit height (Childs, 1969), influence water table response to precipitation (Ahmad et al., 2020c) and evapotranspiration (Ahmad et al., 2020a) as well as controls water table variation (Menberu et al., 2016). Lowering the water table, for example by artificial drainage, exposes the peat to an oxygen-rich environment. As such, aerobic decomposition occurs at a rapid pace, degrading the peat and starting a cascade of different hydrophysical and biogeochemical processes. As aerobic decomposition continues, carbon dioxide and nitrous oxide are released from the system further contributing to global climate forcing (Tiemeyer et al., 2016; Liu et al., 2019, 2020b). The carbon mineralization process and shrinkage cause the peat to become more consolidated and compacted, and as such the hydrophysical properties of peat change (Hooijer et al., 2012; Pronger et al., 2014). With increased effective stress, larger pores in the peat structure are the first to collapse as they are the least supported (Strack et al., 2008) and as such macroporosity decreases. Due to a reduction in macroporosity, saturated hydraulic conductivity decreases (Branham and Strack, 2014; Liu et al., 2016), which further affects the hydrology of peatlands (Whittington and Price, 2006). The reduction in pore size lowers the soil specific yield and thus lowers water storage capacity (Liu and Lennartz, 2019; Liu et al., 2020a). At a given site, following drainage, as the water storage capacity reduces (indicated by a lower peat specific yield), water table fluctuations increase (Whittington and Price, 2006; Menberu et al., 2016). Peatland rewetting raises the water table position and new peat accumulation can occur under saturated conditions (Mrotzek et al., 2020), thereby increasing the peat specific yield (Ahmad et al., 2020c).
The majority of published studies on the link between peatland ecohydrological processes and meteorological conditions so far focus on bogs (ombrotrophic peatlands or rainfed mires; Price, 1996; Ruseckas and Grigaliūnas, 2008; Bourgault et al., 2019; Philippov and Yurchenko, 2019), while similar studies on fens are sparse. Therefore, meteorological effects on water table dynamics in fens, especially with a focus on different management measures (such as rewetting or artificial drainage), are understudied. Establishing such links in fen peatlands is of utmost importance in light of shifting local and global climate regimes. For example, while recent decades are characterized by increasing temperatures worldwide, a resulting exponential increase in vapor pressure deficit has also been observed. Such increases have an impact on terrestrial ecosystems through drought-induced plant mortality (Grossiord et al., 2020), reduced vegetation growth (Yuan et al., 2019), and potentially evapotranspiration associated water table decline. Therefore, rewetting of drained peatlands may become more challenging with increasing VPD, as these ecosystems depend on high water levels as well as plant production to maintain peat accumulation.
To address such shortcomings, we (1) investigate how on-site meteorological conditions (VPD and precipitation) act as controls over water table dynamics (2) unravel the underlying mechanisms involved, and (3) evaluate how these hydrological controls differ over different management regimes (drained versus rewetted). To this end, we characterize water table dynamics, estimate the effect of daily mean VPD and rainfall on the water table and quantify rain-free day actual evapotranspiration at a drained and a rewetted fen in North-east Germany.
Materials and Methods
Study Sites
The two study sites (drained fen, PD and rewetted fen, PW) are located in the federal state of Mecklenburg-Vorpommern, Germany (Figure 1). They are 8 km apart and together belong to one of the largest connected fen complexes in northeastern Germany (Jurasinski et al., 2020). According to the hydrogenetic mire classification system (Succow and Joosten, 2001; Joosten et al., 2017), they are “percolation fens” which are minerotrophic peatlands that depend on a large supply of water that is distributed evenly throughout the year. Percolation fens are often located along river valleys which are remains of meltwater channels of the last glaciation, where permanent groundwater flow from adjacent moraines caused paludification (Koch and Jurasinski, 2015). Both sites were drained before 1750. In PW, land drainage was intensified in around 1970 for high-intensity pasture management. In 1997, the site PW was rewetted by ditch blocking, as a part of the state peatland conservation program and the EU-LIFE program, while PD remains drained. PD can be considered to be a fairly homogenous grassland, with a dominance of Ranunculus repens L. and Deschampsia cespitosa (L.) P. Beauv. with some Holcus lanatus L. and Poa trivialis L. PW is much more diverse with a mosaic of several dominant stands that established after rewetting. The studied plot in PW is dominated by Carex acutiformis Ehrh., with few occurrences of Epilobium hirsutum L. In recent times, PW can be considered to feature near-natural percolation fen vegetation and is part of a larger valley mire system (Tiemeyer et al., 2006). Recent studies have found evidence that rewetting of PW has resulted in peat accumulation of around 11 cm, corresponding to 4.5 kg m–2 of organic matter (Michaelis et al., 2020; Mrotzek et al., 2020). The relevant site characteristics have been described by Jurasinski et al. (2020) and Ahmad et al. (2020c).
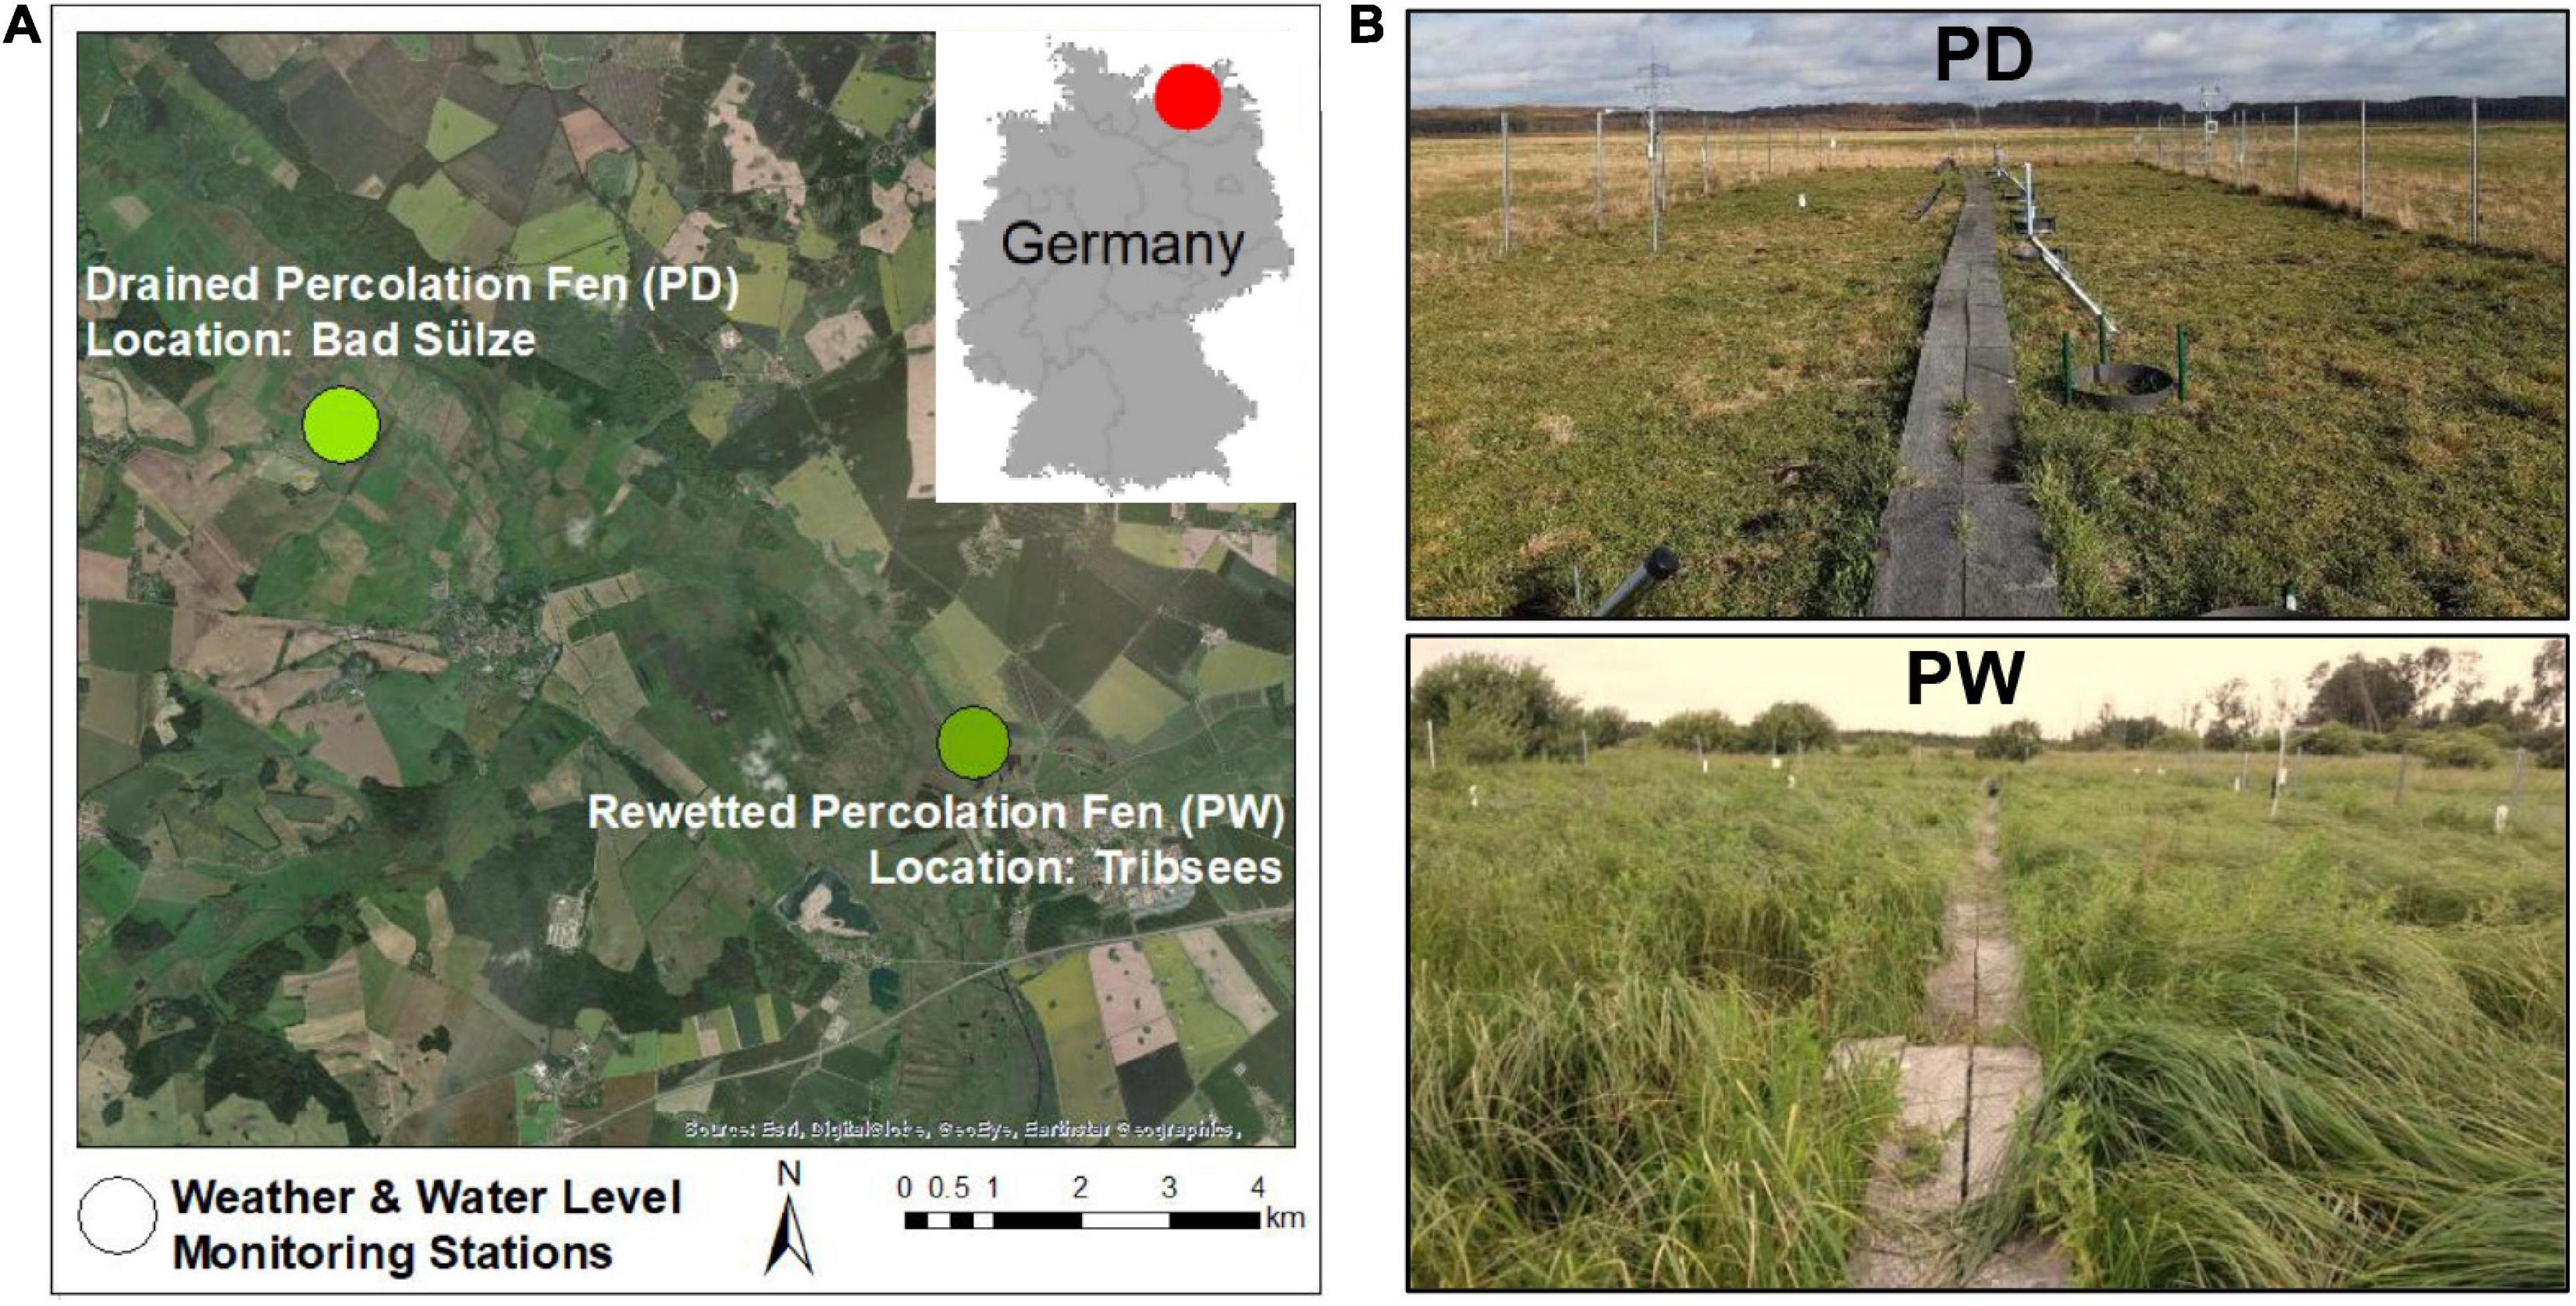
Figure 1. (A) the study sites include a drained fen and a rewetted fen in Mecklenburg-Vorpommern. (B) the study plots at PD (upper panel) and PW (lower panel). The weather station at PD appears on the right of the photo. Photo: Haojie Liu (PD) and Michael Franz (PW).
Data Acquisition and Analyses
As part of the WETSCAPES project, described by Jurasinski et al. (2020), one water level logger (SEBA hydrometrie Dipper-PT) was installed for each site, and data was registered every 15 min. Weather stations were also installed at each site, which recorded precipitation (Rain Collector #07852, Davis Instruments), relative humidity and temperature (KPK 1/5-ME, Galltec Mess- und Regeltechnik GmbH and MELA Sensortechnik GmbH) every 10 min using an automated data logger CR300 from Campbell Scientific. Datasets are available on request.
All data were merged and temporal scales were matched to 30-min intervals. All data analyses were carried out using the R version 4.0.3 (R Core Team, 2019). For our analysis, we used data from 22 September 2017 through 19 August 2020 (2.9 years) for both sites. The dataset was aggregated to daily resolution by calculating daily precipitation sums and daily maximum and minimum values of relative humidity and air temperature. Following Allen et al. (1998, Chapter-3) daily mean VPD was calculated as the difference between saturated vapor pressure (Es) and actual vapor pressure (Ea). Es was computed using Eq. 1 and Ea was computed using Eq. 2. The graphical representation of daily mean air temperature and VPD for both sites are provided in Supplementary Material (Supplementary Figure 1).
Where, Es = the saturation vapor pressure (kPa), Ea = actual vapor pressure (kPa), Tmin = minimum daily temperature (0C), Tmax = maximum daily temperature (0C), RHmin= minimum relative humidity (%) and RHmax = maximum relative humidity (%) and VPD = daily mean vapor pressure deficit (kPa).
Multiple linear regression models were constructed using the “lm” function in R (R Core Team, 2019), by setting the water table as the dependent variable and daily mean VPD and total daily precipitation as the independent variables. Seasonality was statistically adjusted by using dummy/indicator variables of each month (11 months in total) with January as the reference month. This approach is commonly used to control for seasonality or periodicity (Hyndman et al., 2020 – Chapter 5.4; Maki et al., 1978; Hylleberg et al., 1993). Our analysis is based on the assumption that net radiation at the two study sites is the same because of their proximity to each other.
The summary statistics of the key variables are provided in Table 1. It should be noted that the purpose of the multiple linear regression analysis is to compare the drained fen with the rewetted fen and not to predict or model the peatland water tables.
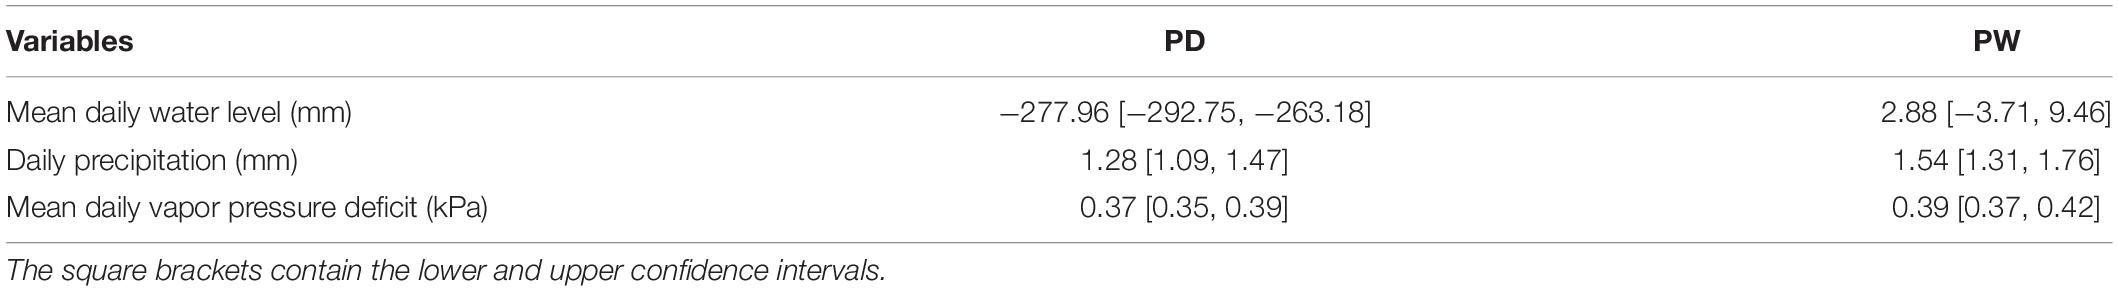
Table 1. Mean values of daily water level and meteorological variables for PD and PW.
Evapotranspiration and Soil Specific Yield Determination
To further investigate the underlying processes of how temperature and humidity impacts water table dynamics through VPD, rain-free day evapotranspiration (ET) from May to October was estimated for both sites using the Hays method (Hays, 2003), which is a modification of the White method (White, 1932). For ecosystems with shallow water tables, groundwater use by vegetation through evapotranspiration (ET) in addition to evaporation of soil moisture can be estimated by analyzing water table fluctuation which is relatively simple to implement (Mould et al., 2010; Mazur et al., 2014; Ahmad et al., 2020a). Water level fluctuation methods can be useful to apply in wetland ecosystems for estimating ET especially because it integrates several factors, including the growth-cycle of plants, the plant types, and moisture availability which are generally missing from micrometeorological methods of ET determination (Lautz, 2008; Mazur et al., 2014). The equation for ET determination is as follows:
where, ET = evapotranspiration rate (mm/day); H1 = highest water level (mm) on the observed day (usually early morning), H2 = highest water level on the day after the observed day (mm), L = lowest water level (mm) on the observed day (usually evening), T1 = time between L and H2 (rising period), T2 = time between H1 and L (drawdown period), Sy = mean soil specific yield (dimensionless) for the observed diurnal water table fluctuation (see an example of diurnal water table fluctuation in Figure 2 with respective equation parameters being labeled accordingly). Graphs of days with diurnal groundwater fluctuation for different water table depth stages have been provided as Supplementary Material (Supplementary Figure 2).
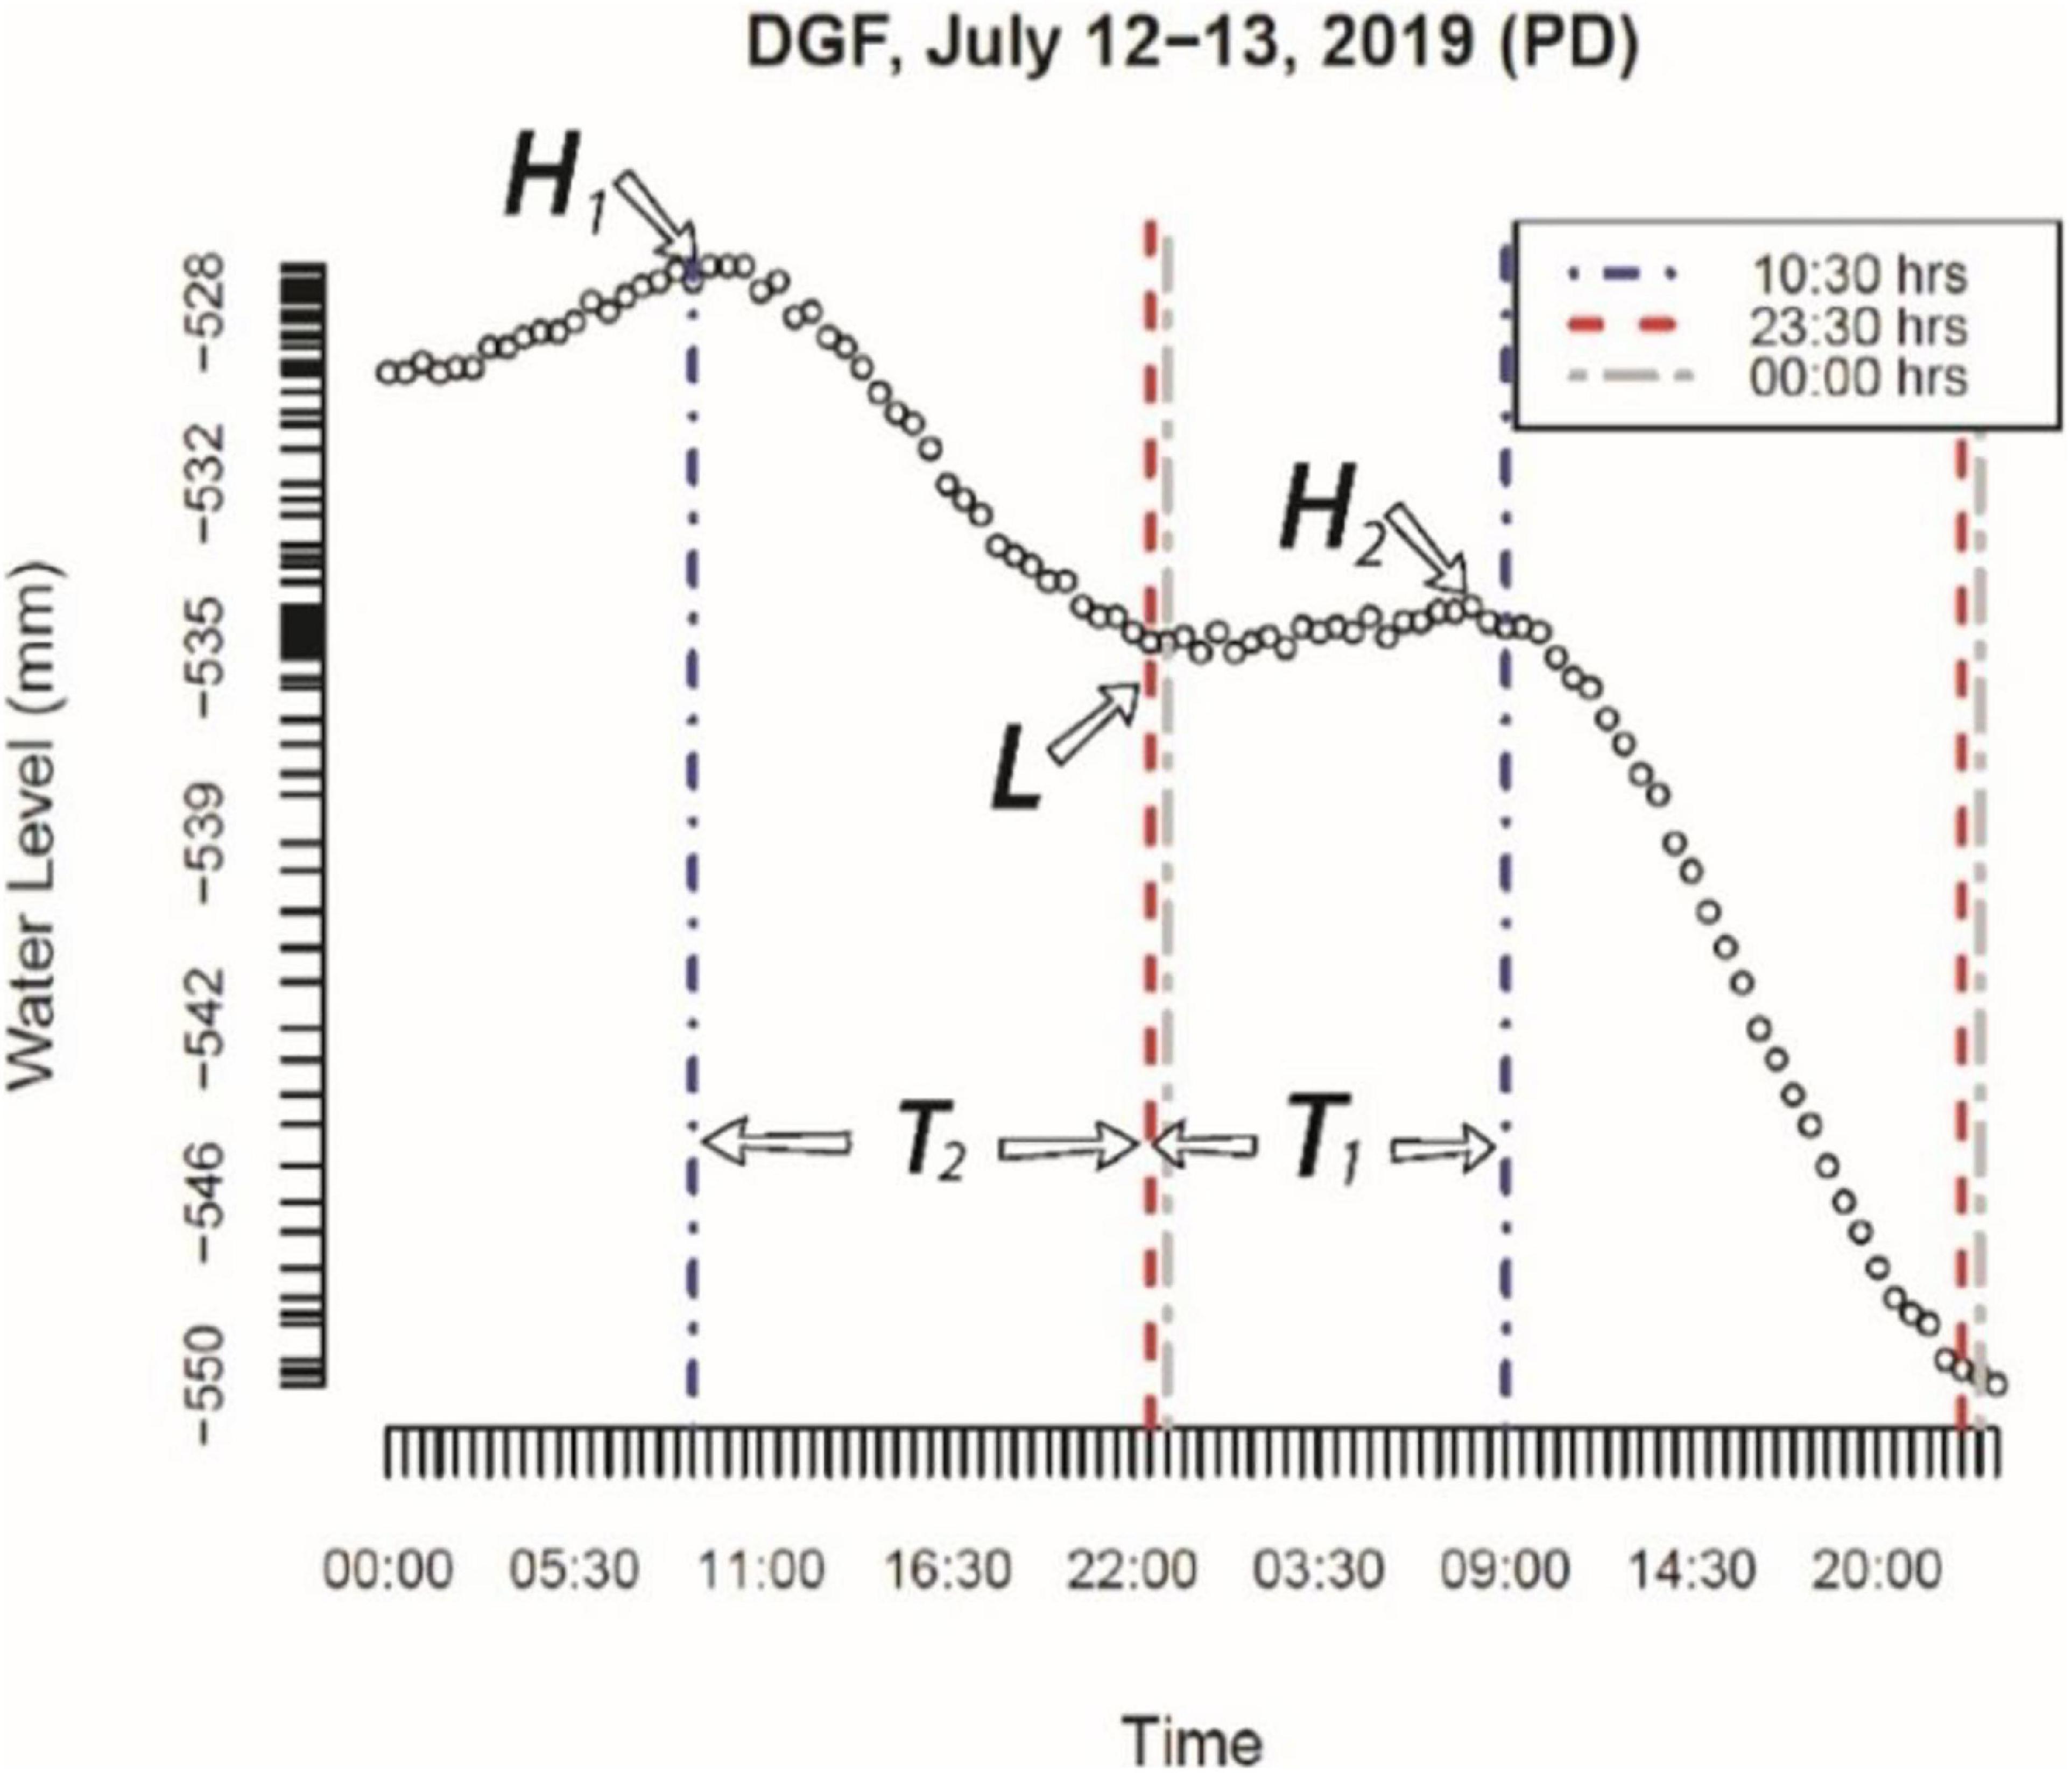
Figure 2. An example of diurnal water table fluctuation (DGF) on a rain-free day at PD. Negative values indicate belowground.
In the first part of Eq. 4, evapotranspiration is calculated as the water level difference between the low L and the high H1 of the given day. This period of groundwater level fall (T2) is the “drawdown period” which includes water uptake by plants, soil moisture evaporation, and net groundwater inflow. The second component of the equation is then added, which quantifies the latent water rise caused by inflow during the drawdown period. A key assumption is that ET is zero during this time (Hays, 2003; Mould et al., 2010). Another assumption is that the rate of net groundwater inflow for a given diurnal groundwater fluctuation is constant at H1 and H2 as they occur within a 24 h period.
Evapotranspiration was estimated using the dataset with a 30-min resolution. A user-defined function was developed in R to determine evapotranspiration according to Eq. 4, which calculates H_1 as the maximum water level of a given day, L as the minimum water level of the given day, and H_2 as the maximum water level of the following day. If the values of T_1 and T_2 did not add up to 24 h for a given diurnal groundwater fluctuation, the values of ET were corrected to represent 24 h by dividing the ET value by T_1 + T_2 and multiplying the result by 24 (hours). The function was applied only to days with diurnal fluctuations in the absence of rainfall in both study sites, evaluated using a graphical method. Diurnal water table fluctuation patterns were not evident for flooded conditions and thus ET was not estimated for such conditions. In total, daily ET could be determined for the same 55 days for PD and PW. The Shapiro-Wilk test showed that the differences of ET between the PD and PW are normally distributed (W = 0.96; p-value = 0.108). Thus, statistical testing was done using paired t-test, pairing the ET values of the sites on the same day.
Soil specific yield, which is the amount of water that would drain from a unit of soil if the water table would drop by a unit height (Childs, 1969), is a required parameter to determine ET when using the diurnal groundwater fluctuation method (see above). To determine soil specific yield we used the following equation according to several authors (Dolan et al., 1984; Dettmann and Bechtold, 2016a; Bourgault et al., 2017; Ahmad et al., 2020a):
where, Sy = soil specific yield, Pre = quantity of precipitation in mm, during the rainfall event, ΔGWL = change in groundwater levels which is the difference between the water levels at the start of the precipitation events and the water levels at the end of the events.
According to Bourgault et al. (2017) this method assumes that the time lag between the end of each precipitation event and the resulting water table position to be sufficiently short for evapotranspiration, net subsurface flow and water table recession following the precipitation events. Additionally, this method assumes that recharge is equal to precipitation (i.e., runoff is negligible), that the static equilibrium water content profile within the unsaturated zone is reached instantaneously following the precipitation event and that any deviation of the Pre/ΔGWL ratio from a theoretical model will be the result of the presence of capillary fringe, air entrapment, peat expansion and shrinkage, net subsurface flow, water table recession following precipitation and antecedent moisture content of the unsaturated zone (Bourgault et al., 2017). As we are interested in finding out difference in soil specific yield with depth, we did not include the calculation of surface specific yield.
Pre and ΔGWL were calculated using a user-defined function following Ahmad et al. (2020a) and Ahmad et al. (2020c). The function estimates the quantity of precipitation during precipitation events (in mm) and the respective event duration (in h) using a temporal moving window of 6 h. Summation of precipitation quantity and event duration stopped if precipitation ceased for 30 min. The initial and final water levels were recorded, and the difference (ΔGWL) was calculated for each event. The soil specific yield was plotted against the mean water level (determined as the mean of the initial and the final water level for each precipitation event, Figure 3). All events with water levels above the peat surface and all negative values of ΔGWL (indicating declining water levels despite ongoing precipitation) were removed. Specific yield values were constrained to belowground levels as we focus on belowground ET rates. The effect of antecedent soil moisture was assumed to be negligible. A certain rainfall intensity is required for initiating a water table response. We filtered PD to only include rainfall events of at least 0.33 mm h–1 intensity. We reduced the threshold for PW to be able to include more events, since PW, being a rewetted site, has water level at the surface for most of the year. Thus, events with intensities of at least 0.1 mm h–1 were included for PW. The final number of rainfall events for PD is 73 and for PW is 65. The smoothing function “loess()” (R Core Team, 2019) was used to determine the soil specific yield for a given mean water level which is indicative of peat depth. The mean soil specific yield for a given diurnal fluctuation was used in the ET Eq. 4 depending on the mean water level for the diurnal fluctuation.
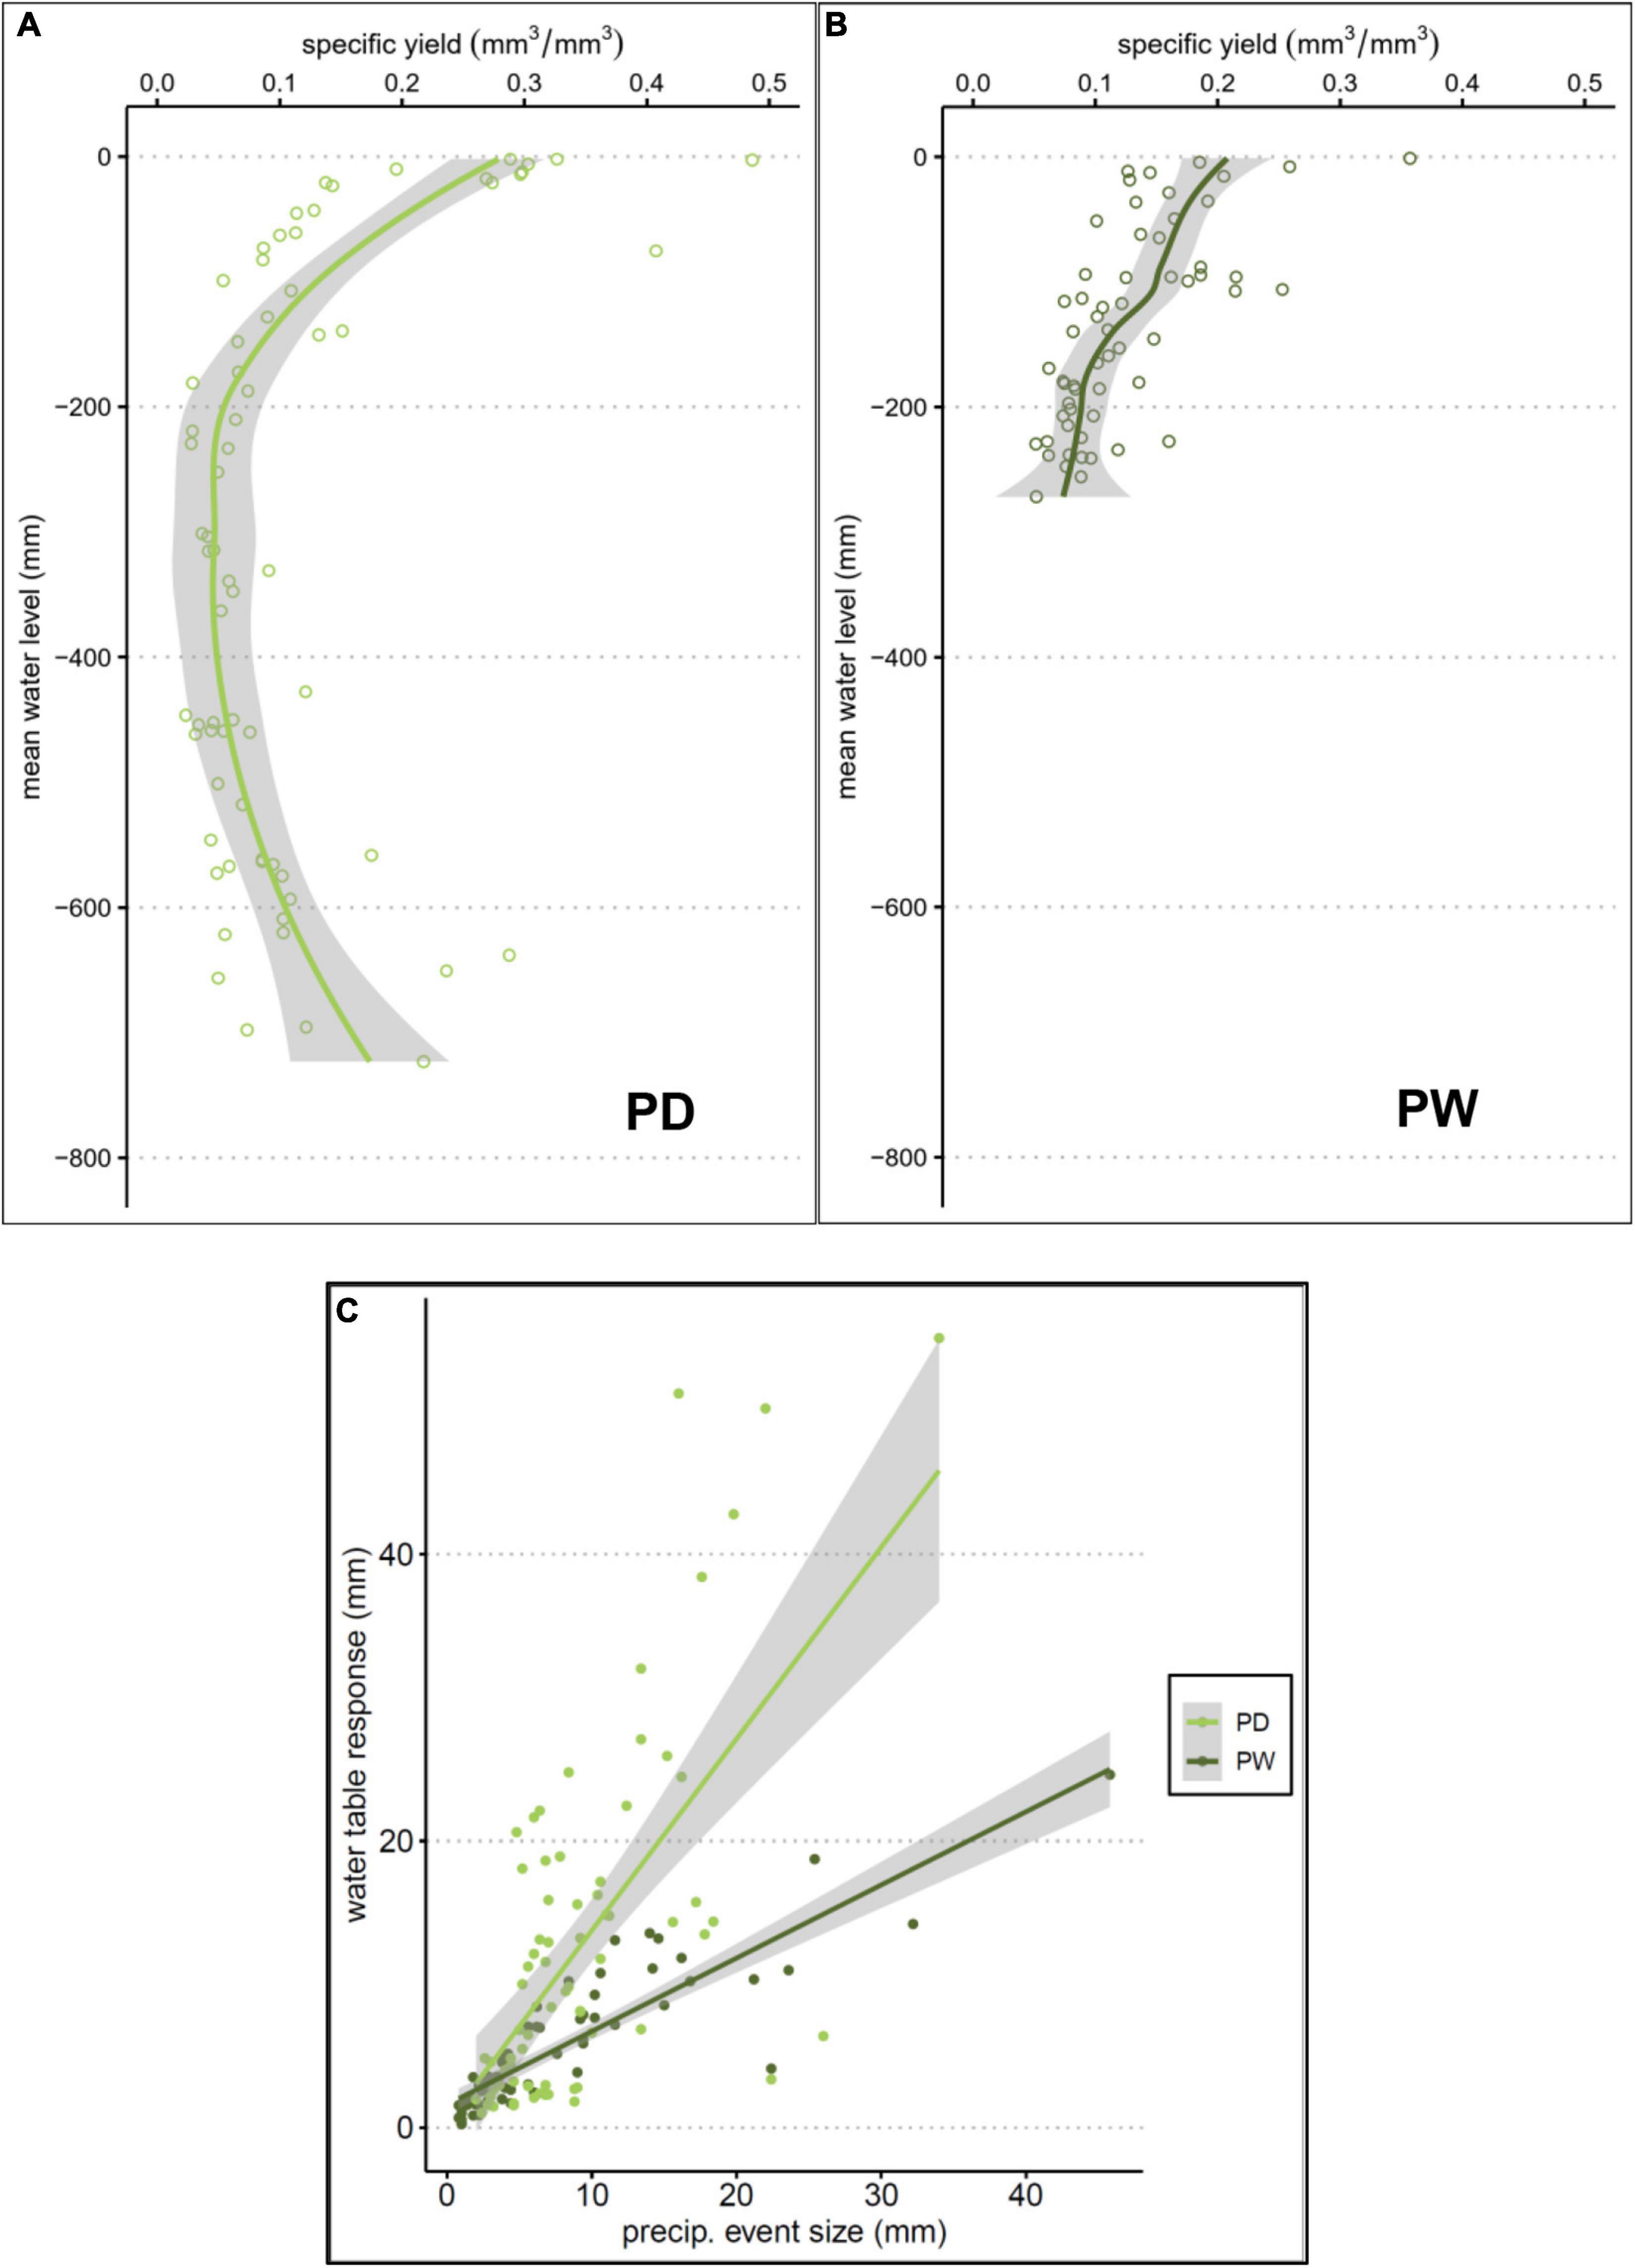
Figure 3. Soil specific yield determined as the precipitation event size (mm) to groundwater table response ratio (Pre: ΔGWL) according to mean water level for (A) PD and (B) PW. The solid lines represent the loess smoothing function and the shaded area represents the 95% confidence interval. (C) water table response to precipitation event size for both PD and PW.
Results
Water Table Characteristics and Meteorological Conditions
Both sites show a clear seasonality in water tables as well as in meteorological factors (Figures 4, 5). The water level at the drained fen (PD), is below the peat surface for most of the year, with a substantial drop from the middle of spring to the end of summer for all 3 observed years. Even at the rewetted fen (PW), the water table receded substantially to about −300 mm in the summers of 2018 and 2019. Receding water tables at both sites occur at times of rising daily maximum air temperatures and an absence of substantial rainfall (Figures 4, 5; for each site, an example of such a period has been indicated by a translucent pink band). The exceptionally dry late autumn and early winter seasons of 2018 and 2019, caused water levels to stay well below the peat surface at PD. For PD, the maximum daily rainfall (43 mm) occurred in October 2017 and for PW in July 2018 (46 mm). Autumn and winter seasons are characterized by high daily minimum humidity. Daily mean VPD values at both sites show close agreement with daily air temperatures.
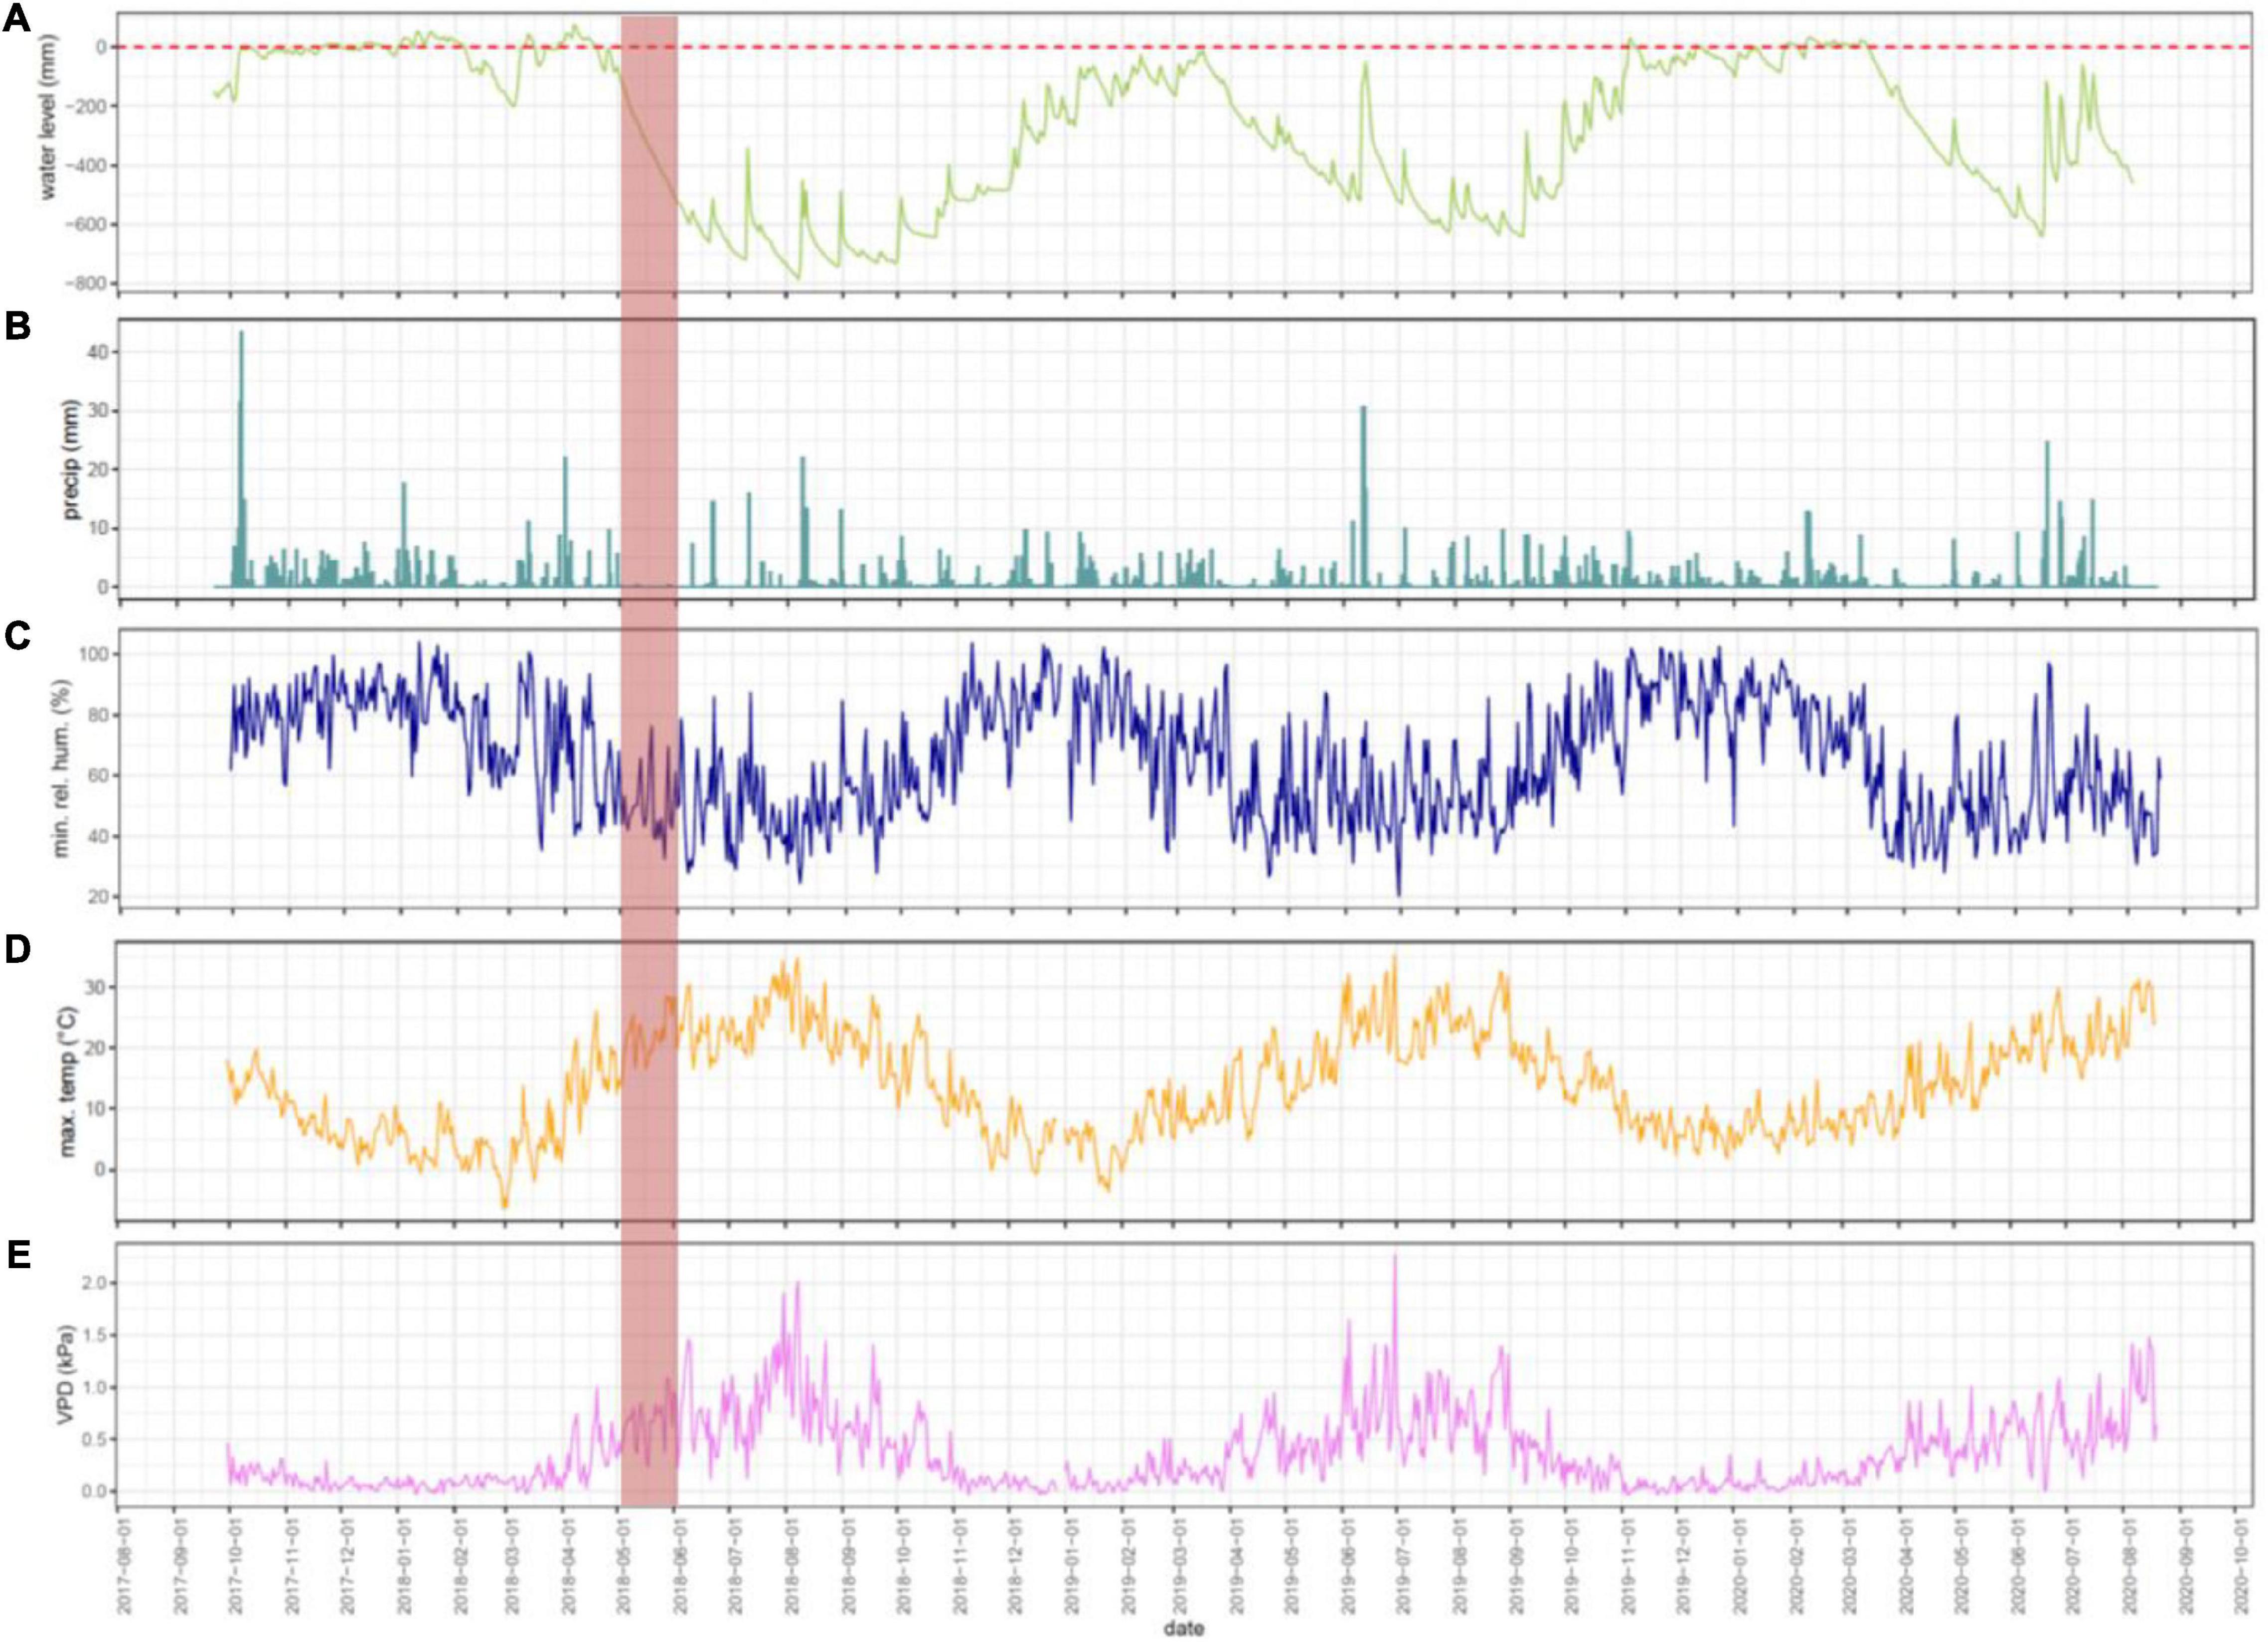
Figure 4. Daily time series of (A) water level (B) precipitation (C) minimum relative humidity (D) maximum air temperature (E) mean vapor pressure deficit at PD. Dashed lines in panel (A) represent the peat surface while positive values indicate aboveground and negative values indicate belowground. An example of rapid water level decline during high maximum daily air temperatures and absence of substantial rainfall is indicated by the translucent pink band.
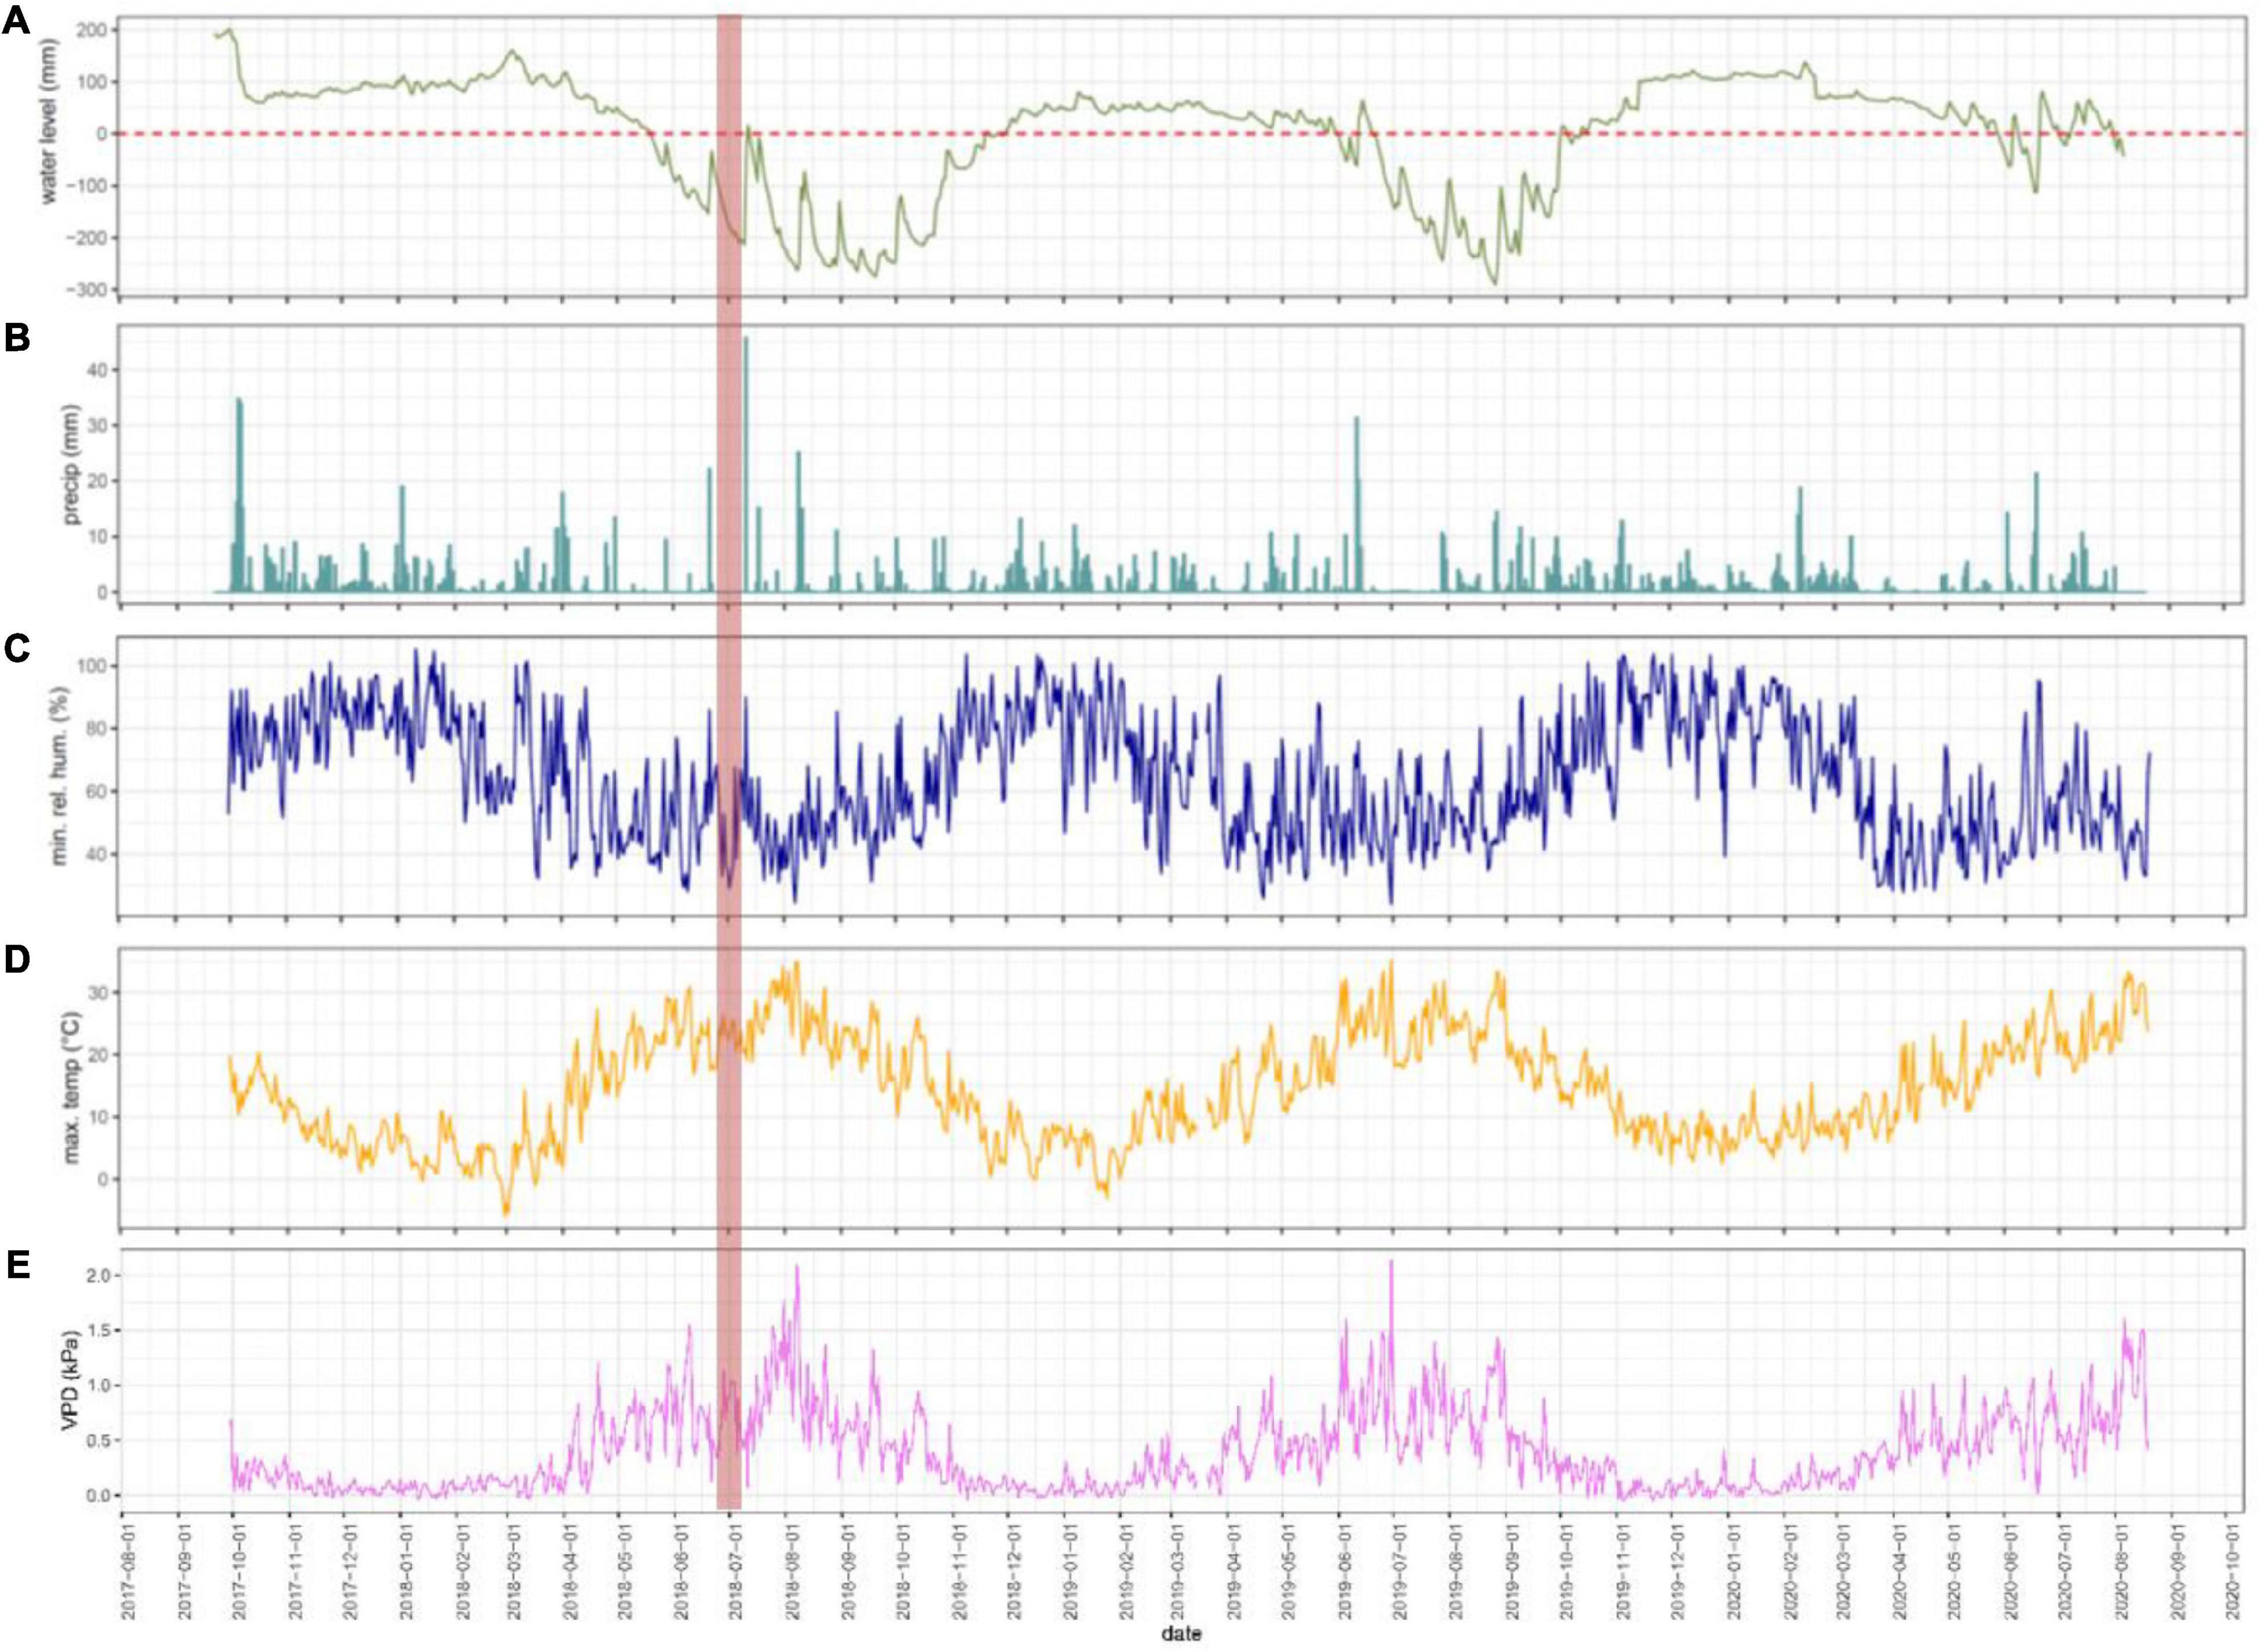
Figure 5. Daily time series of (A) water level (B) precipitation (C) minimum relative humidity (D) maximum air temperature (E) mean vapor pressure deficit at PW. Dashed lines in panel (A) represents the peat surface while positive values indicate aboveground and negative values indicate belowground. An example of rapid water level decline during high maximum daily air temperatures and absence of substantial rainfall is indicated by the translucent pink band.
The Effect of Meteorological Factors on the Water Table
An increase in daily mean VPD causes the water table to fall much further at PD than at PW. Similarly, an increase in daily precipitation induces the water table to rise more at PD than at PW. The water table at both sites shows an immediate response to rainfall. All meteorological regression terms are significant. Both models (for PD and PW) help to significantly explain more than 59 percent of the variation in the water level. The results of the multiple linear regression for both sites are presented in Table 2. A graphical representation of the estimated coefficients for the meteorological factors is provided in the Supplementary Material (Supplementary Figure 3).
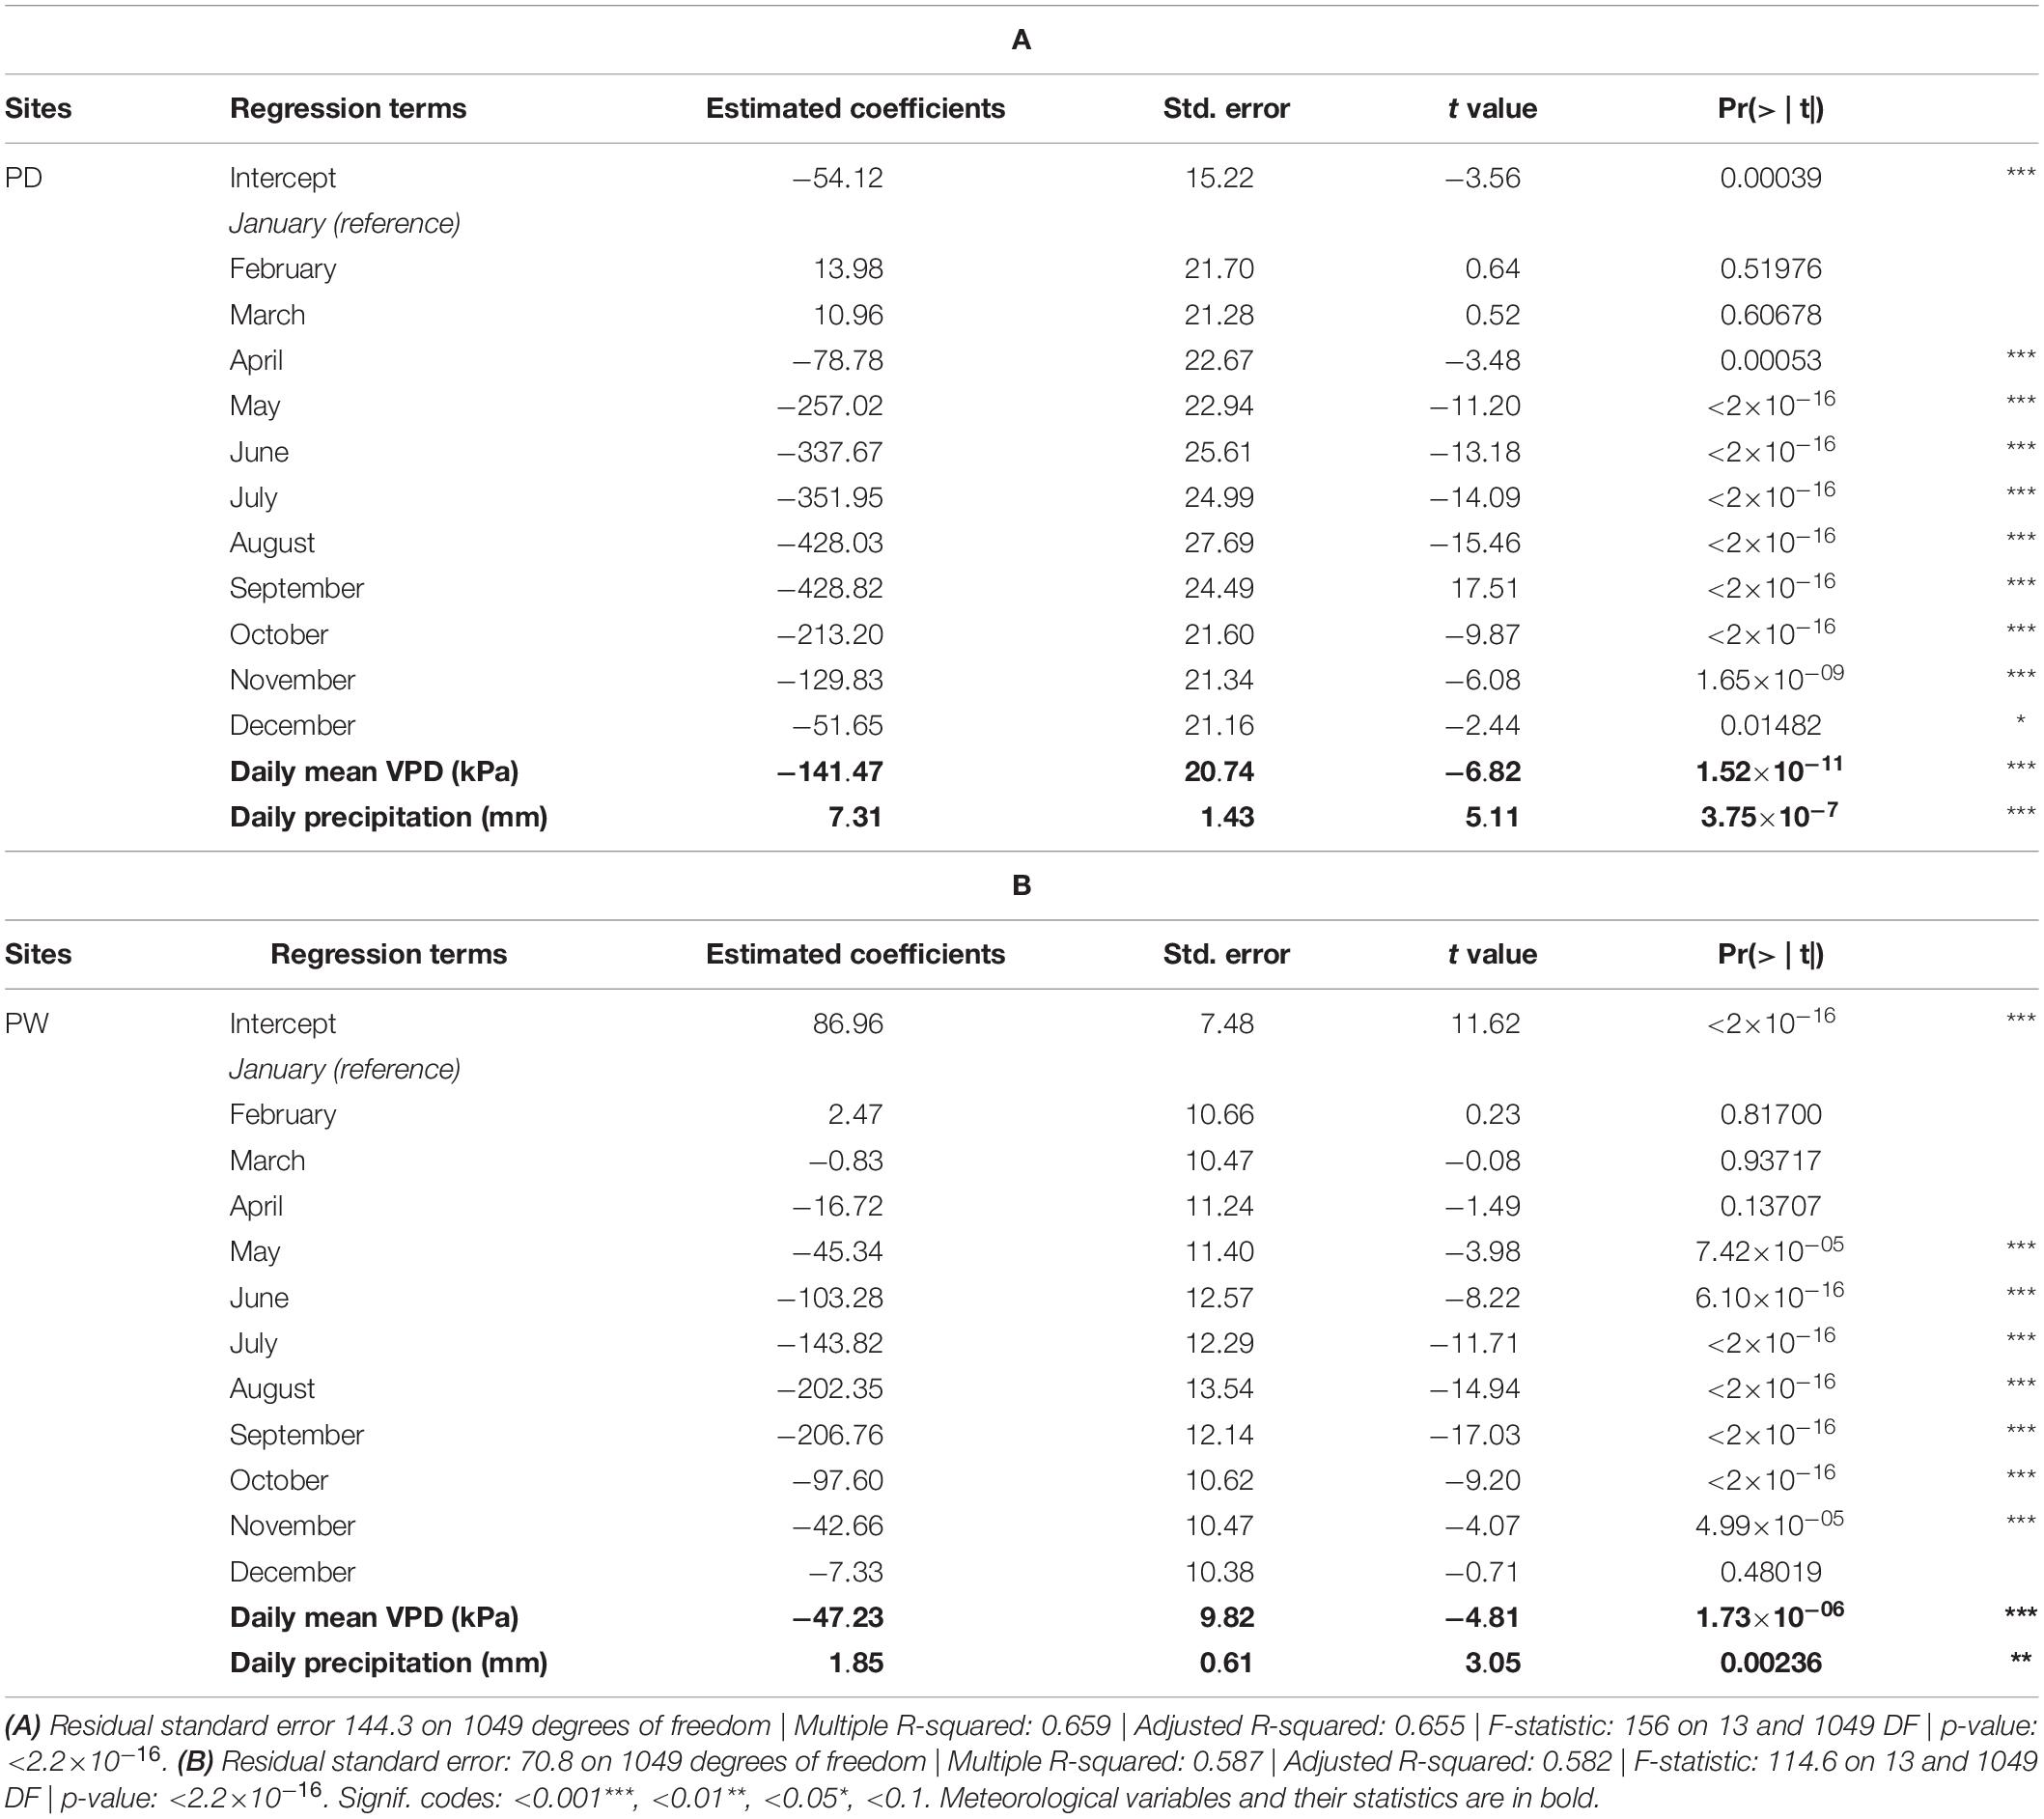
Table 2. Multiple linear regression of water level at (A) PD and (B) PW.
Actual Evapotranspiration and Soil Specific Yield During Rain-Free Days
Daily evapotranspiration (ET) for 55 rain-free days was estimated for PD and PW. Mean ET at PD was 1.96 mm d–1 (minimum-maximum: 0.70 mm d–1 – 4.11 mm d–1), while at PW mean ET was much higher (4.79 mm d–1, minimum-maximum: 2.16 mm d–1 – 8.73 mm d–1). Paired t-test reveals that ET at PW was significantly higher than at PD for the same days (mean difference = 2.82 mm d–1 [95% CI = 2.29 and 3.34], Figure 6A). Evapotranspiration at both sites differed over the months, with PW showing higher evapotranspiration compared to PD, for any given month (Figure 6B).
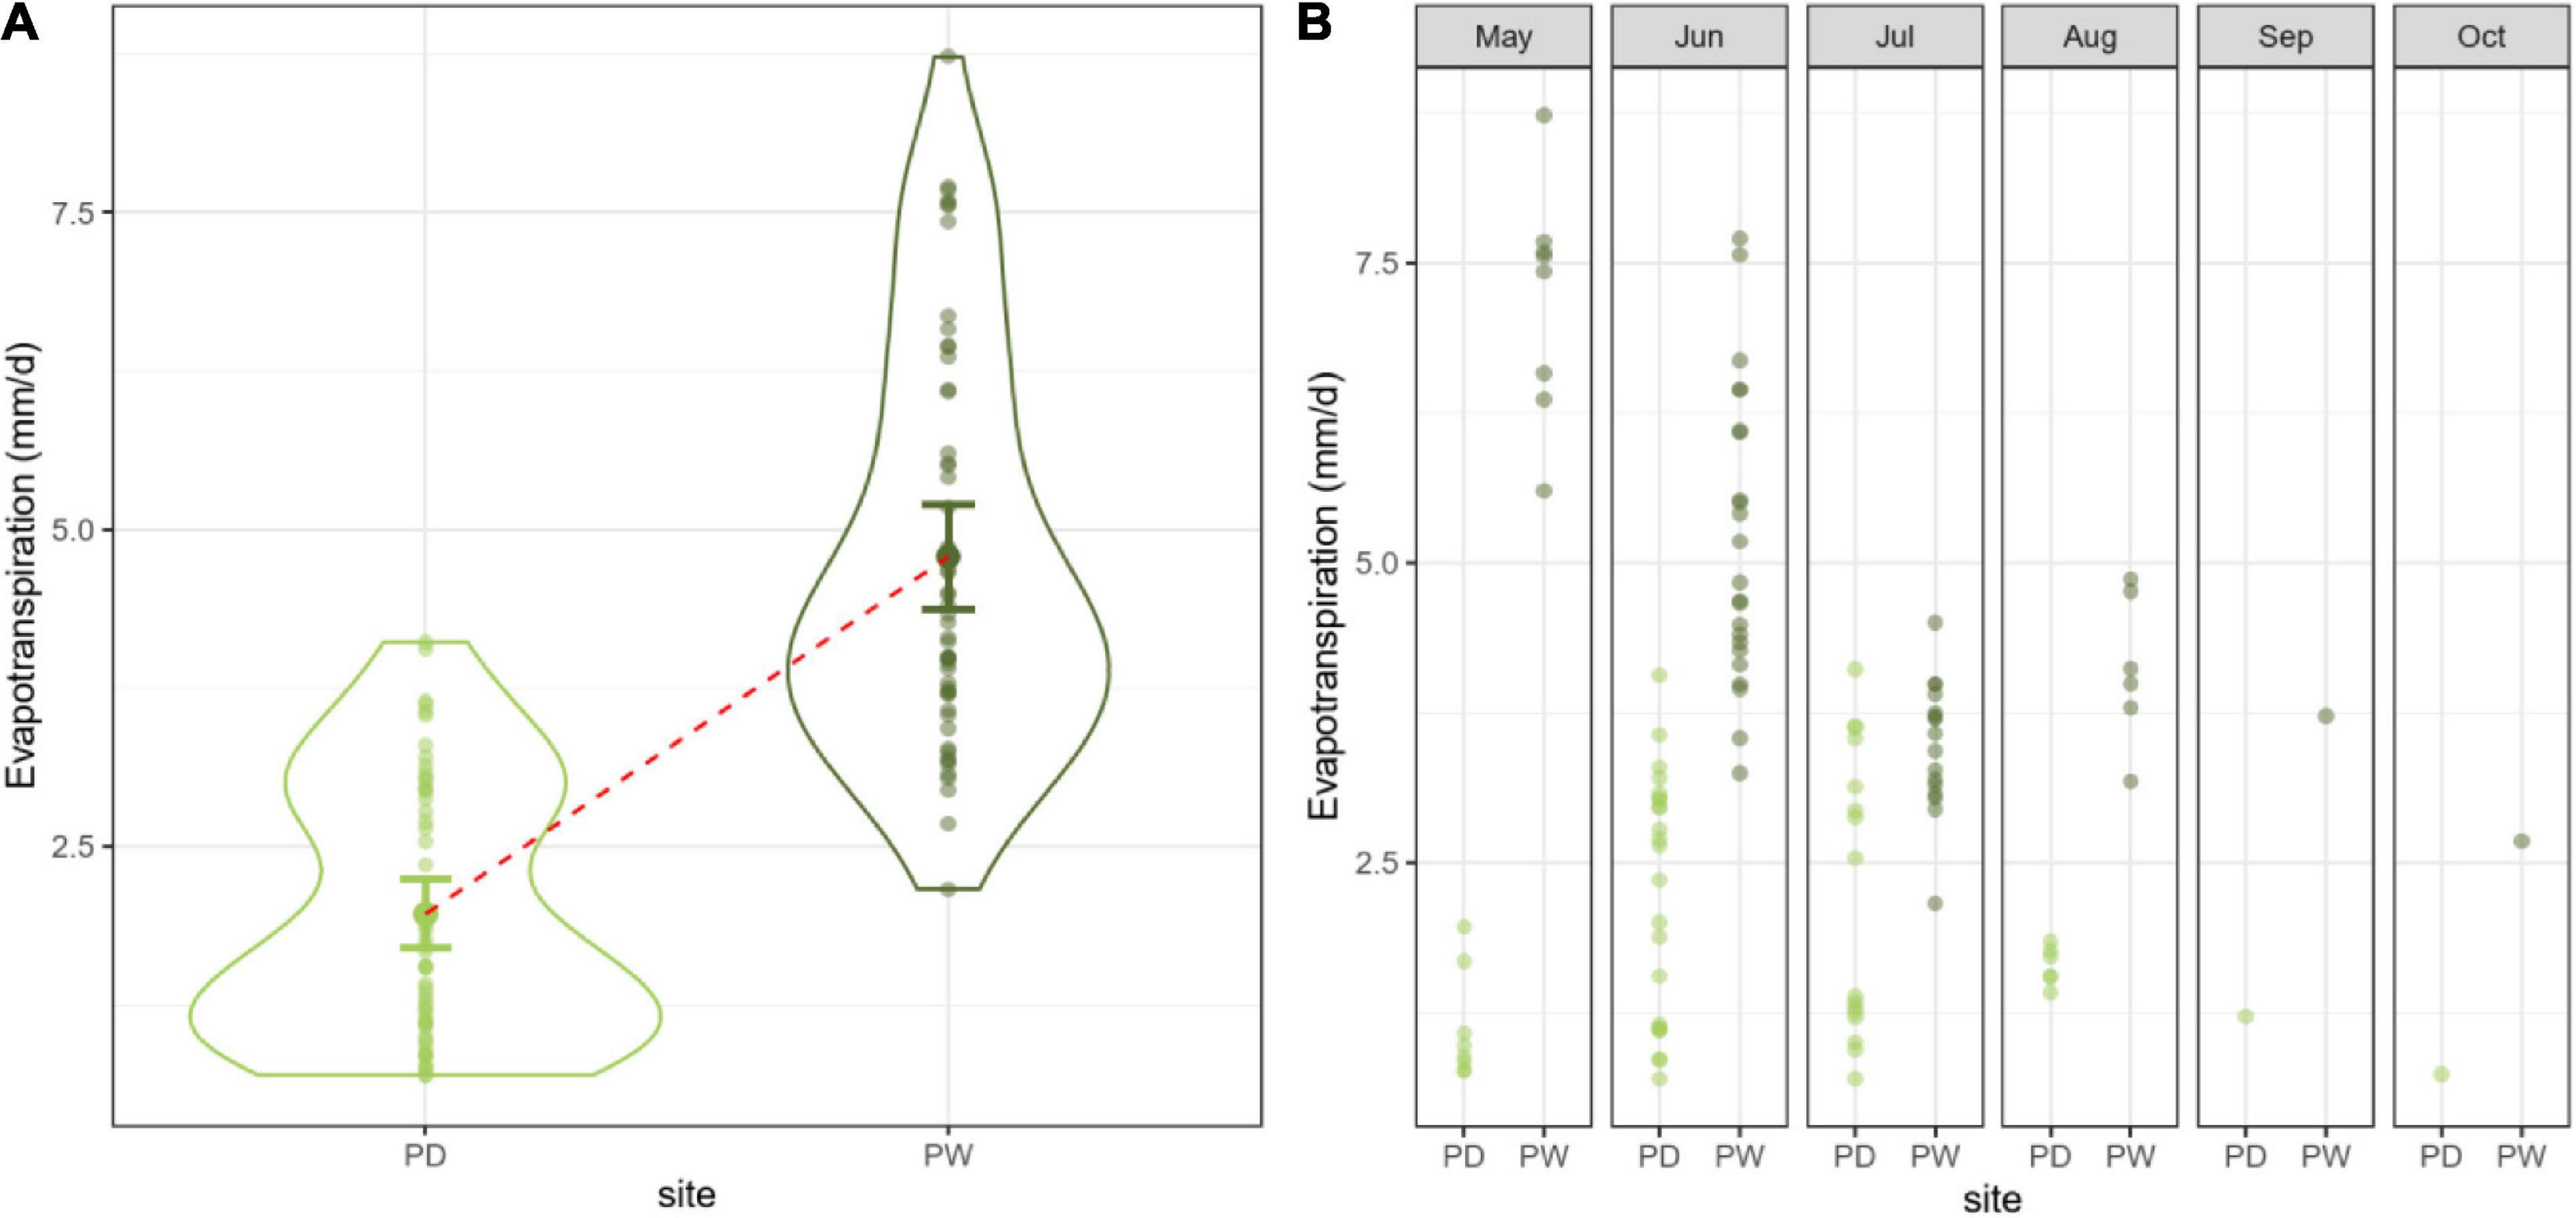
Figure 6. (A) Violin plots of ET with mean and error bars (95% confidence interval). The red dotted line connects the two means (of PD and PW). The violin shapes show the distribution of the data for each site. (B) Evapotranspiration for both sites according to months (in panels).
The average (median) soil specific yield values with which ET values were estimated were significantly higher at PW (0.284) than at PD (0.229, Wilcoxon rank-sum test with continuity correction, W = 1074, p-value = 0.008). Furthermore, the average (median) fluctuation (calculated as the difference between H1 and H2) for these days was significantly higher at PD (10 mm) compared to PW (8.4 mm, Wilcoxon rank-sum test with continuity correction, W = 1850, p-value = 0.044).
Discussion
According to our regression analysis, precipitation and VPD affect the water table (significantly) at different magnitudes, depending on the drainage status of the fen, while the direction of the relationship between the meteorological variables and water levels were according to expectations. This was the case even though the local meteorological conditions at both the drained (PD) and rewetted fens (PW) were comparable.
The magnitude of water table response to precipitation at PD is much higher than at PW. The negative effect of daily mean air VPD on the water level can be explained by evapotranspiration as VPD is indicative of the ability of the atmosphere to hold additional water that is evaporated or transpired (evapotranspirative demand, Zipper et al., 2017). Similar to the effect of rainfall, the effect of VPD on the water level was much higher at PD than at PW. However, evapotranspiration for the same dry days was substantially higher at PW than at PD, likely because of differences in vegetation composition and plant biomass (Jiménez-Rodríguez et al., 2019). The vegetation at PD is much shorter (around 20 cm in height) and mostly comprises grasses, while the vegetation at PW is dominated by taller sedges (Carex acutiformis), around 1 m in height (see Schwieger et al., 2020). Schwieger et al. (2020) quantified plant production in both these sites and report a much higher plant biomass production at PW (aboveground: 346 g m–2 y–1; belowground: 199 g m–2 y–1) than at PD (aboveground: 80 g m–2 y–1; belowground: 43 g m–2 y–1). Other than differences in vegetation as a cause for differences in ET, the depth to water table can also provide additional explanation. During the study period, PD had a mean daily water level of around −30 cm while for PW the mean daily water level is nearly 0 cm (at the surface). Several studies show that high ET rates generally occur in sites with shallow water tables, and lower ET rates in sites with deep water tables (Duell, 1988; Nichols, 1994; Cooper et al., 2006; Zhang and Schilling, 2006). Thus, even though PD has lower ET rates than PW, the site demonstrates more water level sensitivity to meteorological forcing.
We attribute the differential influence of meteorological conditions on water table dynamics to different soil-specific yield values (i.e., water storage capacity) largely driven by lower water table position at the drained site. Specific yield relates the change in water storage in a soil to the change in water level (LaRose et al., 1997). Drainage of natural peatlands result in a decline in water level, and thus in absence of water saturated conditions peat accumulation ceases and peat degradation starts. Both, peat degradation as well as shrinkage from lower water table position, causes peat specific yield to decrease. In a recent study by Ahmad et al. (2020c), the rate of water table rise as a response to discrete rainfall events was investigated at the same sites. They found that the water table response at PD was much higher than at PW and attributed the higher response rate to a lower storage capacity of the degraded peat (in the upper horizons) as indicated by a higher bulk density (compared to PW). Mustamo et al. (2016) who studied peat soils under different land-use options, found drained peat to have low specific yields, causing water tables to increase substantially and rapidly after precipitation events. Similarly, Menberu et al. (2018) found that boreal peatlands had significantly higher water table (WT) rise per rainfall input under drained conditions, due to lower soil specific yield values compared to restored and undisturbed conditions.
The soil specific yield (averaged over the days for which ET was calculated) of peat at PD was significantly lower than that of PW, while the diurnal fluctuation at PD was significantly higher than at PW (although the ET derived at PD was significantly lower than at PW). This means that one unit change in the water-level at PD corresponds to a much lower volume of water than what the same unit drop or rise corresponds to at PW. Therefore, the higher impact of VPD and rainfall on the water table at PD could, in part, be due to the lower water storage capacity of the degraded fen peat (Ahmad et al., 2020c) driven mainly by the difference in water table position. PW, being a rewetted site has a water table near or above the peat surface for most of the study period. According to our analysis, soil specific yield, for PD are lower than for PW at depths below −250 mm, which is not experienced by the water levels at PW. However, according to our calculation of specific yield, the 11 cm peat accumulation over the last 20 years, was not sufficient to increase specific yield for the same depths. Nevertheless, Ahmad et al. (2020c), as mentioned earlier, using a bulk density based pedotransfer function found that the rewetted site has a higher specific yield compared to the drained site.
When the water level is above the soil surface, in the absence of peat as a matrix, the surface specific yield could be assumed to be one (Dettmann and Bechtold, 2016b) and thus showing a lower response to precipitation and VPD. According to Cooper et al. (2019) once water table is near the soil surface, water table response becomes limited. Thus, this difference in water table position between the drained and the rewetted fens, is a major control over how the sites differ in their response to meteorological forcing.
While we were able to evaluate the relationship between meteorological conditions and water table dynamics, several limitations need to be considered. As we had only two monitoring wells at only two sites, care must be taken in generalizing conclusions, particularly for fens with different drainage histories or with a different hydrological regime and/or vegetation. Although the study could have benefitted from a higher number of monitoring wells to capture spatial variability and microtopography, water levels measured in an observation well are representative of an area of at least several tens of square meters (Maréchal et al., 2006). For a better understanding of the effect of rewetting or management regimes, a “before-after-control” approach could be more appropriate (see Menberu et al., 2016). However, such long-term monitoring of hydrometeorological parameters is especially rare for temperate fen peatlands (Bechtold et al., 2014; Ahmad et al., 2020c). We focused on belowground or soil specific yield in an attempt to find out differences in soil properties between the sites with depth. In terms of limitations, this means that we did not include aboveground/surface specific yield; our focus was not the entire landscape or ecosystem, but the locations where water table and meteorological parameters were measured.
Our results underline the importance of meteorological effects, namely vapor pressure deficit on water table dynamics in fens, which in turn are influenced by water management decisions and consequent change to water table position. Our findings have implications for prompt and effective rewetting of drained and degraded peatlands. Degraded fen peatlands, because of their low water storage capacity and water table positions, are likely to be more vulnerable to temperature extremes which can cause water tables to rapidly decline by increasing atmospheric water demand (vapor pressure deficit), thereby further amplifying the process of peat degradation and carbon mineralization. Therefore, delays in peatland rewetting are likely to result in additional efforts and resources being required to restore ecosystem functions. The longer we wait with rewetting, the more difficult it will be to achieve water levels continuously fluctuating around the peat surface. For rewetted fens, continuous monitoring is advisable to ensure long-term success especially under a changing climate and associated drought events.
Data Availability Statement
The raw data supporting the conclusions of this article will be made available by the authors, without undue reservation.
Author Contributions
SAh: conceptualization, methodology, formal analysis and coding, writing – original draft, writing – review and editing, visualization, software, and investigation. HL: conceptualization, supervision, methodology, formal analysis, investigation, writing – review and editing, visualization, and project administration. SAl: formal analysis and coding, writing, review, and editing. AG: data curation, writing – review and editing, and investigation. GJ: formal analysis and coding, funding acquisition, and writing – review and editing. BL: conceptualization, supervision, writing – review and editing, funding acquisition, and project administration. All authors contributed to the article and approved the submitted version.
Funding
This work was supported by European Social Fund (ESF) and the Ministry of Education, Science and Culture of Mecklenburg-Western Pomerania funded this work within the project WETSCAPES (ESF/14-BM-A55-0028/16, ESF/14-BM-A55-0030/16, and ESF/14-BM-A55-0035/16). Intellectual support was also received from the Research Training Group “Baltic TRANSCOAST” funded by the Deutsche Forschungsgemeinschaft (DFG, German Research Foundation) under Grant Number DFG-GRK 2000.
Conflict of Interest
The authors declare that the research was conducted in the absence of any commercial or financial relationships that could be construed as a potential conflict of interest.
Acknowledgments
We would like to thank Daniel Köhn, Christian Schmidt, and Laurenz Teuber for hydrological and meteorological data transfer/collection. We would also like to express our gratitude to Sarah Schwieger, for providing insights into the vegetation characteristics of the two sites. Finally, we would like to thank the editor and the reviewers.
Supplementary Material
The Supplementary Material for this article can be found online at: https://www.frontiersin.org/articles/10.3389/feart.2021.630469/full#supplementary-material
References
Ahmad, S., Hörmann, G., Zantout, N., and Schrautzer, J. (2020a). Quantifying actual evapotranspiration in fen ecosystems: implications of management and vegetation structure: implications of management and vegetation structure. Ecohydrol. Hydrobiol. 20, 381–395. doi: 10.1016/j.ecohyd.2020.04.001
Ahmad, S., Liu, H., Beyer, F., Kløve, B., and Lennartz, B. (2020b). Spatial heterogeneity of soil properties in relation to microtopography in a non-tidal rewetted coastal mire. Mires Peat 26, 1–18. doi: 10.19189/MaP.2019.GDC.StA.1779
Ahmad, S., Liu, H., Günther, A., Couwenberg, J., and Lennartz, B. (2020c). Long-term rewetting of degraded peatlands restores hydrological buffer function. Sci. Total Environ. 749:141571. doi: 10.1016/j.scitotenv.2020.141571
Allen, R. G., Pereira, L. S., Raes, D., and Smith, M. (1998). Crop Evapotranspiration-Guidelines for Computing Crop Water Requirements-Fao Irrigation and Drainage Paper 56. FAO: Rome.
Baldocchi, D. D., Xu, L., and Kiang, N. (2004). How plant functional-type, weather, seasonal drought, and soil physical properties alter water and energy fluxes of an oak–grass savanna and an annual grassland. Agric. For. Meteorol. 123, 13–39. doi: 10.1016/j.agrformet.2003.11.006
Bechtold, M., Tiemeyer, B., Laggner, A., Leppelt, T., Frahm, E., and Belting, S. (2014). Large-scale regionalization of water table depth in peatlands optimized for greenhouse gas emission upscaling. Hydrol. Earth Syst. Sci. 18, 3319–3339. doi: 10.5194/hess-18-3319-2014
Bourgault, M. A., Larocque, M., and Garneau, M. (2017). Quantification of peatland water storage capacity using the water table fluctuation method. Hydrol. Process. 31, 1184–1195. doi: 10.1002/hyp.11116
Bourgault, M. A., Larocque, M., and Garneau, M. (2019). How do hydrogeological setting and meteorological conditions influence water table depth and fluctuations in ombrotrophic peatlands? J. Hydrol. 4:100032. doi: 10.1016/j.hydroa.2019.100032
Branham, J. E., and Strack, M. (2014). Saturated hydraulic conductivity in Sphagnum-dominated peatlands: do microforms matter? Hydrol. Process. 28, 4352–4362. doi: 10.1002/hyp.10228
Bridgham, S. D., Pastor, J., Updegraff, K., Malterer, T. J., Johnson, K., Harth, C., et al. (1999). Ecosystem control over temperature and energy flux in northern peatlands. Ecol. Appl. 9, 1345–1358. doi: 10.1890/1051-0761(1999)009[1345:ecotae]2.0.co;2
Childs, E. C. (1969). An introduction to the Physical Basis of Soil Water Phenomena. Hoboken, NJ: John Wiley & Sons, Incorporated.
Cooper, D. J., Sanderson, J. S., Stannard, D. I., and Groeneveld, D. P. (2006). Effects of long-term water table drawdown on evapotranspiration and vegetation in an arid region phreatophyte community. J. Hydrol. 325, 21–34. doi: 10.1016/j.jhydrol.2005.09.035
Cooper, D. J., Sueltenfuss, J., Oyague, E., Yager, K., Slayback, D., Caballero, E. M. C., et al. (2019). Drivers of peatland water table dynamics in the central andes, bolivia and peru. Hydrol. Process. 33, 1913–1925.
Dettmann, U., and Bechtold, M. (2016a). Deriving effective soil water retention characteristicsfrom shallow water table fluctuations in peatlands. Vadose Zone J. 15, 1–13.
Dettmann, U., and Bechtold, M. (2016b). One-dimensional expression to calculate specific yield for shallow groundwater systems with microrelief. Hydrol. Process. 30, 334–340. doi: 10.1002/hyp.10637
Dolan, T. J., Hermann, A. J., Bayley, S. E., and Zoltek, J. Jr. (1984). Evapotranspiration of a Florida, USA, freshwater wetland. J. Hydrol. 74, 355–371. doi: 10.1016/0022-1694(84)90024-6
Duell, L. F. W. (1988). Estimates of Evapotranspiration in Alkaline Scrub and Meadow Communities of Owens Valley, California, using the Bowen-ratio, Eddy-Correlation, and Penman-Combination Methods, Vol. 88. Reston, VA: US Geological Survey.
Dunne, T., Zhang, W., and Aubry, B. F. (1991). Effects of rainfall, vegetation, and microtopography on infiltration and runoff. Water Resour. Res. 27, 2271–2285. doi: 10.1029/91wr01585
Ferone, J. M., and Devito, K. J. (2004). Shallow groundwater–surface water interactions in pond–peatland complexes along a Boreal Plains topographic gradient. J. Hydrol. 292, 75–95. doi: 10.1016/j.jhydrol.2003.12.032
Grossiord, C., Buckley, T. N., Cernusak, L. A., Novick, K. A., Poulter, B., Siegwolf, R. T. W., et al. (2020). Plant responses to rising vapor pressure deficit. New Phytol. 226, 1550–1566. doi: 10.1111/nph.16485
Günther, A., Barthelmes, A., Huth, V., Joosten, H., Jurasinski, G., Koebsch, F., et al. (2020). Prompt rewetting of drained peatlands reduces climate warming despite methane emissions. Nat. Commun. 11:1644. doi: 10.1038/s41467-020-15499-z
Hays, K. B. (2003). Water use by Salt Cedar Saltcedar (Tamarix sp.) and Associated Vegetation on the Canadian, Colorado, and Pecos Rivers in Texas. Master’s Thesis, Texas A&M University, College Station, TX.
Helbig, M., Waddington, J. M., Alekseychik, P., Amiro, B. D., Aurela, M., Barr, A. G., et al. (2020). Increasing contribution of peatlands to boreal evapotranspiration in a warming climate. Nat. Clim. Change 10, 555–560. doi: 10.1038/s41558-020-0763-7
Hooijer, A., Page, S., Jauhiainen, J., Lee, W. A., Lu, X. X., Idris, A., et al. (2012). Subsidence and carbon loss in drained tropical peatlands. Biogeosciences 9, 1053–1071. doi: 10.5194/bg-9-1053-2012
Hylleberg, S., Jørgensen, C., and Sørensen, N. K. (1993). Seasonality in macroeconomic time series. Empir. Econ. 18, 321–335. doi: 10.1007/bf01205406
Hyndman, R. J., Athanasopoulos, G., Bergmeir, C., Caceres, G., Chhay, L., O’Hara-Wild, M., et al. (2020). Package ‘Forecast’. Available online at: https://cran.r-project.org/web/packages/forecast/forecast.pdf (accessed August 25, 2020).
Jiménez-Rodríguez, C. D., Esquivel-Vargas, C., Coenders-Gerrits, M., and Sasa-Marín, M. (2019). Quantification of the evaporation rates from six types of wetland cover in Palo Verde National Park, Costa Rica. Water 11:674. doi: 10.3390/w11040674
Joosten, H., and Couwenberg, J. (2001). “Bilanzen zum moorverlust: das beispiel europa [balance sheet for loss of mires: the example of europe],” in Landschaftsökologische Moorkunde [Landscape Ecology of Mires], 2nd Edn, Vol. 2, eds M. Succow and H. Joosten (Stuttgart: Schweizerbart Science Publishers), 406–409.
Joosten, H., Tanneberger, F., and Moen A. (Eds.) (2017). Mires and Peatlands of Europe. Stuttgart: Schweizerbart’sche Verlagsbuchhandlung.
Jurasinski, G., Ahmad, S., Anadon-Rosell, A., Berendt, J., Beyer, F., Bill, R., et al. (2020). From understanding to sustainable use of peatlands:: the wetscapes approach. Soil Syst. 4:14. doi: 10.3390/soilsystems4010014
Kimmel, K., and Mander, Ü (2010). Ecosystem services of peatlands: Implications for restoration. Progress Phys. Geogr. 34, 491–514. doi: 10.1177/0309133310365595
Koch, M., and Jurasinski, G. (2015). Four decades of vegetation development in a percolation mire complex following intensive drainage and abandonment. Plant Ecol. Divers. 8, 49–60. doi: 10.1080/17550874.2013.862752
Lamers, L. P. M., Vile, M. A., Grootjans, A. P., Acreman, M. C., van Diggelen, R., Evans, M. G., et al. (2015). Ecological restoration of rich fens in Europe and North America: from trial and error to an evidence-based approach. Biol. Rev. Camb. Philos. Soc. 90, 182–203. doi: 10.1111/brv.12102
LaRose, S., Price, J., and Rochefort, L. (1997). Rewetting of a cutover peatland: hydrologic assessment. Wetlands 17, 416–423. doi: 10.1007/BF03161431
Lautz, L. K. (2008). Estimating groundwater evapotranspiration rates using diurnal water-table fluctuations in a semi-arid riparian zone. Hydrogeol. J. 16, 483–497. doi: 10.1007/s10040-007-0239-0
Lennartz, B., and Liu, H. (2019). Hydraulic functions of peat soils and ecosystem service. Front. Environ. Sci. 7:92. doi: 10.3389/fenvs.2019.00092
Levison, J., Larocque, M., Fournier, V., Gagné, S., Pellerin, S., and Ouellet, M. A. (2014). Dynamics of a headwater system and peatland under current conditions and with climate change. Hydrol. Process. 28, 4808–4822. doi: 10.1002/hyp.9978
Liu, H., Janssen, M., and Lennartz, B. (2016). Changes in flow and transport patterns in fen peat following soil degradation. Eur. J. Soil Sci. 67, 763–772. doi: 10.1111/ejss.12380
Liu, H., and Lennartz, B. (2019). Hydraulic properties of peat soils along a bulk density gradient—a meta study. Hydrol. Process. 33, 101–114. doi: 10.1002/hyp.13314
Liu, H., Price, J., Rezanezhad, F., and Lennartz, B. (2020a). Centennial-scale shifts in hydrophysical properties of peat induced by drainage. Water Resour. Res. 56:141. doi: 10.1029/2020WR027538
Liu, H., Wrage-Mönnig, N., and Lennartz, B. (2020b). Rewetting strategies to reduce nitrous oxide emissions from European peatlands. Commun. Earth Environ. 1, 1–7. doi: 10.1038/s43247-020-00017-2
Liu, H., Zak, D., Rezanezhad, F., and Lennartz, B. (2019). Soil degradation determines release of nitrous oxide and dissolved organic carbon from peatlands. Environ. Res. Lett. 14:094009. doi: 10.1088/1748-9326/ab3947
Maki, J. E., Hoffman, D. M., and Berk, R. A. (1978). A time series analysis of the impact of a water conservation campaign. Eval. Q. 2, 107–118. doi: 10.1177/0193841x8000400106
Malhotra, A., Roulet, N. T., Wilson, P., Giroux-Bougard, X., and Harris, L. I (2016). Ecohydrological feedbacks in peatlands: an empirical test of the relationship among vegetation, microtopography and water table. Ecohydrology 9, 1346–1357. doi: 10.1002/eco.1731
Maréchal, J. C., Dewandel, B., Ahmed, S., Galeazzi, L., and Zaidi, F. K. (2006). Combined estimation of specific yield and natural recharge in a semi-arid groundwater basin with irrigated agriculture. J. Hydrol. 329, 281–293. doi: 10.1016/j.jhydrol.2006.02.022
Mazur, M. L. C., Wiley, M. J., and Wilcox, D. A. (2014). Estimating evapotranspiration and groundwater flow from water-table fluctuations for a general wetland scenario. Ecohydrology 7, 378–390. doi: 10.1002/eco.1356
Menberu, M. W., Haghighi, A. T., Ronkanen, A. K., Marttila, H., and Kløve, B. (2018). Effects of drainage and subsequent restoration on peatland hydrological processes at catchment scale. Water Resour. Res. 54, 4479–4497. doi: 10.1029/2017wr022362
Menberu, M. W., Tahvanainen, T., Marttila, H., Irannezhad, M., Ronkanen, A. K., Penttinen, J., et al. (2016). Water-table-dependent hydrological changes following peatland forestry drainage and restoration: analysis of restoration success. Water Resour. Res. 52, 3742–3760. doi: 10.1002/2015WR018578
Michaelis, D., Mrotzek, A., and Couwenberg, J. (2020). Roots, tissues, cells and fragments—how to characterize peat from drained and rewetted fens. Soil Syst. 4:12. doi: 10.3390/soilsystems4010012
Mould, D. J., Frahm, E., Salzmann, T., Miegel, K., and Acreman, M. C. (2010). Evaluating the use of diurnal groundwater fluctuations for estimating evapotranspiration in wetland environments: case studies in southeast England and northeast Germany. Ecohydrology 3, 294–305. doi: 10.1002/eco.108
Mrotzek, A., Michaelis, D., Günther, A., Wrage-Mönnig, N., and Couwenberg, J. (2020). Mass balances of a drained and a rewetted peatland: on former losses and recent gains. Soil Syst. 4:16. doi: 10.3390/soilsystems4010016
Mustamo, P., Hyvarinen, M., Ronkanen, A.-K., and Klove, B. (2016). Physical properties of peat soils under different land use options. Soil Use Manag. 32, 400–410. doi: 10.1111/sum.12272
Nichols, W. D. (1994). Groundwater discharge by phreatophyte shrubs in the Great Basin as related to depth to groundwater. Water Resour. Res. 30, 3265–3274. doi: 10.1029/94wr02274
Nijp, J. J., Limpens, J., Metselaar, K., Peichl, M., Nilsson, M. B., van der Zee, S. E. A. T. M., et al. (2015). Rain events decrease boreal peatland net CO2 uptake through reduced light availability. Glob. Chang. Biol. 21, 2309–2320. doi: 10.1111/gcb.12864
Philippov, D. A., and Yurchenko, V. V. (2019). Data on air temperature, relative humidity and dew point in a boreal Sphagnum bog and an upland site (Shichengskoe mire system, North-Western Russia). Data Brief 25:104156. doi: 10.1016/j.dib.2019.104156
Price, J. S. (1996). Hydrology and microclimate of a partly restored cutover bog, Quebec. Hydrol. Process. 10, 1263–1272. doi: 10.1002/(sici)1099-1085(199610)10:10<1263::aid-hyp458>3.0.co;2-1
Pronger, J., Schipper, L. A., Hill, R. B., Campbell, D. I., and McLeod, M. (2014). Subsidence rates of drained agricultural peatlands in new zealand and the relationship with time since drainage. J. Environ. Qual. 43, 1442–1449. doi: 10.2134/jeq2013.12.0505
R Core Team (2019). R: A Language and Environment for Statistical Computing [Computer software]. Vienna: R Core Team.
Rezanezhad, F., Price, J. S., Quinton, W. L., Lennartz, B., Milojevic, T., and Van Cappellen, P. (2016). Structure of peat soils and implications for water storage, flow and solute transport: a review update for geochemists. Chem. Geol. 429, 75–84. doi: 10.1016/j.chemgeo.2016.03.010
Ruseckas, J., and Grigaliūnas, V. (2008). Effect of drain-blocking and meteorological factors on ground water table fluctuations in kamanos mire. J. Environ. Eng. Landsc. Manag. 16, 168–177. doi: 10.3846/1648-6897.2008.16.168-177
Schrautzer, J., Rinker, A., Jensen, K., Mûller, F., Schwartze, P., and Dierßen, K. (2007). “Succession and restoration of drained fens: perspectives from northwestern Europe,” in Springer Series on Environmental Management. Linking Restoration and Ecological Succession, eds L. R. Walker, J. Walker, and R. J. Hobbs (cham: Springer), 90–120. doi: 10.1007/978-0-387-35303-6_5
Schrautzer, J., Sival, F., Breuer, M., Runhaar, H., and Fichtner, A. (2013). Characterizing and evaluating successional pathways of fen degradation and restoration. Ecol. Indic. 25, 108–120. doi: 10.1016/j.ecolind.2012.08.018
Schwieger, S., Kreyling, J., Couwenberg, J., Smiljaniæ, M., Weigel, R., Wilmking, M., et al. (2020). Wetter is better: rewetting of minerotrophic peatlands increases plant production and moves them towards carbon sinks in a dry year. Ecosystems 1–17. doi: 10.1007/s10021-020-00570-z
Strack, M., Waddington, J. M., Bourbonniere, R. A., Buckton, E. L., Shaw, K., Whittington, P., et al. (2008). Effect of water table drawdown on peatland dissolved organic carbon export and dynamics. Hydrol. Process. 22, 3373–3385. doi: 10.1002/hyp.6931
Succow, M., and Joosten, H. (Eds.) (2001). Landschaftsökologische Moorkunde [Landscape Ecology of Mires], 2nd Edn. Stuttgart: Schweizerbart Science Publishers.
Tarnocai, C. (2009). The impact of climate change on Canadian peatlands. Can. Water Resour. J. 34, 453–466. doi: 10.4296/cwrj3404453
Tiemeyer, B., Borraz, E. A., Augustin, J., Bechtold, M., Beetz, S., Beyer, C., et al. (2016). High emissions of greenhouse gases from grasslands on peat and other organic soils. Glob. Chang. Biol. 22, 4134–4149. doi: 10.1111/gcb.13303
Tiemeyer, B., Lennartz, B., and Vegelin, K. (2006). Hydrological modelling of a re-wetted peatland on the basis of a limited dataset for water management. J. Hydrol. 325, 376–389. doi: 10.1016/j.jhydrol.2005.10.039
White, W. N. (1932). A Method of Estimating Ground-Water Supplies Based on Discharge by Plants and Evaporation From Soil: Results of Investigations in Escalante Valley, Utah. (Water Supply Paper 659A). Washington, D.C: U.S. Government Printing Office.
Whittington, P. N., and Price, J. S. (2006). The effects of water table draw-down (as a surrogate for climate change) on the hydrology of a fen peatland, Canada. Hydrol. Process. 20, 3589–3600. doi: 10.1002/hyp.6376
Yuan, W., Zheng, Y., Piao, S., Ciais, P., Lombardozzi, D., Wang, Y., et al. (2019). Increased atmospheric vapor pressure deficit reduces global vegetation growth. Sci. Adv. 5:eaax1396. doi: 10.1126/sciadv.aax1396
Zhang, Y.-K., and Schilling, K. E. (2006). Effects of land cover on water table, soil moisture, evapotranspiration, and groundwater recharge: a field observation and analysis. J. Hydrol. 319, 328–338. doi: 10.1016/j.jhydrol.2005.06.044
Keywords: peatland hydrology, peatland restoration, evapotranspiration, diurnal groundwater fluctuation, vapor pressure deficit, climate change
Citation: Ahmad S, Liu H, Alam S, Günther A, Jurasinski G and Lennartz B (2021) Meteorological Controls on Water Table Dynamics in Fen Peatlands Depend on Management Regimes. Front. Earth Sci. 9:630469. doi: 10.3389/feart.2021.630469
Received: 17 November 2020; Accepted: 02 March 2021;
Published: 30 March 2021.
Edited by:
Michel Bechtold, KU Leuven, BelgiumReviewed by:
Marc-André Bourgault, Laval University, CanadaDaniel Limehouse McLaughlin, Virginia Tech, United States
Copyright © 2021 Ahmad, Liu, Alam, Günther, Jurasinski and Lennartz. This is an open-access article distributed under the terms of the Creative Commons Attribution License (CC BY). The use, distribution or reproduction in other forums is permitted, provided the original author(s) and the copyright owner(s) are credited and that the original publication in this journal is cited, in accordance with accepted academic practice. No use, distribution or reproduction is permitted which does not comply with these terms.
*Correspondence: Sate Ahmad, c2F0ZS5haG1hZEB1bmktcm9zdG9jay5kZQ==