 Maria G. Ciaccio
 Raffaele Di Stefano
 Luigi Improta
95% of researchers rate our articles as excellent or good
Learn more about the work of our research integrity team to safeguard the quality of each article we publish.
Find out more
ORIGINAL RESEARCH article
Front. Earth Sci. , 25 May 2021
Sec. Solid Earth Geophysics
Volume 9 - 2021 | https://doi.org/10.3389/feart.2021.630116
This article is part of the Research Topic Source and Effects of Light to Moderate Magnitude Earthquakes View all 13 articles
A list of 100 focal mechanism solutions that occurred in Italy between 2015 and 2019 has been compiled for earthquakes with magnitude M ≥ 4.0. We define earthquake parameters for additional 22 seismic events with 3.0 ≤ M < 4.0 for two specific key zones: Muccia, at the northern termination of the Amatrice–Visso–Norcia 2016–2018 central Italy seismic sequence, and Montecilfone (southern Italy) struck in 2018 by a deep, strike-slip Mw 5.1 earthquake apparently anomalous for the southern Apennines extensional belt. First-motion focal mechanism solutions are a good proxy for the initial rupture and they provide important additional information on the source mechanism. The catalog compiled in the present paper provides earthquake parameters for individual events of interest to contribute, as a valuable source of information, for further studies as seismotectonic investigations and stress distribution maps. We calculated the focal mechanisms using as a reference the phase pickings reported in the Italian Seismic Bulletin (BSI). We visually checked the reference picks to accurately revise manual first-motion polarities, or include new onsets when they are not present in the BSI dataset, for the selected earthquakes within the whole Italian region, with a separate focus on the Amatrice–Visso–Norcia seismic sequence area from August 24, 2016 to August 24, 2018. For the Montecilfone area, we combined the information on the geometry and kinematics of the source of the 2018 Mw 5.1 event obtained in this study with available subsurface and structural data on the Outer Apulia Carbonate Platform to improve understanding of this intriguing strike-slip sequence. Our analysis suggests that the Montecilfone earthquake ruptured a W–E trending strike-slip dextral fault. This structure is confined within the Apulia crystalline crust and it might represent the western prolongation of the Mattinata Fault–Apricena Fault active and seismogenic structures. The calculated focal mechanisms of the entire catalog are of good quality complementing important details on source mechanics from moment tensors and confirming the relevance of systematically including manually revised and more accurate polarity data within the BSI database.
The Italian region is characterized by a high rate of tectonic origin seismicity mainly distributed along the Alpine and Apennines mountain belts, and the Calabrian Subduction zone. Relevant and long-lasting seismic sequences with mainshocks Mw ≥ 5.0 struck the region giving important insights in the active deformation regime and therefore information for seismic risk reduction.
The BSI (Italian Seismological Bulletin1) analyst seismologists of INGV off-line revise both hypocenter locations and local magnitudes of earthquakes that are detected by the automatic acquisition system and then are quickly real-time analyzed by the monitoring room of INGV for civil protection duties. Revised P- and S-quality weighted onsets, hypocenter locations, amplitudes, and local magnitudes are then periodically released in the BSI publication and through the INGV FDSN web services generally for ML ≥ 1.5 events (INGV Seismological and Data Centre, 2006; ISIDe Working Group, 2007). Nevertheless, manually revised first-motion polarities are not yet systematically revised in the BSI dataset for further focal mechanism studies.
First-motion focal mechanism solutions are anyway an important approach, also in addition to the moment tensor estimation when available, being a good indicator of the initial rupture stages of faulting especially in very complex ruptures as seismic faults are not always planar. The first-motion data describe in fact the early part of the source which may or may not be representative of the whole source process for an earthquake; in contrast, the moment tensor solution might represent an average source process (Anderson, 1988) depending on the frequency content, the used signal length, and the applied filtering. Moreover, although for moderate to large events (M > 4.5) the inversion of broadband seismic waveforms well describes earthquake source properties of the main faulting process, this method might produce less stable/more noisy solutions when applied to M < 3.5: AUTO-TDMT procedure (automatic seismic time-domain moment tensor) implemented at INGV is triggered by local and regional events with magnitude ML ≥ 3.5 detected and located by the INGV monitoring center (Scognamiglio et al., 2009). Indeed, the moment tensor solution provides a good indication of the general style of deformation occurring in an area, but careful consideration of the first-motion solution is very useful for a detailed study of source mechanics, also taking advantage of the information from lower magnitudes.
We relocated all the selected earthquakes by using a multi-parameter procedure and we calculated focal mechanisms of 100 earthquakes with M ≥ 4.0 occurred in the Italian region during the period 2015–20192 by using the FPFIT code (Reasenberg and Oppenheimer, 1985). Among them, 51 seismic events occurred inside the region interested by the Amatrice–Visso–Norcia (AVN) sequence, 4 in the Montecilfone area, and 2 in the Muccia area. The AVN in this paper has a time span ranging from August 2016 to August 2018 to better define the evolution of the important seismic sequence including the strongest earthquake occurred since 1980 in Italy. No earthquakes with M ≥ 4.0 were detected in the selected period in the Alpine mountain belt or the Po Plain (Figure 1).
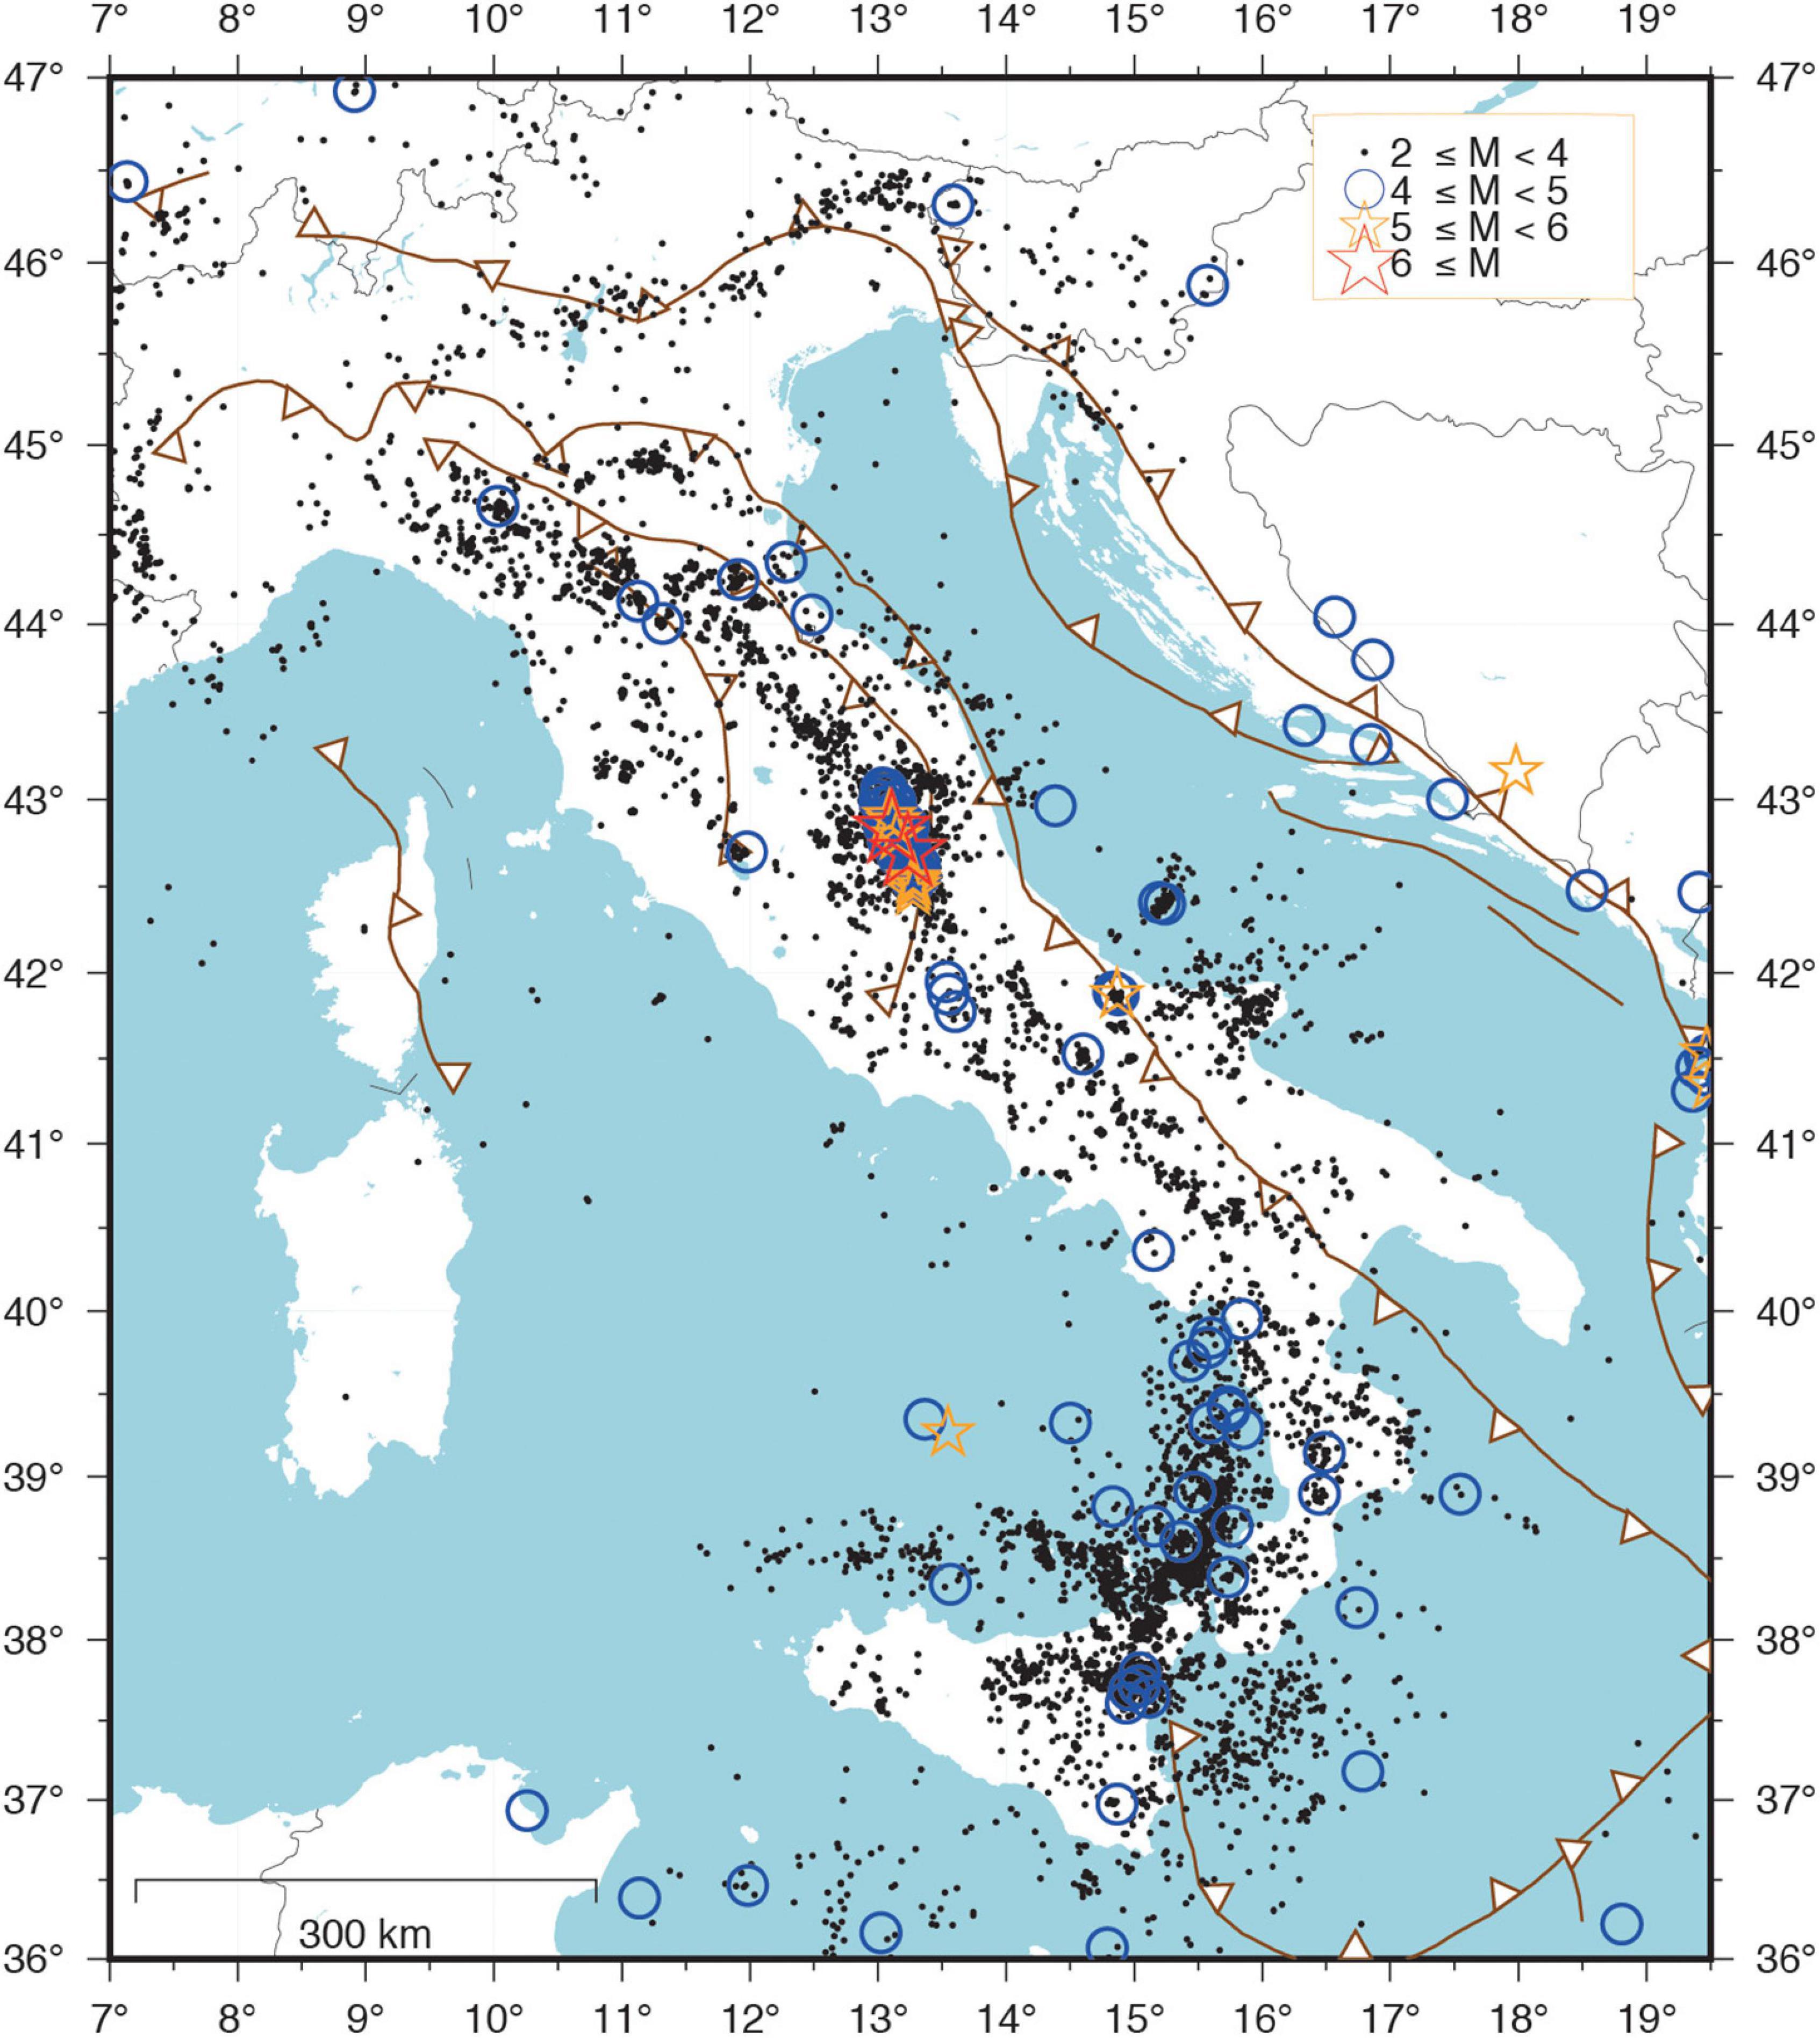
Figure 1. Earthquakes, M ≥ 4.0 (blue circles), M ≥ 5.0 (orange stars), and M ≥ 6.0 (red stars), that occurred in the Italian region in the period 2015–2019. Small black dots are M ≥ 2.0 earthquakes. The main tectonic fronts of the region are reported in brown lines.
The BSI locations are obtained from a simple velocity model composed of two layers on a half-space (Battelli et al., 2013); for this reason, we relocated all the selected earthquakes by using a multi-parameter procedure. To locate seismic events, we choose the linearized approach by Lahr, 1999 (the Hypoellipse code) using a best 1D velocity model for the area (Figure 2, modified from Chiarabba et al., 2005b), but exploring the hypocenter solutions space by changing three key a priori conditions that typically strongly influence the solution convergence in the linearized approach: the starting trial depth, the weight function of arrival times with distance, and the travel time residual cut.
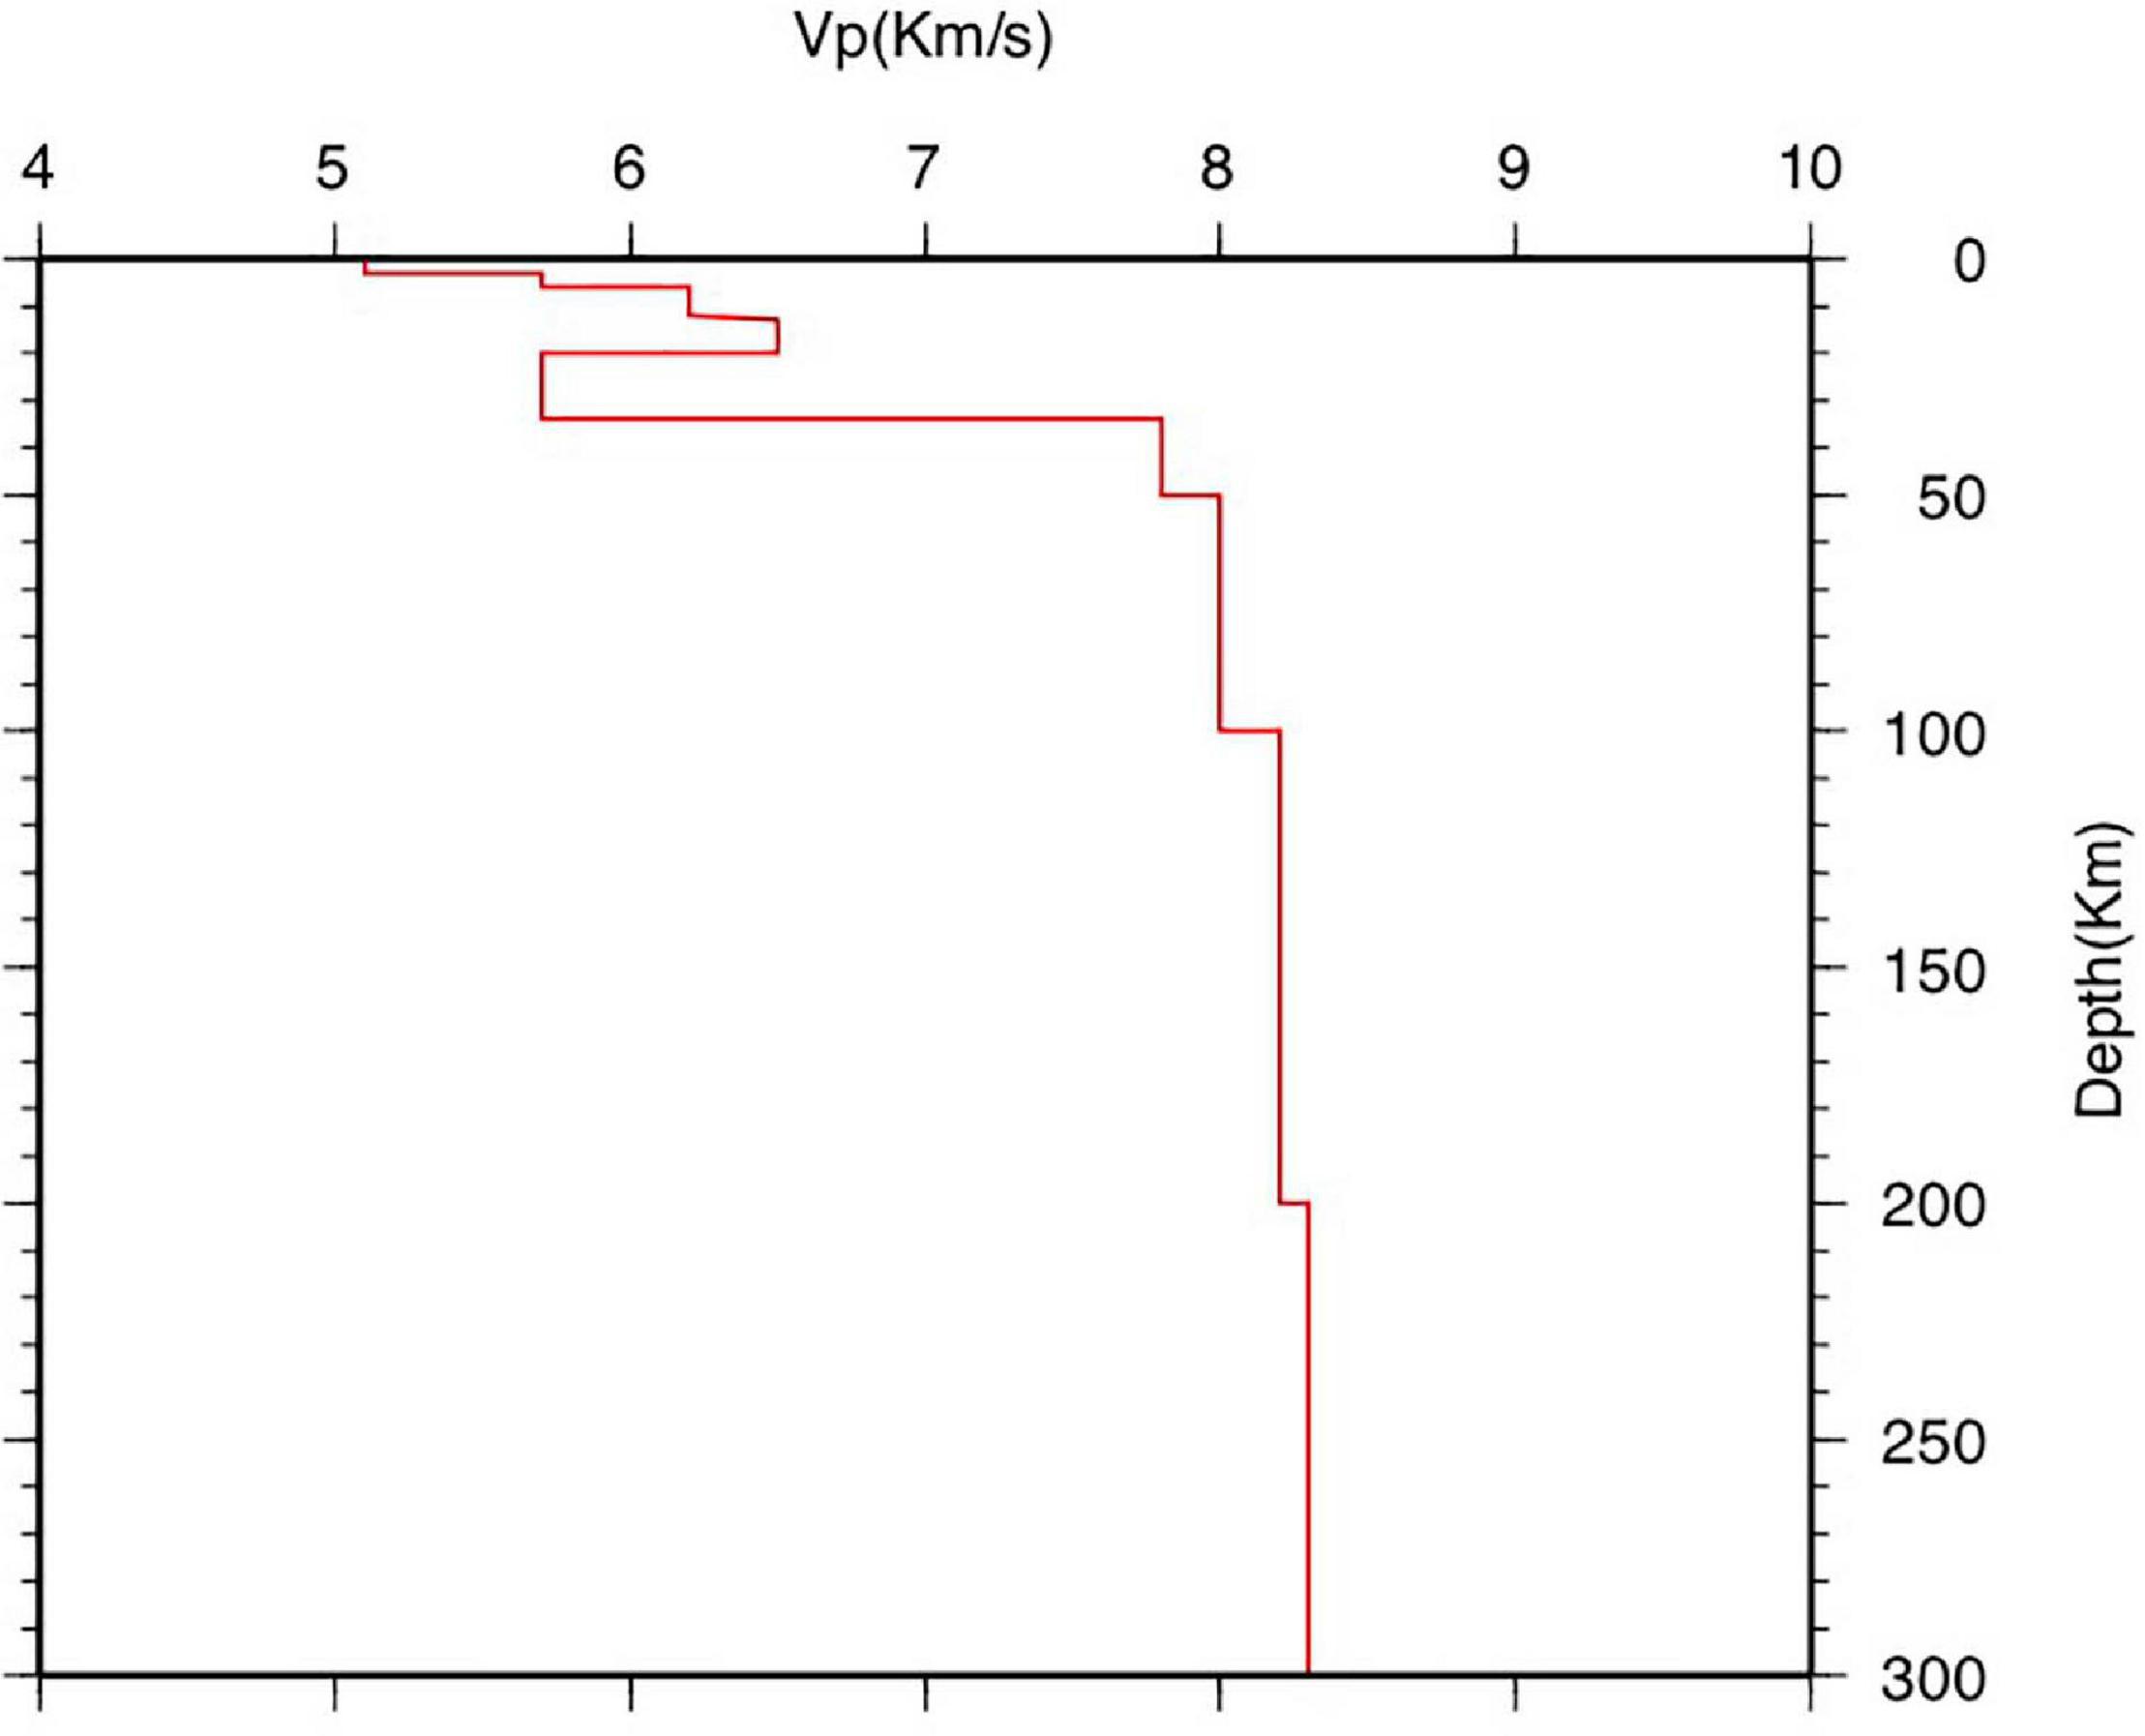
Figure 2. The 1D P-wave velocity model used in the routine location of earthquakes.
The distance weighting function gives full weight (multiplying the assigned weight by 1) to arrival times for stations with distance less than d1 and zero weight (multiplying by 0) to arrival times for stations at epicentral distance higher than d2. Setting A1 (see Table 1) cuts out stations farer than 75 km giving full weight to stations closer than 25 km; settings A2 and A3 progressively extend the full weight distance and the exclusion distance including contribution of progressively farer stations that might be determinant for larger events or in case of no or few close stations.
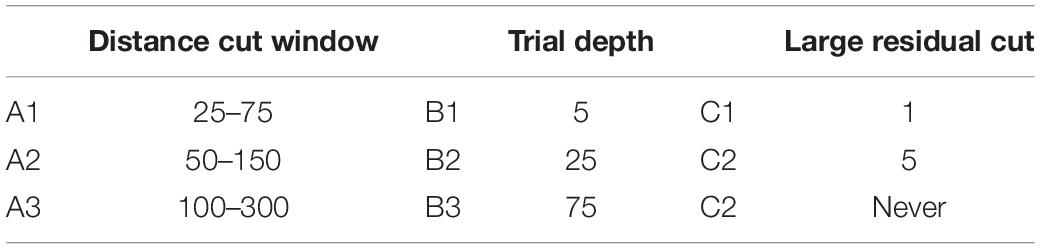
Table 1. Settings used in the multi-parameter procedure.
The trial depth in the linearized problem might equally be a solution or a trap guiding the hypocenter to the absolute or a local minimum for the more unstable of the hypocenter coordinates: the focal depth. For this reason, we introduced three different trial depths at upper crustal (B1, 5 km), lower crustal (B2, 25 km), and upper mantle (B3, 75 km) depth allowing the procedure to eventually get out of local minimums and/or being trapped by 1D model velocity jumps.
Finally, the large residuals cut can have a big influence on the final location erasing the contribution of worse fitted arrival times. Bad fitting arrival times is not necessarily a symptom of large error in pickings and can be conversely related to the neglected effect of 3D heterogeneities on the travel-time computation approximations in the velocity model. For this reason, the choice of cutting them out might be correct or not and the amount of residual considered unacceptable is also a key point. A too small threshold value, especially in absence of proper stations corrections might bring to overfitting the 1D velocity model at the cost of getting complaisant but wrong locations. Moreover, an important role in the quality of the final location is played by the iteration starting from which the cut is applied. We here set a large threshold to avoid linking too much the location to the 1D model approximation and applied the cut from the 1st iteration (C1), from the 5th (C2) or never (C3).
The combination of these three different settings for each of the three sensible parameters, A, B, and C, produces 27 different configurations exploring in a discrete empirical way the hypocenter solutions space and producing 27 eventually different locations.
Differently from the probabilistic approach, we remain in the linearized domain and use the formal error estimation and the final rms of the array of the focal solutions to select the best location for each earthquake.
The procedure first orders the location vector by growing RMS, selecting the best 13 (half out of the total 27), then these are ordered by growing vertical error and the best 7 are selected and ordered in turn by growing horizontal error and the best 4 are taken out of which the 2 ones with lower azimuthal gaps are taken. Finally, the one with lower RMS out of these two is considered the highest quality location.
The 1D velocity model in Figure 2 is also used to calculate the take-off angle for focal solution determination.
The FPFIT code (Reasenberg and Oppenheimer, 1985) reads in the Hypoellipse output and computes double-couple fault plane solutions from P-wave first motion data using a grid search method. Errors in first-motion observations may occur because of station polarity reversal or incorrect direct P-arrival picks due to low signal-to-noise ratio. For these reasons, to constrain our focal solutions by reducing the number of discrepancies, we proof-checked the dataset for possible reversal polarities and we filtered the polarities based on the weight assigned to the P-onset by the BSI analysts (discrete classed from 0, best, to 3, worse) keeping only polarities for picks with weights 0 and 1 and rejecting those with weight 2 and 3 that can be present in the BSI dataset due to the automatic procedure applied in the monitoring seismic room of the INGV. Furthermore, since the first polarities are not routinely entered for all waveforms by the BSI analysts, we have added, where present, additional good quality polarities. We also required a minimum number of 10 P-polarities per event.
It may occur that, depending on the distribution and quality of first-motion data, more than one focal mechanism solution may fit equally well the impulsive polarities having as a consequence identical values of relative minima in misfit, the indication of inconsistent polarities. The variability in fault parameters observed among the preferred mechanisms could originate from velocity model uncertainties: in fact, the gradient of the velocity structure controls the variations of the take-off angles of the seismic rays, resulting in multiple focal mechanism solutions.
In our analysis, we only include focal mechanisms with unique solutions (Supplementary Table 1). Focal mechanisms with multiple solutions are anyway released in Supplementary Table 2. The final focal mechanism catalog contains 100 quality selected fault plane solutions for earthquakes with magnitude M ≥ 4.0, and additional 22 solutions for seismic events with 3.0 ≤ M < 4.0 for two specific key zones: the Muccia region, at the northern termination of the Amatrice–Visso–Norcia 2016–2018 central Italy seismic sequence, and the Montecilfone (southern Italy) area struck in 2018 by deep, strike-slip Mw > 5.1 earthquakes apparently anomalous for the southern Apennines extensional belt.
Our criteria for selecting earthquakes for the analysis are principally based on the reported magnitude M which we set to M ≥ 4.0. However, we also choose to analyze earthquakes of particular interest or seismotectonic significance with M < 4.0 in case of clear P-wave arrival times and polarities and favorable stations distribution. This analysis shows the importance of lowering the threshold of magnitude to get a better picture of the seismic deformation and give information about the state of stress around a fault in an area, even when earthquakes of high magnitude are absent.
For the 100 obtained fault plane solutions, we list the reference INGV event ID, Date, Magnitude (Supplementary Table 1), the hypocenter calculated with the multiparameter location approach, the estimated fault parameters, and their overall quality in terms of uncertainties on strike, dip, and rake and station distribution ratio (STDR). The latter quantity ranges from 0.0 to 1.0 and it is sensitive to the distribution of the data on the focal sphere, relative to the radiation pattern. Values of STDR lower than 0.5 indicate a less robust solution. In Figure 3, we show some statistics about the distribution of these parameters and the quality of the mechanisms obtained. The STDR is higher than 0.5, ranging from 0.5 to 0.9. For most of the focal solutions, the range in the uncertainty of each parameter (strike, dip, rake) is mostly within 20°.
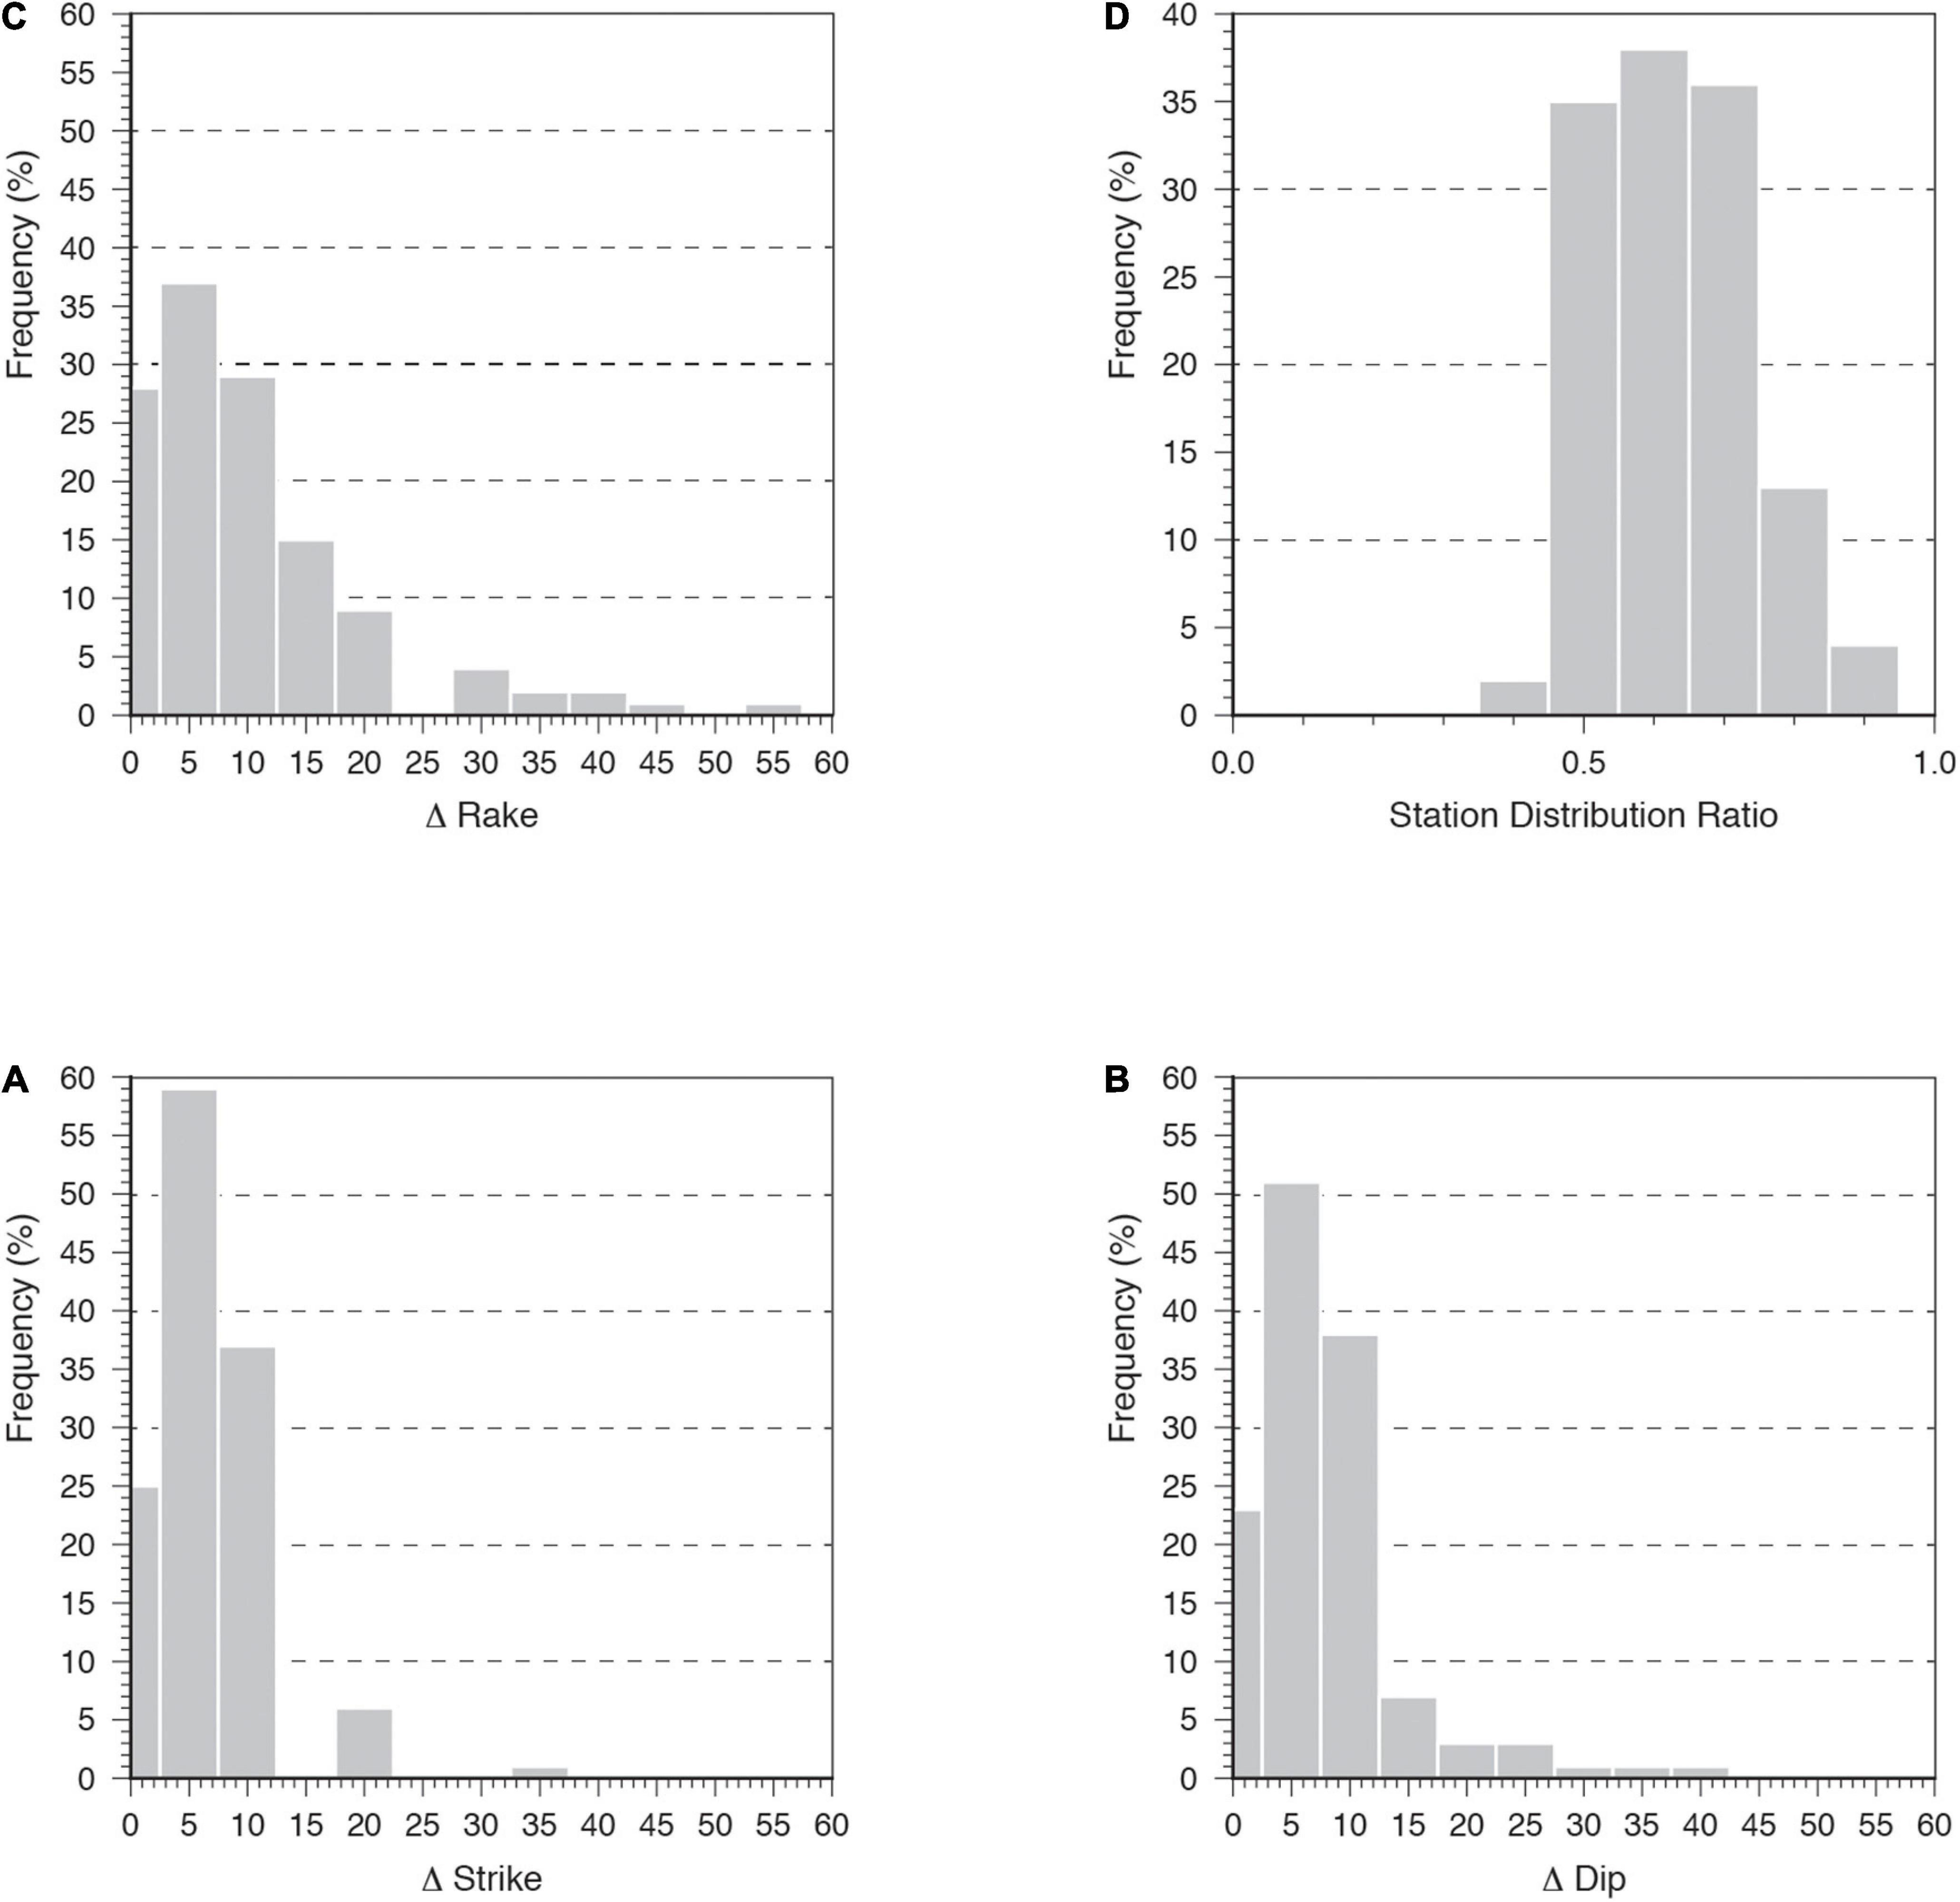
Figure 3. Histograms of the uncertainties distributions of strike (A), dip (B), and rake (C) of the presented focal solutions with STDR (stations distribution ratio) (D).
Finally, we produce a classification ternary diagram plotting the plunge of the intermediate (B), tension (T), and pression axes (P) of focal mechanisms to illustrate the faulting style of the seismotectonic regimes. The diagram uses the Kaverina et al. (1996) projection technique, used also by Kagan (2005), calculated with FMC script (Álvarez-Gómez, 2019).
Due to the large density of data in the small region of the AVN seismic sequence, we decided to discuss them in a separate section. We will therefore first describe the solutions of the focal mechanisms that occurred in Italy in the 2015–2019 period and then the solutions of the AVN seismic sequence. In both areas, we also focus on sub-areas where 3.0 ≤ M < 4.0 earthquakes are analyzed.
In Italy, during the selected 5 years, 51 earthquakes with M ≥ 4.0 occurred. We obtained a robust result for 49 earthquakes (Supplementary Table 1), 2 seismic events have multiple solutions (Supplementary Table 2). In Figure 4, we show a regional map with our new FPFIT solutions while in Figures 5A–C, we show the same solutions in depth along traces P1, P2, and P3.
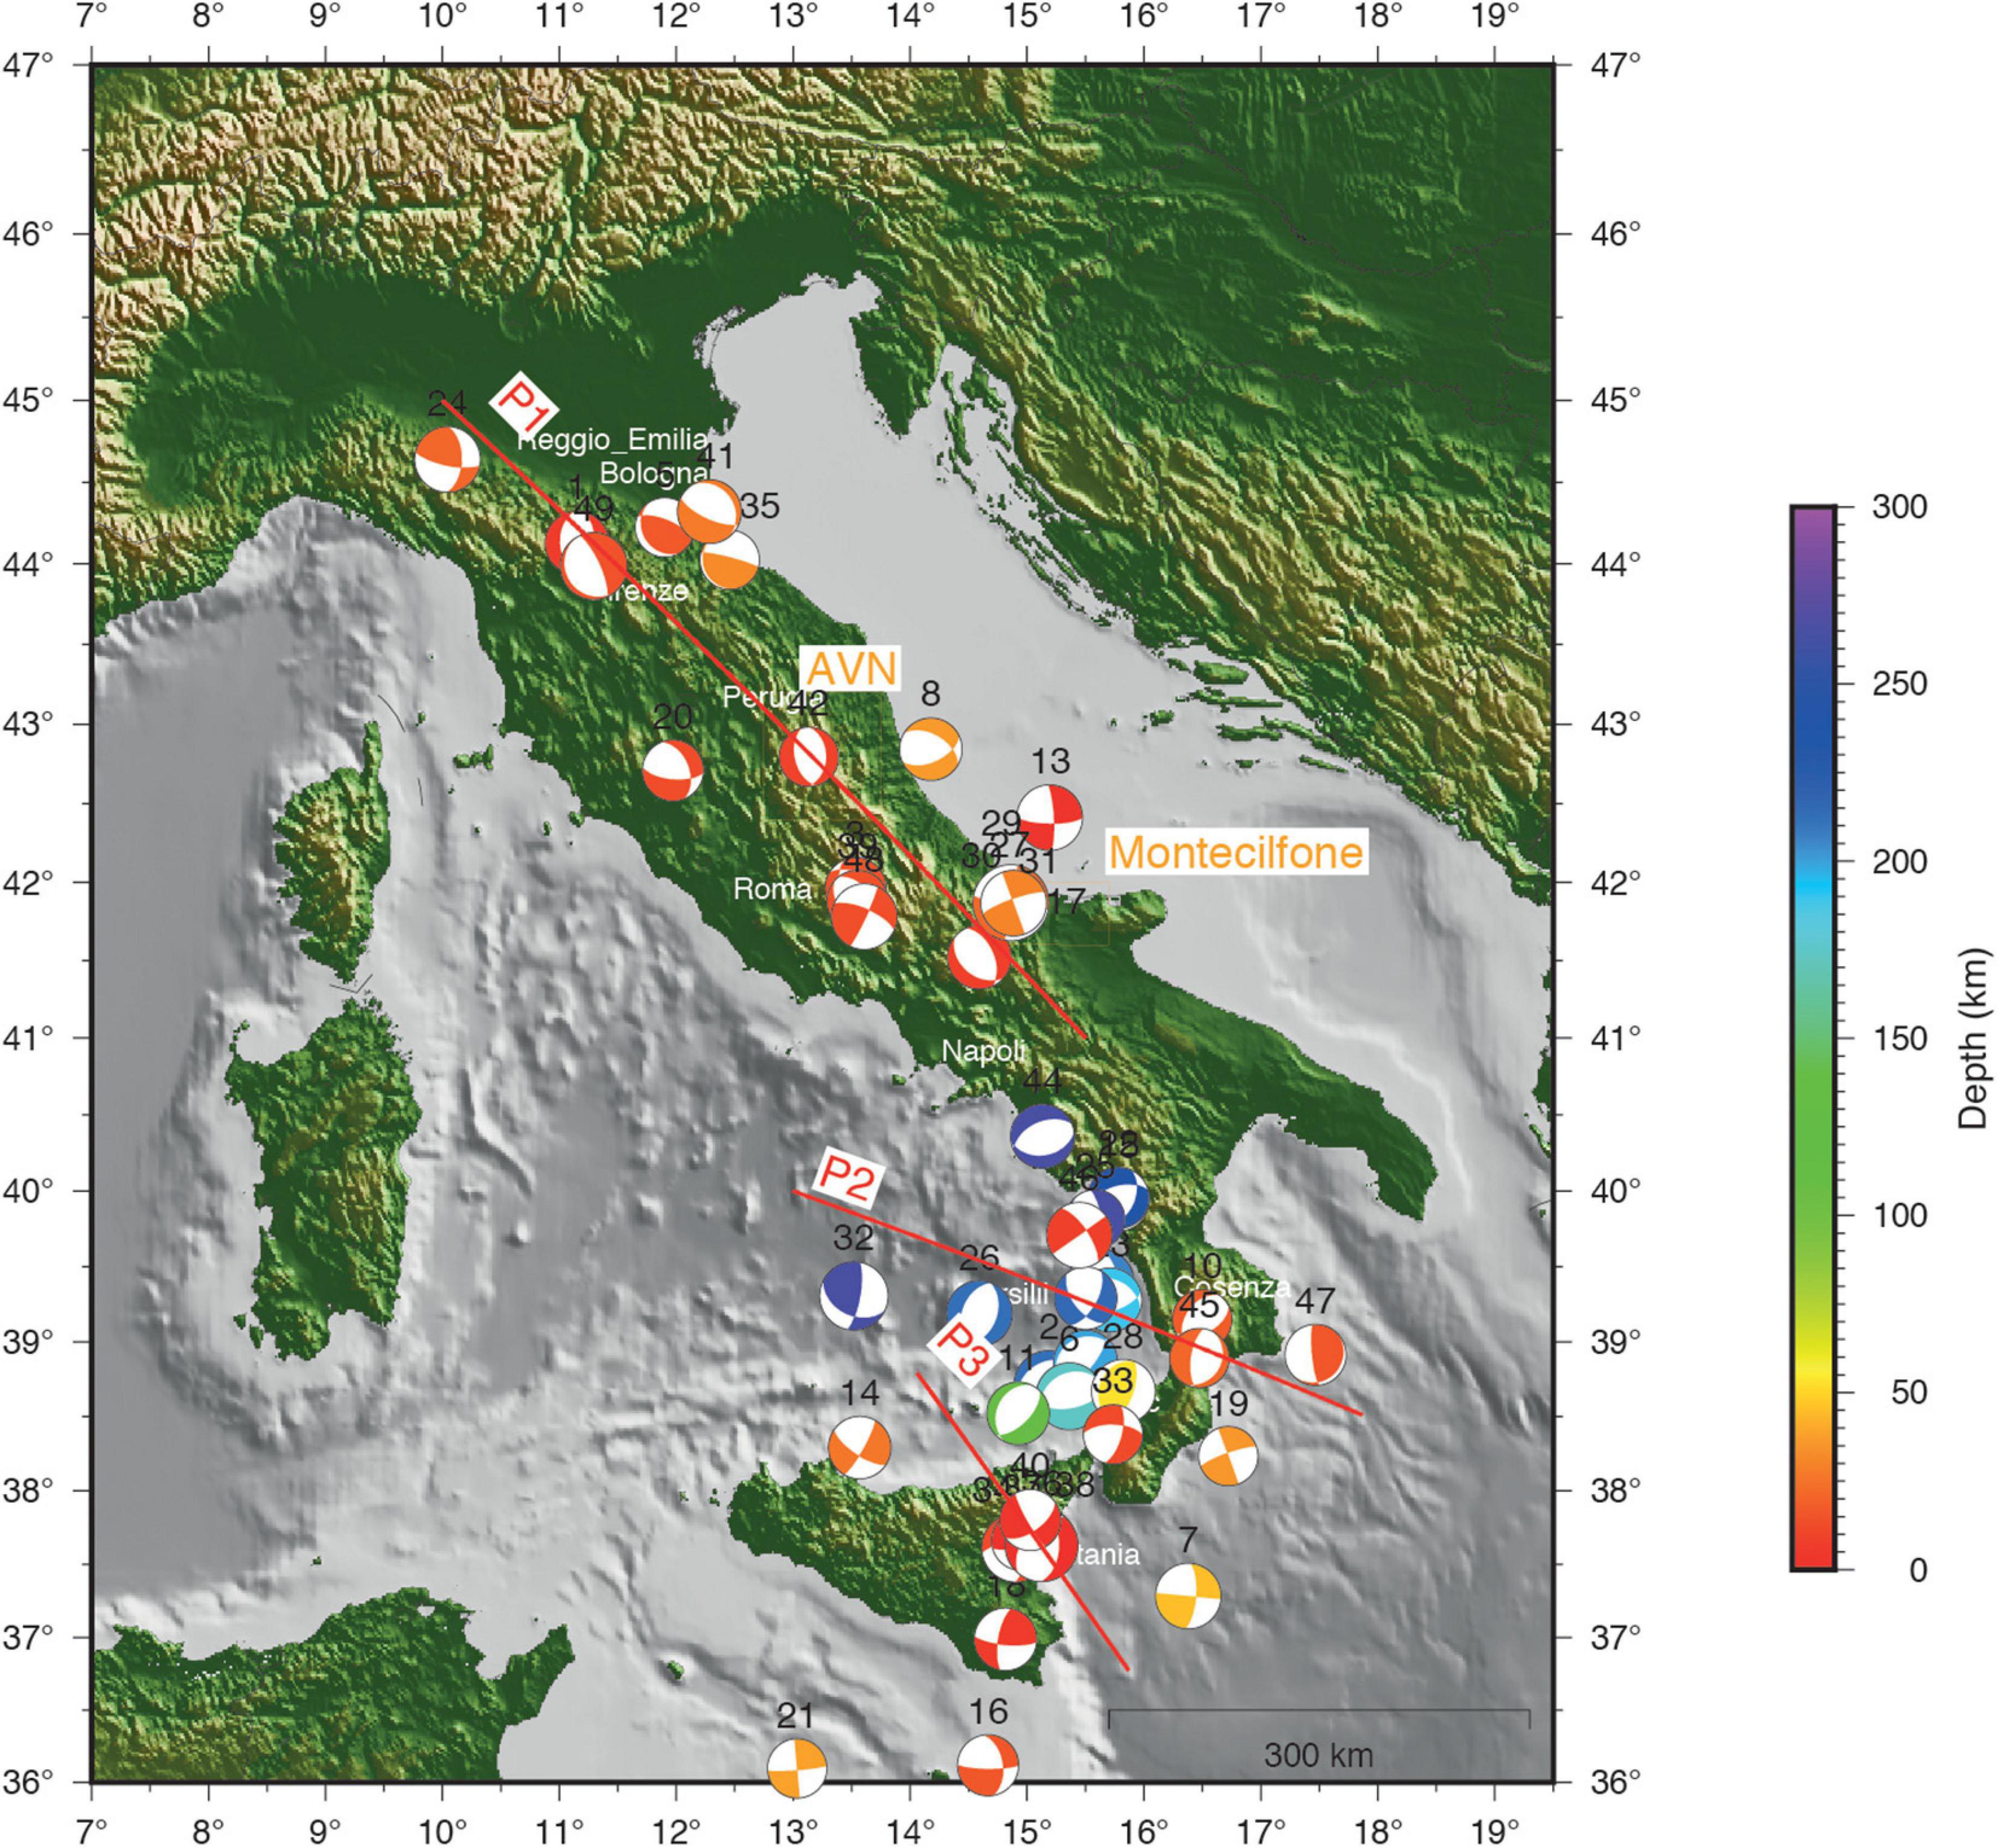
Figure 4. FPFIT focal solutions for the analyzed earthquakes M ≥ 4.0 reported in Supplementary Table 1, in the “Italy,” “muccia,” and “montecilfone” areas. AVN-Box is the area of the Amatrice–Visso–Norcia seismic sequence; P1: trace of the vertical cross section in Figure 5A; P2: trace of the vertical cross section in Figure 5B; P3: trace of the vertical cross-section in Figure 5C. Color scale is related to hypocenter depth.
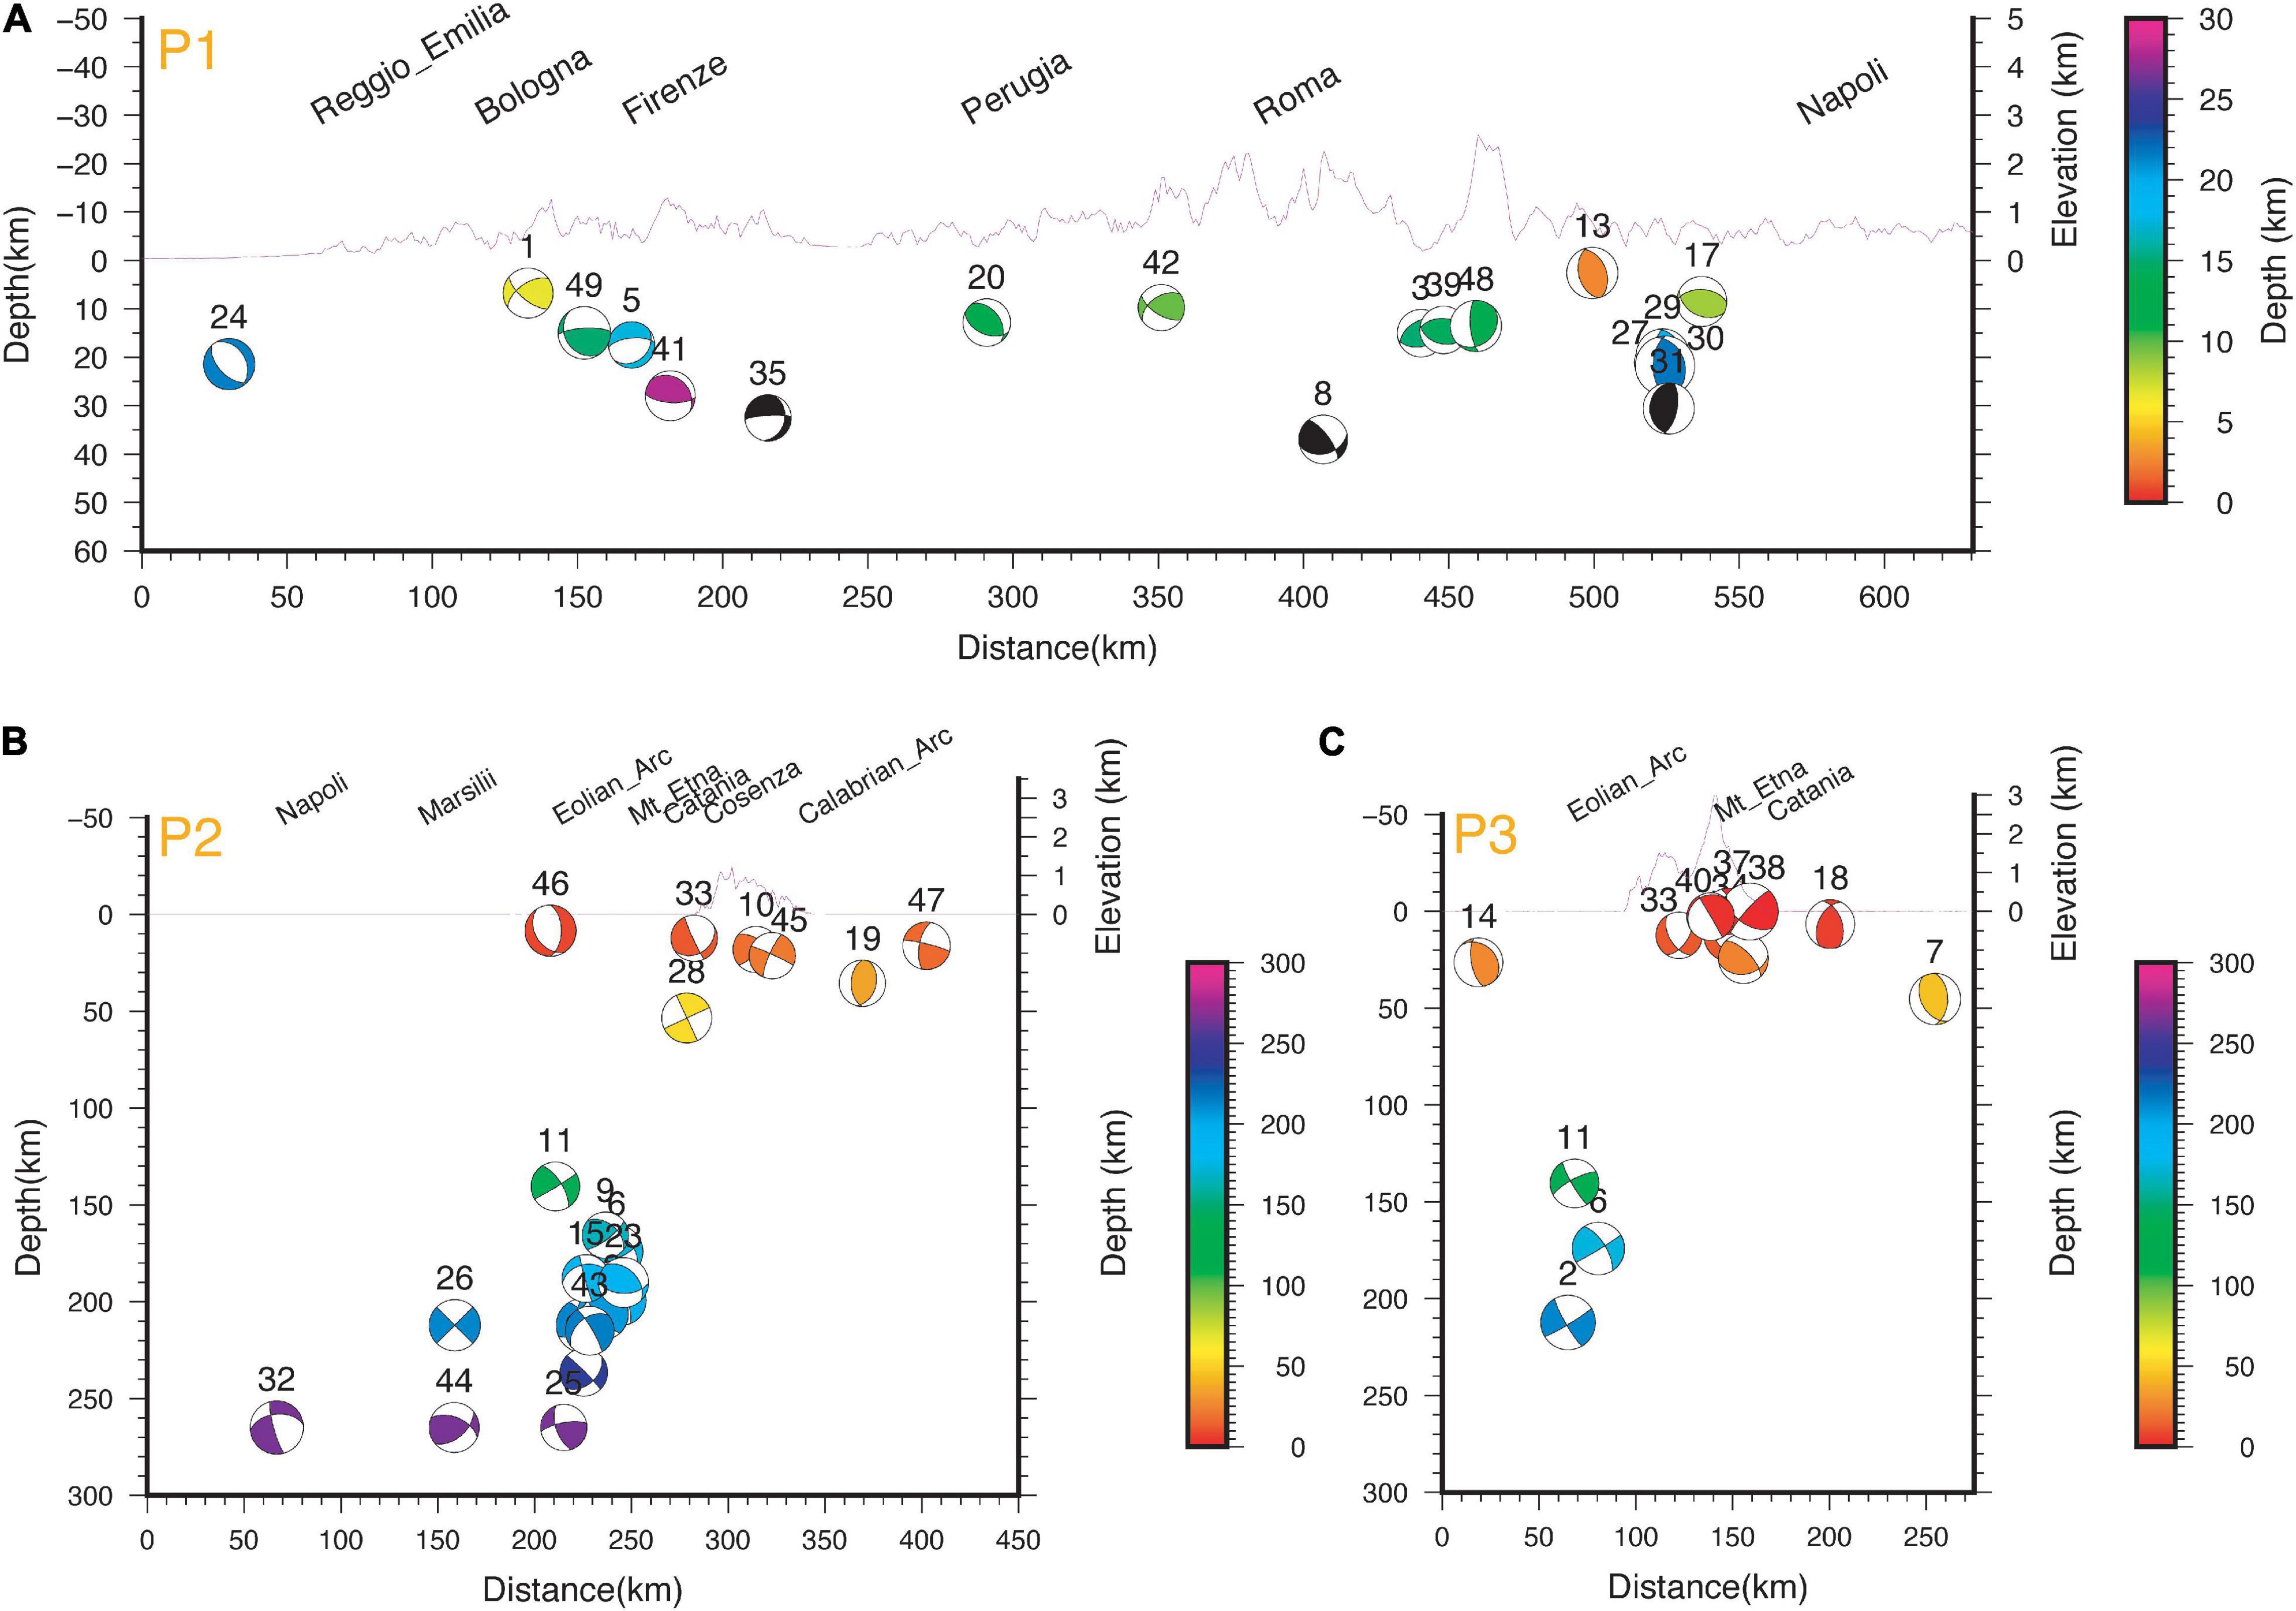
Figure 5. (A–C) Seismic cross-sections along P1, P2, and P3 profile shown in Figure 4.
In Figure 6, we show the histogram of the calculated rakes. We observe a spatial variability of the observed style of faulting reflecting the complex active tectonics of the Italian region. Statistical analysis of the kinematics of the nodal planes shows a prevalence of normal solutions with oblique/normal, left or right lateral components, while reverse and oblique/reverse mechanisms are rare.
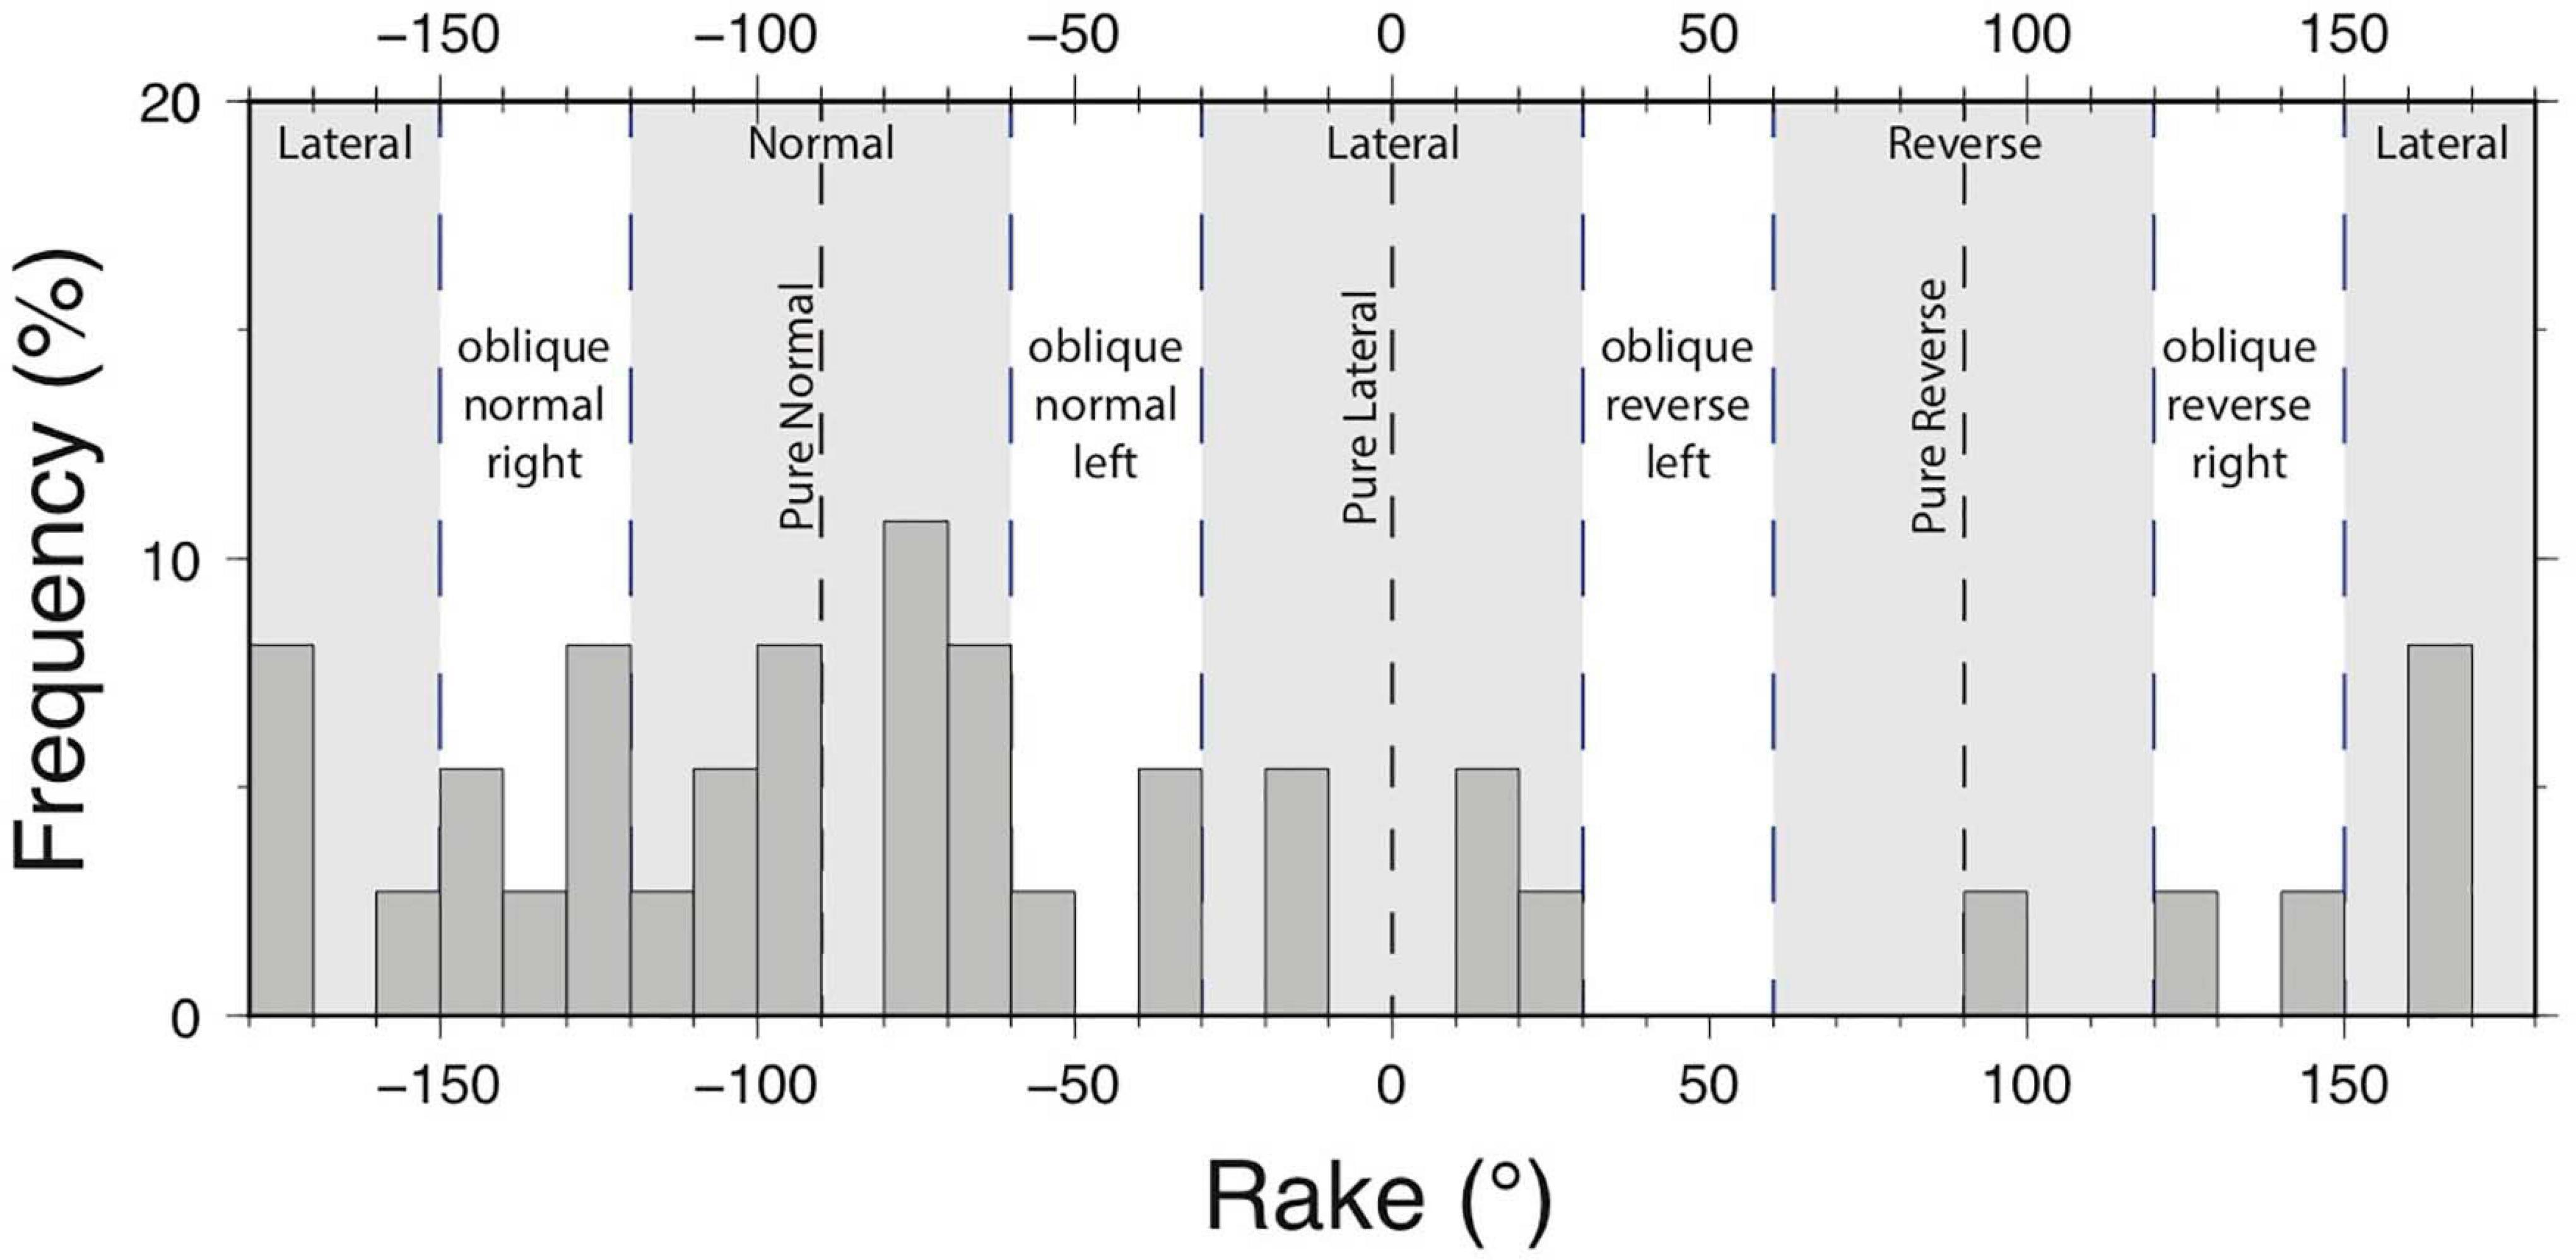
Figure 6. Histogram of the rake of the calculated focal mechanisms for “Italy” area.
This variability is also shown in Figures 7, 8. Figure 7 reports the azimuth of T-axes of the 49 solutions: thick lines represent the direction of T-axes with the white circle at the center of epicentral location of the respective event on the map; the length of the lines is proportional to the plunge. To classify focal mechanisms, we used the FMC program (Álvarez-Gómez, 2019) which produces the type classification (Kaverina et al., 1996) in Figure 8. This approximation began with the use of Frolich Apperson classification (1992) and improved later on after Kagan’s work (2005).
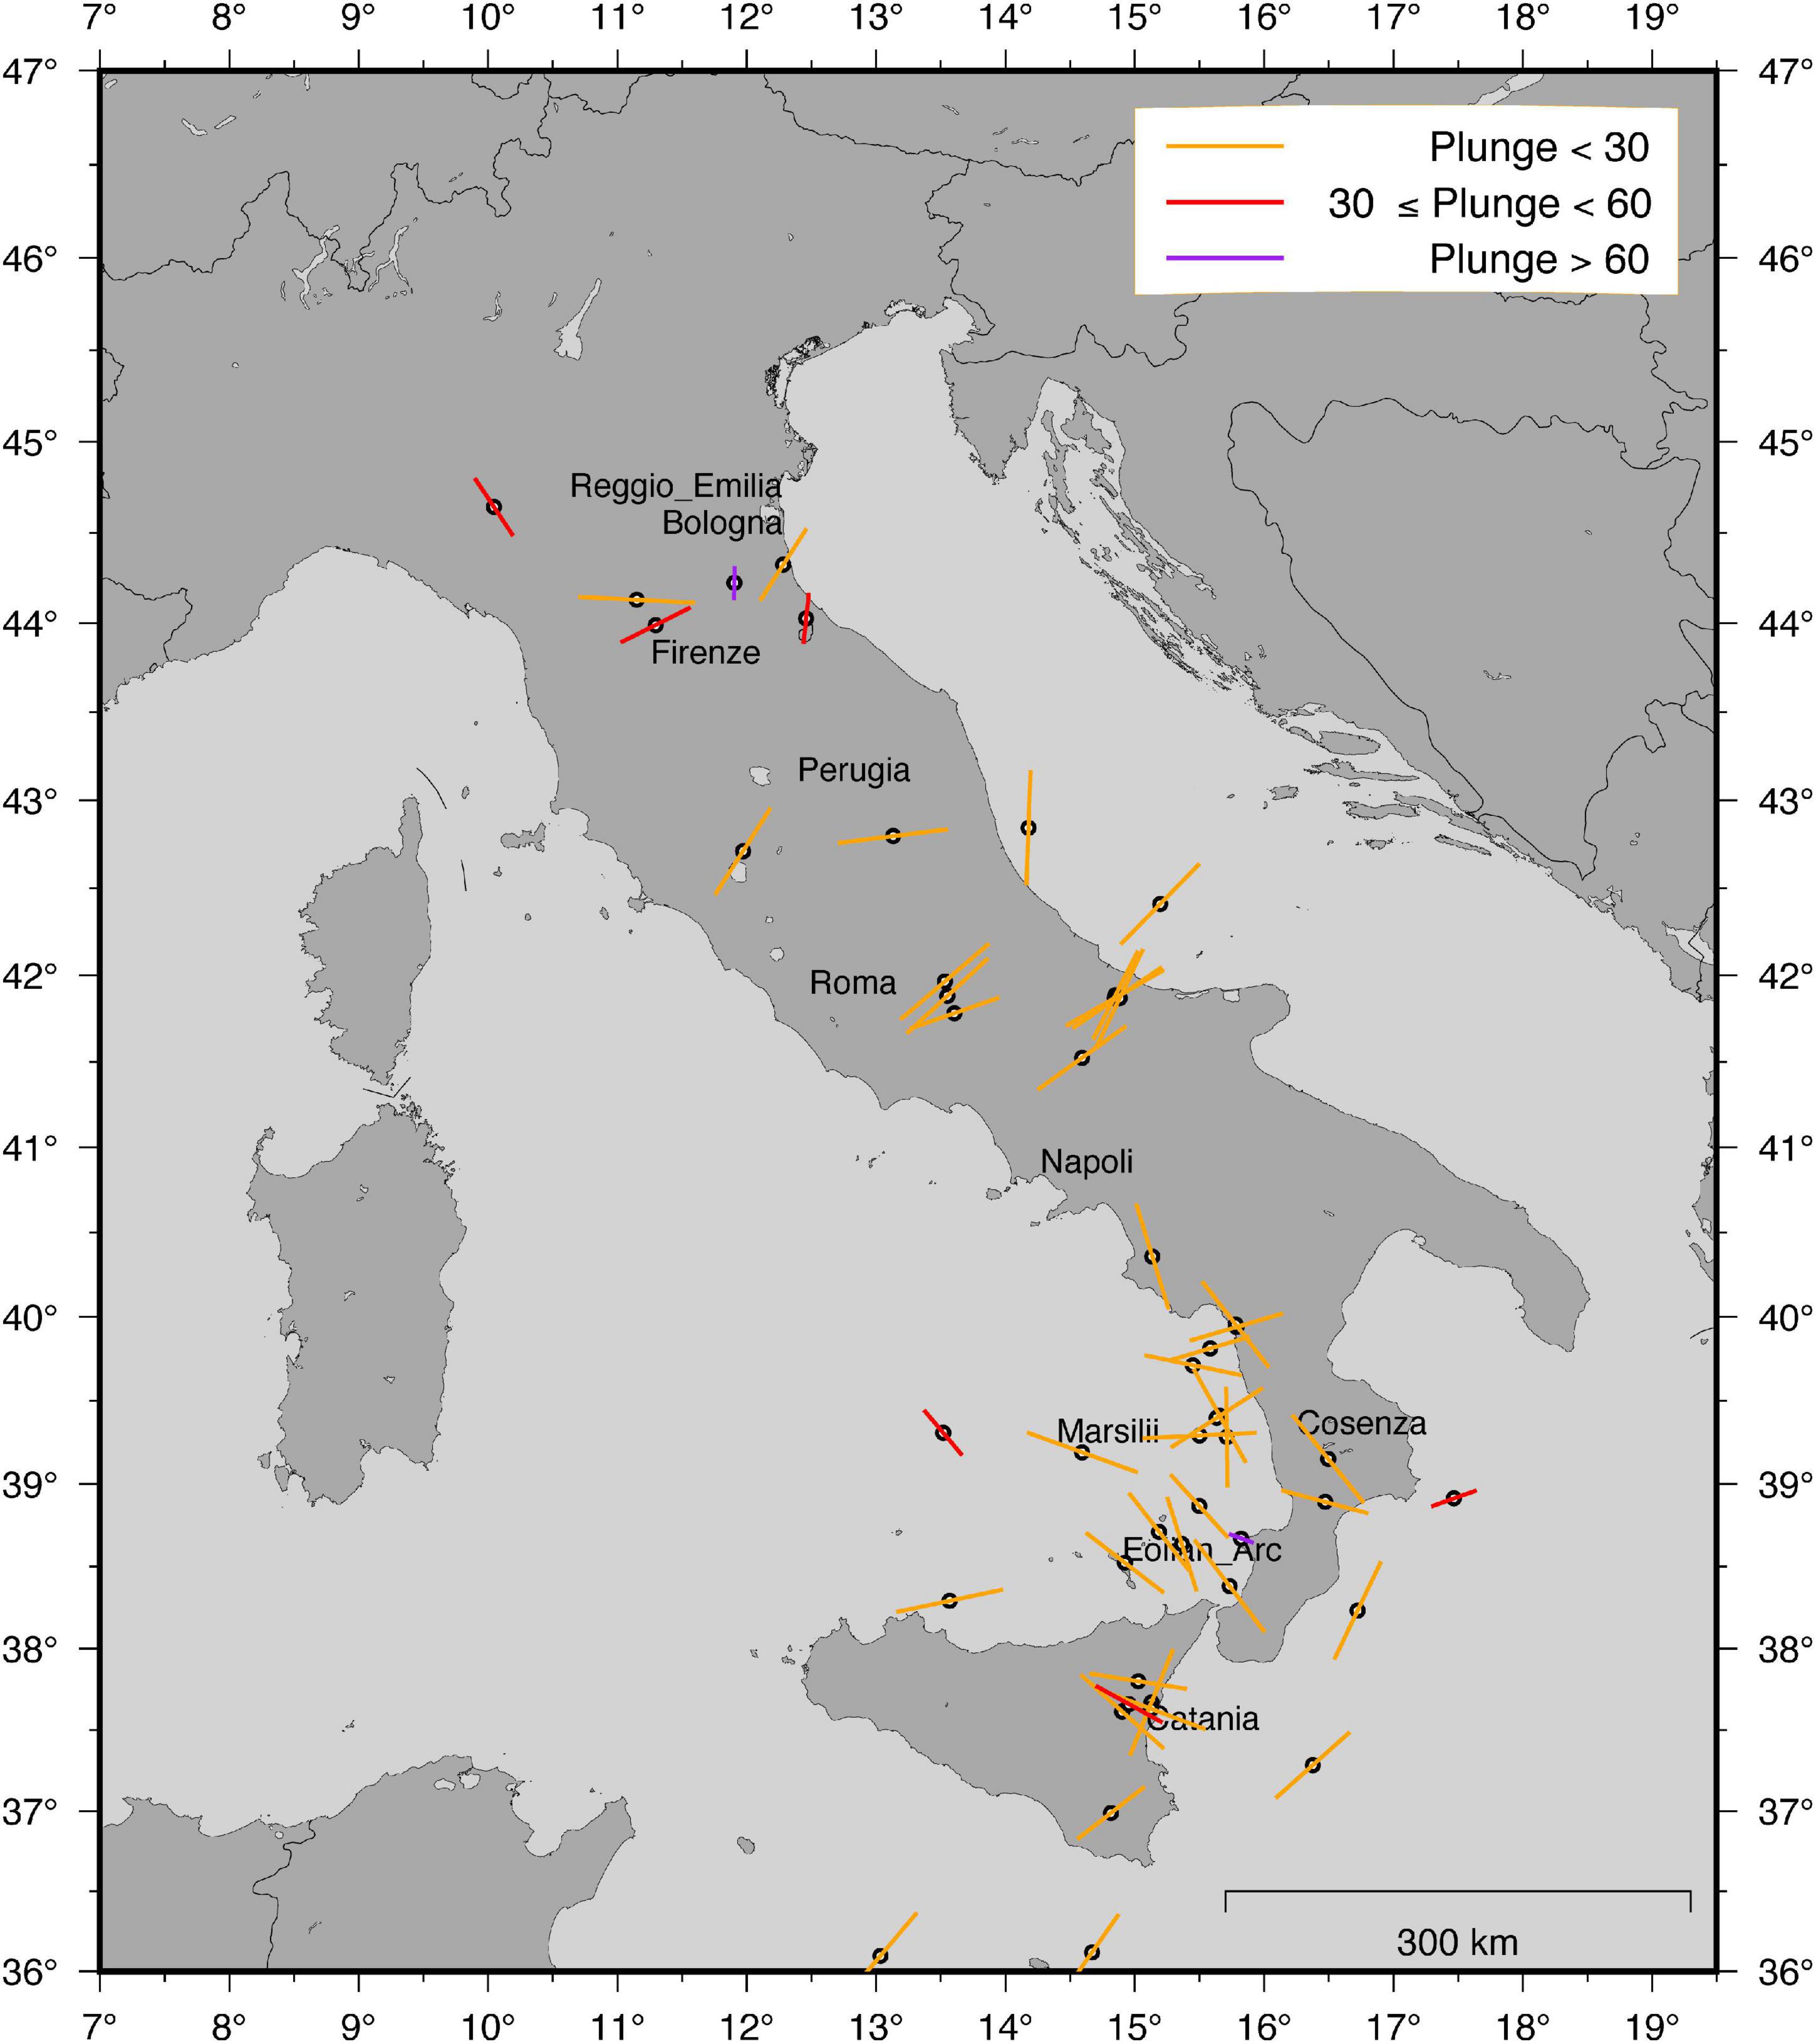
Figure 7. T-axes of focal mechanism solutions determined in the present study for “Italy” area. The length of each bar is inverse proportional to the plunge of the axis; colors are related to the 3 groups of plunges reported in the inset.
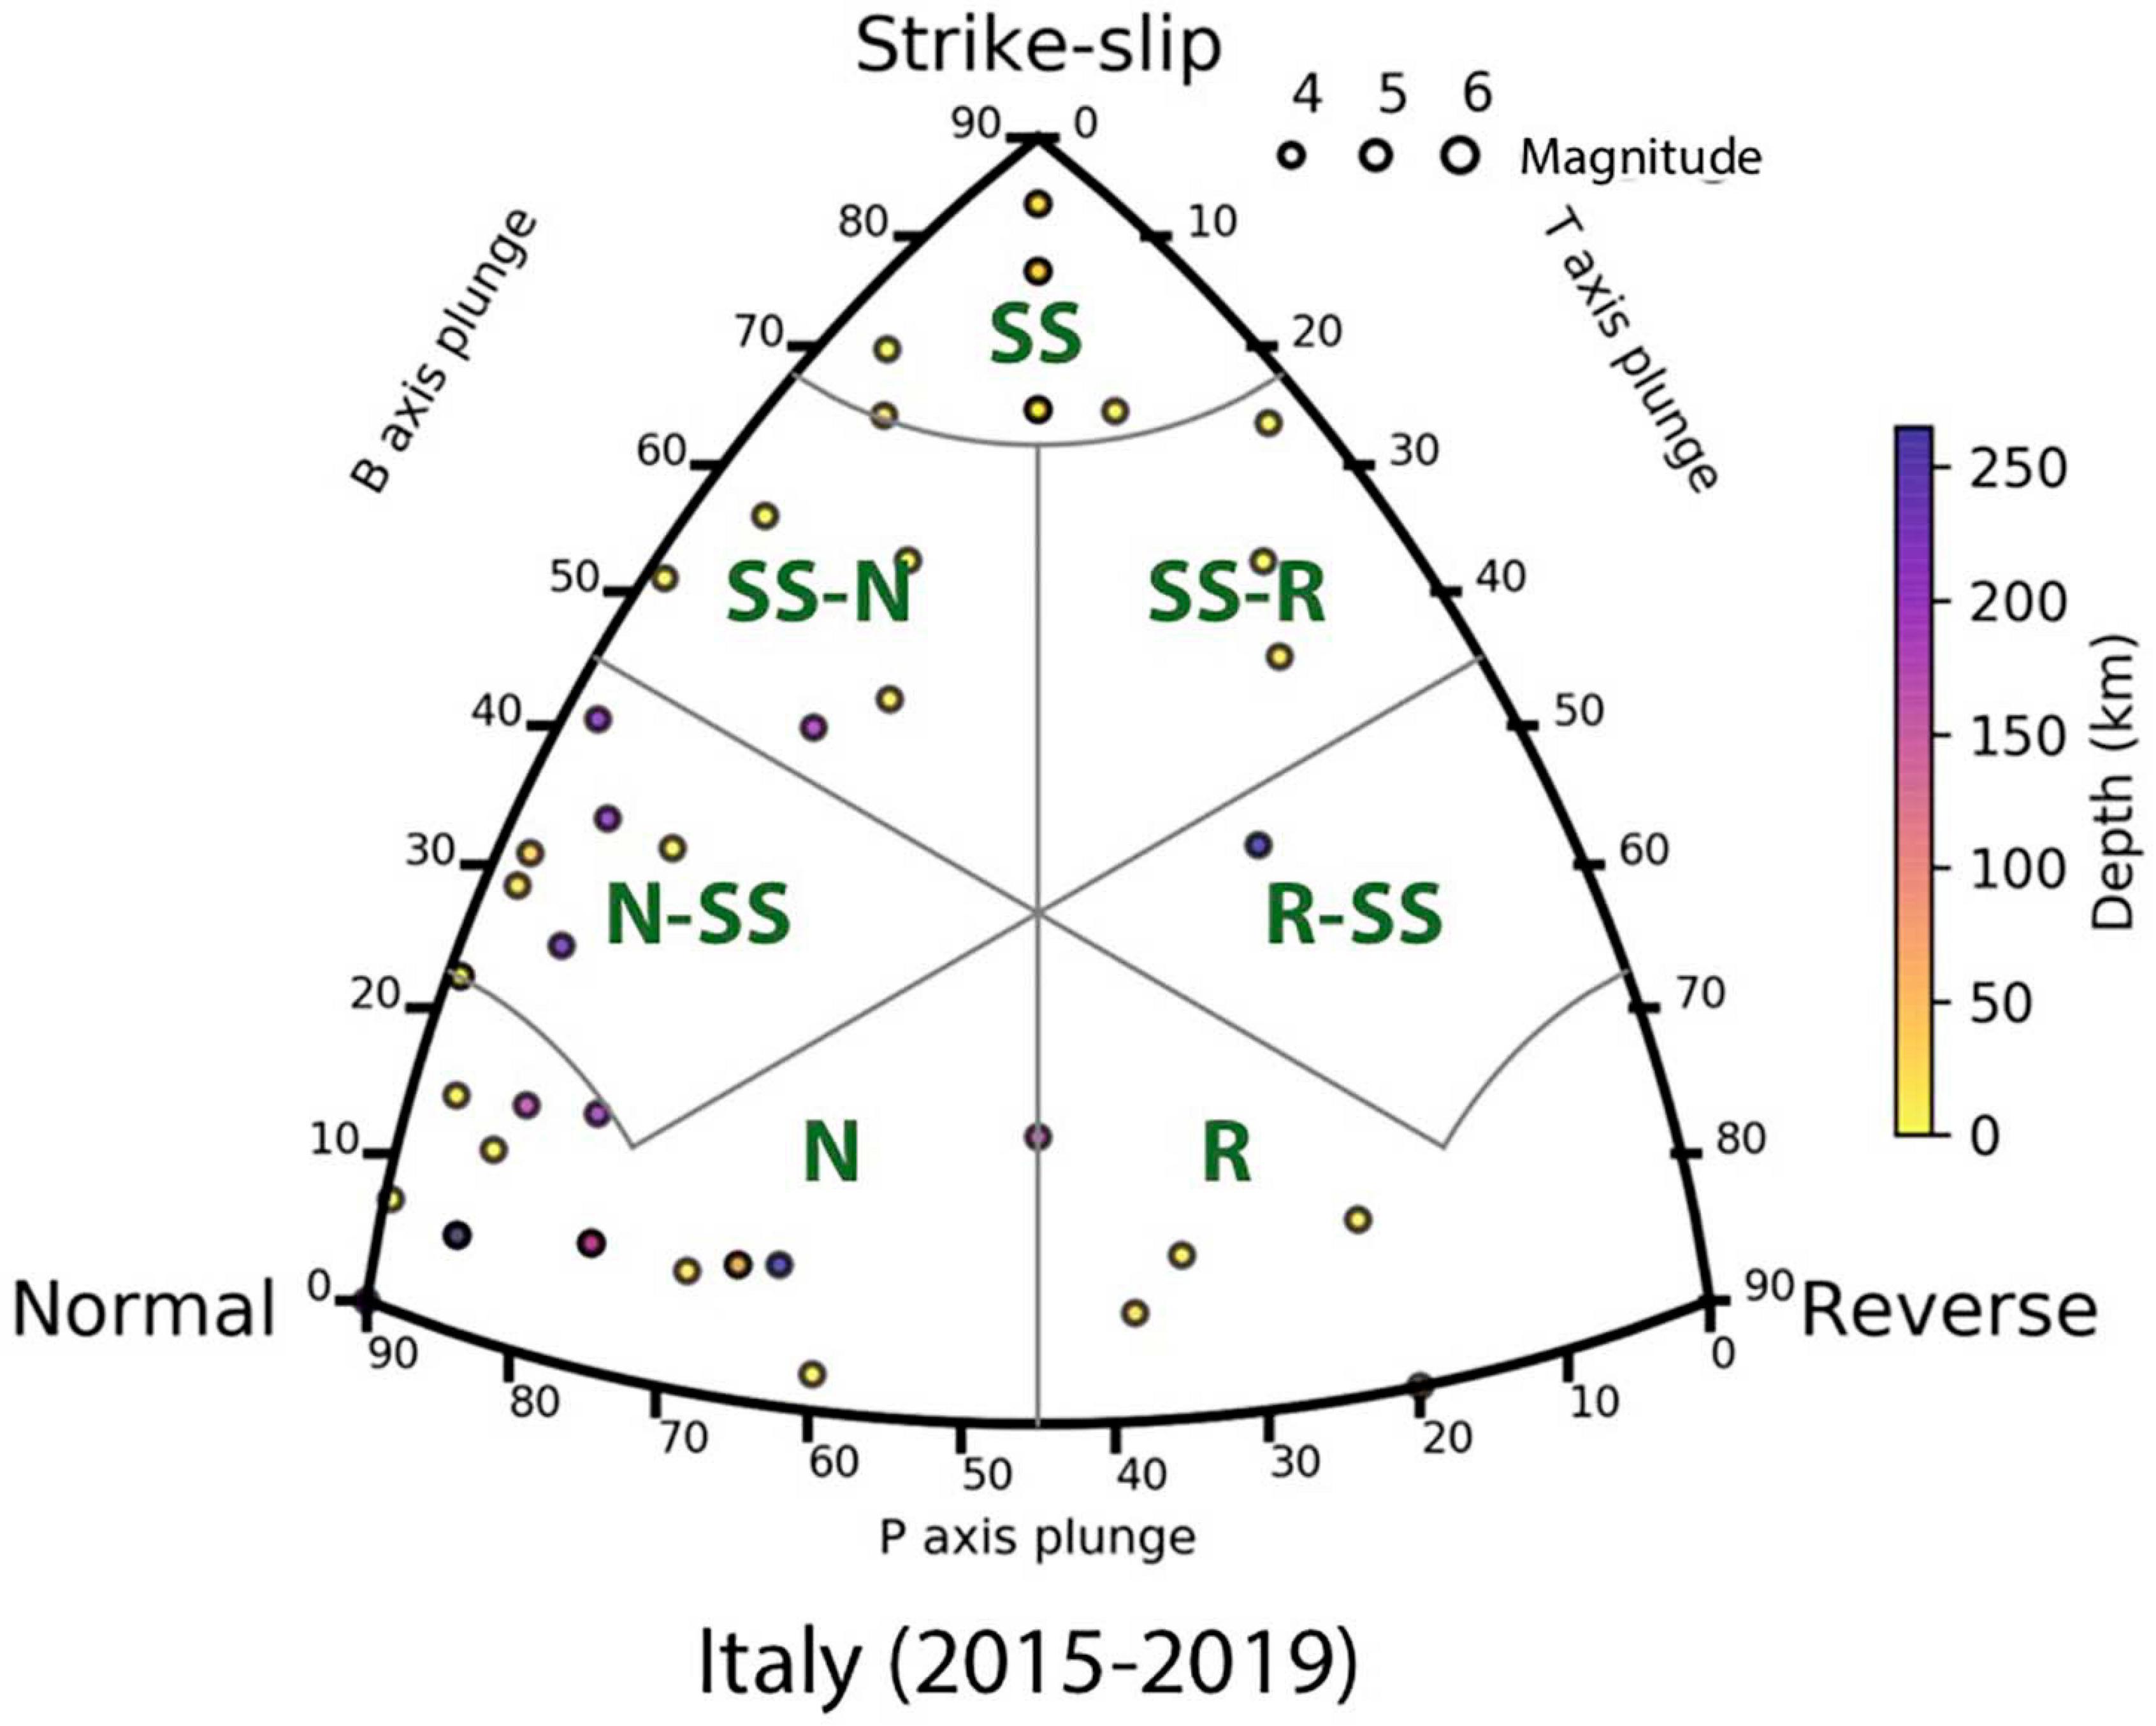
Figure 8. FMC diagram for the classification of focal mechanisms in Italy area. N, normal; N-SS, normal–strike-slip; SS-N, strike-slip–normal; SS, strike-slip; SS-R, strike-slip–reverse; R-SS, reverse–strike-slip; R, reverse. The points are scaled by magnitude and colored by different depths.
The M > 4.0 earthquakes that occurred in the northern Apennines during 2015–2019 show the extension–compression pair at the transition between the active extension zone of the Apenninic chain, oriented approximately perpendicular to the chain axes, and the buried compressive structures of the Po Plain (Figure 5A).
Strike-slip faulting are present in the region between the Apenninic axial zone and the Apulia-Gargano foreland (see the Montecilfone focus, next paragraph); the Calabrian arc and the Tyrrhenian Calabrian offshore are dominated, both at shallow and at higher depths, by active extensional deformation, while the south-eastern part of Sicily is dominated by strike-slip tectonic regime.
In particular, in the Tyrrhenian Sea, in the depth interval (0–250 km, Figure 5B), we find focal solutions with prevalent strike-slip solution (first 30 km) and prevalent normal component (deeper than 30 km): deeper earthquakes follow the Benioff plane dipping, at these depths, to about 70° (Selvaggi and Chiarabba, 1995). One seismic event shows a reverse solution: this earthquake is located very near to the coast (7 km from Tropea, Vibo Valentia).
In the Calabrian peninsula, two relatively shallow hypocenters (depth < 50 km) have a prevalent normal component while the seismic events in the Hyblean forland, Sicily Channel, and Ionian Sea show strike-slip solutions with normal components in agreement with previous studies (Presti et al., 2013; Figure 5C).
On April 25, 2018, a seismic event with Mw 4.3 occurred in the Montecilfone area, located to the west of the Gargano Promontory (Figure 8), followed by a small cluster of about 10 events with ML < 3.0. After less than 4 months, on August 14, a Mw 4.6 earthquake hit the same area. The sequence culminated on August 16 with a Mw 5.1 occurred at 21 km depth and about 3 km to the south of the April 25th event. This strongest event was followed 2 h after by a Mw 4.4 event and by numerous moderate–small aftershocks. About 600 earthquakes have been recorded by the RSN with ML ≤ 3.5 and hypocentral depth between 10 and 25 km. Among them, we could determine high-quality focal mechanisms for height earthquakes having magnitude 3.0 < ML < 4.0 (Figure 9). All the solutions indicate an almost pure strike-slip, right-lateral mechanism, with subvertical focal planes mainly oriented about NS and EW.
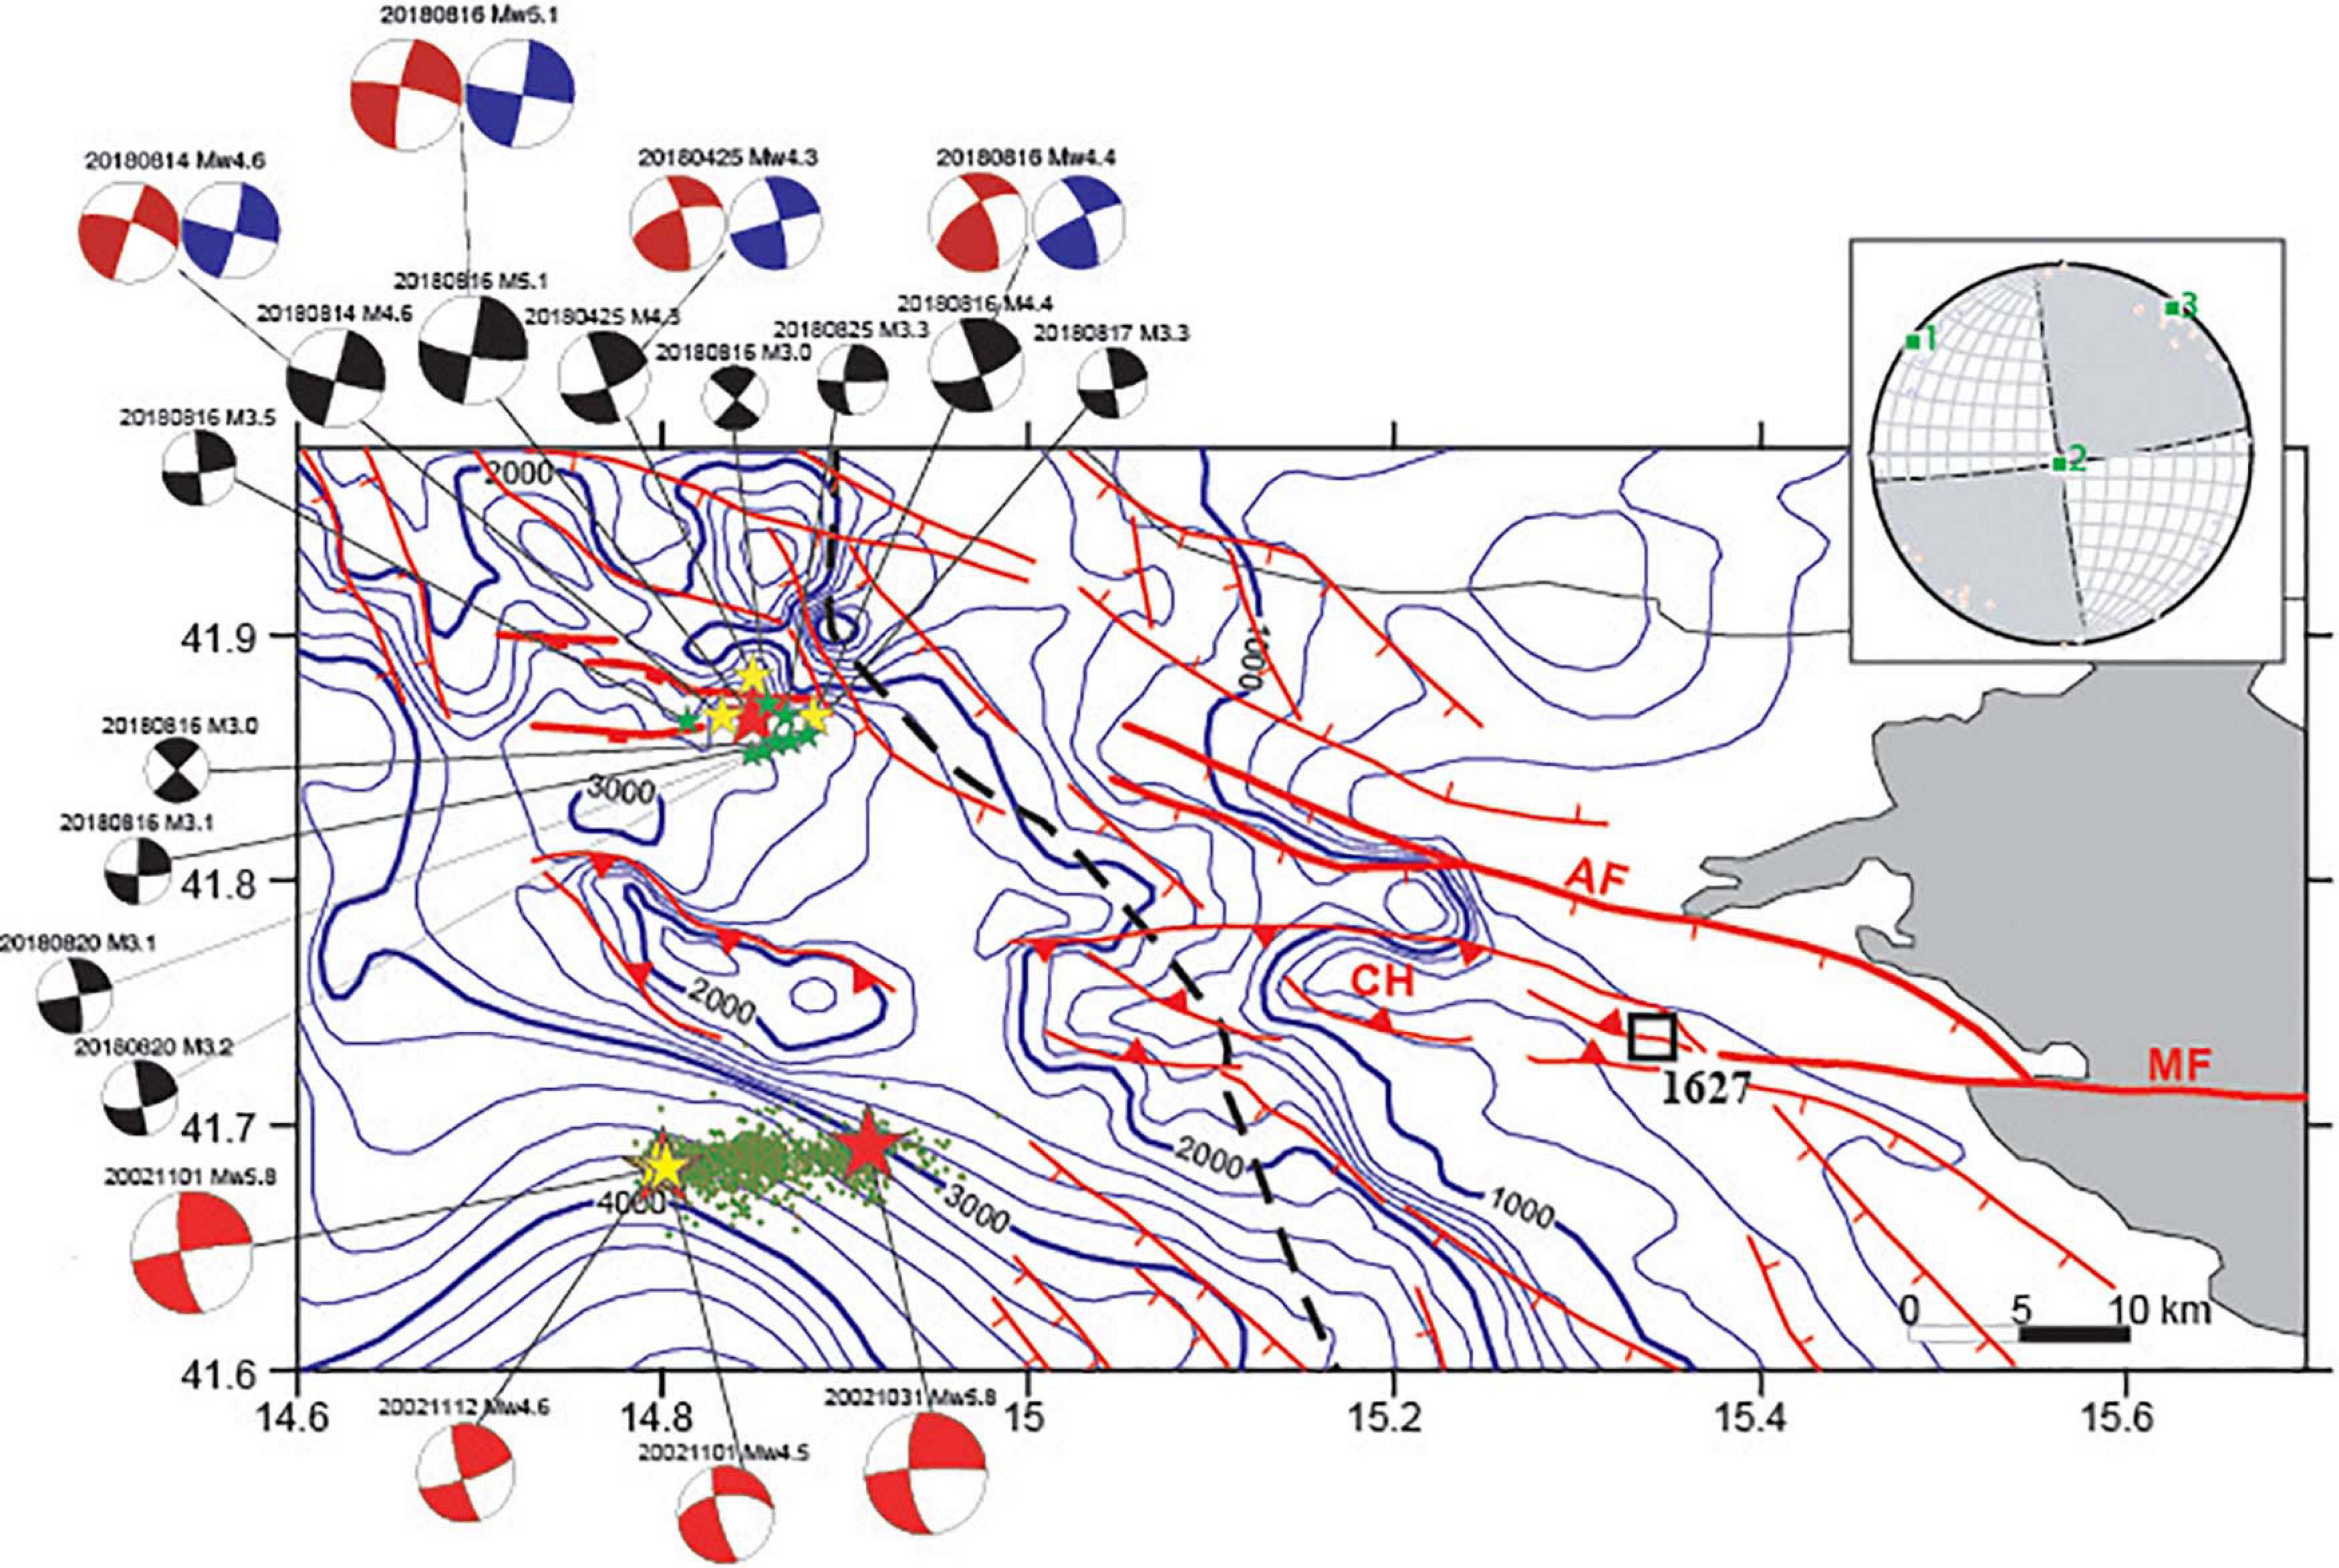
Figure 9. Structural map of the Apulia Carbonate Platform in the sector between the outer Apennine belt and the western Gargano region with focal mechanisms of the mainshocks and stronger aftershocks of the 2018 Montecilfone and 2002 Molise sequences. The blue lines are isobaths (in meters) of the top of the Mesozoic–Tertiary Apulian carbonates; red lines are normal faults (or faults with prevailing dip-slip displacement) and reverse faults (modified from Nicolai and Gambini, 2007). The dashed, thick black line is the buried front of the Apennine thrust sheets. The gray area corresponds to the Mesozoic–Tertiary Apulian carbonates exposed in the Gargano region. The Mattinata Fault (MF), Apricena Fault (AF, after Patacca and Scandone, 2004), and the W–E trending faults associated with the Montecilfone sequence are outlined with thick red lines. The black square is the macroseismic epicenter of the 1627, Me6.7, Capitanata earthquake. Black beach balls of the Montecilfone events are from this study; hypocenter locations of the Molise 2002 events are from Chiarabba et al. (2005a). Red stars, Mw > 5.0 earthquake; yellow stars, Mw ≥ 4.0 earthquakes; green stars, Mw ≥ 3.0 earthquakes. The box of the Montecilfone area in the Italian region is reported in Figure 3. The average focal mechanism attitude (unweighted moment tensor analysis; Kassaras and Kapetanidis, 2018) has been calculated considering M ≥ 3.0 events. Red focal mechanisms are from RCMT (rcmt2.bo.ingv.it/); blue focal mechanisms are from TDMT (cnt.rm.ingv.it/tdmt).
In Figure 9, we show the focal mechanisms calculated in this work with first polarities compared with the available TDMT and RCMT solutions. We observe a very good agreement of the first motion and the moment tensor solution. Moreover, our first-motion polarities’ focal mechanisms for M < 4.0 earthquakes testify that the strike-slip dextral faulting observed for the moderate events is also present at small scale suggesting almost regular fault plane geometries. By combining the hypocenter distribution and focal mechanism of all events here analyzed, we conclude that the 2018 events relate to an unknown, strike-slip structure, trending about EW and characterized by a right-lateral kinematic.
In agreement, the average focal mechanism in the Montecilfone area points out a strike-slip regime with a sub-vertical σ2 and horizontal σ1 and σ3, NW–SE and NE–SW oriented, respectively (see inset in Figure 9). This trend perfectly fits with the contemporary stress state in the external area of the southern Apennines (Mariucci and Montone, 2020a, b), where the minimum horizontal stress is NE–SW oriented, coherent with the extension in the inner belt, but related to a strike-slip tectonic regime as evidenced also by a few instrumental events (Potenza 1990 and Molise 2002 sequences; Di Luccio et al., 2005a, b) and main seismogenic sources (DISS Working Group, 2018).
Remarkably, such a structure broke the mid-lower crust (10–25 km depth), differently from the seismicity of the southern Apennines belt that is confined in the uppermost 15 km of the crust, and its strike appears transverse to the NW–SE direction of the large active normal faults dissecting the Apennine range westwards.
To better understand the seismotectonic framework of the 2018 Montecilfone seismicity, we analyzed subsurface structural information available in literature. The 2018 sequence occurred in the easternmost sector of the southern Apennines thrust-and-fold belt, where the more external nappes overthrust Late Pliocene–Early Pleistocene foredeep deposits that in turn stratigraphically cover the Outer Apulian Carbonate Platform (OAP) (Menardi Noguera and Rea, 2000; Butler et al., 2004; Patacca and Scandone, 2004). The structural map of Figure 9 shows the morphology of the top of the buried OAP, together with the main faults that displace the Apulian carbonates, from the external zone of the Apennines belt to the Apulian foreland (i.e., the western Gargano Promontory). This structural map, based on a wealth of seismic commercial profiles and well data interpreted by Nicolai and Gambini (2007), outlines two main structural trends: the regional-scale SW deepening of the OAP and local-scale structures represented by E–W to WNW–ESE oriented highs and lows. The SW deepening of the OAP from 1 km to more than 5 km depth represents the response of the Apulian carbonates to the flexure-hinge retreat of the Apulia plate margin. It is associated with NW–SE normal faults active during Late Pliocene–Early Pleistocene times that are evident in the southern part of the map. Three main deviations from the regional trend characterize the central and northwestern sectors of the survey area (Figure 9). High-angle transpressive faults delimit the E–W trending Chieuti High, a push-up structure active during Lower Pleistocene (Patacca and Scandone, 2004). About 5 km to the west, a WNW–ESE trending structural high aligned with the Chieuti structure has plausibly the same nature. Indeed, this structure cannot be related to the compressive structures deforming the Inner Apulia Platform thrust–fold belt being its frontal ramp located more than 30 km further west (Nicolai and Gambini, 2007). A structural low oriented E–W is bounded to the north by the Apricena fault (Figure 9). According to Patacca and Scandone (2004), the WNW–ESE Apricena fault is a major high-angle structure that dips SSW with significant dip-slip displacement; it shows evidence of recent activity and can be identified as the source of the 1627, M6.7 Capitanata earthquake, the strongest historical event that struck the region (see the macroseismic epicenter reported in Figure 9). The activity of the Apricena Fault up to late Pleistocene at least is confirmed by recent high-resolution seismic reflection surveys that also seem to indicate a significant strike slip component of motion (Varriale, 2011).
Both the Chieuti and Apricena structures join the transcurrent Mattinata Fault System in the western Gargano Promontory. This is a lithospheric-scale active and seismogenic structure characterized by a complex polyphase evolution. Likely of Mesozoic origin, it was reactivated as a sinistral strike slip system from Miocene to early Pliocene and then it has slipped with dextral kinematics since late Pliocene (Di Bucci et al., 2010; and references therein).
East–west oriented structures that clearly deviate from the regional trend are also present just in the epicentral area of the 2018 Montecilfone sequence (Figure 9). Here, the structural map reports three parallel S-dipping high-angle faults, with the main one that measures 12 km long strike. Fault kinematics is unknown, but a dip-slip component may be hypothesized based on the southward deepening of the Apulian carbonate top. Remarkably, the epicenters of all largest earthquakes (M > 3) with reliable focal solutions fall in the hanging wall of the main E–W fault, near the fault trace, consistently with the southward dip of nearly vertical E–W nodal planes (Figure 9). Further north, WNW–ESE trending faults delimit a complex zone, where wide depressions of the OAP are bounded by E–W trending narrow ridges. We outline that the three E–W faults are located along the western prolongation of the Apricena active fault.
The OAP forms a 6–7 km thick Meso-Cenozoic carbonate multilayer overlying Permo-Triassic clastics that in turn covers a Paleozoic crystalline basement likely composed of Variscan metamorphic rocks (Mazzoli et al., 2013). Consequently, the bottom of the Apulian carbonates in the epicentral area can be set to 9–10 km depth. Considering the 10–25 km depth range of the Montecilfone seismicity, we conclude that the 2018 sequence activated the mid-lower crustal section of an E–W trending shear zone with dextral strike-slip kinematics without rupturing its upper part that presumably extends upwards up to the OAP top, as inferred by the structural map in Figure 9.
Prior to the 2018 seismic sequence, the Montecilfone area did not experience significant historical and instrumental seismicity. The closest activity is represented by the 2002 Molise seismic sequence, located 20 km S of Montecilfone, and characterized by two Mw 5.8 mainshocks nucleated at 21–22 km depth on October 31 and November 1 (Figure 9). Both mainshocks, as well as large M > 4 aftershocks, are characterized by pure right-lateral strike-slip mechanisms and together with aftershock distribution unraveled the rupture of an 8–25 km deep section of the Apulian crust due to the re-activation of several pre-existing near-vertical faults striking W–E (Chiarabba et al., 2005a; Di Luccio et al., 2005a). Due to the low density and quality of hydrocarbon exploration data in the Molise 2002 source region, the structural map of the OAP has a very smooth shape and does not show deviation from the SW-dipping regional trend (Figure 9). Unlike, a wide depression of the Apulian carbonates bounded by a system of W–E and NE–SW faults was unraveled by Latorre et al. (2010) by migrating S-P converted phases from the OAP top recognized on most aftershock recordings. Such a structural low was interpreted as a pull-apart basin associated with a releasing bend of a W–E trending strike-slip structure activated during the 2002 sequence and representing the western prolongation, underneath the Apennines nappes of the Mattinata Fault–Chieuti High shear zone. In particular, Latorre et al. (2010) hypothesized the presence of a negative flower structure to reconcile the faults identified at the top of the OAP with the deeper E–W trending strike-slip causative faults of the two mainshocks. In such a scenario, a deep strike-slip fault system reactivates upwards secondary faults that bound the pull-apart basin dissecting with a significant dip-slip displacement the Apulian carbonates.
Here, we hypothesize a similar model for the Montecilfone sequence. In this case, the E–W trending deep strike-slip fault system activated by the 2018 sequence that also dissects the OAP top may represent the western prolongation of the Mattinata Fault–Apricena Fault active structures.
Sharing the hypocenter depths, source mechanisms, fault orientations, and structural features, the Montecilfone 2018 and Molise 2002 sequences can be considered both expressions of a distinct seismotectonic setting characterizing that wide region of southern Italy extending between the Apennine external zone and the Apulian foreland. Our finding, together with minor deep swarms with dominant strike-slip focal solutions that occurred in recent years (Trionfera et al., 2020), reinforce indeed previous seismotectonic models that emphasize the role of pre-existing W–E trending lithospheric shear zones in accommodating the Adria intraplate deformation in response to Africa–Eurasia plate convergence (Di Bucci et al., 2010) and in producing moderate to strong deep earthquakes in the Adriatic side of the southern Apennines (Fracassi et al., 2004; Valensise et al., 2004).
The AVN seismic sequence occurred throughout central Italy with an epicentral distribution geometrically coherent with the extensional system of active faults, longitudinally dissecting the Apennine chain. This sequence, started on August 24, 2016, includes the Mw 6.5 Norcia event that is the strongest earthquake that occurred over the last 30 years in Italy. The BSI group dedicated a particular analysis strategy for these earthquakes (Marchetti et al., 2016) analyzing manually over 100,000 seismic events located in an area extending for about 60 km from the Muccia village to the north, to the Montereale village to the south, where it overlaps the northernmost part of the 2009 L’Aquila seismic sequence. This careful reprocessing allowed the collection of the high-quality catalog of the 2016 central Italy AVN normal faulting sequence (Improta et al., 2019; Margheriti et al., 2019).
During this seismic sequence, 9 earthquakes had magnitudes M ≥ 5.0 and 65 earthquakes 4.0 ≤ M < 5.0. The strongest among them were the Mw 6.0 Amatrice earthquake on August 24, the Mw 5.9 Visso earthquake on 26 October, and the Mw 6.5 Norcia earthquake on October 30. The Amatrice earthquake was not preceded by foreshocks. Their RCMT and TDMT are dominated by normal faulting, NNW–SSE striking, focal planes, consistent with the local tectonic environment. Nevertheless, the distribution of aftershock hypocenters reveals the activation of a complex faults system (Michele et al., 2016, 2020; Chiaraluce et al., 2017; Improta et al., 2019; Margheriti et al., 2019).
We here present the focal mechanism solutions for 51 earthquakes (Supplementary Table 1) with M ≥ 4.0 that occurred inside the region interested by the AVN sequence; 5 earthquakes have multiple solutions.
The distribution and characteristics of the solutions are shown in Figure 10 in map, Figure 11 (cross-section NW–SE), and Figure 12 (the azimuth of T-axes of the solutions). The M > 4.0 seismicity, aligned along more than 50 km in an average N160° direction, deepens from the north to the south, between 3 and 13 km of depth, associated mainly with normal faulting mechanisms with oblique components, striking northwest–southeast, consistent with a tensional axes oriented from SW–NE to WSW–ENE. The histogram of the rakes (Figure 13) presents prevalence of normal solutions with oblique/normal, left or right lateral components, while reverse and oblique/reverse mechanisms are absent; this is observed also in Figure 14. Among extensional seismic events with a strong transcurrent component, we note three events (September 3, 2016 10:18; July 22, 2017 02:13; and December 3, 2017 23:34) which occurred, however, in a late phase of the seismic sequence. The fault system shows dip ranging from 35 to 90°, and 2 seismic events have a dip of 15°; they are located at 5.18 km depth, with epicenter near Visso, and at 10.19 km depth, with epicenter 2 km south to Amatrice.
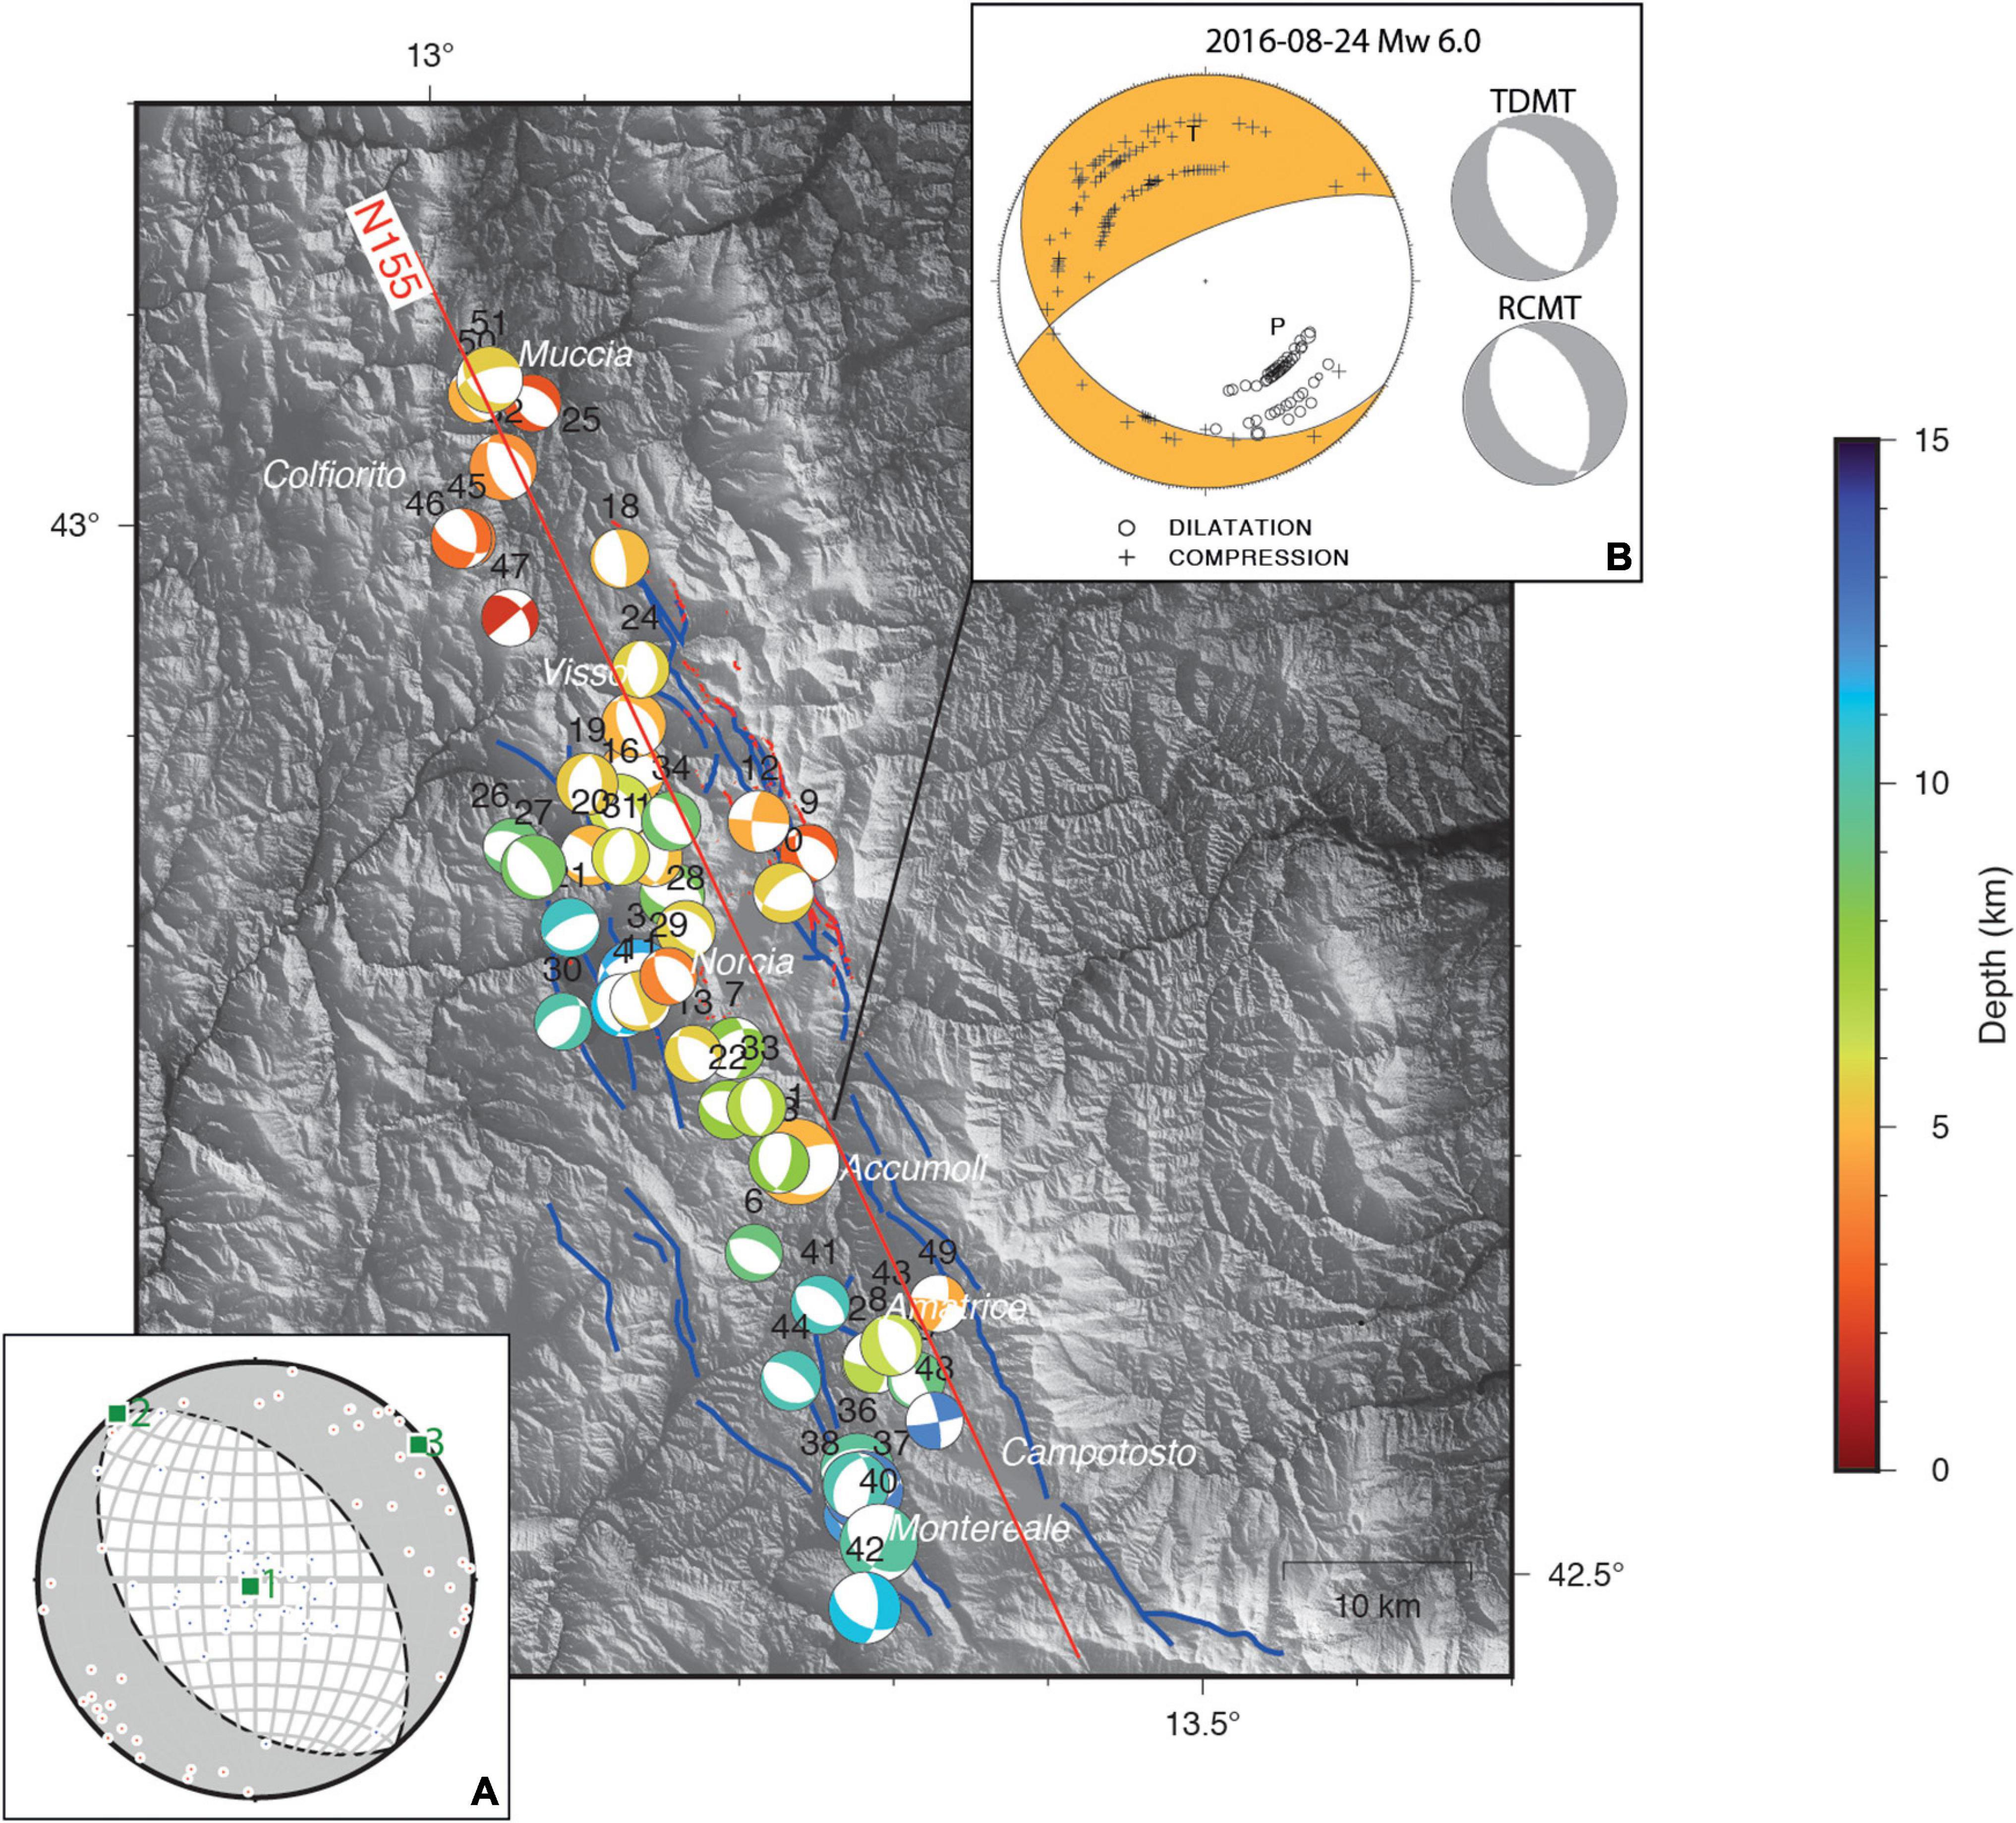
Figure 10. FPFIT focal solutions for the earthquakes reported in Supplementary Table 1, for “AVN” area; the red line, oriented N155, is the trace of the vertical section in Figure 11; the color scale is related to the depth of the hypocenters; bottom left inset: the mean focal moment tensor solution calculated from all the nodal planes. (A) The average focal mechanism obtained by unweighted moment tensor (Kassaras and Kapetanidis, 2018) has been calculated considering all the 51 earthquakes (Supplementary Table 1) with M ≥ 4.0 that occurred inside the region interested by the AVN sequence and plotted in this map. (B) Distribution of polarities of the Mw 6.0 August 24, 2016 earthquake over its focal solution and the TDMT and RCMT solution for the same event.
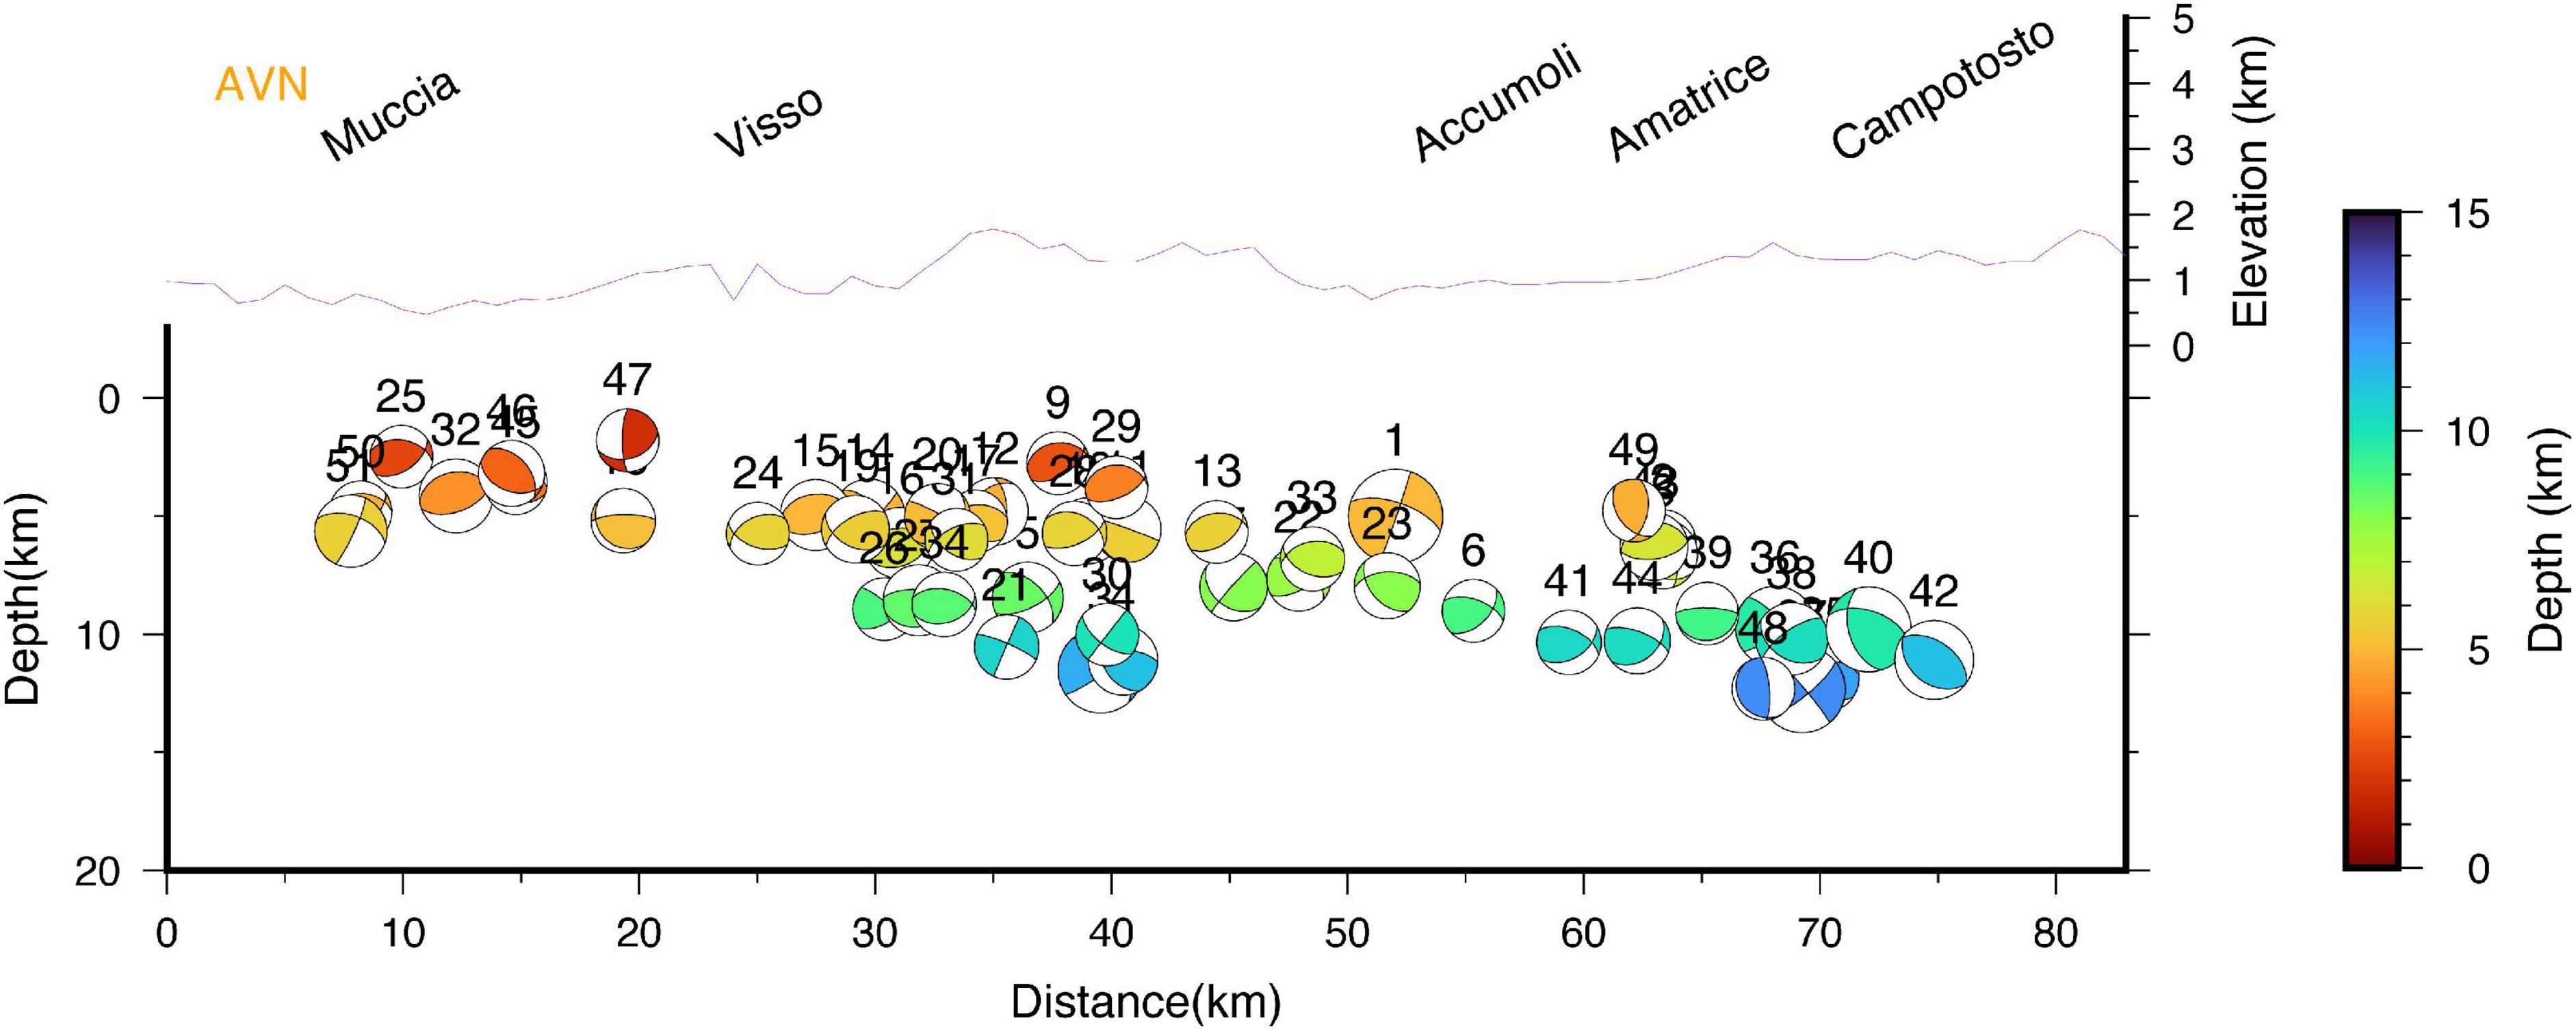
Figure 11. Seismic cross-section along the trace reported in Figure 10.
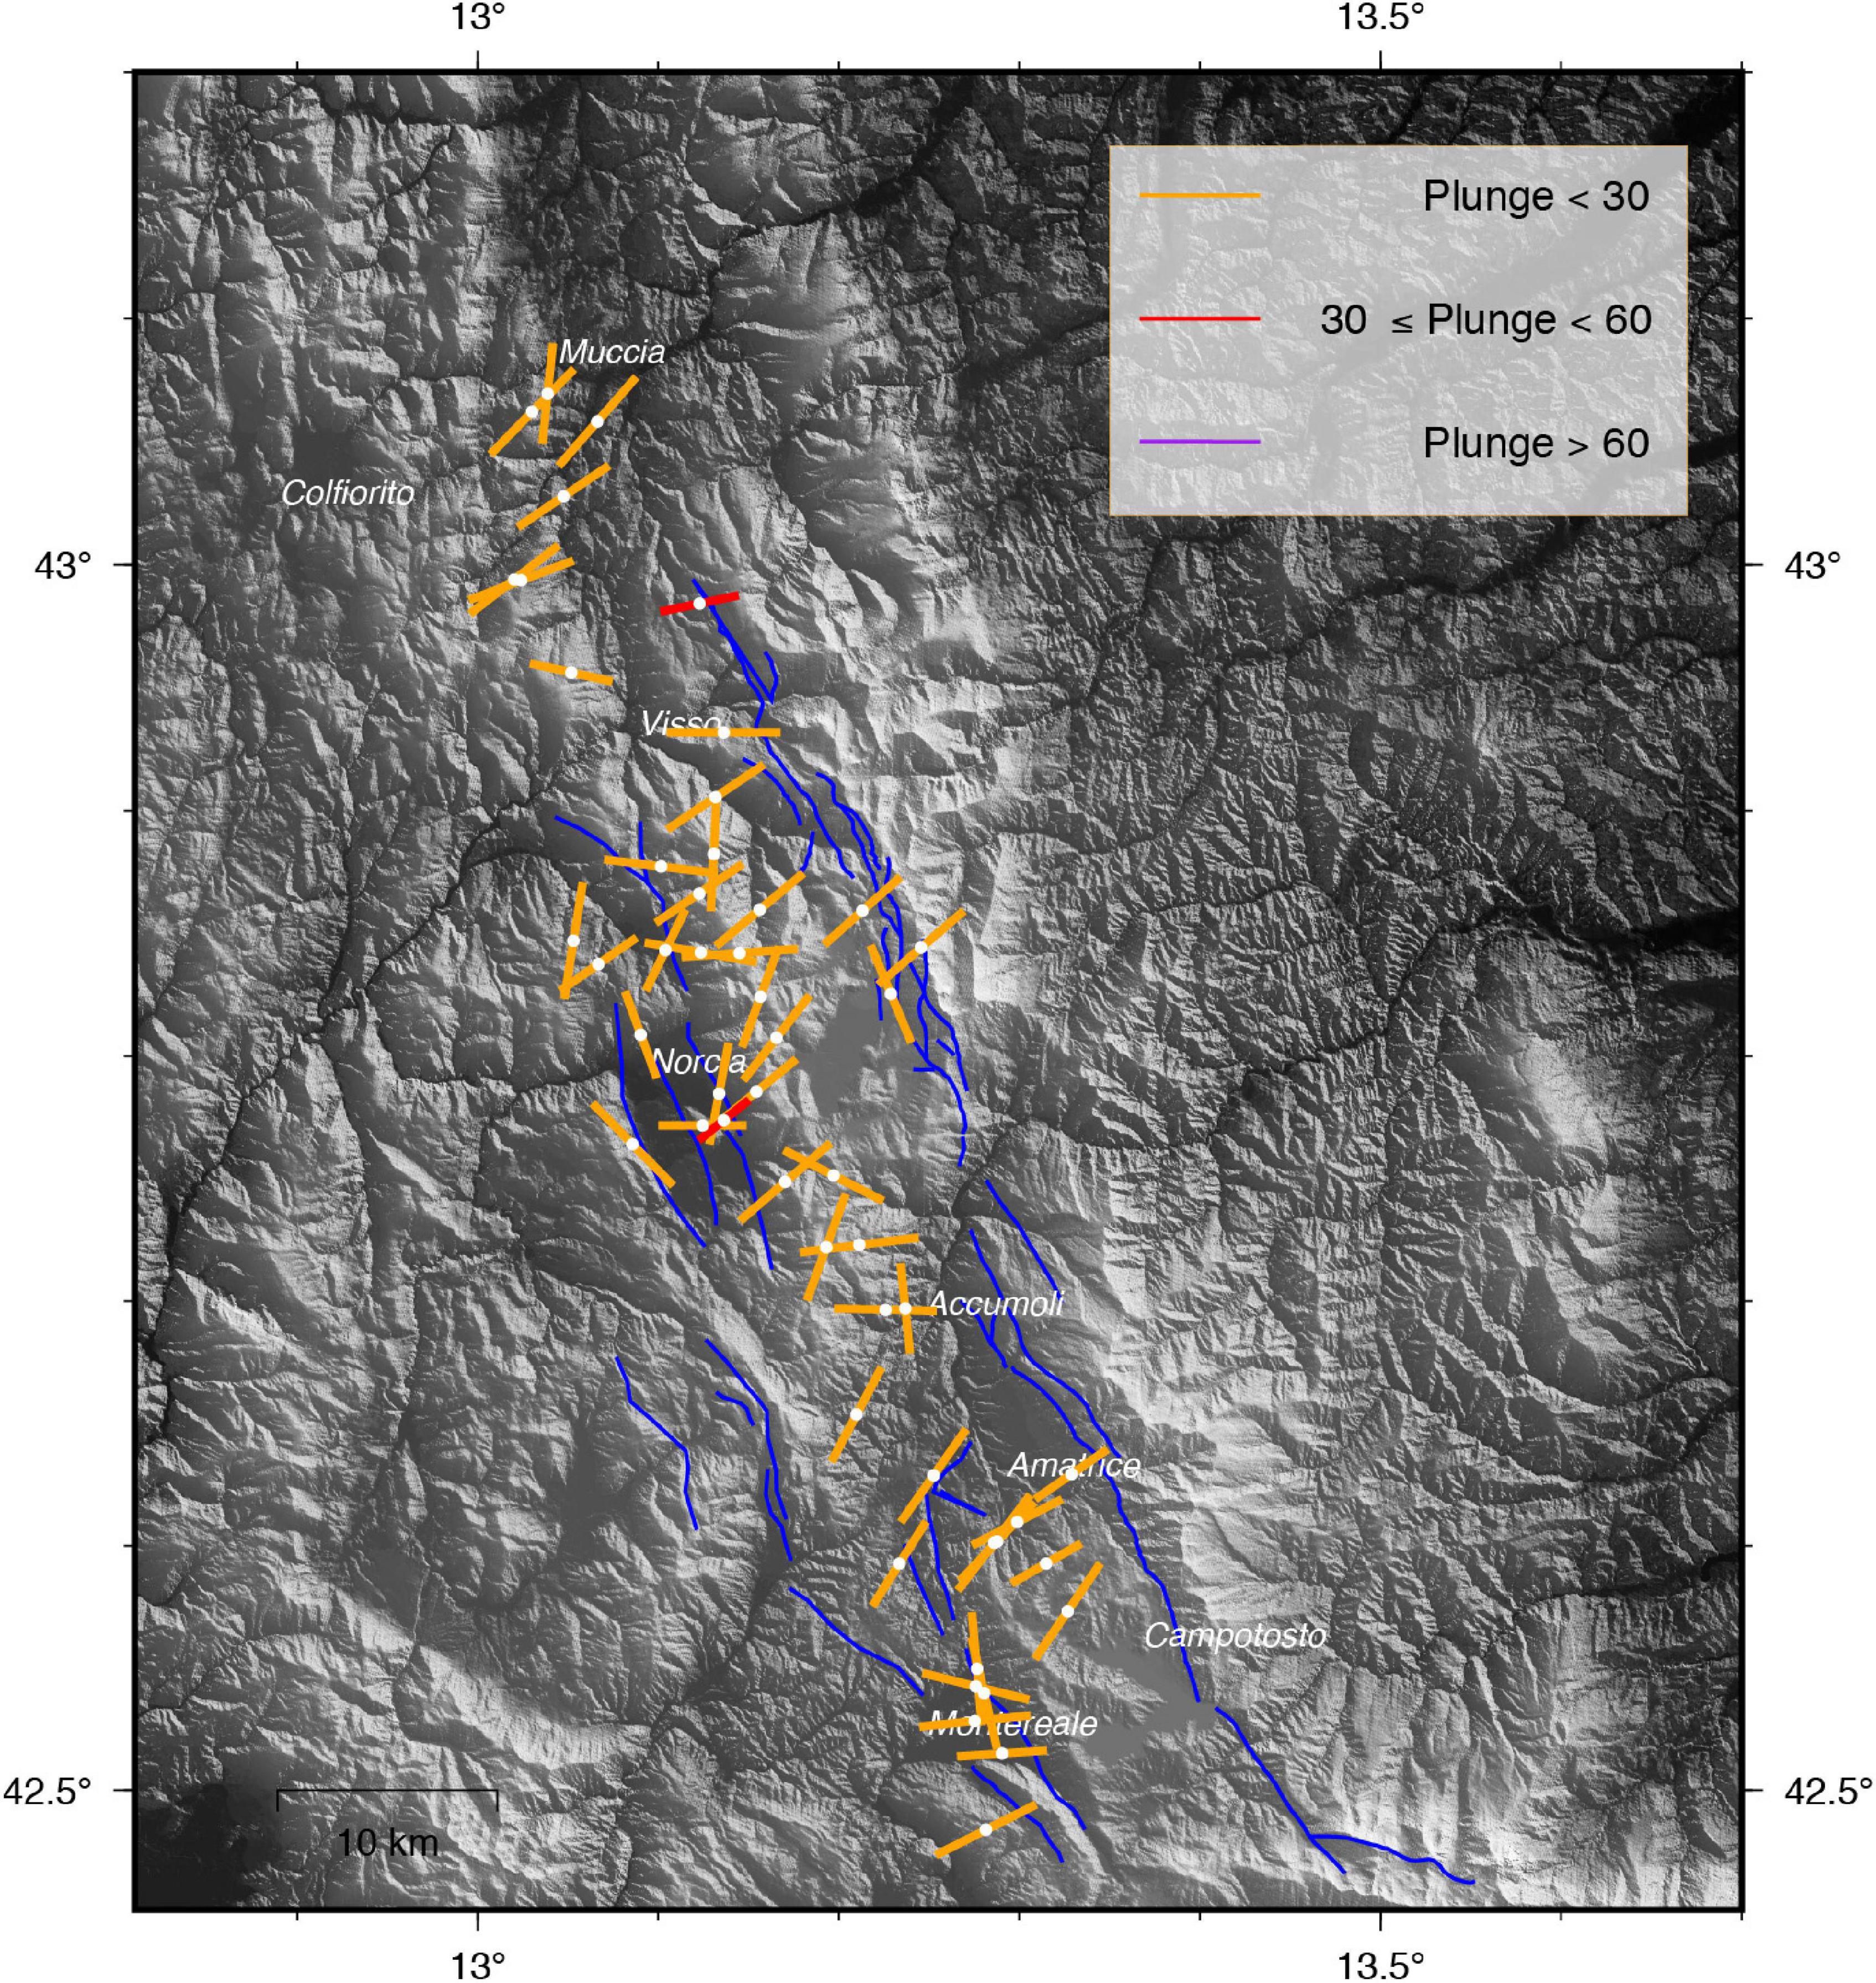
Figure 12. T-axes of focal mechanism solutions determined in the present study for the AVN area. The length of each bar is inversely proportional to the plunge of the axis; colors are related to the 3 groups of plunges reported in the inset; blue lines are the normal faults mapped in this area while red lines are surface ruptures of the AVN seismic sequence (Pucci et al., 2017; Civico et al., 2018; Villani et al., 2018).
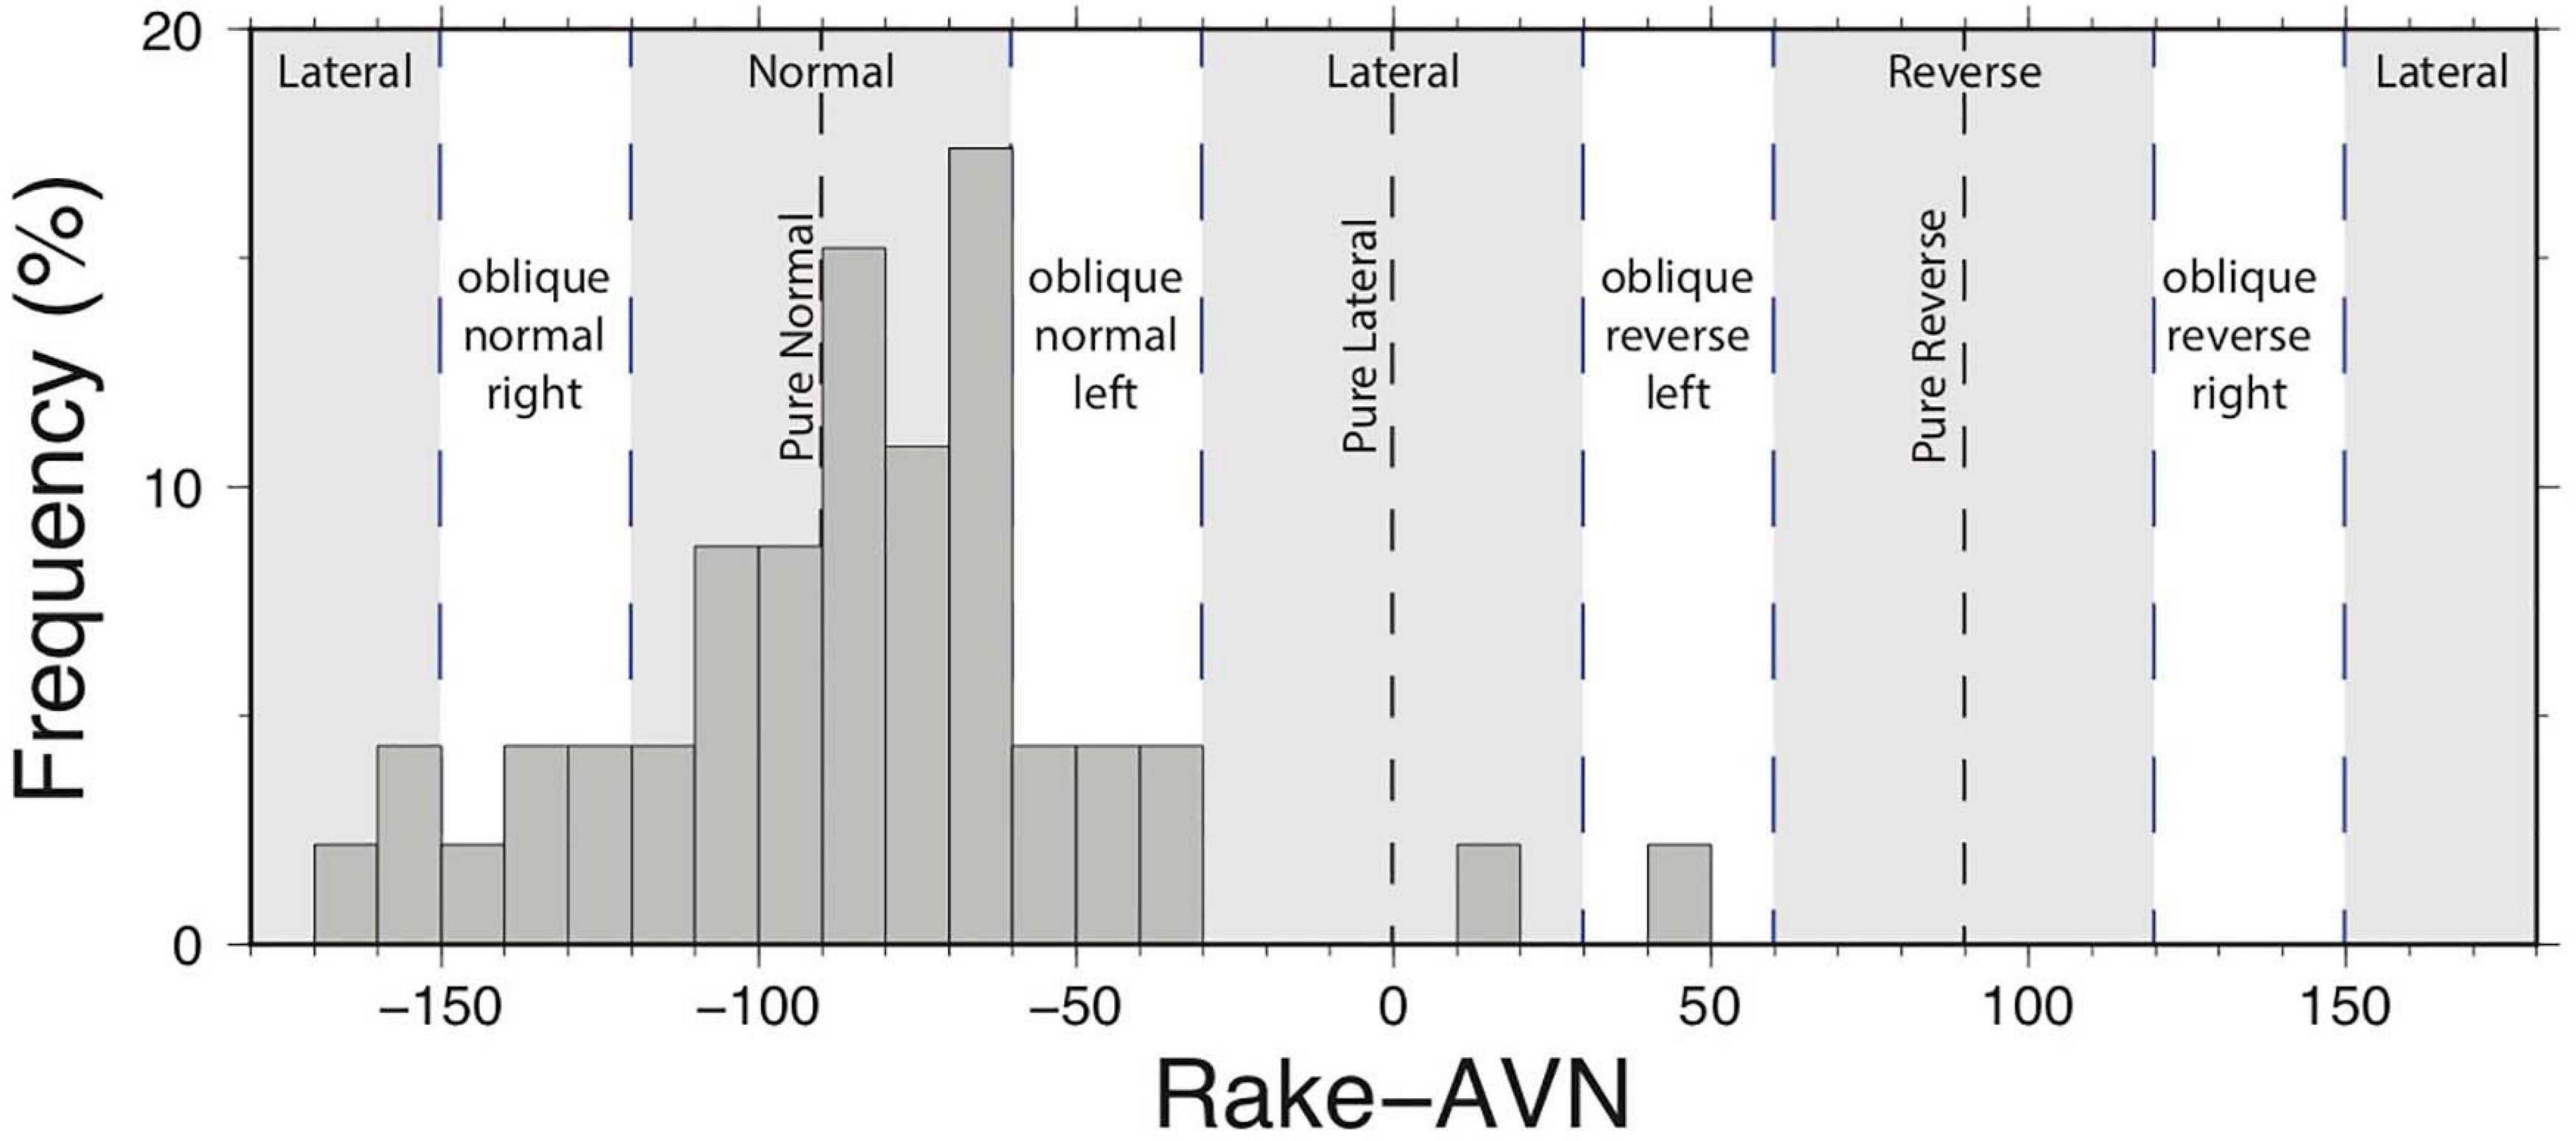
Figure 13. Histogram of the rake distribution of the calculated focal mechanisms for the AVN area.
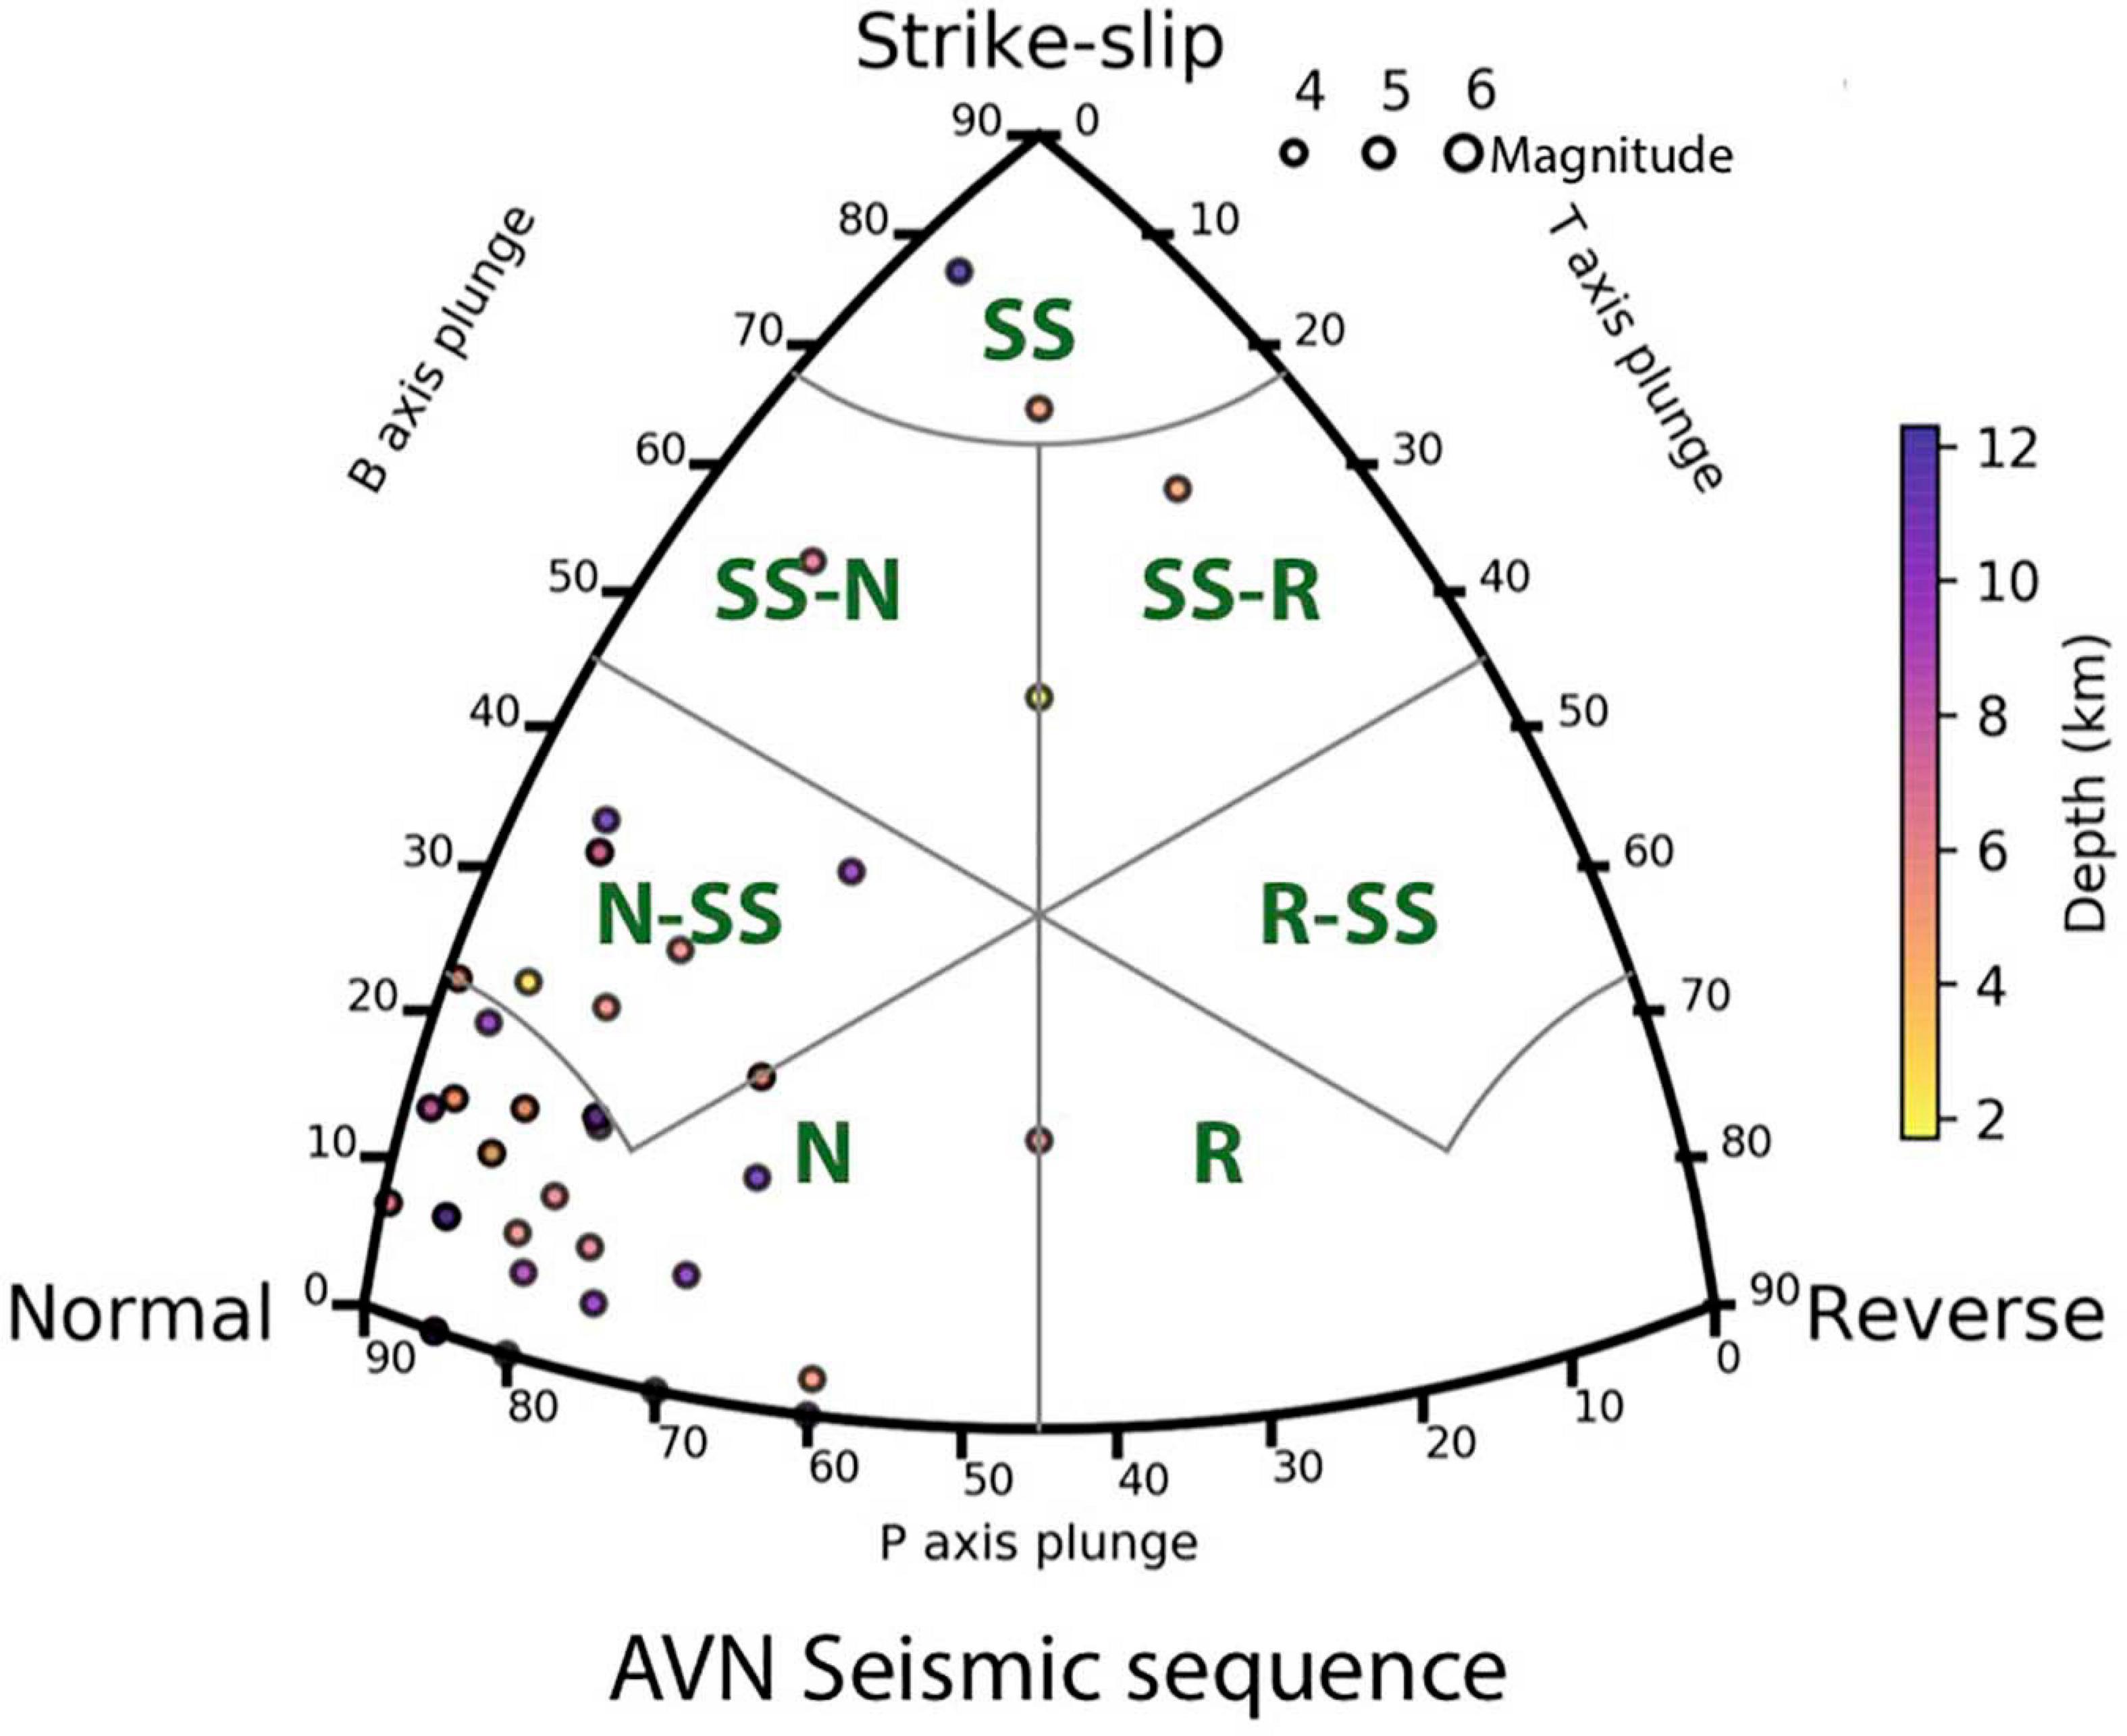
Figure 14. FMC diagram for the classification of focal mechanisms AVN area. N, normal; N-SS, normal–strike-slip; SS-N, strike-slip–normal; SS, strike-slip; SS-R, strike-slip–reverse; R-SS, reverse–strike-slip; R, reverse. The points are scaled by magnitude and colored by different depths.
The mean fault plane solution for AVN is a perfect normal faulting mechanism with horizontal NW–SE oriented σ2, vertical σ1 and horizontal NE–SW oriented σ3 (see inset in Figure 10). The latter confirms the extension trend in the central Apennines as shown by present-day stress indicators, not only focal mechanisms but also active fault and borehole breakout data (Mariucci and Montone, 2020a, b). Therefore, this tectonic regime seems to not change with depth: from surface (fault data), to intermediate depth (well data), to seismogenic depth.
The earthquake that started the sequence deserves particular attention: in fact, it is worth noting that the Mw 6.0 Amatrice first-motion focal solution has a strike different by 30° and 21° in the anticlockwise direction with respect to the TDMT and RCMT solutions, respectively, and a significant strike-slip component possibly suggesting that the rupture started as transtensive and then evolved in pure normal faulting. This result is in agreement with the modeling of the rupture process that reported on a bilateral rupture, justifying the observed directivity (Tinti et al., 2016), and a small left-lateral strike slip component (Cirella et al., 2018) for this event. In Figure 10, we show the good fit of P-wave first onset polarities with the focal mechanism resulting from the inversion. We read 177 polarity observations, and between them we found 2 discrepancies for 2 stations at 60 km and 126 km distances from the epicenter: dense coverage of the focal sphere and correct picked polarities yield the robust focal mechanism computation with an azimuthal gap = 71° and the STDR = 0.71. The largest aftershock that occurred 1 h later, Mw 5.4, shows analog features: a strike direction rotated 20° and 22° in the anticlockwise direction with respect to the TDMT and RCMT solutions, respectively, and a significant strike-slip component. Discrepancies between the centroid-moment tensor and first-motion solutions require detailed investigations prompting complicated multiple rupture (Anderson, 1988).
Regarding the Mw 5.4 and Mw 5.9 Visso earthquakes, and the Mw 6.5 Norcia earthquake, they are non-present in our catalog. The Mw 5.9 Visso earthquake and its strong foreshock, Mw 5.4, are double earthquakes, both preceded by M4.5 events at 4.0 and 1.5 km distance, respectively (Improta et al., 2019). This hinders the picking of first-motion P-wave polarities and, consequently, the determination of reliable focal solutions for both Visso earthquakes. Unlike the Visso earthquakes, focal solution of the Mw 6.5 Norcia earthquake has a large number of discrepancies and highly variable parameters: the fault-plane solution shows a normal fault but its orientation is poorly constrained (particularly the strike is not very well constrained ranging from 65 to 110°).
As potential sources of these discrepancies, both model uncertainties and possible faulting complexity could be considered. The good network geometry of the Italian National Seismic Network (Rete Sismica Nazionale, RSN), implemented by additional 24 stations that were temporarily deployed (Moretti and Sismiko Team, 2016), makes us hypothesize that the uncertainty in location is unlikely to be large enough to explain the full discrepancies, even if we cannot definitively exclude the possibility. Alternatively, it is possible that the velocity model cannot describe velocity heterogeneity coming possibly from physical explanations. Focal mechanisms in this study are constrained to double-couple sources and they cannot resolve any non–double-couple component. The strong complexity of this earthquake has been highlighted by several studies in the literature (Cheloni et al., 2017; Scognamiglio et al., 2018; Walters et al., 2018). To explain geodetic, seismological, and surface observations, many different rupture scenarios have been proposed and finite-fault inversions of the Norcia earthquake published so far rely on multi-segment rupture mechanisms. In Scognamiglio et al. (2018), the unusual non–double-couple component (compensated linear vector dipole) observed for the TDMT solution of the October 30 main shock3 is interpreted as an evidence for a non-planar fault geometry and complex slip behavior. This is in agreement with the multi-segment rupture model obtained by the finite-fault joint inversion of strong motion and geodetic data that are characterized by the cascade activation of NNW–SSE normal faults and of a NE–SW trending oblique fault. In this contest, the first polarities can be affected by this complex rupture process resulting in FPFIT, in this case, not a suitable method for calculating the focal mechanism.
During the AVN seismic sequence, in March and April 2018, two earthquakes with M ≥ 4.0 (Mw 4.0 occurred on April 4 and Mw 4.6 on April 10), 15 seismic events with 3.0 ≤ M < 4.0 and more than 3,000 small-magnitude earthquakes occurred very close to Muccia village, in the northern area of the seismic sequence.
In Figure 15, we show the focal mechanisms calculated in this work with first polarities compared with the available TDMT and RCMT solutions. Also in this area we find a good agreement between the first motion and the moment tensor solutions, while focal mechanisms of minor seismicity (M < 4.0) calculated with FPFIT confirm the tectonic style.
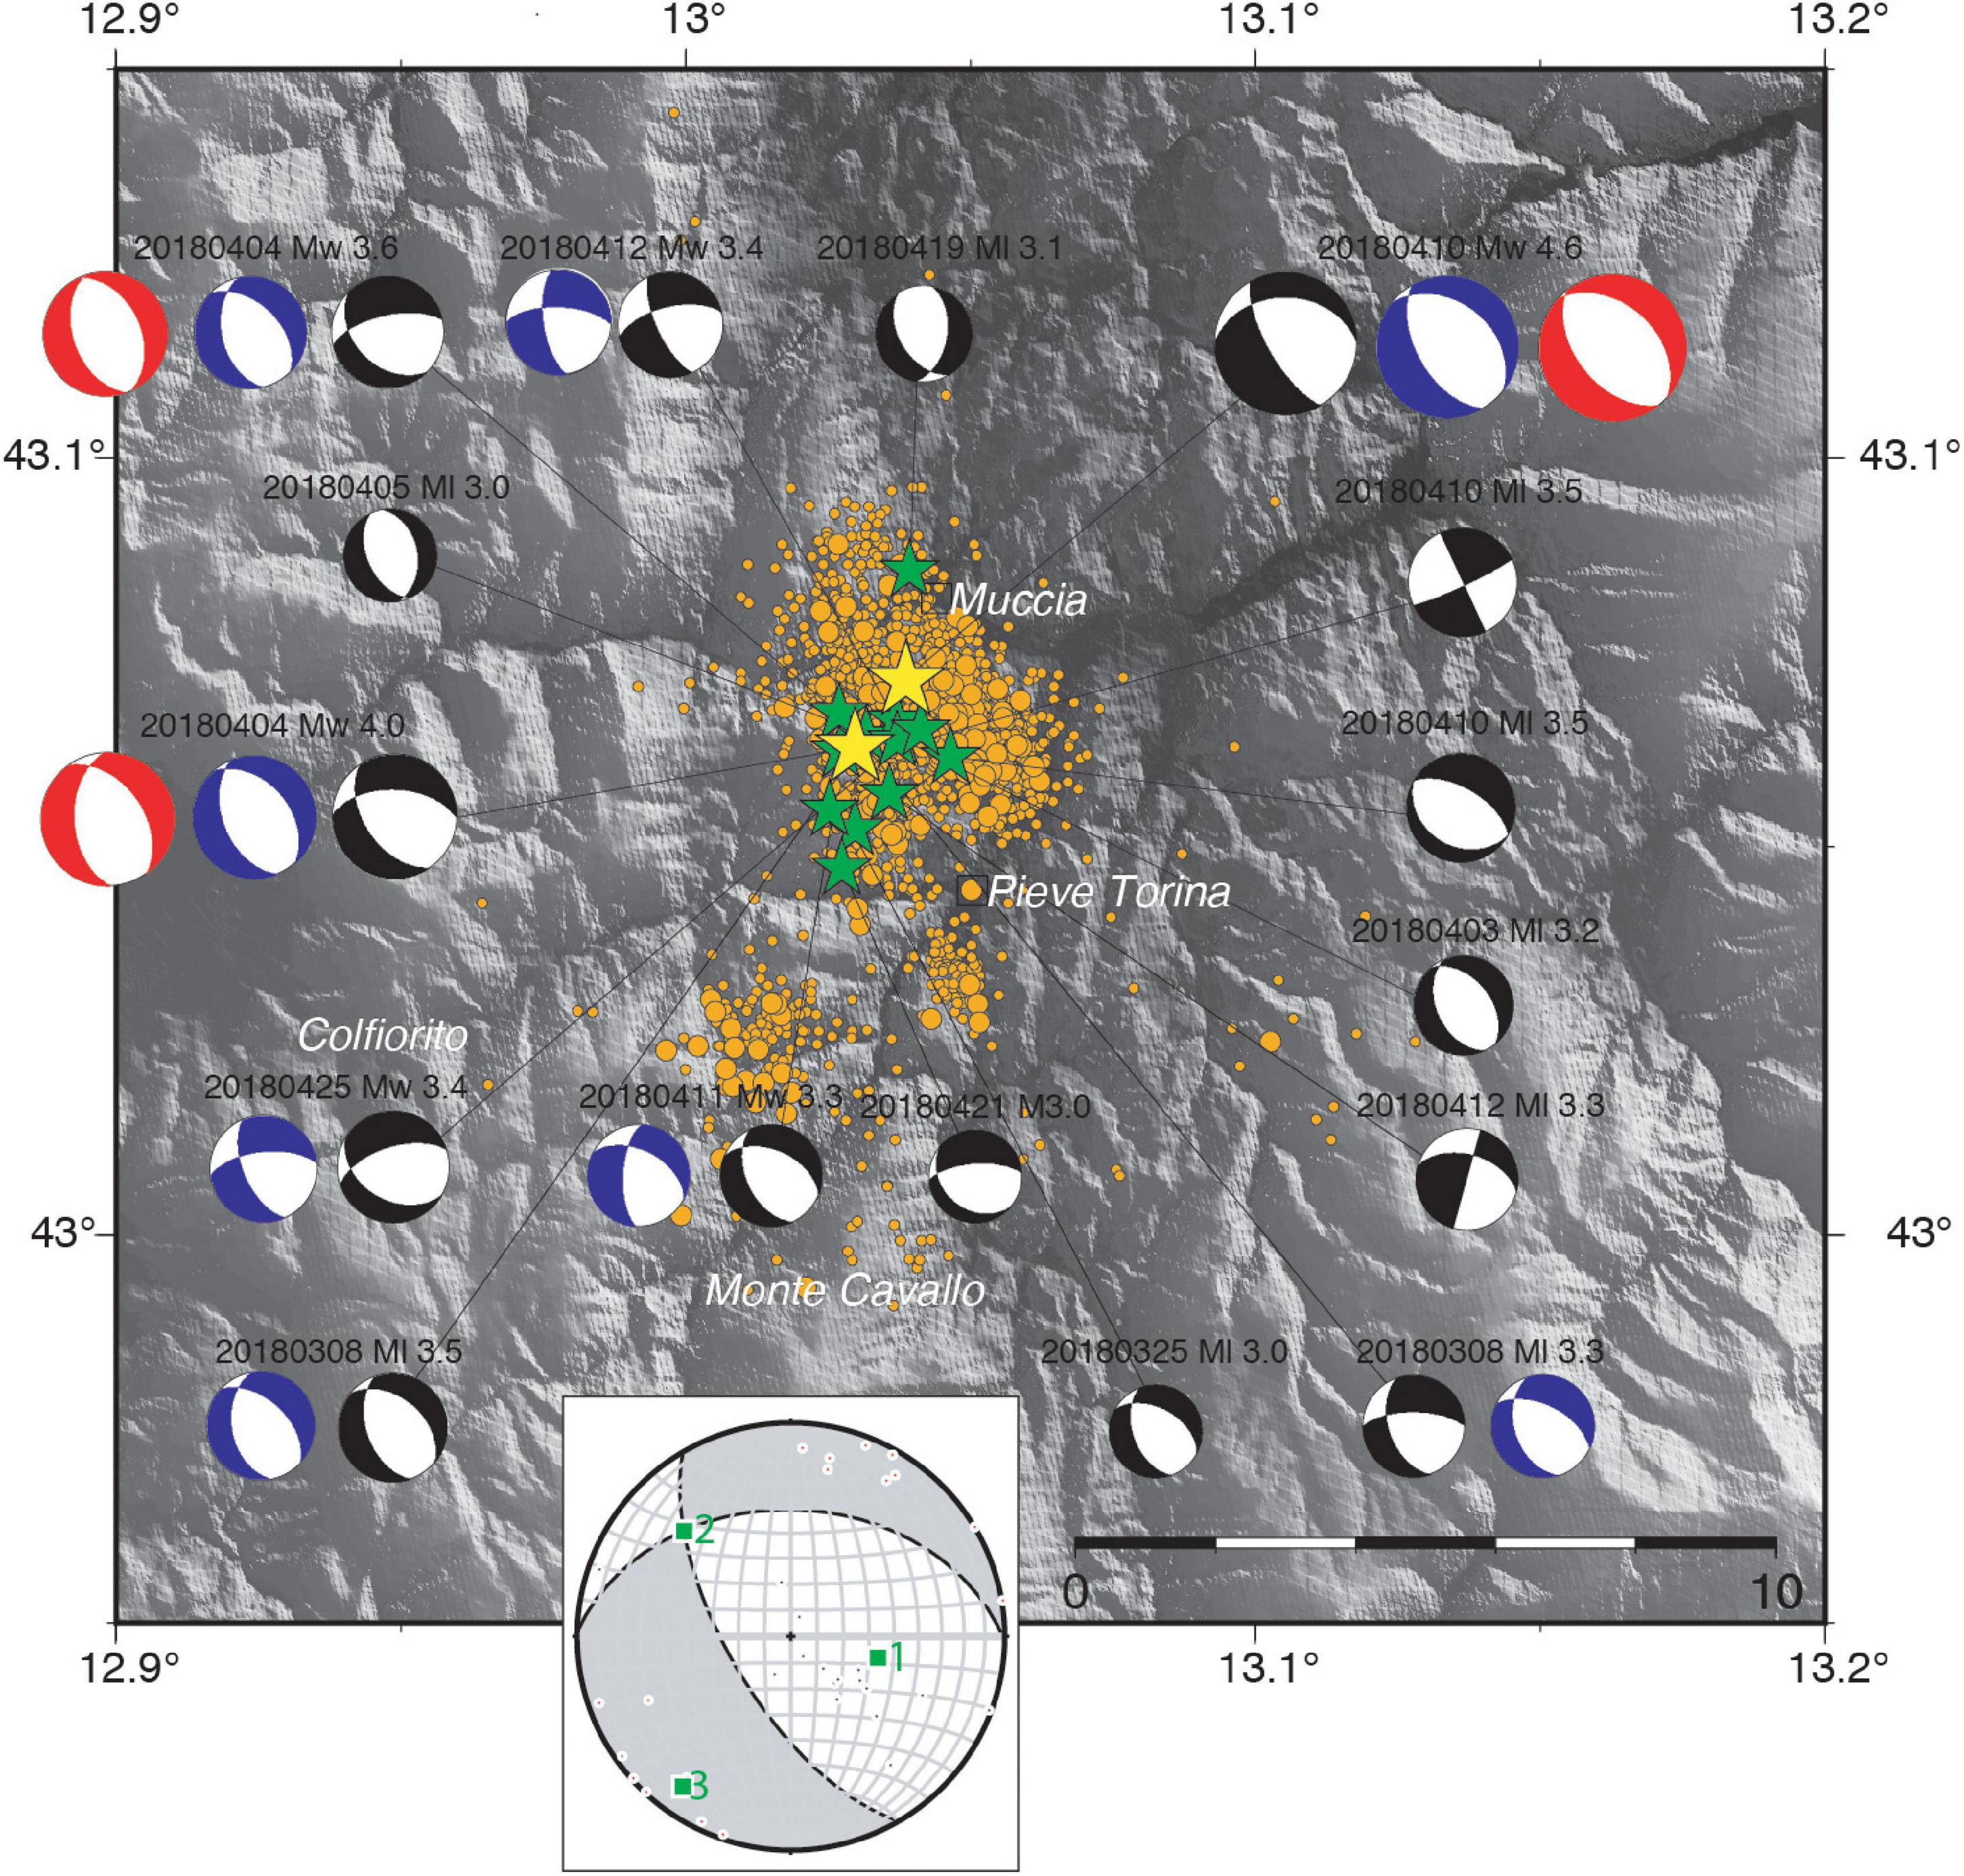
Figure 15. Muccia area. Yellow stars are the Mw ≥ 4.0 earthquakes, green stars the Mw ≥ 3.0 earthquakes. Small orange dots are M ≥ 1.0; medium orange dots are M ≥ 2.0 earthquakes. The average focal mechanism obtained by unweighted moment tensor (Kassaras and Kapetanidis, 2018) has been calculated considering M ≥ 3.0 events. Red focal mechanisms are from RCMT (rcmt2.bo.ingv.it/); blue focal mechanisms are from TDMT (cnt.rm.ingv.it/tdmt).
The focal mechanisms are dominated by normal faulting (NW–SE nodal plane, strike near 150° for the two strongest events) often with a strike-slip component. An example of a strong strike-slip component is the April 10 ML 3.5.
Concerning the Muccia area, the mean focal mechanism shows a normal faulting regime with a strike-slip component (Figure 15): although σ3 is almost horizontal and about NE–SW oriented, σ2 (NW–SE oriented) and σ1 are slightly dipping from the horizontal and vertical, respectively. The conjugate fault planes are SW and N dipping. The solution is in agreement with the main stress trend in the area and the strike component could be due to movements on minor faults as the earthquakes with magnitude < 4 are included in the computation.
The events analyzed are shallow, almost all having hypocenters in the first 5 km, with the exception of the normal strike-slip event, located beyond 10 km depth; variation in focal parameters and hypocentral depth may indicate the activation of secondary fault segments with respect to extensional structures on which the majority of events in the area took place. To validate this hypothesis, both the comparison with the hypocentral localizations and, above all, the calculation of the focal mechanisms of lower magnitude events will be necessary. In Michele et al. (2020), seismic sections crossing the tip of the AVN seismic sequence, where the fault’s system reaches the southern termination of the 1997 Colfiorito system (Chiaraluce et al., 2003), indicate a small, shallow (above 5 km depth) synthetic/antithetic fault system.
In this work, we present a catalog of overall 122 focal mechanism solutions that occurred in Italy between 2015 and 2019, 100 earthquakes with magnitude M ≥ 4.0 and additional 22 seismic events with 3.0 ≤ M < 4.0.
Since January 2015, BSI analysts quickly elaborated events with M ≥ 3.5, in the days immediately following their occurrence, and particular attention was paid to the analysis of the earthquakes with magnitude M ≥ 4.0.
Focal mechanisms reported and discussed in this study are determined from P-wave first motion polarities read on the waveforms recorded by the national permanent seismological network of INGV, Rete Sismica Nazionale (RSN). The network density and its nationwide distribution allowed us to achieve a good coverage and sampling of the entire focal sphere in almost all the analyzed areas.
Starting from the picking of the BSI’s analysts, we relocated the selected earthquakes by using a multi-parameter procedure (see Section “The Multi-parameter Location”) based on the Hypoellipse code.
During our research, we obtained several multiple solutions when multiple mechanisms fit the impulsive polarities equally well. Because the distribution of the polarities is strongly controlled by the theoretical take-off angle, it is possible that multiple solutions are due to the vertical error coming from the 1D Earth model and the subsequent calculated take-off angle. Here, we do not consider the multiple solutions but they will be the subject of further studies that will consider vertical/lateral heterogeneities using local velocity model to calculate again the focal solutions to eventually assign a quality factor or to discard definitively.
Even if our dataset, limited to 5 years and to earthquakes with M > 4.0, does not permit to detect more than the gross features of the regional stress of Italian area, it is possible to observe some important features.
The strike-slip regime, east-west faulting, which occurred in southern Italy, is well clear in the focus on the Montecilfone area, at the margin between the Apenninic thrust belt to the west, and the Adriatic plate to the east where strike-slip solutions are found. Strike-slip faulting also characterizes the Ionian Sea and Sicily channel.
In the western offshore of Calabria region, we find earthquakes with prevalent normal faulting solutions and prevalent depths ranging between 100 and 215 km. For the earthquakes analyzed in this study, the P-axes mostly plunge toward the NW (Figure 7), coinciding with the dip direction of the Tyrrhenian slab, a consistent direction of down-dip compression in agreement with previous studies (Isacks and Molnar, 1971; Anderson and Jackson, 1987; Frepoli et al., 1996).
In the AVN seismic sequence, TDMT and RCMT present dominant normal faulting solutions along NNW–SSE trending faults, with tension axes oriented roughly perpendicular to the strike of the Apennines. The focal mechanisms here show more heterogeneous solutions with normal faults, oblique slip faults and strike-slip faults, and 80% of tension axes oriented in the range 40–70°. This variability agrees with results of previous studies dealing with relocations of high-quality aftershock catalogs (Improta et al., 2019; Michele et al., 2020) that provide evidence of activation of an extremely complex fault system; this complex system could also include inherited Pliocene reverse faults oblique to the NW–SE trending extensional structures even if, in literature, the role of these pre-existing faults is debated. Particularly interesting is the focal mechanism calculated for the Mw 6.0 Amatrice earthquake: it shows a normal solution with a significant strike-slip component possibly suggesting that the rupture started as transtensive and then evolved in pure normal faulting as highlighted from the TDMT and RCMT extensional solutions. This result agrees with the modeling of the complex rupture process that reported on a bilateral rupture and a small left-lateral strike-slip component (Tinti et al., 2016; Cirella et al., 2018).
It is worth noting that when comparing high-quality solutions obtained with first-motion polarity techniques or from waveform inversion, the differences observed between the two focal mechanisms represent real differences in the source process. Future comparison studies with RCMT and TDMT will help us to understand how much and where they are similar and how much and where they are not and verify, in the latter case, if the non–double-couple component, a measure of the deviation of a moment tensor from a double-couple mechanism, is important in the calculation.
Methods based on waveform inversion (from high-quality data) provide a stable and reliable focal mechanism: in addition, the speed and efficiency of these automated methods is clear with respect to the extremely time-consuming approach of determining the mechanism by manual attributing polarities of first motions. However, these two different methods provide different, somehow complementary, information: indication of the general style of deformation occurring in an area as for the moment tensors, and detailed study of source mechanics as for the first-motion focal mechanisms, the latter also taking advantage of the information from lower magnitudes. This is a particularly important feature due to the large number of small-magnitude earthquakes compared with high-magnitude earthquakes. On average, 2 < M < 3 and smaller earthquakes occur several hundred times a day worldwide while very few M ≥ 5.0 earthquakes do occur per year: during 2019, no M ≥ 9 occurred; 1 M = 8 seismic event was recorded in Peru and 9 M ≥ 7.0 (data from U.S. Geological Survey earthquake.usgs.gov). In Italy, in the same year, the RSN recorded more than 180 M ≥ 3.0 earthquakes, 11 seismic events with M ≥ 4 and no M ≥ 5.
Our two focuses, Muccia and Montecilfone area, demonstrate how the analysis of focal mechanisms with the first polarities, even for earthquakes with a M < 4.0, provides further knowledge of the tectonic regime of the areas of interest. For the Montecilfone zone, our focal solutions for M < 4.0 aftershocks testify that the strike-slip dextral faulting observed for the moderate-large events is also present at small scale suggesting almost regular fault plane geometries. By combining the hypocenter distribution focal mechanisms of all events, and the structural map of the Apulia Platform here analyzed, we conclude that the 2018 events activated the mid-lower crustal section of an unknown, strike-slip structure, trending E–W and characterized by right-lateral kinematic. This structure may represent the westernmost prolongation of a complex shear zone of the Apulia Plate that includes onshore the Apricena Fault and the Mattinata Fault system both active and sources of M6 + historical earthquakes (Patacca and Scandone, 2004; Di Bucci et al., 2010). In this view, the Montecilfone seismicity and causative fault bears a remarkable resemblance to the Molise 2002 sequence that was related to an E–W trending, dextral strike-slip system representing the western prolongation of the Mattinata Fault–Chieuti High shear zone (Latorre et al., 2010). Our interpretation reinforces previous seismotectonic models that emphasize the seismogenic potential and the role of Mesozoic–Tertiary W–E trending lithospheric shear zones dissecting the flexed Apulia plate underneath the Apennines thrust belt in accommodating intraplate deformation in response to Africa–Eurasia plate convergence (Fracassi et al., 2004; Di Luccio et al., 2005b; Di Bucci et al., 2010).
The choice to deepen the study of earthquakes with small-to-medium magnitude fits well with the rising interest in recent years of the earthquake engineering community in this topic also due to the presence of upper-crustal events, in the range Mw 4.0–5.5, that occur sufficiently close to inhabited areas worldwide that actually cause damage and/or casualties (Nievas et al., 2020).
With this work, we want to underline the importance, for both the seismotectonic characterization of a wide area and a greater comprehension of the faulting mechanism during a complex seismic sequence, of assigning polarity to the P-phase onsets to routinely estimate the focal mechanisms in addition to the hypocentral parameters and to the moment tensor solution estimation for a wide range of magnitudes from M ≥ 4.0 to M ≤ 3.0.
Our next steps are to extend the dataset in time before 2015. Moreover, we believe that it would be of great importance producing an unprecedented dataset of first-motion polarities’ focal mechanisms by developing an on purpose automatic procedure of analysis taking advantage of such a large dataset of accurate manually revised polarities to educate the polarity detection algorithm.
Barbara Castello YmFyYmFyYS5jYXN0ZWxsb0Bpbmd2Lml0; Diana Latorre ZGlhbmEubGF0b3JyZUBpbmd2Lml0; Lucia Margheriti bHVjaWEubWFyZ2hlcml0aUBpbmd2Lml0; Paola Baccheschi cGFvbGEuYmFjY2hlc2NoaUBpbmd2Lml0; Arianna Lisi YXJpYW5uYS5saXNpQGluZ3YuaXQ=; Alessandro Marchetti YWxlc3NhbmRyby5tYXJjaGV0dGlAaW5ndi5pdA==; Anna Nardi YW5uYS5uYXJkaUBpbmd2Lml0; Anna Maria Lombardi YW5uYW1hcmlhLmxvbWJhcmRpQGluZ3YuaXQ=; Milena Moretti bWlsZW5hLm1vcmV0dGlAaW5ndi5pdA==; Cinzia Melorio Y2luemlhLm1lbG9yaW9AaW5ndi5pdA==; Corrado Castellano Y29ycmFkby5jYXN0ZWxsYW5vQGluZ3YuaXQ=; Patrizia Battelli cGF0cml6aWEuYmF0dGVsbGlAaW5ndi5pdA==; Alberto Frepoli YWxiZXJ0by5mcmVwb2xpQGluZ3YuaXQ=; Alessandra Sciarra YWxlc3NhbmRyYS5zY2lhcnJhQGluZ3YuaXQ=; Alessandra Smedile YWxlc3NhbmRyYS5zbWVkaWxlQGluZ3YuaXQ=; Alexia Battelli YWxleGlhLmJhdHRlbGxpQGluZ3YuaXQ=; Antonio Rossi YW50b25pby5yb3NzaUBpbmd2Lml0; Barbara Cantucci YmFyYmFyYS5jYW50dWNjaUBpbmd2Lml0; Caterina Montuori Y2F0ZXJpbmEubW9udHVvcmlAaW5ndi5pdA==; Corrado Thermes Y29ycmFkby50aGVybWVzQCBpbmd2Lml0; Daniele Cheloni ZGFuaWVsZS5jaGVsb25pQGluZ3YuaXQ=; Francesco Mariano Mele ZnJhbmNvLm1lbGVAaW5ndi5pdA==; Giorgio Modica Z2lvcmdpby5tb2RpY2FAaW5ndi5pdA==; Laura Colini bGF1cmEuY29saW5pQGluZ3YuaXQ=; Laura Scognamiglio bGF1cmEuc2NvZ25hbWlnbGlvQGluZ3YuaXQ=; Luca Arcoraci bHVjYS5hcmNvcmFjaUBpbmd2Lml0; Luca Miconi bHVjYS5taWNvbmlAaW5ndi5pdA==; Luca Pizzino bHVjYS5waXp6aW5vQGluZ3YuaXQ=; Marina Pastori bWFyaW5hLnBhc3RvcmlAIGluZ3YuaXQ=; Michele Berardi bWljaGVsZS5iZXJhcmRpQGluZ3YuaXQ=; Nicola Mauro Pagliuca bmljb2xhLnBhZ2xpdWNhQGluZ3YuaXQ=; Roberta Tozzi cm9iZXJ0YS50b3p6aUBpbmd2Lml0; Roberto Tardini cm9iZXJ0by50YXJkaW5pQGluZ3YuaXQ=; Rosalba Di Maro cm9zYWxiYS5kaW1hcm9AaW5ndi5pdA==; Sabina Spadoni c2FiaW5hLnNwYWRvbmlAaW5ndi5pdA==; Stefania Pinzi c3RlZmFuaWEucGluemlAaW5ndi5pdA==; Stefano Pintore c3RlZmFuby5waW50b3JlQGluZ3YuaXQ=; Stephen Monna c3RlcGhlbi5tb25uYUBpbmd2Lml0; Tiziana Sgroi dGl6aWFuYS5zZ3JvaUBpbmd2Lml0.
The original contributions presented in the study are included in the article/Supplementary Material, further inquiries can be directed to the corresponding author/s.
MC conceived the manuscript, computed the multi-parametric locations, produced, and analyzed the focal mechanisms. RD designed and setup the multi-parametric location method and analyzed the focal mechanisms. LI provided the geological interpretation and wrote the section dealing with the Montecilfone earthquakes. MM contributed to analyze the results and revised the manuscript. BSI Working Group revised earthquakes detected by the automatic acquisition system. All authors contributed to the article and approved the submitted version.
The authors declare that the research was conducted in the absence of any commercial or financial relationships that could be construed as a potential conflict of interest.
We would like to thank JÁ-G and KL, for the very helpful comments and suggestions which have greatly improved the manuscript. We also appreciate discussions with Umberto Fracassi and Carlo Alberto Brunori. Figures are generated with The Generic Mapping Tools, Wessel and Smith (1991).
The Supplementary Material for this article can be found online at: https://www.frontiersin.org/articles/10.3389/feart.2021.630116/full#supplementary-material
Álvarez-Gómez, J. A. (2019). FMC—Earthquake focal mechanisms data management, cluster and classification. SoftwareX 9, 299–307. doi: 10.1016/j.softx.2019.03.008
Anderson, H. (1988). Comparison of centroid-moment tensor and first motion solutions for western Mediterranean earthquakes. Phys. Earth Planet. Inter. 52, 1–7. doi: 10.1016/0031-9201(88)90052-0
Anderson, H., and Jackson, J. (1987). The deep seismicity of the Tyrrhenian Sea. Geophys. J. R. astr. Soc. 91, 613–637. doi: 10.1111/j.1365-246x.1987.tb01661.x
Battelli, P., Arcoraci, L., Berardi, M., Castellano, C., Marchetti, A., Mele, F., et al. (2013). Bollettino sismico italiano 2010. Quaderni di Geofisica 115, 1–52.
Butler, R. W. H., Mazzoli, S., Corrado, S., De Donatis, M., Di Bucci, D., Gambini, R., et al. (2004). “Applying thick-skinned tectonic models to the Apennine thrust belt of Italy — Limitations and implications,” in Thrust Tectonics and Hydrocarbon Systems, Vol. 82, ed. K. R. McClay (Tulsa, OK: AAPG), 647–667. doi: 10.1306/m82813c34
Cheloni, D., De Novellis, V., Albano, M., Antonioli, A., Anzidei, M., Atzori, S., et al. (2017). Geodetic model of the 2016 Central Italy earthquake sequence inferred from InSAR and GPS data. Geophys. Res. Lett. 44, 6778–6787. doi: 10.1002/2017GL073580
Chiarabba, C., De Gori, P., Chiaraluce, L., Bordoni, P., Cattaneo, M., De Martin, M., et al. (2005a). Main shocks and aftershocks of the 2002 Molise seismic sequence, southern Italy. J. Seismol. 9, 487–494. doi: 10.1007/s10950-005-0633-9
Chiarabba, C., Jovane, L., and Di Stefano, R. (2005b). A new view of Italian seismicity using 20 years of instrumental recordings. Tectonophysics 395, 251–268. doi: 10.1016/j.tecto.2004.09.013
Chiaraluce, L., Di Stefano, R., Tinti, E., Scognamiglio, L., Michele, M., Casarotti, E., et al. (2017). The 2016 central Italy seismic sequence: a first look at the mainshocks, aftershocks, and source models. Seismol. Res. Lett. 88, 757–771. doi: 10.1785/0220160221
Chiaraluce, L., Ellsworth, W. L., Chiarabba, C., and Cocco, M. (2003). Imaging the complexity of an active normal fault system: the 1997 Colfiorito (central Italy) case study. J. Geophys. Res. 108:2294. doi: 10.1029/2002JB002166
Cirella, A., Pezzo, G., and Piatanesi, A. (2018). Rupture kinematics and structural-rheological control of the 2016 Mw6.1 Amatrice (central Italy) earthquake from joint inversion of seismic and geodetic data. Geophys. Res. Lett. 45, 302–312. doi: 10.1029/2018GL080894
Civico, R., Pucci, S., Villani, F., Pizzimenti, L., De Martini, P. M., Nappi, R., et al. (2018). Surface ruptures following the 30 October 2016 Mw 6.5 Norcia earthquake, central Italy. J. Maps 14, 151–160. doi: 10.1080/17445647.2018.1441756
Di Bucci, D., Burrato, P., Vannoli, P., and Valensise, G. (2010). Tectonic evidence for the ongoing Africa-Eurasia convergence in central Mediterranean foreland areas: a journey among long-lived shear zones, large earthquakes, and elusive fault motions. J. Geophys. Res. 115:B12404. doi: 10.1029/2009JB006480
Di Luccio, F., Fukuyama, E., and Pino, N. A. (2005a). The 2002 Molise earthquake sequence: what can we learn about the tectonics of southern Italy? Tectonophysics 405, 141–154. doi: 10.1016/j.tecto.2005.05.024
Di Luccio, F., Piscini, A., Pino, N. A., and Ventura, G. (2005b). Reactivation of deep faults beneath southern Apennines: evidence from the 1990–1991 Potenza seismic sequences. Terra Nova 17, 586–590. doi: 10.1111/j.1365-3121.2005.00653.x
DISS Working Group (2018). Database of Individual Seismogenic Sources (DISS), Version 3.2.1: A Compilation of Potential Sources for Earthquakes Larger than M 5.5 in Italy and Surrounding Areas. Italy: Istituto Nazionale di Geofisica e Vulcanologia.
Fracassi, U., Burrato, P., Basili, R., Bencini, R., Di Bucci, D., and Valensise, G. (2004). “Shallow NE-SW extension and deep E-W right-lateral slip: coexisting seismogenic mechanisms as an expression of southern Italy geodynamics,” in Proceedings of the Gruppo Nazionale Geofisica Terra Solida Symposium, 23rd, Rome, December 2004 (Rome: Consiglio Nazionale delle Ricerche), 200–202.
Frepoli, A., Selvaggi, G., Chiarabba, C., and Amato, A. (1996). State of stress in the Southern Tyrrhenian subduction zone from fault-plane solutions. Geophys. J. Int. 125, 879–891. doi: 10.1111/j.1365-246x.1996.tb06031.x
Improta, L., Latorre, D., Margheriti, L., Nardi, A., Marchetti, A., Lombardi, A. M., et al. (2019). Multi-segment rupture of the 2016 Amatrice-Visso-Norcia seismic sequence (central Italy) constrained by the first high-quality catalog of early Aftershocks. Sci. Rep. 9:6921. doi: 10.1038/s41598-019-43393-2
INGV Seismological and Data Centre (2006). Rete Sismica Nazionale (RSN). Italy: Istituto Nazionale di Geofisica e Vulcanologia (INGV).
Isacks, B., and Molnar, P. (1971). Distribution of stresses in the descending lithosphere from a global survey of focal mechanism solutions of mantle earthquakes. Rev. Geo. Space Phys. 9, 103–174. doi: 10.1029/rg009i001p00103
ISIDe Working Group (2007). Italian Seismological Instrumental and Parametric Database (ISIDe). Italy: Istituto Nazionale di Geofisica e Vulcanologia (INGV).
Kagan, Y. Y. (2005). Double-couple earthquake focal mechanism: random rotation and display. Geophys. J. Int. 163, 1065–1072. doi: 10.1111/j.1365-246x.2005.02781.x
Kassaras, I. G., and Kapetanidis, V. (2018). “Resolving the tectonic stress by the inversion of earthquake focal mechanisms. application in the region of greece. a tutorial,” in Moment Tensor Solutions, ed. S. D’Amico (Cham: Springer).
Kaverina, A. N., Lander, A. V., and Prozorov, A. G. (1996). Global creepex distribution and its relation to earthquake-source geometry and tectonic origin. Geophys. J. Int. 125, 249–265. doi: 10.1111/j.1365-246x.1996.tb06549.x
Lahr, J. C. (1999). HYPOELLIPSE: A Computer Program for Determining Local Earthquake Hypocentral Parameters, Magnitude, and first-Motion Pattern. U.S. Geological Survey Open-File Report 99–23, version 1.1. Reston, VA: USGS, 119.
Latorre, D., Amato, A., and Chiarabba, C. (2010). High-resolution seismic imaging of the Mw5.7, 2002 Molise, southern Italy, earthquake area: evidence of deep fault reactivation. Tectonics 29:TC4014. doi: 10.1029/2009TC002595
Marchetti, A., Ciaccio, M. G., Nardi, A., Bono, A., Mele, F. M., Margheriti, L., et al. (2016). The Italian Seismic Bulletin: strategies, revised pickings and locations of the central Italy seismic sequence. Ann. Geophysics 59, 1–7.
Margheriti, L., Latorre, D., Baccheschi, P., Castello, B., Lisi, A., Nardi, A., et al. (2019). High Quality Comprehensive Earthquake Catalog of the Amatrice-Visso-Norcia Seismic Sequence (Central Italy, Italian Seismic Bulletin 2016-2018). San Francisco, CA: AGU Fall Meeting.
Mariucci, M. T., and Montone, P. (2020a). Database of Italian present-day stress indicators, IPSI 1.4. Sci. Data 7:298. doi: 10.1038/s41597-020-00640-w
Mariucci, M. T., and Montone, P. (2020b). IPSI 1.4, Database of Italian Present-day Stress Indicators, Istituto Nazionale di Geofisica e Vulcanologia (INGV). Italy: INGV.
Mazzoli, S., Ascione, A., Candela, S., Iannace, A., Megna, A., Santini, S., et al. (2013). Subduction and continental collision events in the southern Apennines: constraints from two crustal cross-sections. Rend. Online Soc. Geol. Ital. 25, 78–84. doi: 10.3301/ROL.2013.07
Menardi Noguera, A., and Rea, G. (2000). Deep structure of the Campania-Lucanian arc (southern Apennine, Italy). Tectonophysics 324, 239–265. doi: 10.1016/s0040-1951(00)00137-2
Michele, M., Chiaraluce, L., Di Stefano, R., and Waldhauser, F. (2020). Fine-scale structure of the 2016–2017 Central Italy seismic sequence from data recorded at the Italian National Network. J. Geophys. Res. Solid Earth 125:e2019JB018440. doi: 10.1029/2019JB018440
Michele, M., Di Stefano, R., Chiaraluce, L., Cattaneo, M., De Gori, P., Monachesi, G., et al. (2016). The Amatrice 2016 seismic sequence: a preliminary look at the mainshock and aftershocks distribution. Ann. Geophys. 59, 1–8.
Moretti, M., and Sismiko Team (2016). Sismiko: emergency network deployment and data sharing for the 2016 Amatrice seismic sequence. Ann. Geophys. 59:5. doi: 10.4401/ag-7212
Nicolai, C., and Gambini, R. (2007). “Structural architecture of the Adria platform-and-basin system,” in Results of the CROP Project, Sub-Project CROP-04 Southern Apennines (Italy), Vol. 7, eds A. Mazzotti, E. Patacca, and P. Scandone (Rome: Bollettino della Società Geologica Italiana), 21–37.
Nievas, C. I., Bommer, J., Crowley, H., and van Elk, J. (2020). Global occurrence and impact of small-to-medium magnitude earthquakes: a statistical analysis. Bull. Earthquake Eng. 18, 1–35. doi: 10.1007/s10518-019-00718-w
Patacca, E., and Scandone, P. (2004). The 1627 Gargano earthquake (southern Italy): identification and characterization of the causative fault. J. Seismol. 8, 259–273. doi: 10.1023/B:JOSE.0000021393.77543.1e
Presti, D., Billi, A., Orecchio, B., Totaro, C., Faccenna, C., and Neri, G. (2013). Earthquake focal mechanisms, seismogenic stress, and seismotectonics of the Calabrian Arc, Italy. Tectonophysics 602, 153–175. doi: 10.1016/j.tecto.2013.01.030
Pucci, S., De Martini, P. M., Civico, R., Villani, F., Nappi, R., Ricci, T., et al. (2017). Coseismic ruptures of the August 24, 2016, Mw 6.0 Amatrice earthquake (central Italy). Geophys. Res. Lett. 44, 2138–2147. doi: 10.1002/2016gl071859
Reasenberg, P. A., and Oppenheimer, D. (1985). FPFIT, FPPLOT and FPPAGE: FORTRAN Computer Programs for Calculating and Displaying Earthquake Fault-Plane Solutions. US Geological Survey Open-File Report 85-739. Italy: USGS, 109.
Scognamiglio, L., Tinti, E., Casarotti, E., Pucci, S., Villani, F., Cocco, M., et al. (2018). Complex fault geometry and rupture dynamics of the Mw 6.5, 30 October 2016, Central Italy Earthquake. JGR 123, 2943–2964. doi: 10.1002/2018JB015603
Scognamiglio, L., Tinti, E., and Michelini, A. (2009). Real-Time determination of seismic moment tensor for the Italian region. Bull. Seismol. Soc. Am. 99, 2223–2242. doi: 10.1785/0120080104
Selvaggi, G., and Chiarabba, C. (1995). Seismicity and P-wave velocity image of the southern Tyrrhenian subduction zone. Geophys. J. Int. 121, 818–826. doi: 10.1111/j.1365-246x.1995.tb06441.x
Tinti, E., Scognamiglio, L., Michelini, A., and Cocco, M. (2016). Slip heterogeneity and directivity of the ML 6.0, 2016, amatrice earth- quake estimated with rapid finite-fault inversion. Geophys. Res. Lett. 43, 745–710. doi: 10.1002/2016GL071263
Trionfera, B., Frepoli, A., De Luca, G., De Gori, P., and Doglioni, C. (2020). The 2013–2018 matese and beneventano seismic sequences (Central–Southern Apennines): new constraints on the hypocentral depth determination. Geosciences 10:17. doi: 10.3390/geosciences10010017
Valensise, G., Pantosti, D., and Basili, R. (2004). Seismology and tectonic setting of the 2002 molise. Italy, Earthquake. Earthquake Spectra. 20(Suppl. 1), 23–37. doi: 10.1193/1.1756136
Varriale, F. (2011). Metodi di Imaging Sismico ad Alta Risoluzione per lo Studio di Faglie Sismogenetiche: Il Caso di Studio della Faglia di APRICENA (Puglia Settentrionale). Ph. D Thesis; Earth Sciences Department at University of Naples Federico II. Available online at: https://doi.org/10.6092/UNINA/FEDOA/8520 (accessed April 2021).
Villani, F., Pucci, S., Civico, R., De Martini, P. M., Cinti, F. R., and Pantosti, D. (2018). Surface faulting of the 30 October 2016 Mw 6.5 central Italy earthquake: detailed analysis of a complex coseismic rupture. Tectonics 37, 3378–3410. doi: 10.1029/2018tc005175
Walters, R. J., Gregory, L. C., Wedmore, L. N. J., Craig, T. J., McCaffrey, K., Wilkinson, M., et al. (2018). Dual control of fault intersections on stop-start rupture in the 2016 Central Italy seismic sequence. Earth Planet. Sci. Lett. 500, 1–14. doi: 10.1016/j.epsl.2018.07.043
Keywords: first motion solutions, focal mechanisms, seismicity, Italian region, Amatrice-Visso-Norcia seismic sequence, Montecilfone sequence, Muccia area
Citation: Ciaccio MG, Di Stefano R, Improta L, Mariucci MT and BSI Working Group (2021) First-Motion Focal Mechanism Solutions for 2015–2019 M ≥ 4.0 Italian Earthquakes. Front. Earth Sci. 9:630116. doi: 10.3389/feart.2021.630116
Received: 16 November 2020; Accepted: 26 February 2021;
Published: 25 May 2021.
Edited by:
Nicola Alessandro Pino, National Institute of Geophysics and Volcanology (INGV), ItalyReviewed by:
José A. Álvarez-Gómez, Complutense University of Madrid, SpainCopyright © 2021 Ciaccio, Di Stefano, Improta, Mariucci and BSI Working Group. This is an open-access article distributed under the terms of the Creative Commons Attribution License (CC BY). The use, distribution or reproduction in other forums is permitted, provided the original author(s) and the copyright owner(s) are credited and that the original publication in this journal is cited, in accordance with accepted academic practice. No use, distribution or reproduction is permitted which does not comply with these terms.
*Correspondence: Maria G. Ciaccio, bWFyaWFncmF6aWEuY2lhY2Npb0Bpbmd2Lml0
Disclaimer: All claims expressed in this article are solely those of the authors and do not necessarily represent those of their affiliated organizations, or those of the publisher, the editors and the reviewers. Any product that may be evaluated in this article or claim that may be made by its manufacturer is not guaranteed or endorsed by the publisher.
Research integrity at Frontiers
Learn more about the work of our research integrity team to safeguard the quality of each article we publish.