 Chengpeng Sun
 Wenzhi Zhao
 Hu Liu
 Yongyong Zhang1,2
94% of researchers rate our articles as excellent or good
Learn more about the work of our research integrity team to safeguard the quality of each article we publish.
Find out more
ORIGINAL RESEARCH article
Front. Earth Sci., 03 February 2021
Sec. Hydrosphere
Volume 9 - 2021 | https://doi.org/10.3389/feart.2021.627500
This article is part of the Research TopicSurface Processes and Morphodynamics Related to Climate and Human ImpactsView all 12 articles
Textural layering of soil plays an important role in distributing and regulating resources for plants in many semiarid and arid landscapes. However, the spatial patterns of textural layering and the potential effects on soil hydrology and water regimes are poorly understood, especially in arid sandy soil environments like the desert-oasis ecotones in northwestern China. This work aims to determine the distribution of textural layered soils, analyze the effects of different soil-textural configurations on water regimes, and evaluate which factors affect soil water infiltration and retention characteristics in such a desert-oasis ecotone. We measured soil water content and mineral composition in 87 soil profiles distributed along three transects in the study area. Constant-head infiltration experiments were conducted at 9 of the soil profiles with different texture configurations. The results showed that textural layered soils were patchily but extensively distributed throughout the study area (with a combined surface area percentage of about 84%). Soil water content in the profiles ranged from 0.002 to 0.27 g/cm3 during the investigation period, and significantly and positively correlated with the thickness of a medium-textured (silt or silt loam) layer (p < 0.001). The occurrence of a medium-textured layer increased field capacity and wilting point and decreased available water-holding capacity in soil profiles. Burial depth of the medium-textured layer had no clear effects on water retention properties, but the layer thickness tended to. In textural layered soils, smaller water infiltration rate and cumulative infiltration, and shallower depths of wetting fronts were detected, compared with homogeneous sand profiles. The thickness and burial depth of medium-textured layers had obvious effects on infiltration, but the magnitude of the effects depended on soil texture configuration. The revealed patterns of soil textural layering and the potential effects on water regimes may provide new insight into the sustainable management of rainfed vegetation in the desert-oasis ecotones of arid northwestern China and other regions with similar environments around the world.
Textural layered soils are soils with textural contrasts, or duplex soils with subsoil in which the clay content is at least one and a half times that of the overlying layer (Northcote, 1971). These include abrupt textural-change soils (Hill and Parlange, 1972; Bockheim, 2016) characterized by a clear, abrupt, or sharp boundary between the surface and the underlying horizon, and soils with a considerable increase in clay content within a very short vertical distance (Hardie, et al., 2012; Bockheim and Hartemink, 2013). Commonly, soil texture in these soils ranges from sandy to medium or medium-heavy clay soils (Hardie, et al., 2013). The formation of textural layered soils is a complex process resulting from a number of factors, such as translocation via eluviation-illuviation, bioturbation, erosion, deposition, and artificial reclamation (Phillips, 2001; Alfnes, et al., 2004). Textural layered soils are ubiquitous in the natural world, in places like southwestern Australia (Tennant, et al., 1992), the southwestern United States (Munson, et al., 2016), and western Canada (Selim, 2011). In China, similar textural layered soils have been found in the wind-water erosion crisscross region of the Loess Plateau (Zhang, et al., 2017a), and in the desert-oasis ecotone of northwestern China (Zhou, et al., 2016).
The desert-oasis ecotone of northwestern China is an ecologically fragile region currently experiencing significant desertification (Yu, et al., 2020). Since the mid-1970s, native sand-adapted shrubs have been widely planted, in order to curb desertification and alleviate its influence on crops, pasture, and human life (Zhou, et al., 2017). In regions with low precipitation, water is a basic condition on which vegetation relies for survival (Noy-Meir, 1973). Soil texture can affect quantity and availability of plant water as an important determinant of soil hydrological properties and processes, e.g., water retention, infiltration and drainage. There is evidence that discontinuity of subsurface soil horizons is a common feature in arid regions, and causes spatial heterogeneity of soil texture (Pahlavan-Rad and Akbarimoghaddam, 2018; Regmi and Rasmussen, 2018), which in turn leads to high heterogeneity of water reserves. To accommodate such conditions, plants have changed foraging mechanisms by modifying root distribution patterns (Hamerlynck, et al., 2002; Zou, et al., 2005). Additional studies suggest that the root increases in some plants (e.g., deeply rooted shrubs) are dampened on textural layered soils (Browning, et al., 2008; Duniway, et al., 2018), due to the clay-rich subsurface soil horizons, which can inhibit root growth and elongation (Zhou, et al., 2019). Through these responses, textural layered soils can influence vegetation dynamics and landscape evolution (Hamerlynck, et al., 2002; Sperry and Hacke, 2002; Macinnis-Ng, et al., 2010), which in turn influences local ecological stability. Understanding the effects of textural layering on soil hydrological properties and processes in arid ecosystems will be helpful for predicting the patterns and self-organizing processes of rainfed vegetation in desert-oasis ecotones.
Textural layered soils are generally regarded as a natural isolation layer (de Jong van Lier and Wendroth, 2016), influencing flow behaviors and temporal availability of soil water (McAuliffe, 1994). Many studies have explored the impact of textural layering on soil hydrological properties, and results have suggested that textural variability can increase soil water storage (Ityel, et al., 2011; Zettl, et al., 2011; Mancarella, et al., 2012). However, previous studies have provided inconsistent results on the associations between soil water availability and textural variability (Huang, et al., 2013; Fensham, et al., 2015). The influence of textural layered soils on water infiltration have also been widely investigated. Textural layered soils often impede infiltration (Ma, et al., 2011; Li, et al., 2014) due to a capillary and hydraulic barrier resulting from the discontinuity of hydraulic properties (Ross, 1990; Miyazaki, et al., 1993). Generally, a capillary barrier develops when a coarse-textured layer is found beneath a fine-textured layer (Stormont and Anderson, 1999). Factors affecting the efficiency of a capillary barrier include soil texture (Yang, et al., 2004), thickness of the overlying layer (Qian, et al., 2010), and the size of the interfaces between soil horizons (Si, et al., 2011). A hydraulic barrier develops when a coarse-textured layer covers a fine-textured layer (Thompson, et al., 2010), and the barrier is mainly affected by precipitation characteristics (Chu and Mariño, 2005), thickness of the coarse layer (Zhang, et al., 2017a), and disparities in permeability between surface soil and subsoil (Mohammadzadeh-Habili and Heidarpour, 2015). Water infiltration can be extremely complex under the condition of the simultaneous presence of two flow barriers—for example, a soil profile with a contrast-textured interlayer. Most studies suggest that infiltration is inhibited in these conditions, and the effect varies by the number, position and soil texture of the interlayers (Gvirtzman, et al., 2008; Ng, et al., 2015; Wang, et al., 2018; Hou, et al., 2019). However, further studies have suggested that textural layered soils do not obstruct water flow (Rimon, et al., 2007), and even in some cases (e.g., under dry soil conditions), facilitate infiltration (Hardie, et al., 2011; Wang, et al., 2014). These controversial findings need to be further investigated.
Many approaches have been proposed for analyzing the characteristics of infiltration processes in textural layered soils. Common methods for acquiring soil hydrological processes include laboratory tests (Al-Maktoumi, et al., 2015), field experiments (Rimon, et al., 2007; Gvirtzman, et al., 2008), and simulations by current commercially available soil water models such as HYDRUS 1D or 2D (Wang, et al., 2017; Wang, et al., 2018), and theoretical models such as the Green-Ampt model (Mohammadzadeh-Habili and Heidarpour, 2015; Deng and Zhu, 2016). Preferential flow is a common phenomenon in the desert-oasis ecotone (Yan and Zhao, 2016; Zhang, et al., 2017b), however, HYDRUS failed to simulate the complexity of flow processes observed in dry soils, specifically confounding preferential flow (Hardie, et al., 2013). Taking the complexity of textural layering effects into consideration, we chose in-situ infiltration testing in this study.
The primary objectives of this study were to: 1) examine the distribution and structures of textural layered soils; 2) identify the role of textural layered soils in soil water content (SWC) and hydrological properties (water-holding capacities) and processes (water infiltration); and 3) discuss the potential implications of textural layered soils for vegetation conservation in the study region.
The study was carried out in the Linze desert–oasis ecotone, located in the middle of the Heihe River Basin in northwestern China (39° 21′-39° 25′ N, 100° 08′-100° 11′ E). The area is about 3.5 km2 and is surrounded by the Beishan Mountain to the northwest, the Heihe River to the south, and the Badain Jaran Desert to the east (Figure 1). The climate is continental, with cold winters and hot summers. Mean annual precipitation is about 116.8 mm, with rainfall maximum during the summer period from May to September. Mean annual temperature and evaporation were 7.6°C (−27.3–39.1°C) and 2,390 mm, respectively, for the 1987–2017 period (Liu, et al., 2018). The dominant soil types are Aridisol, Plaggept and Psamments (Liu, et al., 2011) in the margin of the oasis, owing to long-term alluvial deposits and eolian processes forming a special type of texture-contrast soil (Zhang and Zhao, 2015). The major landscape types include the peripheral desert, desert-oasis ecotone, and central oasis (Zhang, et al., 2018). Dominant plant species include natural native vegetation such as Nitraria sphaerocarpa, Nitraria tangutorum and Calligonum mongolicum, and planted Haloxylon ammodendron.
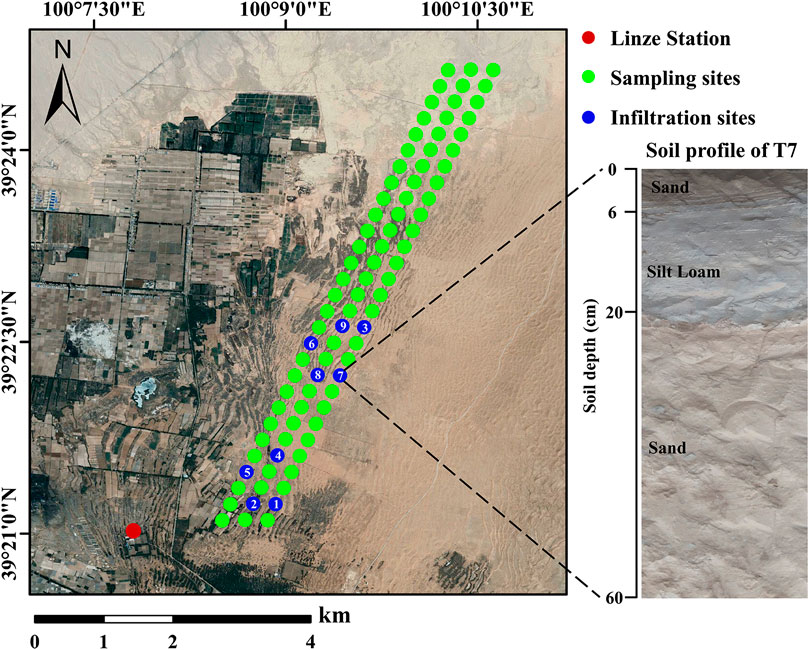
FIGURE 1. Location of the sampling and infiltration sites. Note: Numbers from 1 to 9 at the blue points indicate the infiltration sites from T1 to T9, and the size of blue symbols does not represent the sampling range.
In the study area, H. ammodendron was planted at various times (2010, 2005, 1995, and 1975) using one-year-old seedlings in rows at about 2.0 m × 2.5 m spacing (Zhou, et al., 2017). Precipitation and volumetric water content (VWC) data collected by the Linze Inland River Basin Research Station of the Chinese Academy of Sciences indicated that single precipitation events did not usually recharge the soil below 20–30 cm. Clustered rain events could infiltrate into deeper layers, and wetting front fluctuations were mostly constrained to within 60 cm of the surface (Figure 2), as in deeper soils no impact of specific rain events was observed. Therefore, a key factor determining infiltration patterns in these soils involves the physical properties at 0–60 cm depth.
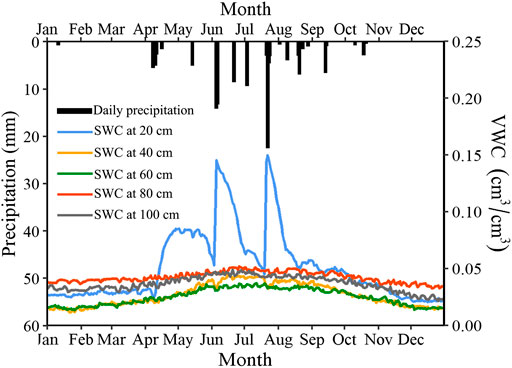
FIGURE 2. Dynamics of precipitation and soil moisture (2017) in the study area.
We set up three sampling transects 250 m apart. Along each transect, 29 sites were chosen at a distance of 250 m apart (Figure 1). The advantage of such sampling design was that it allowed us to assess the spatial distribution of medium-textured layers at the fringe of the oasis, and to evaluate potential impacts of medium-textured layers on soil water content. We sampled these 87 representative soil sites during the months of August and September 2018. At each site, we collected soil samples at intervals of 10 cm from 0 to 300 cm profiles with a hand-held soil auger (5 cm in diameter). Longitude and latitude at each site were obtained with a hand-held GPS. Land-use type and plant species were also noted. Sampling was paused for 7 days after a precipitation event to avoid confounding soil water content with direct precipitation inputs.
To estimate the influence of textural layered soils on infiltration features, ponded infiltration measurements in situ were carried out on nine soil profiles with a medium-textured layer. The nine sites were selected from the 87 sites according to the following criteria (except for one control site): the presence of medium-textured layers in soils to 60 cm depth, and representative variations in soil texture configurations and burial depth of the medium-textured layers; these sites were named T1 to T9. The nine sites were divided into five categories based on the position and number of medium-textured layers: homogeneous soil profile (T1), soil profiles in which medium-textured layers covered the coarser layer (T2 and T3), soil profiles in which medium-textured layers lay beneath the coarser layer (T4 and T5), soil profiles with medium-textured soil interlaid within a coarser profile (T6 and T7), and soil profiles with multiple medium-texture layers (T8 and T9), as shown in Table 1.
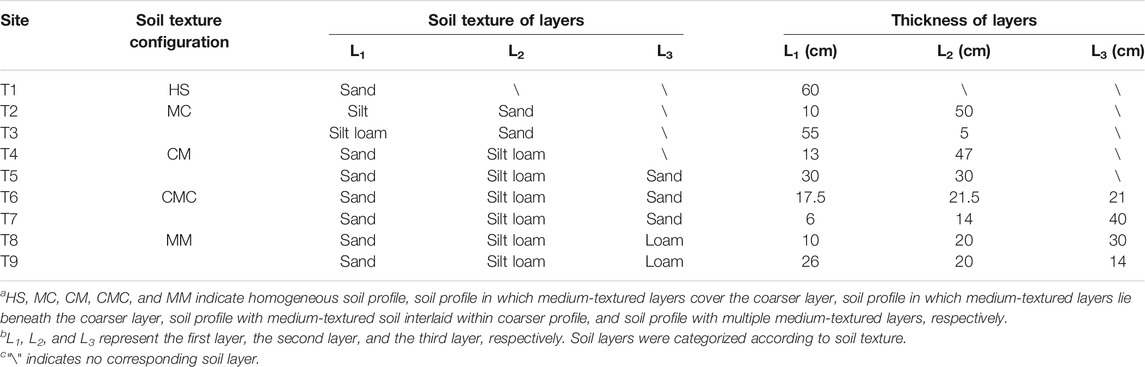
TABLE 1. Soil texture configurations for infiltration measurements.
A 20 cm inside-diameter ring was used to conduct infiltration tests, taking into consideration edge effects and disturbance of the sampled soil volume (Bagarello and Sgroi, 2004). A 100 cm-deep and 250 cm-wide soil profile was excavated with the central line of the ring as the axis in each site. The ring was carefully driven into soil 3 cm away from the excavated profile to a depth of 3 cm using a rubber hammer; surface vegetation was first removed, while the roots remained. To prevent extra seepage, we gently firmed the soil surface around the inside edges with a finger. The surface of the soil was padded with filter papers to prevent disturbance when adding water. A Mariotte bottle with an inner diameter of 40 cm and a height of 100 cm was used for the water supply. A 3 cm constant head of ponding was established in the ring, taking into consideration the effect of head of ponding on gravity potential and the maneuverability of the experiments (Touma, et al., 2007). The fall of the water level in the bottle was monitored to calculate the cumulative infiltration and the infiltration rate. The infiltration time was 450 min. The depth and breadth of the wetting front movement were obtained by observing the strong color contrast between wet and dry soil along the dug soil profile; only the right side of the horizontal wetting front was used, since the sides were nearly symmetrical. The dug profiles were covered with plastic to prevent evaporation. After infiltration, undisturbed soil samples were collected with steel cores (about 110 cm3) at intervals of 10 cm from 0 to 60 cm profiles.
Soil particle size was analyzed using a particle-size analyzer (Mastersizer 3,000, Malvern Instruments, Malvern, England) after being air-dried and sieved to < 2 mm. The components were clay (<0.002 mm), silt (0.002–0.05 mm), and sand (0.05–2 mm). According to USDA soil taxonomy, the texture of the sediments in the pan belonged to the medium-texture category (clay 0–40%, sand 0–52%). SWC was measured by the oven-drying method (105°C, 12 h). Some of the soil samples collected with stainless steel cylinders at the infiltration sites were dried in an oven at 105°C for 48 h to calculate bulk density (BD). Other soil samples were allowed to be saturated for 72 h, and were then centrifuged (H-1400 pF centrifuge for soil, Kokusan Corporation, Japan). The centrifuge was operated using 12 matric potentials as follows: −0.001, −0.005, −0.01, −0.02, −0.04, −0.06, −0.08, −0.1, −0.2, −0.5, −1, and −1.5 MPa. The mass water content of each soil sample at a given pressure head was recorded individually. Water-holding capacity was measured using field capacity (FC), wilting point (WP), and available water content (AWC). In practice, WP is generally considered to be the soil water content at −1.5 MPa. FC for coarse- and medium-textured soils are measured more consistently at −0.01 MPa and −0.02 MPa, respectively, (Gijsman, et al., 2007). AWC represents the difference between FC and WP (Ren, et al., 2017). Therefore, SWC refers to mass water content, in this work.
Statistical analyses were conducted with SPSS 22.0 (SPSS, Chicago, IL, United States). Because most of the soil property distributions failed the test of normality, a nonparametric Kruskal-Wallis ANOVA test could be used by comparing the differences in soil properties among the nine infiltration sites. We used linear regression to analyze the relationships between soil water content and textural size fractions of soil profiles, thickness, and burial depth of the medium-textured layers at the 87 sites. Correlation analysis was performed using Spearman’s correlation coefficients to evaluate the relationships between water retention properties and soil properties at the nine infiltration sites.
Textural layered soils displayed large variability in the sampled landscape. Overall, approximately 84% of soil profiles in the study area were textual layering soils, and the soils had a patchy distribution (Figure 3). Based on the position and number of medium-textured layers, the 87 sampling sites were separated into six classes: soil profile with multiple medium-textured layers (MM), soil profile with medium-textured soil interlaid within a coarser profile (CMC), soil profile in which medium-textured layers lay beneath the coarser layer (CM), homogeneous soil profile (HS), soil profile in which medium-textured layers covered the coarser layer (MC), and soil profile with coarser texture interlaid within a medium-textured profile (MCM); these accounted for 28.74 27.59, 18.39, 16.08, 5.75, and 3.45% of the samples, respectively.
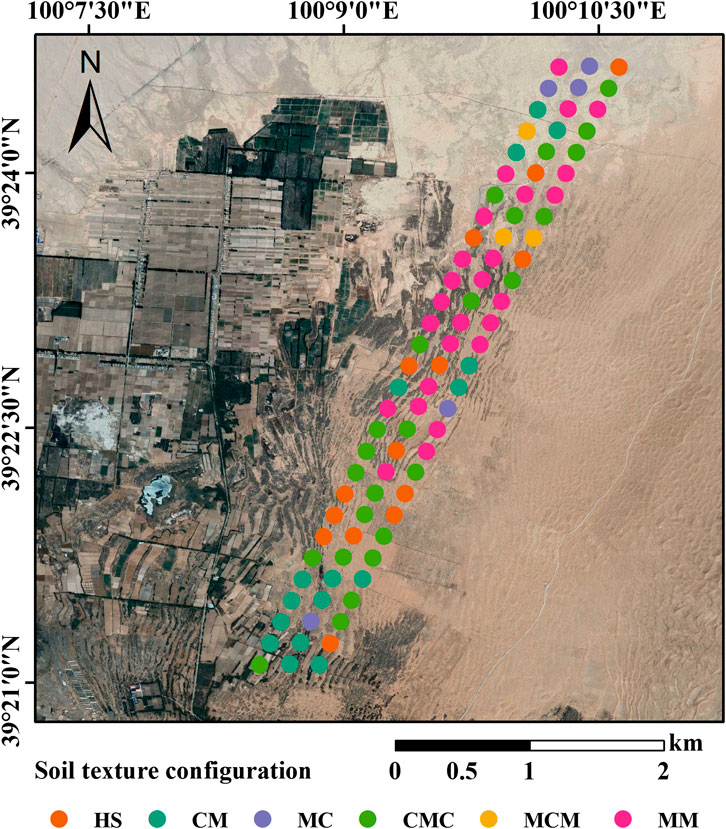
FIGURE 3. Distribution map of different texture-configuration soils. HS, CM, MC, CMC, MCM, and MM represent homogeneous soil profile, soil profile in which medium-textured layers lie beneath the coarser layer, soil profile in which medium-textured layers cover the coarser layer, soil profile with medium-textured soil interlaid within a coarser profile, soil profile with coarser texture interlaid within a medium-textured profile, and soil profile with multiple medium-textured layers, respectively. Note: The size of circle symbols dose not represent the sampling range.
Clay and silt concentrations (Figure 4A and Figure 4B) and SWC (Figure 4D) at the 87 sites were not normally distributed, but showed a strong tendency toward low values. Sand content data exhibited an opposite trend with >45% of soil profiles having sand content >90% (Figure 4C). Thickness of the medium-textured layer produced general unimodal distribution (Figure 4F), with >65% of medium-textured layers ranging in thickness from 0 to 90 cm. Distribution of burial depth was characterized by a single well-expressed maximum at 210–240 cm, with a second, less well-expressed maximum at 0–30 cm (Figure 4E).
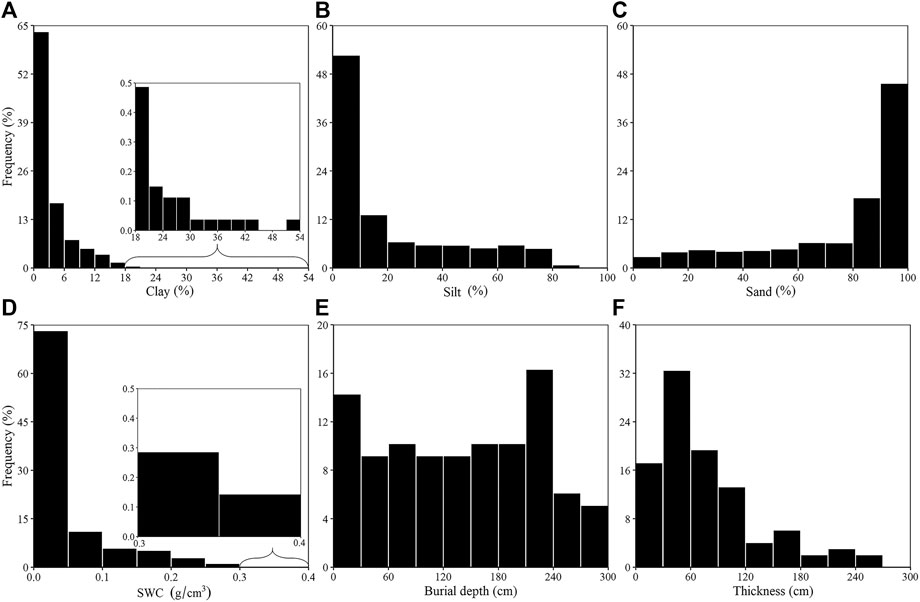
FIGURE 4. Histograms of frequency distribution of values for soil texture fractions, soil water content, and thickness and burial depth of medium-textured layers at the 87 sites.
Similarly, soil physical properties at the nine infiltration sites exhibited prominent differences (Table 2 and Figure 5). The differences in SWC, surface specific area (SSA), and grain diameter (GD) between T1, T3, and T4 were significant (p < 0.05). As the thickness of the medium-textured layer increased, SWC increased from 0.03 g/cm3 for T1 to 0.12 g/cm3 for T3 to the maximum (0.16 g/cm3) for T4. SSA was substantially greater in T3 and T4 than in T1, and increased from 96.53 (m2/kg) for T1 to 1,443.00 (m2/kg) for T3 to 1,528.00 (m2/kg) for T4. GD at T1 was approximately 15 times larger than that at T3 and T4. SWC, SSA, and GD had no remarkable variation in the same texture configuration profile other than soil profiles in which medium-textured layers covered the coarser layer (T2 and T3) and soil profiles in which medium-textured layers lay beneath the coarser layer (T4 and T5). BD and TP did not differ in the effects of soil textural layering. The distribution of clay, silt, and sand in the T1 profile was uniform, whereas textural size fractions were exceptionally heterogeneous in T2 to T9, with the medium-textured layers stratified horizontally thereby forming sharp textural interfaces. Specifically, FC and WP were much lower in subsurface medium-textured layers than in sites with the medium-textured layers on the surface (average of 0.21 and 0.13 g/cm3, average of 0.24 and 0.16 g/cm3, respectively, for FC and WP). Notably, there was no significant effect of burial depth of the medium-textured layer on water-holding capacity; FC and WP for sand layers overlying medium-textured layers were 0.14 and 0.04 g/cm3, respectively, and the values for subsurface sand layers were 0.14 and 0.03 g/cm3, respectively. Conversely, AWC exhibited no significant difference between overlying silt loam layers and subsurface silt loam layers (0.08 and 0.09 g/cm3, respectively); AWC was higher in surface sand layers than in sand layers beneath the silt loam layers (0.11 and 0.09 g/cm3, respectively). In general, the FC and WP of sand layers were lower than those of medium-textured layers, including silt loam and loam layers, and the AWC of sand layers was higher than that of medium-textured layers.
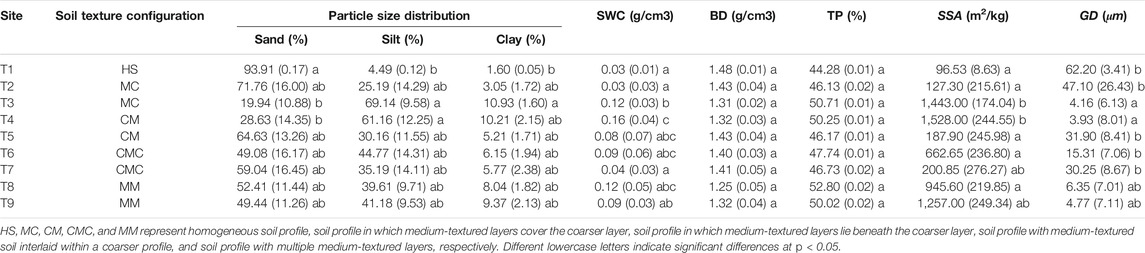
TABLE 2. Median (Standard Error) of soil physical properties at the nine infiltration sites (0–60 cm).
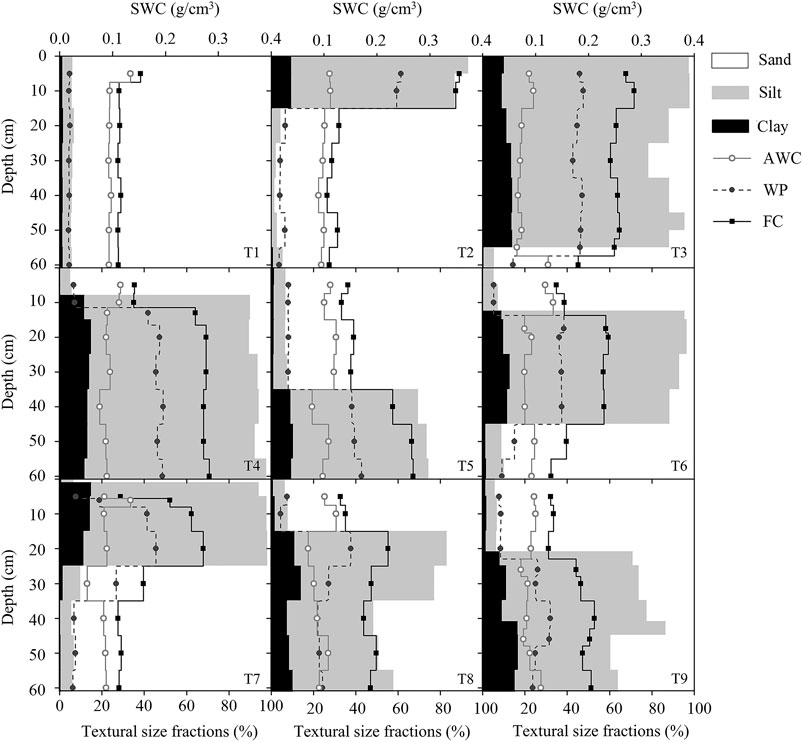
FIGURE 5. Textural size fractions and water-holding capacities of different soil texture configurations.
The water infiltration rate was high at the beginning of the experiment, decreased significantly with time, and then slowed down, finally stabilizing in most sites, such as T1, T2, T3, T8, and T9 (Figure 6). However, the infiltration rate for T4 and T5 first began to increase, then decreased slowly compared with T1 (between 20 and −100 min), and thereafter stabilized; a special condition was detected at T5 and T6, where the infiltration rates declined linearly after 245 and 255 min, respectively. In addition, the infiltration rate curve for T7 fluctuated until 285 min. In general, the average infiltration rate fell in the order T1> T5> T9> T4> T6> T8> T7> T3> T2.
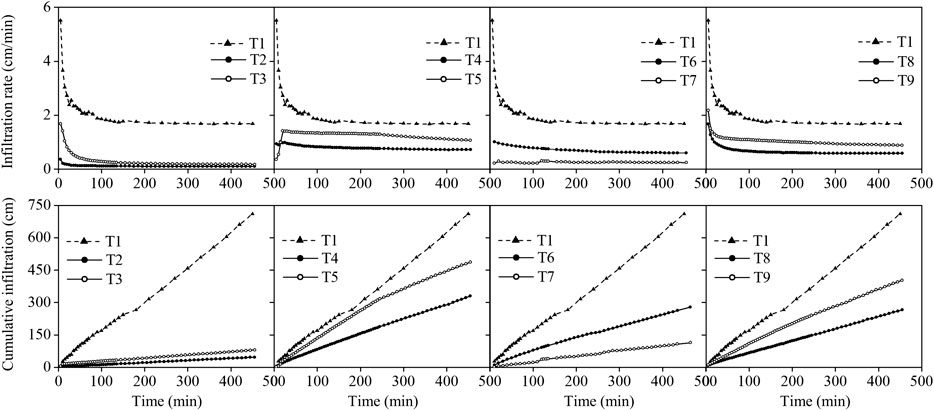
FIGURE 6. Infiltration rate and cumulative infiltration with different texture configurations.
The cumulative infiltration curves rose gradually during the infiltration period (Figure 6). The cumulative infiltration at other sites was lower than that at T1 (709.89 cm); those of the average of soil profiles in which medium-textured layers covered the coarser layer (T2 and T3, 63.66 cm), of soil profiles with medium-textured soil interlaid within a coarser profile (T6 and T7, 196.58 cm), of soil profiles with multiple medium-textured layers (T8 and T9, 334.69 cm), and of soil profiles in which medium-textured layers lay beneath the coarser layer (T4 and T5, 408.14 cm) decreased by 91, 72, 53, and 43%, respectively. Interestingly, two turning points (the first at 120 min and the second at 255 min) were observed in the cumulative infiltration curve at T7, after which soil water infiltration decreased. However, this phenomenon was not as notable at other sites.
The horizontal and vertical wetting front initially advanced very fast and then slowed down until finally the rate of the wetting front became constant (Figure 7). The wetting zone for T1 was larger than that of the other sites, especially in the vertical direction. There were substantial reductions in the vertical wetting front at T2 to T9 compared with T1; the decreases were 74.5, 79.5, 72, 55, 74, 57, 73.5, and 50.3 cm, respectively. Meanwhile, the order of advancement in the horizontal direction for the same test duration was: T1, T5, T6, T8, T9, T4, T7, T2, and T3. The times when the wetting fronts of T4 to T9 first arrived at the interface were 20, 45, 4, 20, 15, and 35 min, respectively. The process of water penetration created an onion-shaped wetting front at T3 that propagated very slowly, in both vertical and horizontal directions. Likewise, the vertical and horizontal wetting distances at T2 and T7 were similar.

FIGURE 7. Advance of the wetting front in horizontal and vertical directions, with time.
A correlation analysis between SWC and soil properties among the 87 sites is shown in Figure 8 and Figure 9. Significant positive correlations were found for SWC and silt (r = 0.78, p < 0.001, Figure 8B) and clay concentrations (r = 0.73, p < 0.001, Figure 8C) in soil depth to 300 cm, while SWC was highly significantly negatively correlated with sand concentration and an r value of 0.78 (p < 0.001, Figure 8A). And there was a significant negative correlation between SWC and burial depth of the medium-textured layers (r = −0.25, p < 0.05, Figure 9A), whereas the thickness of the layers was positively correlated with SWC (r = 0.57, p < 0.001, Figure 9B).
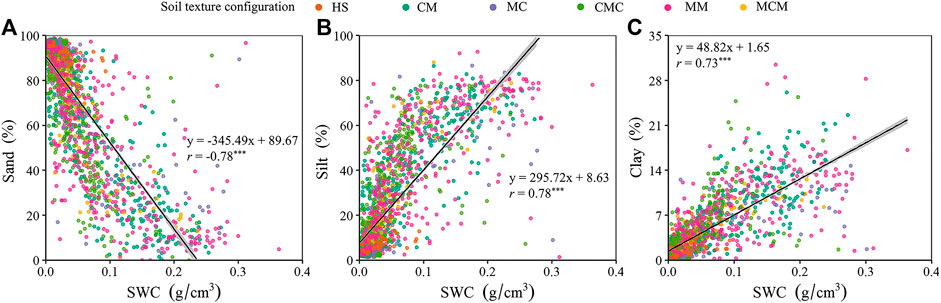
FIGURE 8. Relationships between SWC and sand concentration (A), silt concentration (B) and clay concentration (C) in soils to 300 cm depth; *** significant at p < 0.001.
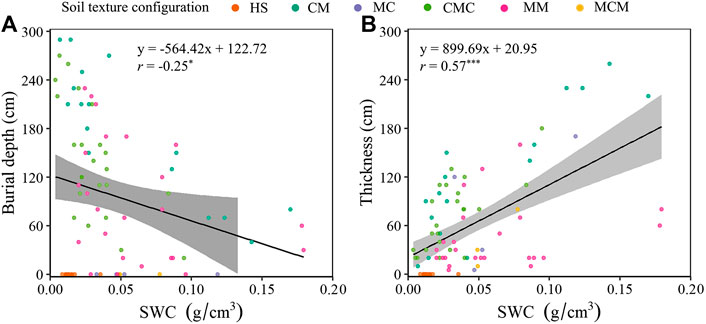
FIGURE 9. Relationships between SWC and burial depth (A) and thickness (B) of medium-textured layers in soils to 300 cm depth; *** significant at p < 0.001, * significant at p < 0.05.
A correlation analysis between soil water retention and infiltration parameters and soil properties among the nine infiltration sites is shown in Figure 10. Water retention capacities (FC, WP and AWC) were significantly correlated with soil physical properties (SWC, sand, silt and clay concentrations, BD, and TP). A positive relationship with the thickness of the medium-textured layers was found for FC and WP, but not for AWC. The infiltration rate at 450 min (i450) and cumulative infiltration at 450 min (I450) were significantly positively correlated with sand concentration, BD, and the burial depth of the medium-textured layers, but significantly negatively correlated with silt concentration and TP. WFW450 and wetting front depth at 450 min (WFD450) were significantly negatively correlated with the thickness of the medium-textured layers. Moreover, SWC was associated with the thickness of the medium-textured layers but not with the burial depth of these layers.
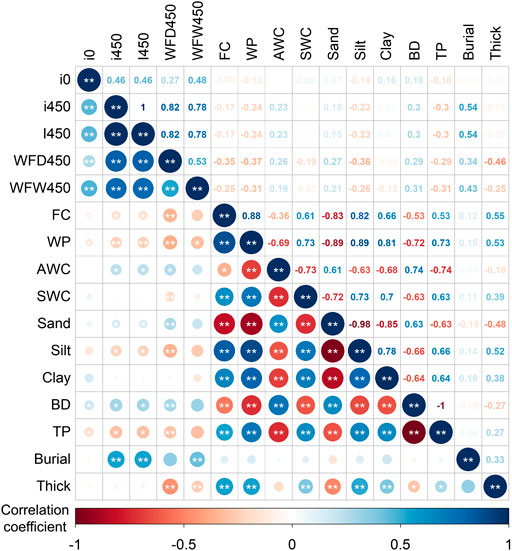
FIGURE 10. Correlation matrix among soil properties and water-holding capacities and infiltration parameters. Note: i0, i450, I450, WFW450 and WFD450 represent initial infiltration rate (cm/min), infiltration rate at 450 min (cm/min), cumulative infiltration at 450 min (cm), wetting front width at 450 min (cm) and wetting front depth at 450 min (cm), respectively; FC, WP, AWC and SWC represent fielding capacity (g/cm3), wilting point (g/cm3), available soil water content (g/cm3) and soil water content (g/cm3), respectively; BD and TP represent bulk density (g/cm3) and total porosity (%), respectively; Burial and Thick represent the burial depth and thickness of the medium-textured layers (cm).
Textural layering could increase water retention capacities both directly and indirectly. We had evidence that textural layering increased FC, WP and AWC of the surface sand layers (Figure 5), indicating the possibility of high water-storage capacity. These results were likely related to the increases in silt and clay content and TP of the surface sand layers and the thickness of the medium-textured layers, irrespective of the burial depth of those layers (Figure 10), because the thickness of the medium-textured layers is used as an indicator of silt and clay content, and increases in silt and clay content and TP can cause an increase in the abundance of small pore spaces where most water is retained (Sperry and Hacke, 2002). Our study also found that the correlation coefficients of soil texture with FC and WP were higher compared with those of TP, BD and the thickness. Any inconsistency might be caused by a discrepancy in initial soil water content, which can indirectly reflect matric potential. At high matric potentials, the impact of soil structure and physical properties on water-holding capacity would overrule the effect of clay content (Petersen, et al., 1996). Nevertheless, silt and clay contents become major contributors to water-holding capacity at low matric potentials (Banin and Amiel, 1970; Arthur, et al., 2013). In our study, low soil water content corresponded to low matric potential, and the concentrations of silt and clay were the major factors.
Although the burial depth of the medium-textured layers played minor roles in FC, WP and AWC compared with soil physical properties and the thickness of medium-textured layers (Figure 10), burial depth might be relevant for hydrological processes along with the texture configuration. In textural layering soils, the finer-textured layers act as barriers to infiltration (Li, et al., 2014), making burial depth an important factor in the infiltration process (Leconte and Brissette, 2001). Our study found that textural layering soil infiltration increased with the burial depth of the medium-textured layer, although it was less in the 17.5 cm treatment (T6) than in the 13 cm treatment (T4). A similar finding was reported by Wang et al. (Wang, et al., 2018), who found that the infiltration reduction effect was more pronounced in the 10 cm burial depth treatment than in the 5 cm treatment when the finer-textured layer was wettable. This result was also reported by Zhang et al. (Zhang, et al., 2017b), who indicated that infiltration increased as the burial depth of finer-textured layers increased from 0.5 to 25 cm, although the 10 cm treatment was an exception. They further found that burial depth hardly influenced infiltration process when the depth increased from 15 to 25 cm. Clearly, the impact of burial depth of the medium-textured layer on infiltration is complicated. On the other hand, our work revealed that textural layering soils had an infiltration-reduction effect, promoting the partition of water into lateral flows; these effects decreased in the order: MC, CMC, MM, and CM. This result is powerful evidence that the finer-textured layer governs the infiltration process (Kale and Sahoo, 2011). Infiltration is affected not only by the textural layering configurations and the burial depth of the finer-textured layers, but also by the thickness of the layers. For the MC scenario, the soil infiltrability of T2 was weaker than that of T3. There was no pronounced flow barrier effect in T3 resulting from the thickness of the overlying medium-textured layer when it greatly exceeded WFD450. Therefore, the 450 min infiltration process in T3 could be regarded as active in the medium-textured layer alone. Generally, a homogenous coarse layer has the fastest infiltration, while a fine homogenous layer has the slowest infiltration (Deng and Zhu, 2016). One explanation for these opposing results is that the finer-textured layer had a low hydraulic conductivity and more water was needed to break the capillary barrier when it was dry (McCartney and Zornberg, 2010; Si, et al., 2011). Therefore, when a finer-textured layer overlies a sand layer, a flow barrier can form when the thickness of the finer-textured layers does not exceed the response length.
Overall, these findings suggested a role for textural layering in soil hydrological processes. Textural layering could increase the content of silt and clay and of soil porosity, resulting in increasing surface sand layer water retention. Soil texture configuration, burial depth and thickness of the medium-textured layers influenced flow barriers indirectly, thus impacting the infiltration process. Moreover, these results contribute to a better understanding of infiltration characteristics in soils with different textural configurations, and provide data for validating and developing infiltration models and preferential flow modeling.
Data from the infiltration sites showed that textural layering significantly altered sand, silt and clay concentrations, and increased SWC, compared with HS (Table 2). There was significant correlation between SWC and soil texture (Figure 8 and Figure 10). These results agreed with earlier findings, demonstrating that the effect of soil composition on SWC was inversely proportional to sand concentration and directly proportional to silt and clay concentrations (Gómez-Plaza, et al., 2001; Kokulan, et al., 2018). This trend was attributed to a higher absorption capacity with variations in the SSA with medium and fine particles (Petersen, et al., 1996), a result consistent with our findings (Table 2). Soil texture configuration could affect the thickness and burial depth of medium-textured layers and thus acted as another determining element of SWC (Figure 9). The thickness and burial depth of medium-textured layers were other determining elements of SWC. The thickness of the medium-textured layers could be regarded as an indicator of silt and clay concentrations, and as a consequence, there was significant positive correlation between SWC and the thickness of medium-textured layers (Figure 9 and Figure 10). On the other hand, there was little relationship between SWC and burial depth of the medium-textured layers (Figure 9 and Figure 10). In the previous section, we discussed the complex relationship between burial depth and soil hydrological processes. This relationship further explains why the burial depth of the medium-textured layer had a negligible effect on soil water content, and in part accounted for the low r value (0.39) between the thickness of a medium-textured layer and SWC in this study (Figure 10). In general, because precipitation could be captured by medium-textured layers but not penetrate into subsurface soil, the effects of small precipitation pulses could accumulate to produce a larger response pulse (Noy-Meir, 1973), which, coupled with increased water-holding capacity, resulted in increased SWC.
Arid ecosystems, where rainfall is uneven and long drought periods are recurrent (Fernández-Raga, et al., 2017), are characterized by a high sensitivity of vegetation to the plant-available water in the soil. Therefore, the sustainable management of rainfed vegetation is critical for the stability of the ecosystem in arid regions. We have proved that textural layering increased soil water quantity by extending the timescale of precipitation pulses and changing soil hydrological processes, and increased the AWC of surface sand layers (Figure 4 and Table 2). This could presumably benefit perennial grasses as they are shallow-rooted and experience large fluctuations in water availability in the upper soil profile (Munson, et al., 2016). However, most studies have shown that woody plants dampened increases on textural layered soils because soil water was effectively inaccessible to plants for long periods, possibly limiting root growth (Fensham, et al., 2015). A recent study revealed that the interaction between rainfall and soil texture may change resources and recruitment strategies available to Haloxylon ammodendron (Liu, et al., 2020a). Due to the limited range of the soil layers, the results of this study were insufficient to confirm or refute the previous findings relating to woody plants. Aside from the effect of textural layering configurations on vegetation, the adaptation of plants to hydrology should also be taken into account (Liu, et al., 2020b). Therefore, further work is still needed to identify the potential effects of textural layered soils on eco-hydrological effectiveness and to determine whether textural layering should be considered a potential adverse factor for rainfed vegetation in the desert-oasis ecotones of arid northwestern China, especially as the ecological health of this ecotone is essential for regional ecosystem functioning and services.
Based on soil sampling and in-situ infiltration tests, this study examined the heterogeneity of textural layering soils and the effects of textural layering on soil water content, hydrological properties and processes. The main research results demonstrate that textural layered soils are widespread and the distribution of medium-textured layers shows discontinuity in the desert-oasis ecotone; and that the presence of medium-textured layers plays a critical role in soil water content, water storage and infiltration in sandy soils. Textural layering can increase soil water content in sandy soils both above and beneath medium-textured layers; and soil water content depends largely on the soil texture configurations, the thickness of medium-textured layers, and silt and clay concentrations. Medium-textured layers significantly increase soil porosity, and higher soil porosity results in increased water retention in surface sand layers. Meanwhile, medium-textured layers generate flow barriers in soil profiles-barriers that could capture and retain water for substantial periods of time relative to sandy soils. The infiltration process is mainly determined by soil texture configuration, and by the burial depth and thickness of medium-textured layers. The present study has only examined textural layering effects on soil water content and hydrological properties and processes. Textural layering effects on vegetation dynamics deserve further attention to improve sand-fixing vegetation in desert-oasis ecotones.
The original contributions presented in the study are included in the article/Supplementary Material, further inquiries can be directed to the corresponding author.
All authors listed have made a substantial, direct, and intellectual contribution to the work and approved it for publication.
This research was jointly supported by the National Natural Science Foundation of China (41630861) and the West Light Foundation of the Chinese Academy of Sciences (2019–2021, awarded to Hu Liu).
We thank Qiyue Yang for his kind assistance in conducting the laboratory tests for this study.
The authors declare that the research was conducted in the absence of any commercial or financial relationships that could be construed as a potential conflict of interest.
BD, Bulk density; TP, Total porosity; VWC, Volumetric water content; SWC, Soil water content; FC, Field capacity; WP, Wilting point; AWC, Available water content; SSA, Surface specific area; GD, Grain diameter.
Al-Maktoumi, A., Kacimov, A., Al-Ismaily, S., Al-Busaidi, H., and Al-Saqri, S. (2015). Infiltration into two-layered soil: the Green–Ampt and averyanov models revisited. Tran. Porous Med. 109 (1), 169–193. doi:10.1007/s11242-015-0507-8
Alfnes, E., Kinzelbach, W., and Aagaard, P. (2004). Investigation of hydrogeologic processes in a dipping layer structure: 1. The flow barrier effect. J. Contam. Hydrol. 69 (3–4), 157–172. doi:10.1016/j.jconhyd.2003.08.005
Arthur, E., Tuller, M., Moldrup, P., Resurreccion, A. C., Meding, M. S., Kawamoto, K., et al. (2013). Soil specific surface area and non-singularity of soil-water retention at low saturations. Soil Sci. Soc. Am. J. 77 (1), 43–53. doi:10.2136/sssaj2012.0262
Bagarello, V., and Sgroi, A. (2004). Using the single-ring infiltrometer method to detect temporal changes in surface soil field-saturated hydraulic conductivity. Soil Tillage Res. 76 (1), 13–24. doi:10.1016/j.still.2003.08.008
Banin, A., and Amiel, A. (1970). A correlative study of the chemical and physical properties of a group of natural soils of Israel. Geoderma 3 (3), 185–198. doi:10.1016/0016-7061(70)90018-2
Bockheim, J. G. (2016). Genesis of soils with an abrupt textural contrast in the United States. Catena 137, 422–431. doi:10.1016/j.catena.2015.10.011
Bockheim, J. G., and Hartemink, A. E. (2013). Distribution and classification of soils with clay-enriched horizons in the United States. Geoderma 209–210, 153–160. doi:10.1016/j.geoderma.2013.06.009
Browning, D. M., Archer, S. R., Asner, G. P., McClaran, M. P., and Wessman, C. A. (2008). Woody plants in grasslands: post-encroachment stand dynamics. Ecol. Appl. 18 (4), 928–944. doi:10.1890/07-1559.1
Chu, X. F., and Mariño, M. A. (2005). Determination of ponding condition and infiltration into layered soils under unsteady rainfall. J. Hydrol. 313 (3–4), 195–207. doi:10.1016/j.jhydrol.2005.03.002
de Jong van Lier, Q., and Wendroth, O. (2016). Reexamination of the field capacity concept in a Brazilian Orison. Soil Sci. Soc. Am. J. 80 (2), 264–274. doi:10.2136/sssaj2015.01.0035
Deng, P., and Zhu, J. (2016). Analysis of effective Green–Ampt hydraulic parameters for vertically layered soils. J. Hydrol. 538, 705–712. doi:10.1016/j.jhydrol.2016.04.059
Duniway, M. C., Petrie, M. D., Peters, D. P., Anderson, J. P., Crossland, K., and Herrick, J. E. (2018). Soil water dynamics at 15 locations distributed across a desert landscape: insights from a 27-yr dataset. Ecosphere 9 (7), e02335. doi:10.1002/ecs2.2335
Fensham, R. J., Butler, D. W., and Foley, J. (2015). How does clay constrain woody biomass in dryland?. Global Ecol. Biogeogr. 24 (8), 950–958. doi:10.1111/geb.12319
Fernández-Raga, M., Palencia, C., Keesstra, S., Jordán, A., Fraile, R., Angulo-Martínez, M., et al. (2017). Splash erosion: a review with unanswered questions. Earth Sci. Rev. 171, 463–477. doi:10.1016/j.earscirev.2017.06.009
Gijsman, A. J., Thornton, P. K., and Hoogenboom, G. (2007). Using the WISE database to parameterize soil inputs for crop simulation models. Comput. Electron. Agric. 56 (2), 85–100. doi:10.1016/j.compag.2007.01.001
Gómez-Plaza, A., Martınez-Mena, M., Albaladejo, J., and Castillo, V. M. (2001). Factors regulating spatial distribution of soil water content in small semiarid catchments. J. Hydrol. 253 (1–4), 211–226. doi:10.1016/S0022-1694(01)00483-8
Gvirtzman, H., Shalev, E., Dahan, O., and Hatzor, Y. H. (2008). Large-scale infiltration experiments into unsaturated stratified loess sediments: monitoring and modeling. J. Hydrol. 349 (1–2), 214–229. doi:10.1016/j.jhydrol.2007.11.002
Hamerlynck, E. P., McAuliffe, J. R., McDonald, E. V., and Smith, S. D. (2002). Ecological responses of two Mojave Desert shrubs to soil horizon development and soil water dynamics. Ecology 83 (3), 768–779. doi:10.1890/0012-9658(2002)083[0768:EROTMD]2.0.CO;2
Hardie, M. A., Cotching, W. E., Doyle, R. B., Holz, G., Lisson, S., and Mattern, K. (2011). Effect of antecedent soil moisture on preferential flow in a texture-contrast soil. J. Hydrol. 398 (3–4), 191–201. doi:10.1016/j.jhydrol.2010.12.008
Hardie, M. A., Doyle, R. B., Cotching, W. E., and Lisson, S. (2012). Subsurface lateral flow in texture-contrast (duplex) soils and catchments with shallow bedrock. Appl. Environ. Soil Sci. 2012 (5), 10. doi:10.1155/2012/861358
Hardie, M. A., Doyle, R., Cotching, W., Holz, G., and Lisson, S. (2013). Hydrogeology and preferential flow in the Tasmanian texture-contrast soils. Vadose Zone J. 12 (4). doi:10.2136/vzj2013.03.0051
Hill, D. E., and Parlange, J. Y. (1972). Wetting front instability in layered soils. Soil Sci. Soc. Am. J. 36 (5), 697–702. doi:10.2136/sssaj1972.03615995003600050010x
Hou, X. K., Li, T. L., Vanapalli, S. K., and Xi, Y. (2019). Water percolation in a thick unsaturated loess layer considering the ground-atmosphere interaction. Hydrol. Process. 33, 794–802. doi:10.1002/hyp.13364
Huang, M., Zettl, J. D., Barbour, S. L., Elshorbagy, A., and Si, B. C. (2013). The impact of soil moisture availability on forest growth indices for variably layered coarse-textured soils. Ecohydrology 6 (2), 214–227. doi:10.1002/eco.1260
Ityel, E., Lazarovitch, N., Silberbush, M., and Ben-Gal, A. (2011). An artificial capillary barrier to improve root zone conditions for horticultural crops: physical effects on water content. Irrigat. Sci. 29 (2), 171–180. doi:10.1007/s00271-010-0227-3
Kale, R. V., and Sahoo, B. (2011). Green-Ampt infiltration models for varied field conditions: a revisit. Water Resour. Manag. 25 (14), 3505–3536. doi:10.1007/s11269-011-9868-0
Kokulan, V., Akinremi, O., Moulin, A. P., and Kumaragamage, D. (2018). Importance of terrain attributes in relation to the spatial distribution of soil properties at the micro scale: a case study. Can. J. Soil Sci. 98 (2), 292–305. doi:10.1016/j.scitotenv.2017.01.062
Leconte, R., and Brissette, F. P. (2001). Soil moisture profile model for two-layered soil based on sharp wetting front approach. J. Hydrol. Eng. 6 (2), 141–149. doi:10.1061/(Asce)1084-0699(2001)6:2(141)
Li, X. P., Chang, S. X., and Salifu, K. F. (2014). Soil texture and layering effects on water and salt dynamics in the presence of a water table: a review. Environ. Rev. 22 (1), 41–50. doi:10.1139/er-2013-0035
Liu, H., Wu, C. D., Yu, Y., Zhao, W. Z., Yang, Q. Y., Wang, S. J., et al. (2020b). Modeling the physiological responses of a desert shrub to rainfall pulses in an arid environment in northwestern China. J. Arid Environ. 183, 104277. doi:10.1016/j.jaridenv.2020.104277
Liu, H., Yu, Y., Zhao, W. Z., Guo, L., Liu, J. T., and Yang, Q. Y. (2020a). Inferring subsurface preferential flow features from a wavelet analysis of hydrological signals in the shale hills catchment. Water Resour. Res. 56 (11), e2019WR026668. doi:10.1029/2019wr026668
Liu, J. L., Ren, W., Zhao, W. Z., and Li, F. R. (2018). Cropping systems alter the biodiversity of ground- and soil-dwelling herbivorous and predatory arthropods in a desert agroecosystem: implications for pest biocontrol. Agric. Ecosyst. Environ. 266, 109–121. doi:10.1016/j.agee.2018.07.023
Liu, W. J., Su, Y. Z., Yang, R., Yang, Q., and Fan, G. P. (2011). Temporal and spatial variability of soil organic matter and total nitrogen in a typical oasis cropland ecosystem in arid region of Northwest China. Environ. Earth Sci. 64 (8), 2247–2257. doi:10.1007/s12665-011-1053-5
Ma, Y., Feng, S. Y., Zhan, H. B., Liu, X. D., Su, D. Y., Kang, S. Z., et al. (2011). Water infiltration in layered soils with air entrapment: modified Green-Ampt model and experimental validation. J. Hydrol. Eng. 16 (8), 628–638. doi:10.1061/(asce)he.1943-5584.0000360
Macinnis-Ng, C. M. O., Fuentes, S., O’Grady, A. P., Palmer, A. R., Taylor, D., Whitley, R. J., et al. (2010). Root biomass distribution and soil properties of an open woodland on a duplex soil. Plant Soil 327 (1–2), 377–388. doi:10.1007/s11104-009-0061-7
Mancarella, D., Doglioni, A., and Simeone, V. (2012). On capillary barrier effects and debris slide triggering in unsaturated layered covers. Eng. Geol. 147-148, 14–27. doi:10.1016/j.enggeo.2012.07.003
McAuliffe, J. R. (1994). Landscape evolution, soil formation, and ecological patterns and processes in Sonoran Desert bajadas. Ecol. Monogr. 64 (2), 111–148. doi:10.2307/2937038
McCartney, J. S., and Zornberg, J. G. (2010). Effects of infiltration and evaporation on geosynthetic capillary barrier performance. Can. Geotech. J. 47 (11), 1201–1213. doi:10.1139/t10-024
Miyazaki, T., Hasegawa, S., and Kasubuchi, T. (1993). Water flow in soils. New York:Marcel Dekker, Inc.
Mohammadzadeh-Habili, J., and Heidarpour, M. (2015). Application of the Green–Ampt model for infiltration into layered soils. J. Hydrol. 527, 824–832. doi:10.1016/j.jhydrol.2015.05.052
Munson, S. M., Sankey, T. T., Xian, G., Villarreal, M. L., and Homer, C. G. (2016). Decadal shifts in grass and woody plant cover are driven by prolonged drying and modified by topo-edaphic properties. Ecol. Appl. 26 (8), 2480–2494. doi:10.1002/eap.1389
Ng, C. W., Liu, J., Chen, R., and Xu, J. (2015). Physical and numerical modeling of an inclined three-layer (silt/gravelly sand/clay) capillary barrier cover system under extreme rainfall. Waste Manag. 38, 210–221. doi:10.1016/j.wasman.2014.12.013
Noy-Meir, I. (1973). Desert ecosystems: environment and producers. Annu. Rev. Ecol. Evol. 4 (1), 25–51. doi:10.1146/annurev.es.04.110173.000325
Pahlavan-Rad, M. R., and Akbarimoghaddam, A. (2018). Spatial variability of soil texture fractions and pH in a flood plain (case study from eastern Iran). Catena 160, 275–281. doi:10.1016/j.catena.2017.10.002
Petersen, L. W., Moldrup, P., Jacobsen, O. H., and Rolston, D. E. (1996). Relations between specific surface area and soil physical and chemical properties. Soil Sci. 161 (1), 9–21. doi:10.1097/00010694-199601000-00003
Phillips, J. D. (2001). Contingency and generalization in pedology, as exemplified by texture-contrast soils. Geoderma 102 (3–4), 347–370. doi:10.1016/S0016-7061(01)00041-6
Qian, T. W., Huo, L. J., and Zhao, D. Y. (2010). Laboratory investigation into factors affecting performance of capillary barrier system in unsaturated soil. Water Air Soil Pollut. 206 (1–4), 295–306. doi:10.1007/s11270-009-0106-9
Regmi, N. R., and Rasmussen, C. (2018). Predictive mapping of soil-landscape relationships in the arid Southwest United States. Catena 165, 473–486. doi:10.1016/j.catena.2018.02.031
Ren, H., Xu, Z., Isbell, F., Huang, J., Han, X., Wan, S., et al. (2017). Exacerbated nitrogen limitation ends transient stimulation of grassland productivity by increased precipitation. Ecol. Monogr. 87 (3), 457–469. doi:10.1002/ecm.1262
Rimon, Y., Dahan, O., Nativ, R., and Geyer, S. (2007). Water percolation through the deep vadose zone and groundwater recharge: preliminary results based on a new vadose zone monitoring system. Water Resour. Res. 43 (5), W05402. doi:10.1029/2006wr004855
Ross, B. (1990). The diversion capacity of capillary barriers. Water Resour. Res. 26 (10), 2625–2629. doi:10.1029/WR026i010p02625
Si, B., Dyck, M., and Parkin, G. W. (2011). Flow and transport in layered soils. Can. J. Soil Sci. 91 (2), 127–132. doi:10.4141/cjss11501
Sperry, J. S., and Hacke, U. G. (2002). Desert shrub water relations with respect to soil characteristics and plant functional type. Funct. Ecol. 16 (3), 367–378. doi:10.1046/j.1365-2435.2002.00628.x
Stormont, J. C., and Anderson, C. E. (1999). Capillary barrier effect from underlying coarser soil layer. J. Geotech. Geoenviron. 125 (8), 641–648. doi:10.1061/(ASCE)1090-0241.19991258641
Tennant, D., Scholz, G., Dixon, J., and Purdie, B. (1992). Physical and chemical characteristics of duplex soils and their distribution in the south-west of Western Australia. Aust. J. Exp. Agric. 32 (7), 827–843. doi:10.1071/EA9920827
Thompson, A., Nimmer, M., and Misra, D. (2010). Effects of variations in hydrogeological parameters on water-table mounding in sandy loam and loamy sand soils beneath stormwater infiltration basins. Hydrogeol. J. 18 (2), 501–508. doi:10.1007/s10040-009-0532-1
Touma, J., Voltz, M., and Albergel, J. (2007). Determining soil saturated hydraulic conductivity and sorptivity from single ring infiltration tests. Eur. J. Soil Sci. 58 (1), 229–238. doi:10.1111/j.1365-2389.2006.00830.x
Wang, C., Mao, X., and Hatano, R. (2014). Modeling ponded infiltration in fine textured soils with coarse interlayer. Soil Sci. Soc. Am. J. 78 (3), 745–753. doi:10.2136/sssaj2013.12.0535
Wang, J., Huang, Y., Long, H., Hou, S., Xing, A., and Sun, Z. (2017). Simulations of water movement and solute transport through different soil texture configurations under negative‐pressure irrigation. Hydrol. Process. 31 (14), 2599–2612. doi:10.1002/hyp.11209
Wang, X., Li, Y., Si, B., Ren, X., and Chen, J. (2018). Simulation of water movement in layered water-repellent soils using HYDRUS-1D. Soil Sci. Soc. Am. J. 82 (5), 1101–1112. doi:10.2136/sssaj2018.01.0056
Yan, J., and Zhao, W. (2016). Characteristics of preferential flow during simulated rainfall events in an arid region of China. Environ. Earth Sci. 75 (7), 566. doi:10.1007/s12665-015-5101-4
Yang, H., Rahardjo, H., Leong, E. C., and Fredlund, D. G. (2004). A study of infiltration on three sand capillary barriers. Can. Geotech. J. 41 (4), 629–643. doi:10.1139/t04-021
Yu, Y., Zhao, W., Martinez-Murillo, J. F., and Pereira, P. (2020). Loess Plateau: from degradation to restoration. Sci. Total Environ. 738, 140206. doi:10.1016/j.scitotenv.2020.140206
Zettl, J., Lee Barbour, S., Huang, M., Si, B., and Leskiw, L. A. (2011). Influence of textural layering on field capacity of coarse soils. Can. J. Soil Sci. 91 (2), 133–147. doi:10.4141/cjss09117
Zhang, F. B., Bai, Y. J., Xie, L. Y., Yang, M. Y., Li, Z. B., and Wu, X. R. (2017a). Runoff and soil loss characteristics on loess slopes covered with aeolian sand layers of different thicknesses under simulated rainfall. J. Hydrol. 549, 244–251. doi:10.1016/j.jhydrol.2017.04.002
Zhang, Y., Zhao, W., and Fu, L. (2017b). Soil macropore characteristics following conversion of native desert soils to irrigated croplands in a desert-oasis ecotone, Northwest China. Soil Till. Res. 168, 176–186. doi:10.1016/j.still.2017.01.004
Zhang, Y., Zhao, W., He, J., and Fu, L. (2018). Soil susceptibility to macropore flow across a desert-oasis ecotone of the Hexi Corridor, Northwest China. Water Resour. Res. 54 (2), 1281–1294. doi:10.1002/2017wr021462
Zhang, Y., and Zhao, W. (2015). Vegetation and soil property response of short-time fencing in temperate desert of the Hexi Corridor, northwestern China. Catena 133, 43–51. doi:10.1016/j.catena.2015.04.019
Zhou, H., Zhao, W. Z., and Yang, Q. Y. (2016). Root biomass distribution of planted haloxylon ammodendron in a duplex soil in an oasis:desert boundary area. Ecol. Res. 31, 673–681. doi:10.1007/s11284-016-1376-5
Zhou, H., Zhao, W. Z., and Zhang, G. F. (2017). Varying water utilization of Haloxylon ammodendron plantations in a desert-oasis ecotone. Hydrol. Process. 31 (4), 825–835. doi:10.1002/hyp.11060
Zhou, Y., Watts, S. E., Boutton, T. W., and Archer, S. R. (2019). Root density distribution and biomass allocation of co-occurring woody plants on contrasting soils in a subtropical savanna parkland. Plant Soil 438 (1–2), 263–279. doi:10.1007/s11104-019-04018-9
Keywords: Textural layering, Soil hydrology, Water retention, Water infiltration, Water regimes
Citation: Sun C, Zhao W, Liu H, Zhang Y and Zhou H (2021) Effects of Textural Layering on Water Regimes in Sandy Soils in a Desert-Oasis Ecotone, Northwestern China. Front. Earth Sci. 9:627500. doi: 10.3389/feart.2021.627500
Received: 09 November 2020; Accepted: 04 January 2021;
Published: 03 February 2021.
Edited by:
Yang Yu, Beijing Forestry University, ChinaCopyright © 2021 Sun, Zhao, Liu, Zhang and Zhou. This is an open-access article distributed under the terms of the Creative Commons Attribution License (CC BY). The use, distribution or reproduction in other forums is permitted, provided the original author(s) and the copyright owner(s) are credited and that the original publication in this journal is cited, in accordance with accepted academic practice. No use, distribution or reproduction is permitted which does not comply with these terms.
*Correspondence: Wenzhi Zhao, emhhb3d6aEBsemIuYWMuY24=
Disclaimer: All claims expressed in this article are solely those of the authors and do not necessarily represent those of their affiliated organizations, or those of the publisher, the editors and the reviewers. Any product that may be evaluated in this article or claim that may be made by its manufacturer is not guaranteed or endorsed by the publisher.
Research integrity at Frontiers
Learn more about the work of our research integrity team to safeguard the quality of each article we publish.