 Minggang Li
 Yong Zhao
 Yang Li
 Xin Zhou
 Shaobo Zhang
- Plateau Atmosphere and Environment Key Laboratory of Sichuan Province, Chengdu University of Information Technology, Chengdu, China
Based on daily measured data from 25 stations in Xinjiang Province from 1963 to 2017, we discuss the statistical characteristics, linear trends, and temporal concentration of slight precipitation (SP) and extreme precipitation (EP) events, and consider relationships between SP and EP events and daily mean temperature. The results show that SP events contribute strongly to the total annual number of wet days, and that EP events contribute strongly to the total annual precipitation amount. In consist with the decrease in SP events and the increase in EP events over the 55-year period, the contribution of SP events to total annual number of wet days has decreased significantly while the contribution of EP events to total annual precipitation amount has increased significantly. SP event usually distributes through most months of the year, whereas EP event usually concentrates in summer (JJA). Influenced by the negative trends for SP events frequency and positive trends of EP events frequency during recent decades, the concentration degree for SP and EP events have significantly increased and decreased, respectively. Distinct differences are found between the relationships of SP events and EP events to daily mean temperature. The daily mean temperature recorded at the stations in Northern Xinjiang on days with SP events was between –35°C and +34°C, and for EP events ranged from –21°C to +30°C. Regionally averaged curves for the change in SP and EP event frequency with temperature have bimodal and unimodal distributions, respectively. Trends for daily mean temperatures and for the frequency of SP events at different temperatures agree well over nearly the entire temperature range, while trends for daily mean temperatures and for the frequency of EP events at different temperatures are not always consistent. These results will help to improve our understanding of the characteristics and variability of precipitation in arid regions within the context of climate warming.
Introduction
Significant climate responses to global warming have been observed in arid and semi-arid areas. In eastern hemisphere, a drier climate response and dryland expansion existed are in most part of the arid lands, including Central Asia, and Northwest China (Chen et al., 2009; Li et al., 2013; Huang et al., 2016a,b, 2019; Zhang et al., 2020). There was a century-long course of warm and dry over the arid region of Northwest China, until the abrupt climate shift occurred in its west part (particularly in Xinjiang Province) around 1987 (Shi et al., 2002, 2003). As a special phenomenon among the arid lands (Zhang et al., 2010; Li et al., 2015), this warm and humid climate tendency in Xinjiang Province is attached with complex mechanism and enormous impacts on regional climate and ecosystem (Yao et al., 2013; Chen et al., 2016; Zhao et al., 2017). In order to have a better understand of the warm and humid climate change and to counter the extreme climate issues in Xinjiang, such as drought in spring while flood in summer, and the coexistence of drought and flood, many studies for precipitation response to the rising temperature were conducted (Wang et al., 2012, 2013, 2017; Jiang et al., 2013; Deng et al., 2014; Yao et al., 2015). Most of these works emphasized the significant increase in extreme precipitation (EP) events and discussed its potential impacts, but less well understood and insufficient studies have been carried out regarding the slight precipitation (SP) events, a precipitation type that account for large proportions in total annual wet days in Xinjiang province (Fu et al., 2008; Liao et al., 2012) and have large importance in arid lands. Zhang et al. (2012) suggested an increasing risk of both flood and drought are expected with the observed upward trend of concurrent strong and weak precipitation extremes in Tianshan Mountains. These all indicate that a comprehensive investigation of SP and EP events will not only help to better understand the response of precipitation to temperature rise, but also help to better understand the current extreme climate issues in Xinjiang.
For the issue of how the precipitation response to a warming background, researchers have proposed many important theories. Based on the Clausius-Clapeyron relation (C-C relation), Trenberth et al. (2003) suggested that, as the moisture in the air column increases with rising temperature, the intensity of precipitation will increase. While on the other hand, the condition for formulation of precipitation will be more difficult to reach, resulting in a decrease of precipitation frequency, especially for light and moderate precipitation events. Other theories, such as “wet-get-wetter” and “warmer-get-wetter” help to understand why the response of precipitation to the warming background varies from region to region (Held and Soden, 2006; Xie et al., 2010; Huang et al., 2013). For instance, the “wet-get-wetter” theory suggested that, the surface evaporation and moisture in the air column both increase in the context of temperature rising, and the accelerated water cycle may eventually make the dry areas drier and wet areas wetter. Many different precipitation responses to the warming climate have been observed in China over recent decades. In addition to increases or decreases in total annual precipitation, the persistence and phase of precipitation may change, and the proportions of precipitation events in different levels (e.g., small rain, moderate rain, and heavy rain) may be affected (Liu et al., 2005; Qian and Lin, 2005; Huang et al., 2011; Zhai et al., 2017). With the rapid warming in the second half of 20th century, generally, precipitation events with relatively large intensities (e.g., heavy rain, extreme rain) increased and precipitation events with small intensities (e.g., slight rain, small rain) decreased significantly in China (Zhai et al., 2005; Qian et al., 2007; Fu et al., 2008). This is largely in consist with the conclusion in Trenberth et al. (2003). However, there are many dynamic and thermodynamic factors that can bring impacts on precipitation, which makes it complicated to assess the effect of rising temperatures on precipitation in different regions.
Accompanied with the warm and humid climate tendency in Xinjiang Province, apart from the significant upward trends for the frequency of extreme precipitation events, obvious increase in small precipitation events and total number of annual wet days were also observed in both the relatively earlier works (Zhai et al., 2005; Qian et al., 2007; Fu et al., 2008) and those recent ones (Jiang et al., 2013; Wang et al., 2013; Deng et al., 2014; Zhou et al., 2015). Apparently, these changes conflict with the “wet-get-wetter” (dry-get-drier) theory, and cannot be well explained by the conclusion in Trenberth et al. (2003) too. As for SP events, the earlier studies reported opposite results for the trend of SP events in Xinjiang province during the second half of 20th century (e.g., Qian et al., 2007; Xin et al., 2008), while the recent studies on changes of precipitation in Xinjiang Province usually based on the indicators defined by Expert Team for Climate Change Detection Monitoring and Indices (ETCCDMI), which contains no indicator for SP events (Jiang et al., 2013; Wang et al., 2013; Deng et al., 2014; Zhou et al., 2015). Moreover, although there is an expected increase in extreme precipitation with temperature rising, the understanding of the relationship between precipitation and temperature remains insufficient at present. Recently, Utsumi et al. (2011) show that the relationship between extreme daily precipitation and daily mean surface temperature are not monotonous in the midlatitudes, and Xiao et al. (2017) found a piece-wise linear relationship between daily surface temperature and extreme precipitation in Central and Eastern China, and showed that the relationship changed from a positive to a negative relationship at approximately 25°C.
Based on the previous analyses, there are several questions need to be addressed. For examples, during recent few decades, particularly the last two decades, how the SP events changes in Northern Xinjiang? Are changes in SP and EP events reflected in their relative contributions to annual totals, and can these lead to changes in the structure of annual precipitation? Over recent decades, no clear trends have been observed in precipitation concentration in Xinjiang Province (Li et al., 2011), but these have not been broken down and explained in terms of changes to SP and EP events. To what extent can these changes explain the current status of extreme climate issues in Northern Xinjiang? How closely are the changes in precipitation connected to the warming climate in Xinjiang? Specifically, are there any connections between changes in SP and EP events and the rising temperature? To address the questions above, the content of this paper is organized as follows: data and methods are introduced in section 2, trends and characteristics observed for SP and EP events in Northern Xinjiang are described in section 3, and section 4 presents a statistical analysis of SP and EP event concentration. Connections between precipitation distribution and daily mean temperature are discussed in section 5, and section 6 summarizes the paper and presents some discussion and conclusions.
Data and Methods
Data
We used daily precipitation and mean temperature measurements from 25 stations across Northern Xinjiang covering 55 years from 1963 to 2017, which we obtained from the China Meteorological Data Service Center. Prior to analysis, this dataset was pre-processed using a quality control procedure that excluded data from stations where more than 30 days of data were missing over the study period, or where the recorded station position had changed by more than 20 km. Two more stations were removed after quality control because the total number of annual wet days that they recorded was extremely low, which study of EP events show to be statistically unlikely. The topography of Northern Xinjiang and the locations of the 25 stations are shown in Figure 1A. The Tianshan and Altai mountains dominate the topography of Northern Xinjiang and are located in the south and north of the region, respectively, with the Junggar Basin between them.
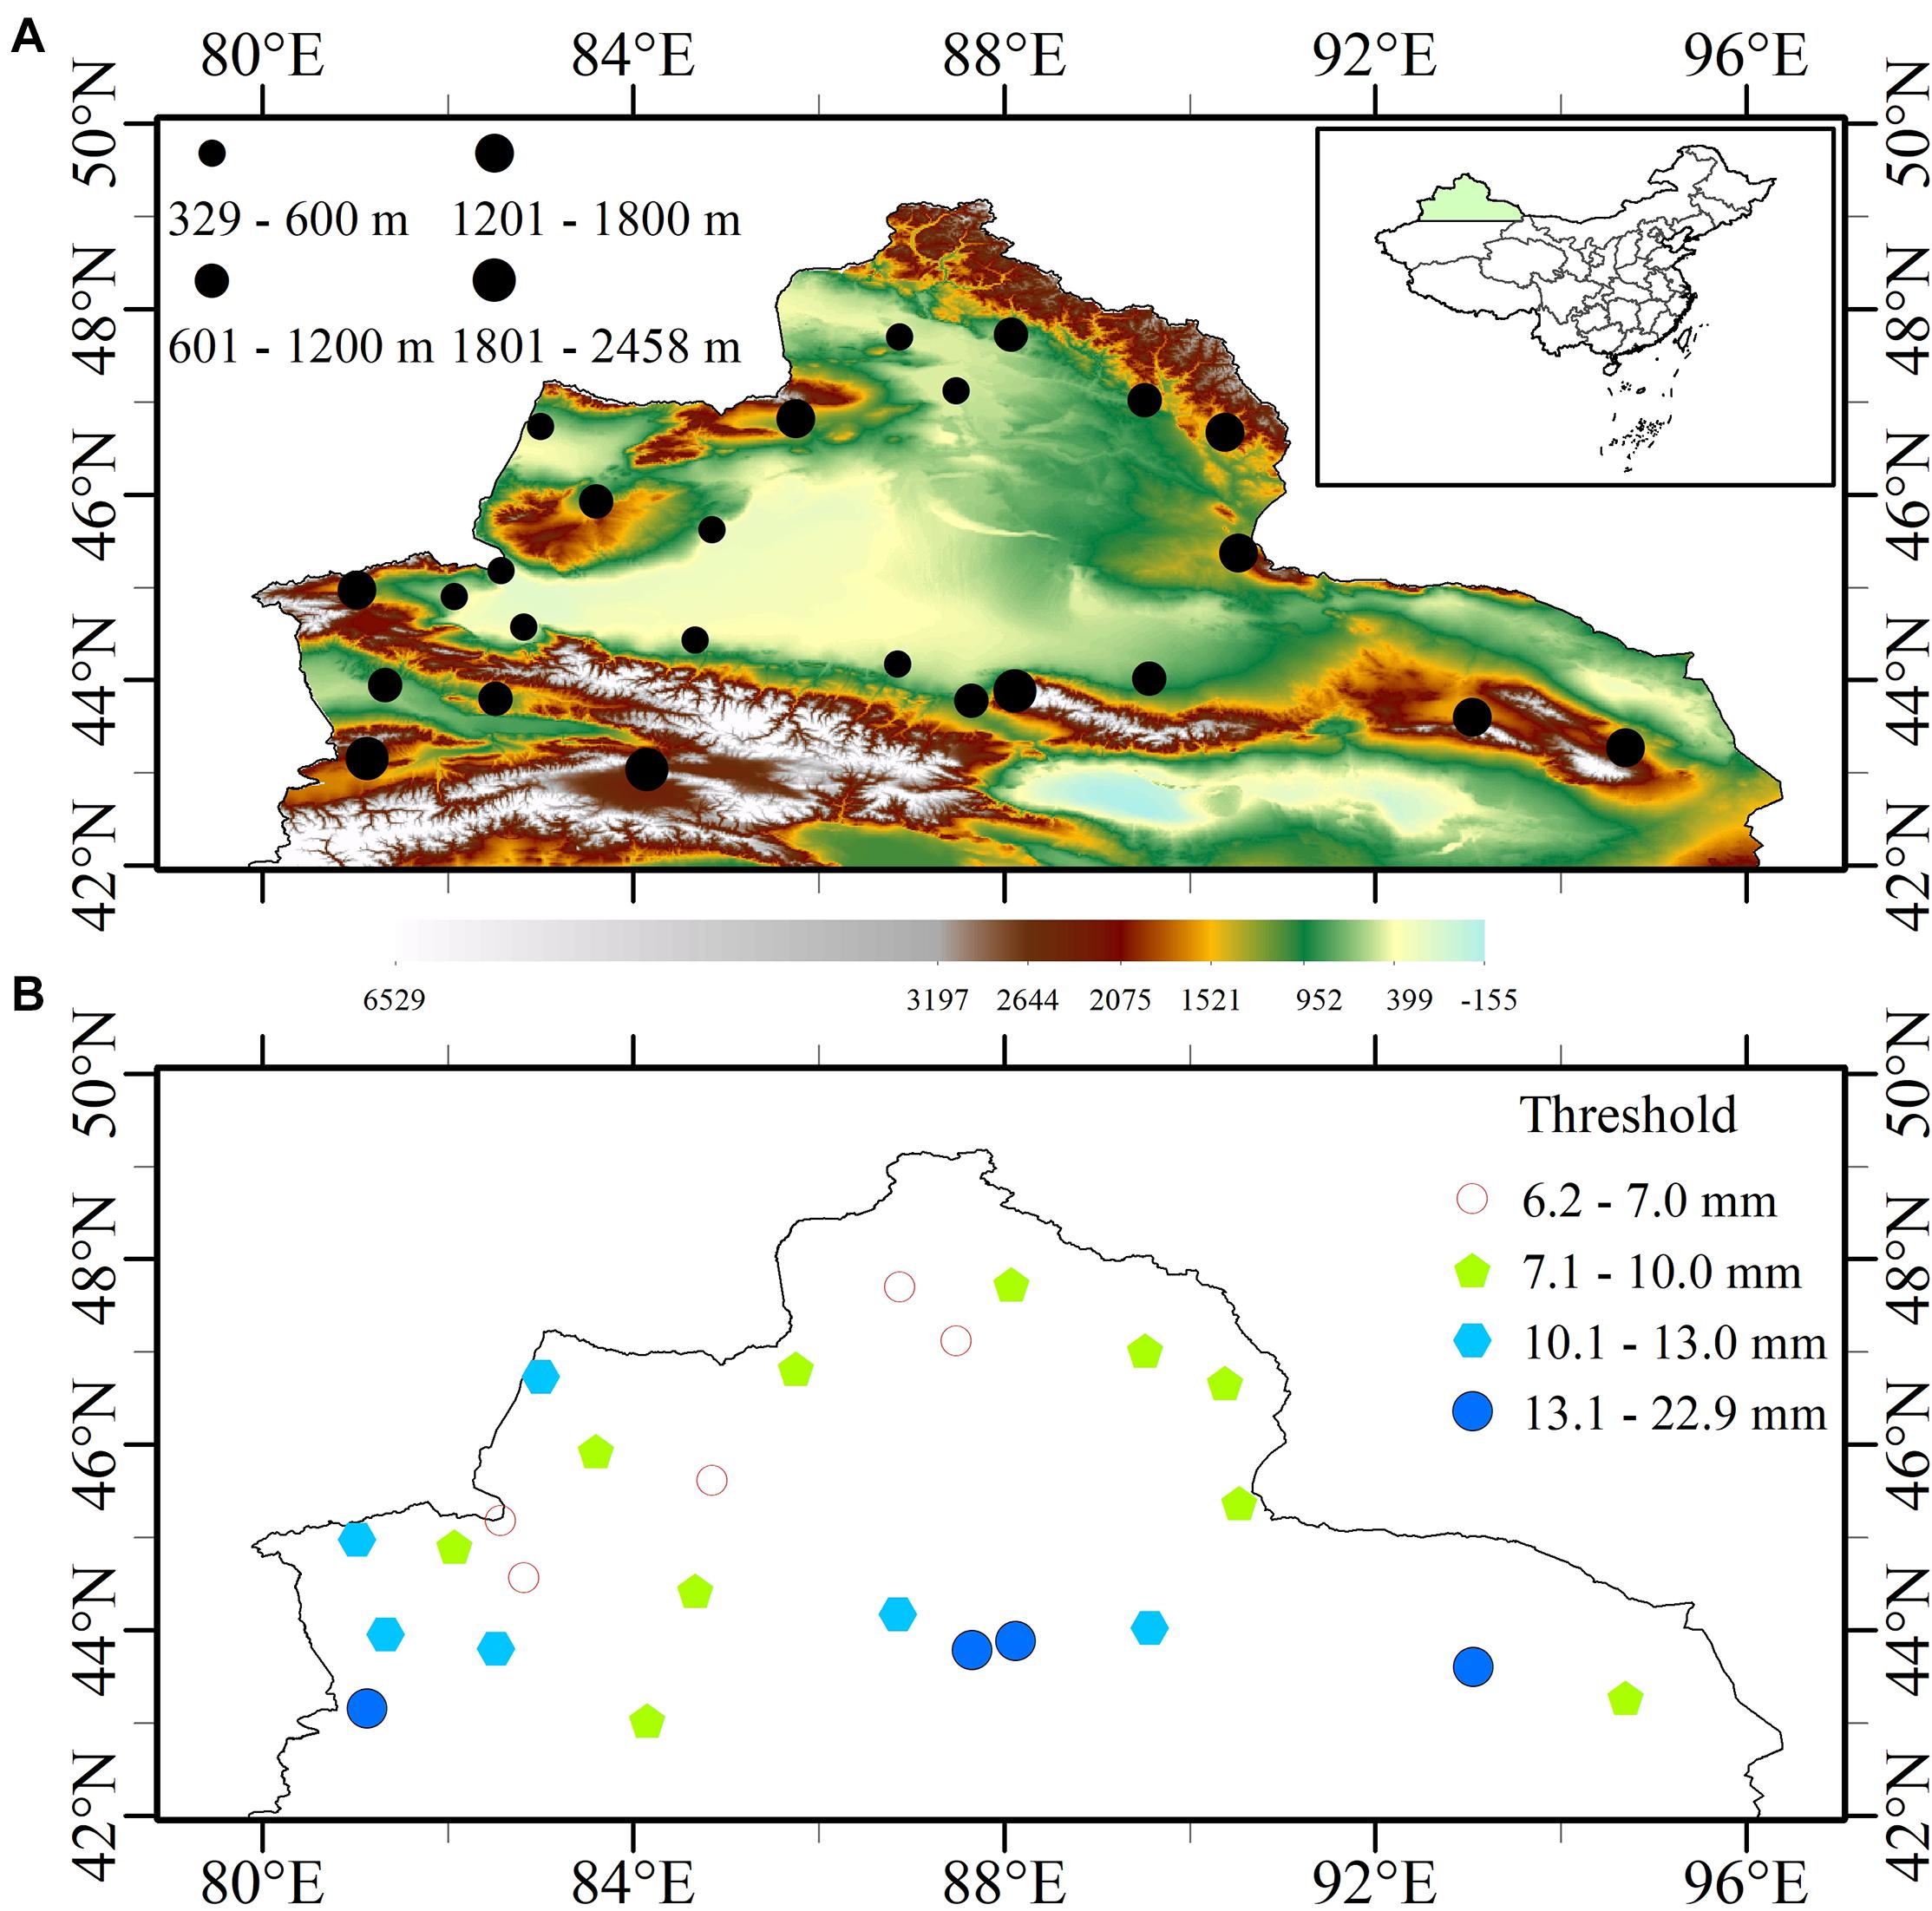
Figure 1. (A) Topography for Northern Xinjiang and location of the 25 stations. (B) The 95th percentile thresholds used to define extreme precipitation events.
It is also worth noting that the observation of liquid precipitation at Xinjiang stations changed from manual observation to automatic observation in 2007, and the observation of solid precipitation changed in 2012. Although the homogeneity of precipitation data can be affected by factors such as location change or changes in rain gauge type (Jiang et al., 2008; Yang and Li, 2014), no evidence of the influence of automatic observation on the identification of SP has been found so far. However, it is worth considering whether the transition from manual to automatic observations in Xinjiang could be a cause of inhomogeneity in the precipitation data, especially for SP.
Methods
The SP events discussed in this study were wet days (daily precipitation ≥0.1 mm) with precipitation between 0.1 and 0.9 mm, and EP events were defined using a threshold method. Wet days were classified as EP events when the precipitation amount exceeded the 95th percentile threshold. We followed Bonsal et al. (2001) to calculate the 95th percentile threshold. In detail, wet days were identified in the data from each station and all wet days from 1963 to 2017 were arranged in order of ascending precipitation amount for each individual station. The 95th percentile threshold was calculated from the resulting distribution and wet days with a precipitation amount exceeding this threshold were considered to be EP events for that station. See Table 1 for more details.
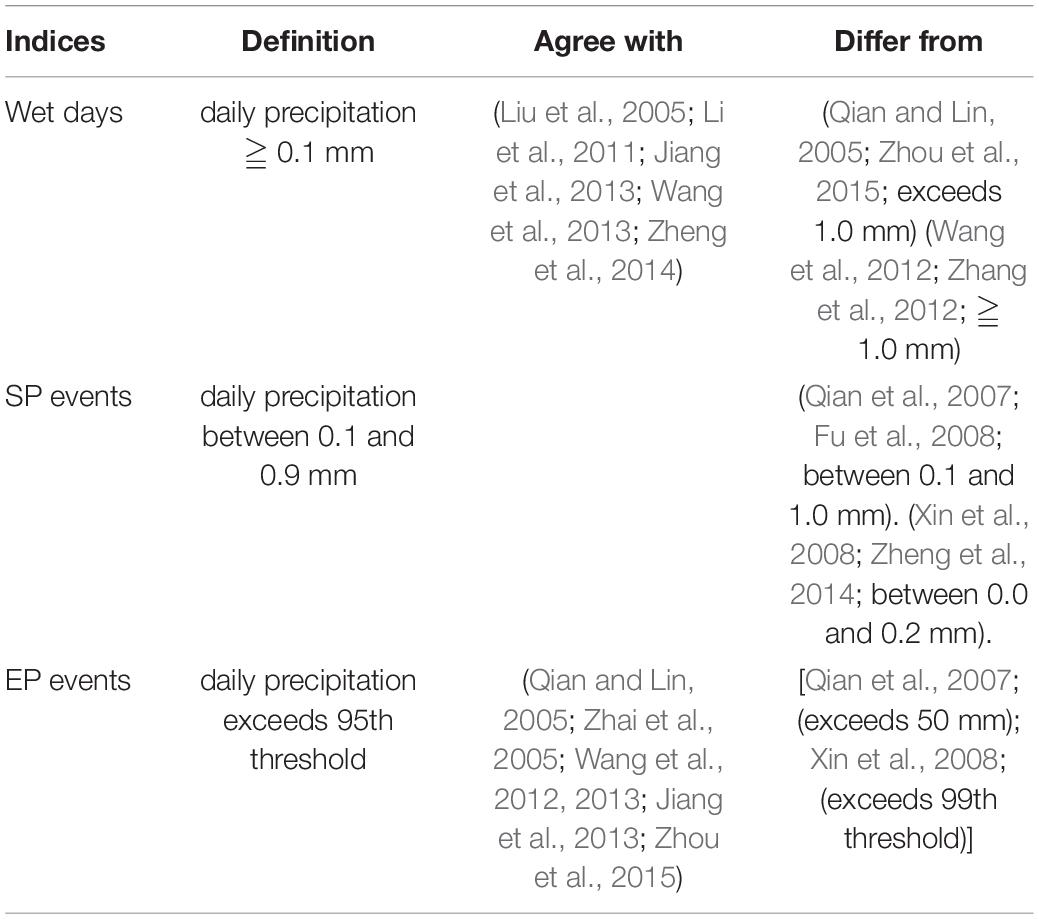
Table 1. Definitions of precipitation indices and comparison with other works.
The intra-annual frequency distributions for SP and EP events were analyzed by calculating the concentration degree (CD) and concentration period (CP), which are widely used to investigate the concentration of daily precipitation and dust storm events. The calculation of CD and CP was based on the assumptions that the monthly occurrences of an event could be treated as a vector quantity, and the direction for a year can be seen as a circle (Zhang and Qian, 2003; Li et al., 2011; Zhao et al., 2017). Hence, CD and CP were calculated as follows:
Where i represents the ith year, j represents the jth month of the year, rij is the total number of events (for SP or EP events in this study) in the jth month of the ith year, Ri represents the total number of events over all 12 months of the ith year, and θj is the azimuth for the jth month. Rx and Ry donate the horizontal and vertical components of the vector. The value for CD ranges from 0 to 1 and reflects how concentrated in time events were within a given year. If there were no events in a year, or if events were distributed evenly through the year, then the CD value is 0. If events are wholly concentrated in a single month, then the CD value is 1. In all other cases, a larger value for CD indicates a higher concentration of events in time. The value for CP reflects the month when the events were most intense, taking into account the frequency of events within the month, and the start and end months for individual events. Values for CP range from 0 to 360°, where 0–30° corresponds to January, 30–60° corresponds to February, and so on with 330°–360° corresponding to December.
Statistical Properties of SP and EP Events in Northern Xinjiang
Xinjiang is far from the Pacific Ocean, and the Tibetan Plateau prevents significant moisture from the Indian Ocean from reaching the region. Precipitation in Xinjiang is therefore characterized by a low annual precipitation amount, few annual wet days, and low precipitation intensity. The threshold used to identify EP events in Xinjiang is much lower than for monsoon region in Eastern China (Zhai et al., 2005). The 95th percentile for daily precipitation amount gives a threshold of between 7 and 13 mm for defining EP events at the most Northern Xinjiang stations, as shown in Figure 1B. There are five stations with thresholds below 7 mm, but the threshold is above 6 mm for all stations. Although there are four stations with thresholds greater than 13 mm, three of these thresholds are below 14 mm and there is only one station where the threshold is much greater (22.9 mm). Relatively high thresholds were evident at stations in the south and west of Northern Xinjiang, and most thresholds exceed 10 mm in these areas. The thresholds at stations on the north and west sides of the Junggar Basin are generally below 10 mm, which is relatively small, and three of the five stations in Northern Xinjiang with thresholds below 7 mm are located in these regions. The mean threshold used to define EP events across Northern Xinjiang is small, at 10.1 mm, but the numbers above show that there are large differences across the region.
The mean annual occurrence of SP and EP events and the mean annual precipitation amounts that are attributed to SP and EP events are shown in Figure 2. The annual occurrence of SP events at most stations across Northern Xinjiang ranges from 30 to 50 days (Figure 2A), and the average across all 25 stations is 41.7 days. Most stations where the occurrence of SP events exceeds the average are in the west part of Northern Xinjiang, and there are fewer stations with frequent SP events in the east part of the region. The station where SP events are most infrequent is at the eastern edge of Northern Xinjiang, where SP events occur for 24.8 days per year on average; this is the only station where the average frequency for SP events is below 30 days per year. There are five stations where SP events occur with an average frequency of more than 50 days per year. These are all in the western part of Northern Xinjiang, where the highest SP event frequency is 62 days per year, which is nearly 10 days more than the average at any other station. The spatial pattern of mean annual SP amount (Figure 2B) is similar to that for SP occurrence (Figure 2A), which is also higher in the west and lower in the east. The mean annual precipitation amount attributable to SP events is between 12 and 18 mm at most stations across Northern Xinjiang. The station for which this is lowest, at 8.9 mm, is also where SP events occur most infrequently. The station where the total precipitation attributable to SP events is highest, at 21.5 mm, is the station where SP events occur most frequently.
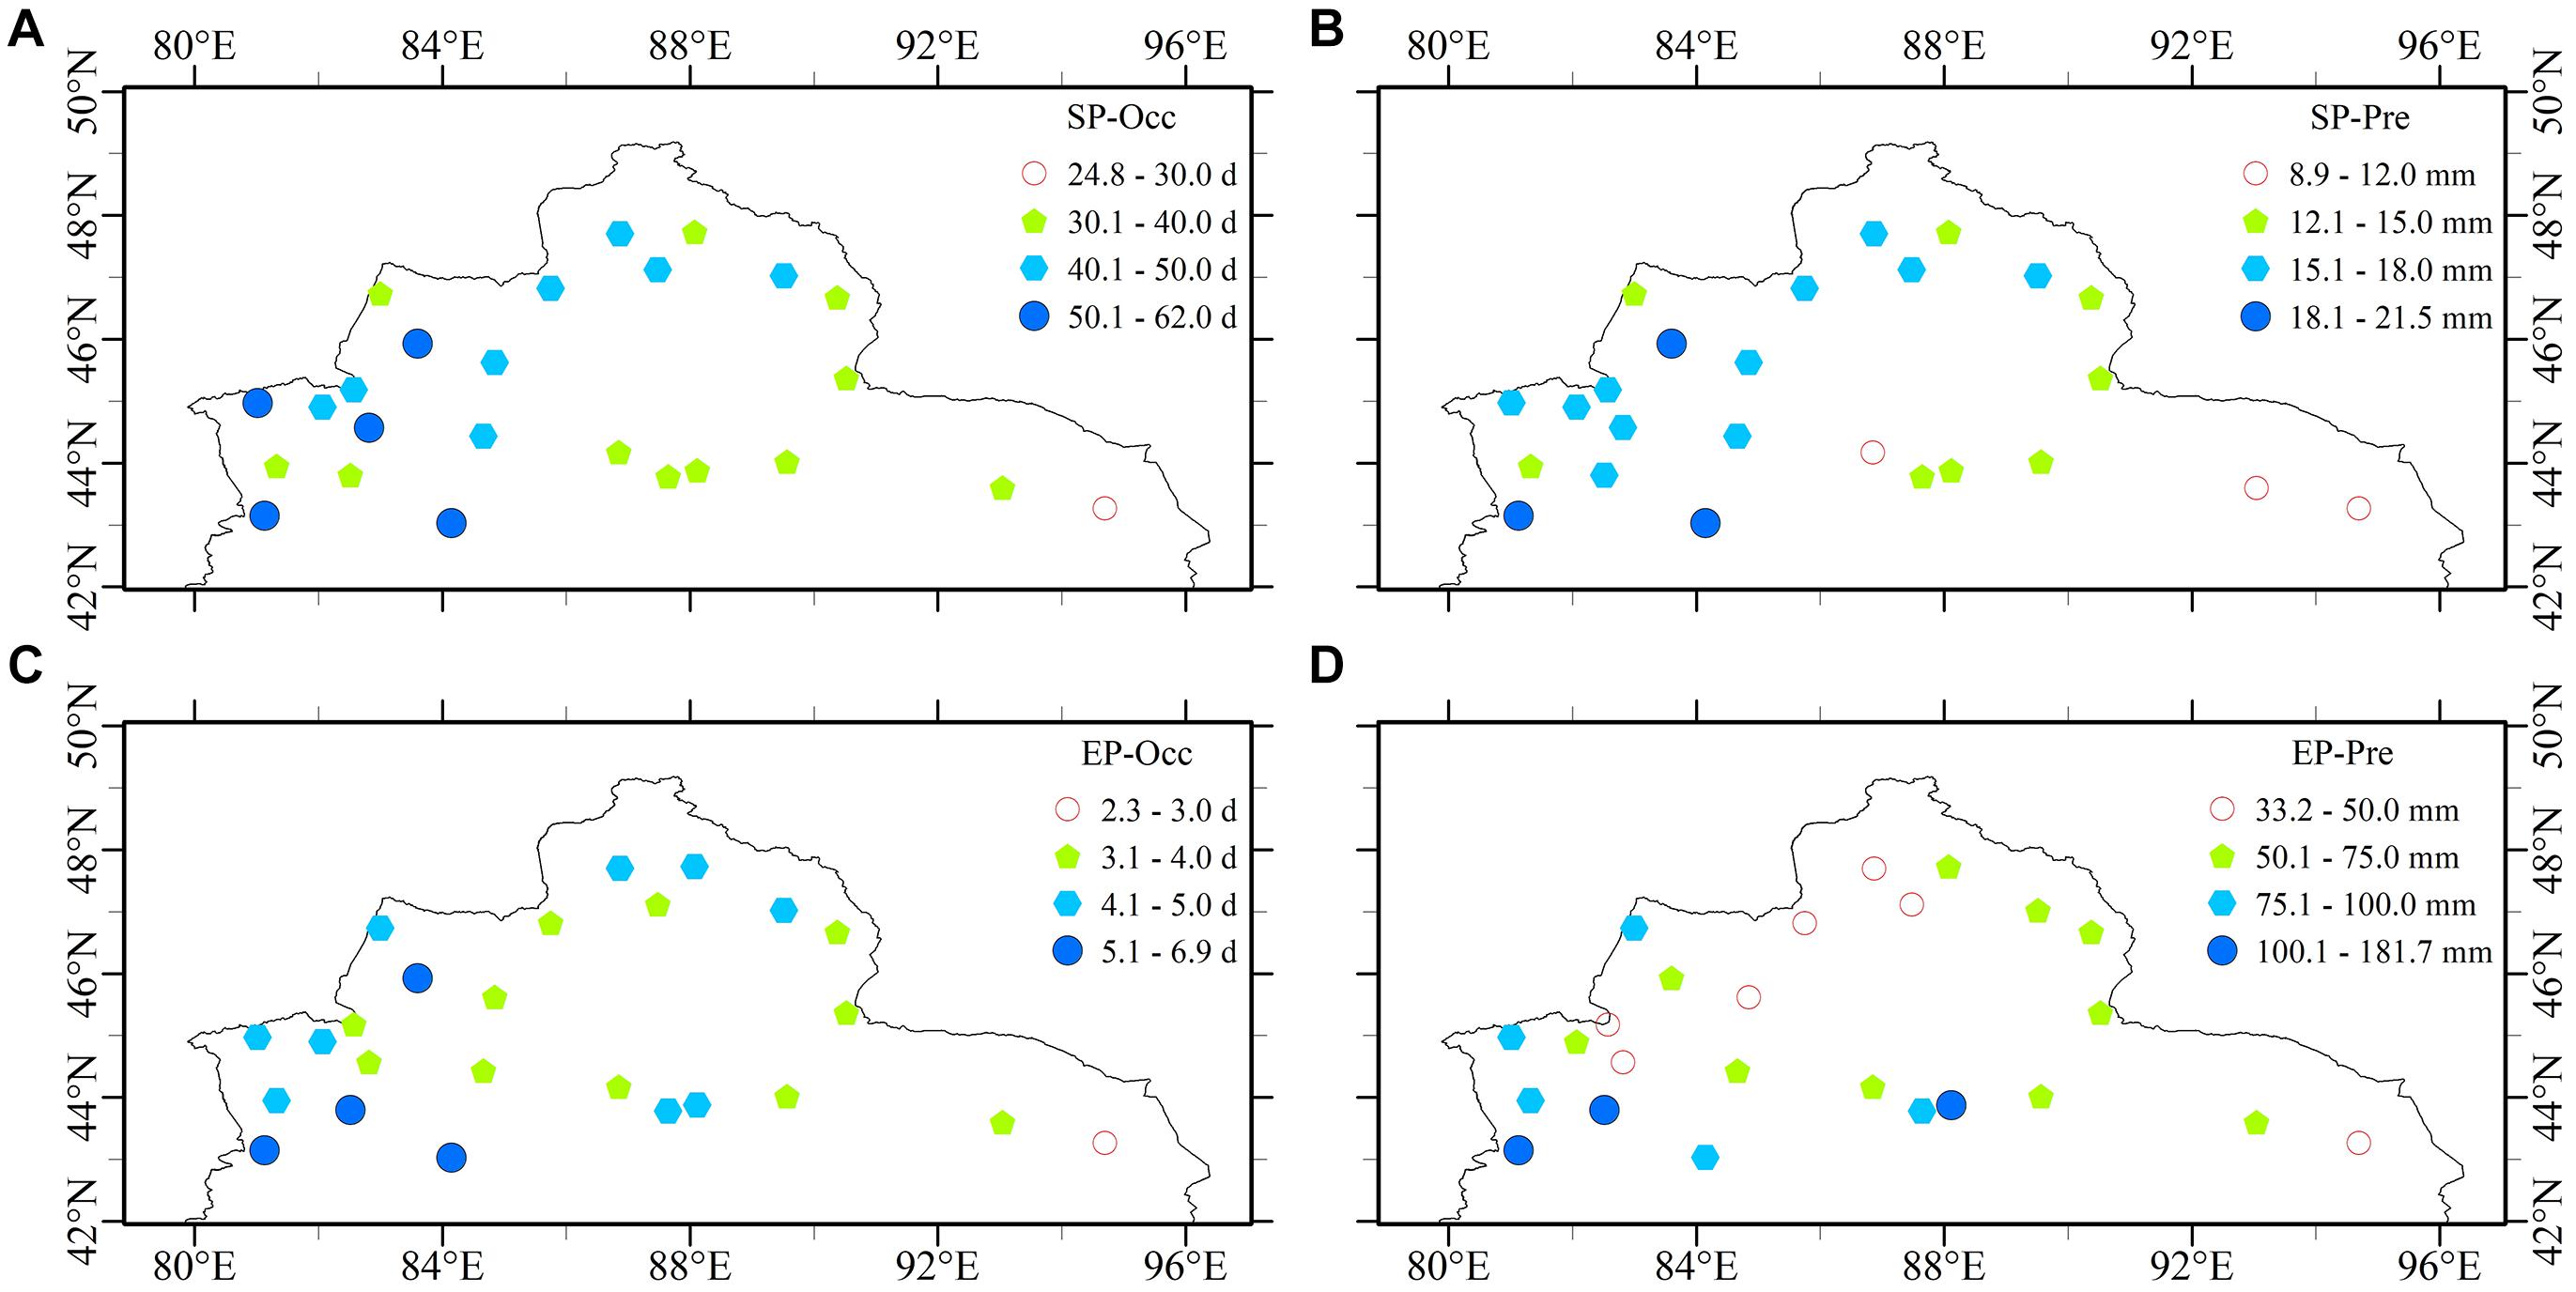
Figure 2. (A) Mean number of slight precipitation (SP) events per year, (B) mean total annual precipitation amount attributed to SP events, (C) mean number of extreme precipitation (EP) events per year, and (D) mean total annual precipitation amount attributed to EP events.
Slight precipitation events occur approximately 10 times more frequently than EP events at most stations across Northern Xinjiang, and there are some similarities between the spatial distributions for the different events (Figures 2A,C). For example, stations in the west experience more frequent EP and SP events than stations in the east, and the stations where EP events are most frequent are also the stations where SP events are most frequent. It is clear that EP events occur infrequently in Northern Xinjiang. Figure 2C shows that EP events occur fewer than five times per year at most stations, and the mean occurrence across all 25 stations is 4.2 days per year. This low frequency for EP events is consistent with the arid climate, which makes the annual number of wet days low in Xinjiang. The spatial pattern for event frequency, which shows EP and SP events to be more frequent in the west than in the east, is not apparent in the distribution of total precipitation amount attributable to EP events (Figure 2D) because the amount of precipitation from EP events in northwest parts of the Junggar Basin is low. The relatively higher annual precipitation amounts attributable to EP events occur at stations in southwest areas of Northern Xinjiang. The average annual precipitation amount attributable to EP events is between 50 and 100 mm at most stations, and the mean across all 25 stations is 69.3 mm, which suggests that EP events account for a large proportion of the total annual precipitation over Northern Xinjiang, and highlights potential risks that may arise from EP events. Note that there are three stations where the annual precipitation amount from EP events exceeds 100 mm, and that at one (Tianchi station) of these stations, it reaches 181.7 mm, showing that these areas are more strongly affected by EP events than other areas.
To better understand changes in SP and EP events at stations across Northern Xinjiang, we looked at linear trends in the contribution of SP and EP events to the total number of wet days and total annual precipitation amounts. The annual number of wet days that correspond to SP events is shown as a proportion of the total number of annual wet days in Figure 3A for each station. In agreement with previous research (Liao et al., 2012), the contribution of SP events to the total number of annual wet days is relatively high in Xinjiang; the regional mean is 49.5%, indicating that nearly half of all wet days in Xinjiang are SP events. The proportion of wet days that are accounted for by SP events is below 40% at only five stations, and the smallest proportion is 33.5%, meaning that SP events account for more than a third of the total number of wet days at all stations, as shown in Figure 3A. However, the linear trends show that the proportion of total wet days that are accounted for by SP events has decreased significantly over recent decades at most stations (Figure 3B). The trend is negative at all stations except one, and is statistically significant for two thirds of the stations. The decrease is particularly noticeable at stations around the Junggar Basin. The low intensity of SP events means that their contribution to the total annual precipitation amount is small (Figure 3C), despite the fact that they account for a large proportion of the total number of wet days. The mean contribution of SP events to the total precipitation amount across all 25 stations is 8.5%. The contribution is less than 10% at more than half of the stations across Northern Xinjiang, and is less than 15% at nearly all stations, with the exception of one station where the contribution is 16.5%. Trends in the contribution of SP events to the total number of wet days (Figure 3B) are similar to the trends in the contribution of SP events to total precipitation amount (Figure 3D). Both trends are positive for the same single station and negative at all other stations, and both trends are strongly decreasing at most stations around the Junggar Basin.
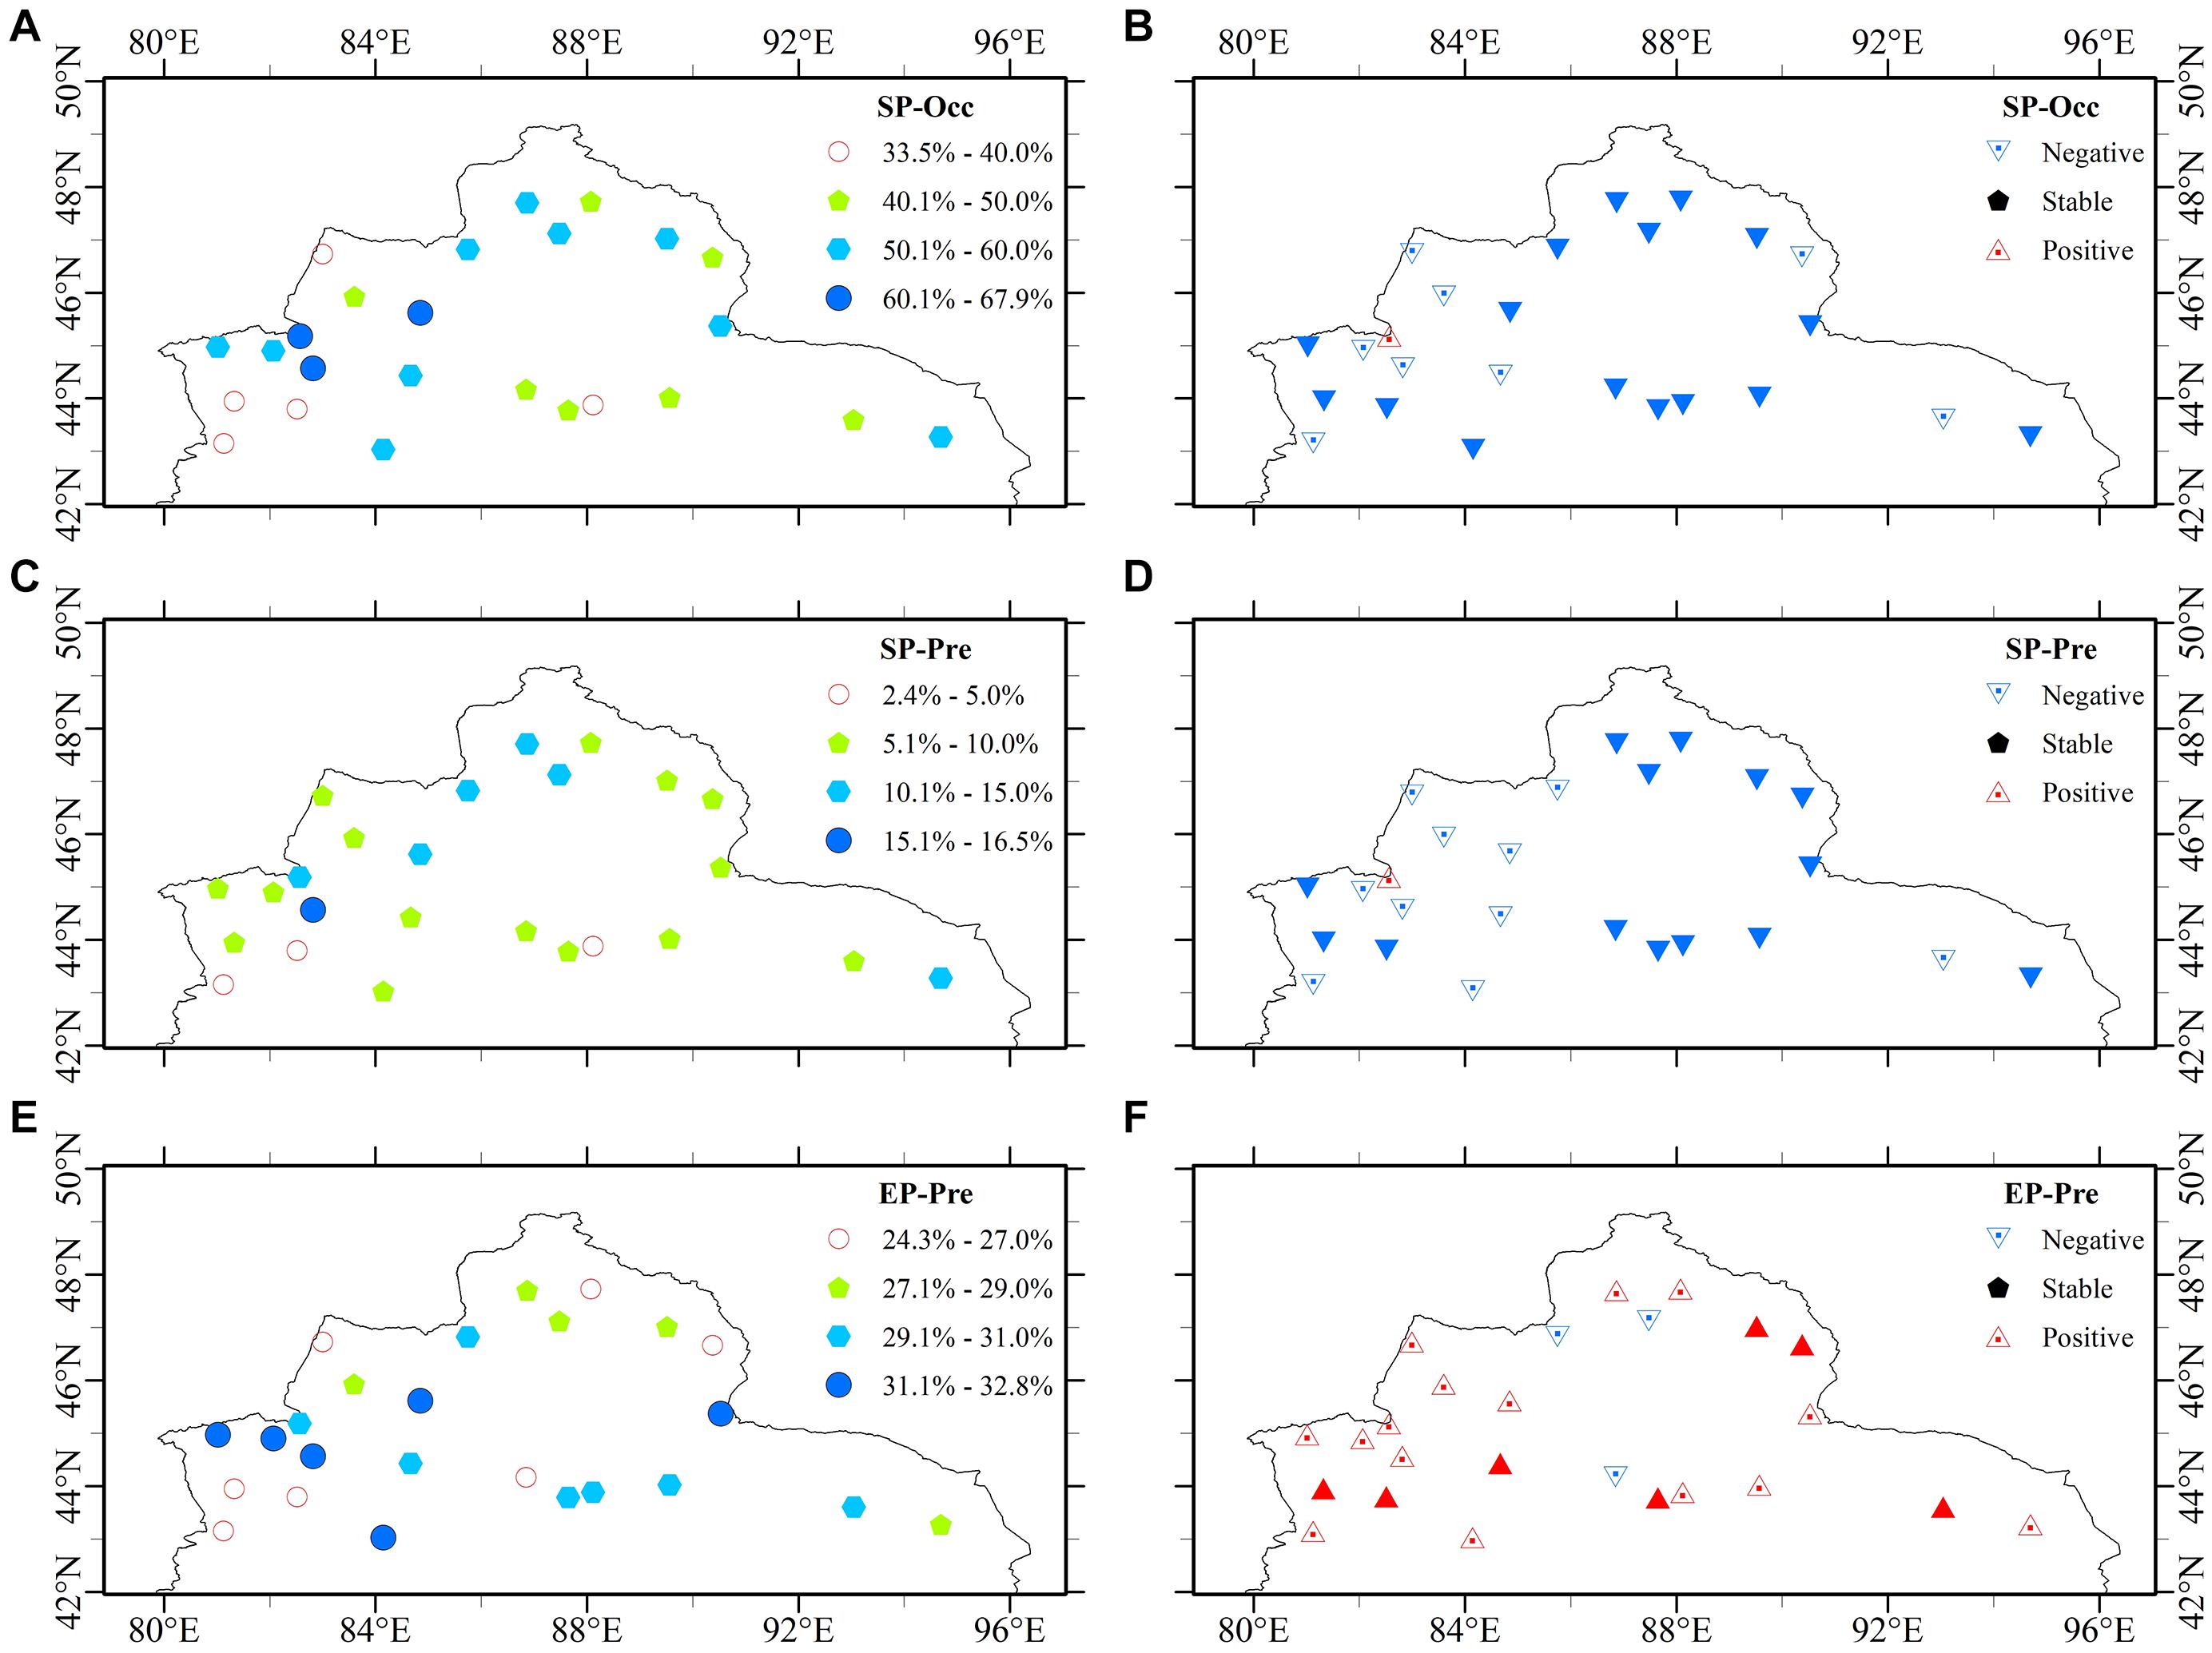
Figure 3. (A) The average contribution of SP events to the total annual number of wet days, (B) linear trends in the contribution of SP events to the total annual number of wet days over 55 years, (C) the contribution of SP events to the total annual precipitation amount, (D) linear trends in the contribution of SP events to the total annual precipitation amount over 55 years, (E) the contribution of EP events to the total annual precipitation amount, and (F) linear trends in the contribution of EP events to the total annual precipitation amount over 55 years. Solid triangles mark where the linear trends are significant at the 95% confidence level.
The contribution of EP events to the total annual precipitation amount ranges from 24.3 to 32.8% at stations across Northern Xinjiang (Figure 3E), and the average across all 25 stations is 28.8%. EP events typically have high intensity and therefore their contribution to the total annual precipitation amount generally exceeds the contribution of SP events, despite the fact that EP events account for only 5% of the total number of wet days at every station, which is much lower than for SP events. There existed a contrast in the contribution of EP events to the total precipitation amount at stations in the southwest of Northern Xinjiang; at three stations in this area, EP events account for less than 27% of total annual precipitation amount, while at four stations in this same area, EP events account for more than 31% of total annual precipitation amount. There are also differences in the Junggar Basin, where the contribution of EP events to the total precipitation amount is higher at stations in southern parts of the basin than at stations in northern parts of the basin. There are clear differences between the trends for the contributions of SP and EP events to the total annual precipitation amount (Figures 3D,F), and this is reflected in both the magnitude of the trends and in the degree to which they are significant. There is an increasing trend in the contribution of EP events to the total annual precipitation amount at most stations and it is negative at only three stations (Figure 3F). By contrast, the negative trend of the contribution of SP events to the total annual precipitation amount is observed at almost all the stations (Figure 3D). Moreover, the trends are significant with a confidence level of 95% at only seven stations (Figure 3F), while the trends for the contribution of SP events to the total annual precipitation amount are statistically significant at most stations (Figure 3D). The difference is particularly noticeable at stations around the Junggar Basin.
Figure 4 shows the proportion of the total number of annual wet days and total annual precipitation amount accounted for by SP and EP events averaged across all 25 stations, as well as the mean anomalies for the number of annual wet days and for the total annual precipitation amount. In agreement with Figures 3B,D, the regional averages for the proportion of annual wet days accounted for by SP events (Figure 4A), and for the contribution of SP events to the total annual precipitation amount (Figure 4B) decreased over the period from 1963 to 2017. Notably, both of these negative trends reflect a dramatic decline that began in the late 1990s and that there were no discernible trends between the early 1960s and the mid-1990s. Between 1963 and 1995, SP events accounted for 49.96% of wet days, and 7.23% of the total precipitation amount, which exceeds the 48.66 and 6.81% calculated for between 1963 and 2017. Most years where SP events accounted for an extremely low proportion of both wet days and the total precipitation amount were between 2000 and 2017. Over this period, the regional mean for the proportion of wet days accounted for by SP events was 46.05%, and the regional mean contribution of SP events to total precipitation amount was 6.05%, which are both relatively low.
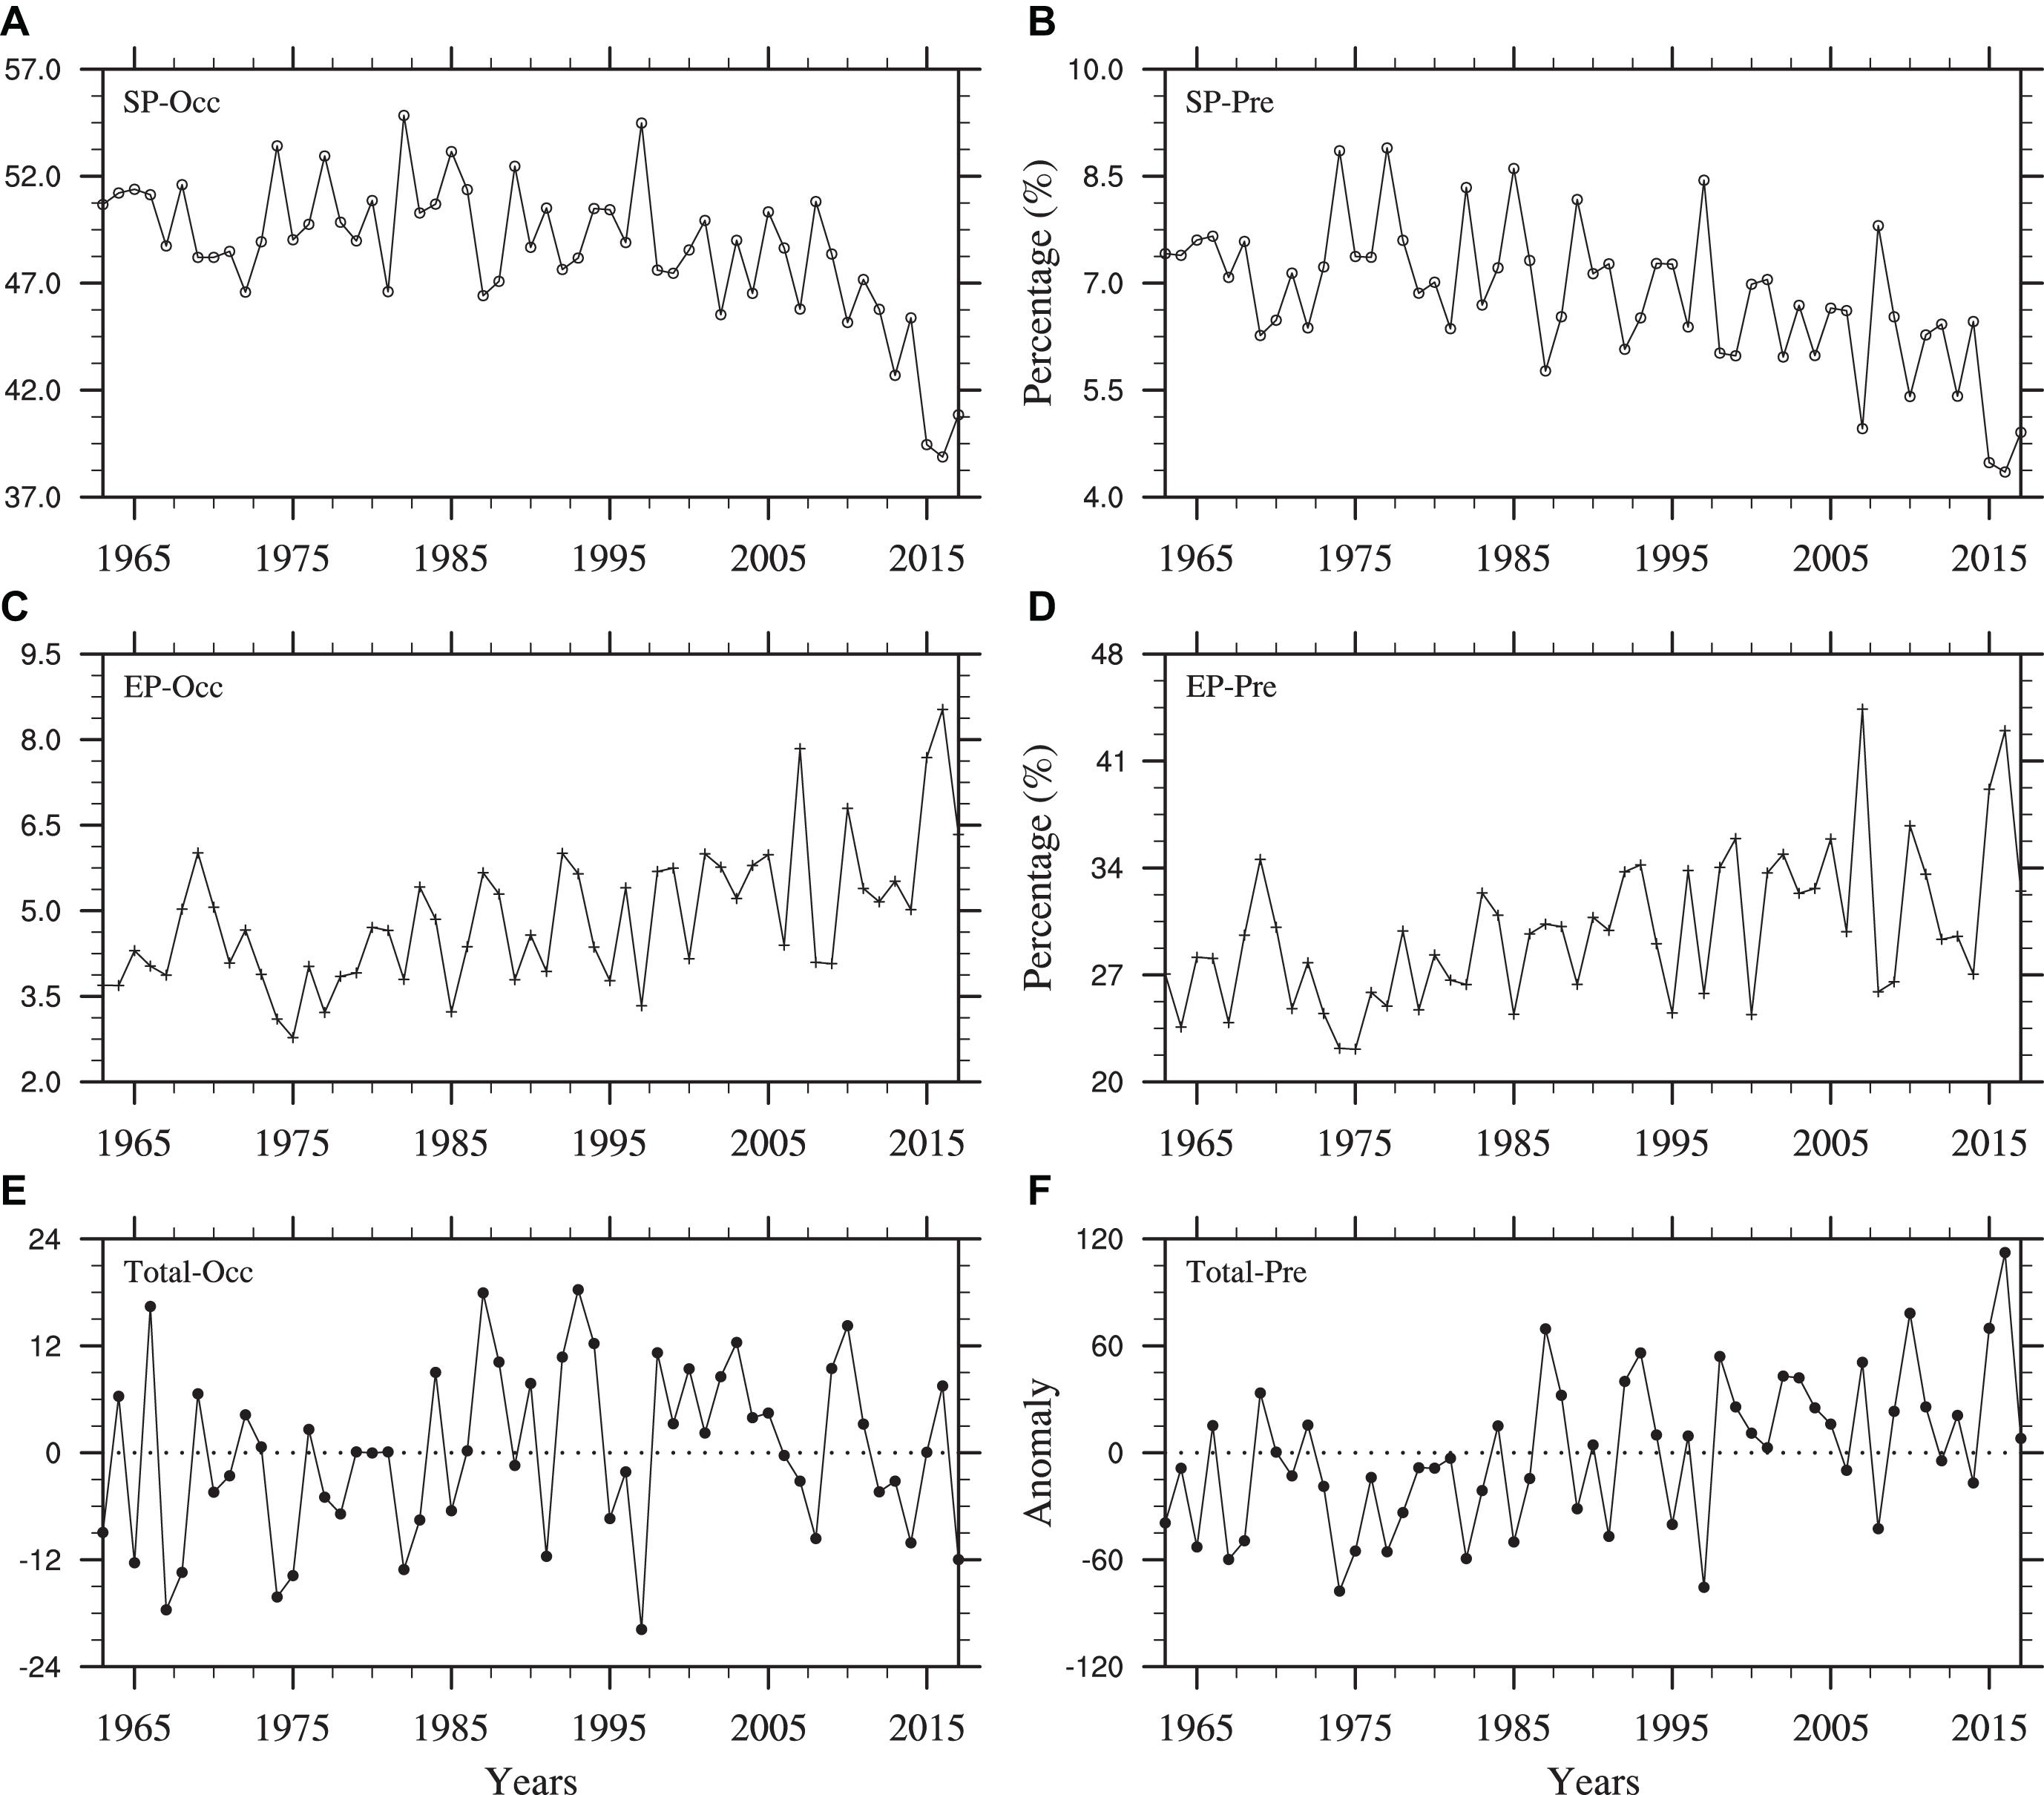
Figure 4. The regionally averaged contribution of SP and EP events (A,C) to the total number of annual wet days: (A) SP, and (C) EP; and (B,D) to the total annual precipitation amount: (B) SP, and (D) EP; (E) anomalies in the regionally averaged total number of annual wet days; (F) anomalies in the regionally averaged total annual precipitation amount. Plotted data are the means calculated over all 25 stations across Northern Xinjiang from 1963 to 2017.
In contrast, there were increasing trends over the study period for the proportion of annual wet days accounted for by EP events (Figure 4C), and for the contribution of EP events to the total annual precipitation amount (Figure 4D). Both of these measures gradually increased from a minimum in 1975, and the rate of increase for both measures increased over the study period, particularly after the early 2000s. The 3 years in which EP events made the greatest contribution to the total precipitation amount, and accounted for the greatest proportion of wet days, were 2007, 2015, and 2016. Between 2005 and 2017, EP events accounted for the largest proportions of both annual number of wet days and total precipitation amount (5.91 and 33.34%, respectively), which exceeds the mean contributions over both the whole study period (4.86 and 29.83%, respectively), and the period from 1963 to 2000 (4.41 and 28.25%, respectively). In addition to the opposing trends, there are further contrasts between the contributions of SP and EP events to the number of wet days and to the total precipitation amount. Both the correlation coefficient between the contribution of SP and EP events to total annual number of wet days and the correlation coefficient between the contribution of SP and EP events to total annual precipitation amount are −0.76. Particularly, in some years, when the proportional contribution of EP events was particularly high, the proportional contribution from SP events was usually low, and vice versa. For example, the proportion of wet days accounted for by EP events was extremely low in 1974, 1985, and 1997 (Figure 4C), when the proportion of wet days accounted for by SP events was very high (Figure 4A). As a further example, the contribution of EP events to the total precipitation amount was very high in 2007, 2015, and 2016 (Figure 4D), when the contribution from SP events was extremely low (Figure 4B).
There was a significant shift at around 1987 in the time series of both the total annual number of wet days (Figure 4E) and for the total precipitation amount (Figure 4F). The annual number of wet days in Northern Xinjiang typically oscillates on a decadal scale rather than following an upwards trend; there were relatively few wet days in the years before the mid-1980s, relatively more wet days in the years following the late 1990s, and a high number of wet days in the years between the mid-1980s and mid-1990s (Figure 4E). The increasing trend in the annual precipitation amount (Figure 4F) is more obvious than the trend in the number of annual wet days because the two quantities followed opposing trends from the early 2000s, which the annual number of wet days began a slight decline in the early 2000s, while the total annual precipitation amount continued to rise.
The impact of SP events on the number of wet days and EP events on the total annual precipitation amount was assessed for each station using the coefficient of determination, shown in Figure 5. The coefficient of determination between the annual number of SP events and the number of annual wet days ranges from 0.15 to 0.87 and the mean value across all 25 stations is 0.53 (Figure 5A). The coefficient of determination between the precipitation amount attributable to SP events and the total precipitation amount ranges from 0 to 0.21 (not shown). The coefficient of determination between the annual number of EP events and the total annual number of wet days ranges from 0.02 to 0.34 (not shown), and the coefficient of determination between the precipitation amount attributable to EP events and the total annual precipitation amount ranges from 0.46 to 0.81 (Figure 5B). In agreement with our earlier findings in Figures 3, 4, SP events influence the annual number of wet days more strongly than the total precipitation amount, while the converse is true for EP events.
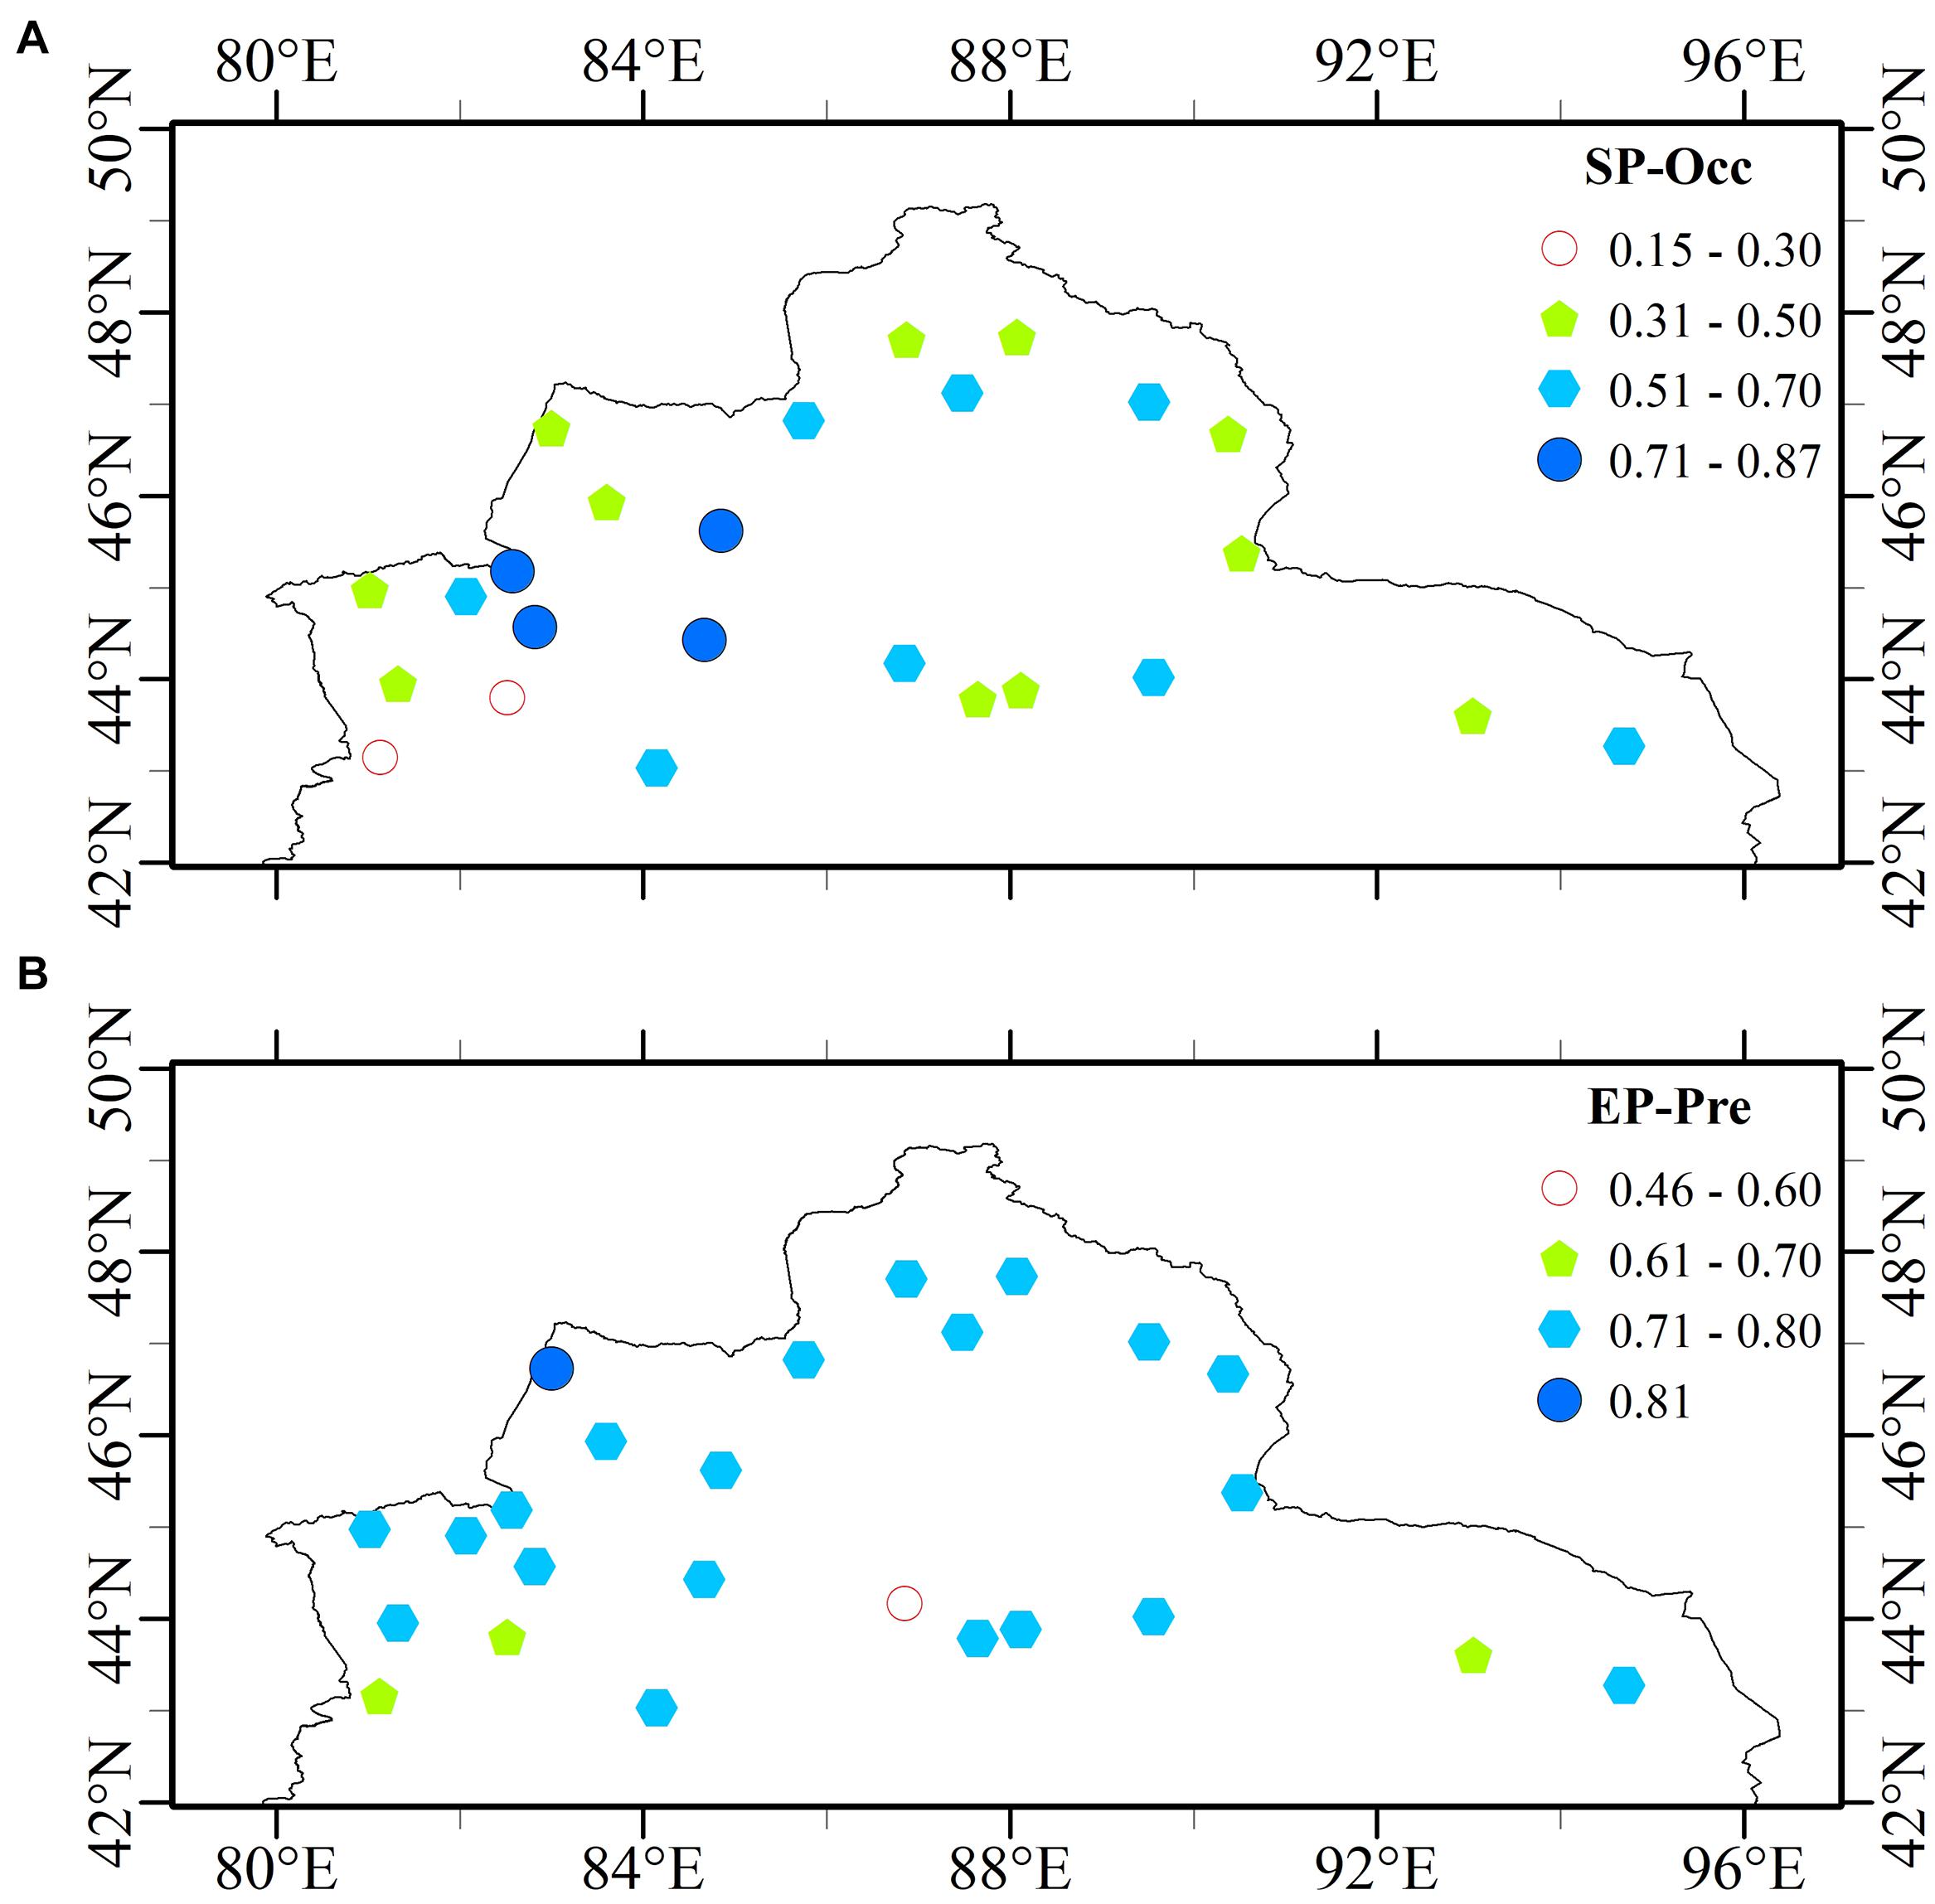
Figure 5. The coefficient of determination at each station in Northern Xinjiang for: (A) the annual occurrence of SP events and the annual number of wet days, and (B) the annual precipitation amount attributable to EP events and the total annual precipitation amount.
Slight precipitation events occur frequently and contribute strongly to the total number of wet days, but they have a low intensity and so the annual precipitation amount attributable to SP events, and the proportion of the total annual precipitation amount that this accounts for, is therefore small. The situation is reversed for EP events. Since EP events are intense, the annual precipitation amount from EP events, and the contribution of this to the total annual precipitation amount, is high, despite the infrequent occurrence of EP events and their small contribution to the total number of wet days. Notice that the annual number of wet days increased in Northern Xinjiang over recent decades, means that the decrease in frequency of SP event was offset by the increase in frequency of other precipitation events. Especially in the period before the late 1990s, when the decrease of SP events is not very fast.
A few previous studies have focused on the changes in the precipitation for different grades at some Xinjiang stations, and they show that the constant decline in slight precipitation frequency at Urumchi station and stations in the Bole region (on the southwest side of the Junggar Basin) was well-defined between the 1960s and 2000s (Xin et al., 2008; Zheng et al., 2014), and a significantly lower frequency was also found in the 2000s. This is consistent with our results and proves the importance of changes in precipitation events with lower intensity in Xinjiang.
Concentration of SP and EP Events Over Northern Xinjiang
We investigated the intra-annual features of the characteristics of the SP and EP events, and of the long-term changes to these, using the measures of CD and CP described in see section “Methods.” The CD and CP values for the SP and EP events at each station in Northern Xinjiang are shown in Figure 6, with all of the values from the study period being classified into different categories. The CD values for SP are typically <0.3 at most stations (Figure 6A), which implies that the concentration of SP events is generally low in Northern Xinjiang. The number of years for which CD is less than 0.3 ranges from 29 to 54 across the stations, which means that CD is relatively small for more than half the study period at all stations in Northern Xinjiang; in fact, CD is rarely greater than 0.5 at any station for any year in the study period. This suggests that SP events are generally spaced over several months in Northern Xinjiang, and the distribution of CP for SP events in Figure 6B supports this conclusion. CP for SP events includes three or four seasons for most stations, with a significant peak for one season. At some stations, the probability is nearly equal for all four seasons, showing that SP events occur in all months with nearly equal frequency at these stations. The CP for SP events from all 55 years occurred primarily in winter (DJF), and secondly in autumn (SON), particularly for stations around the Junggar Basin. Overall, CP varies between regions and winter is the dominant CP for most, but not all, stations in Northern Xinjiang. For example, the CP for SP events occurred mainly in spring (MAM) at some stations in the southwest.
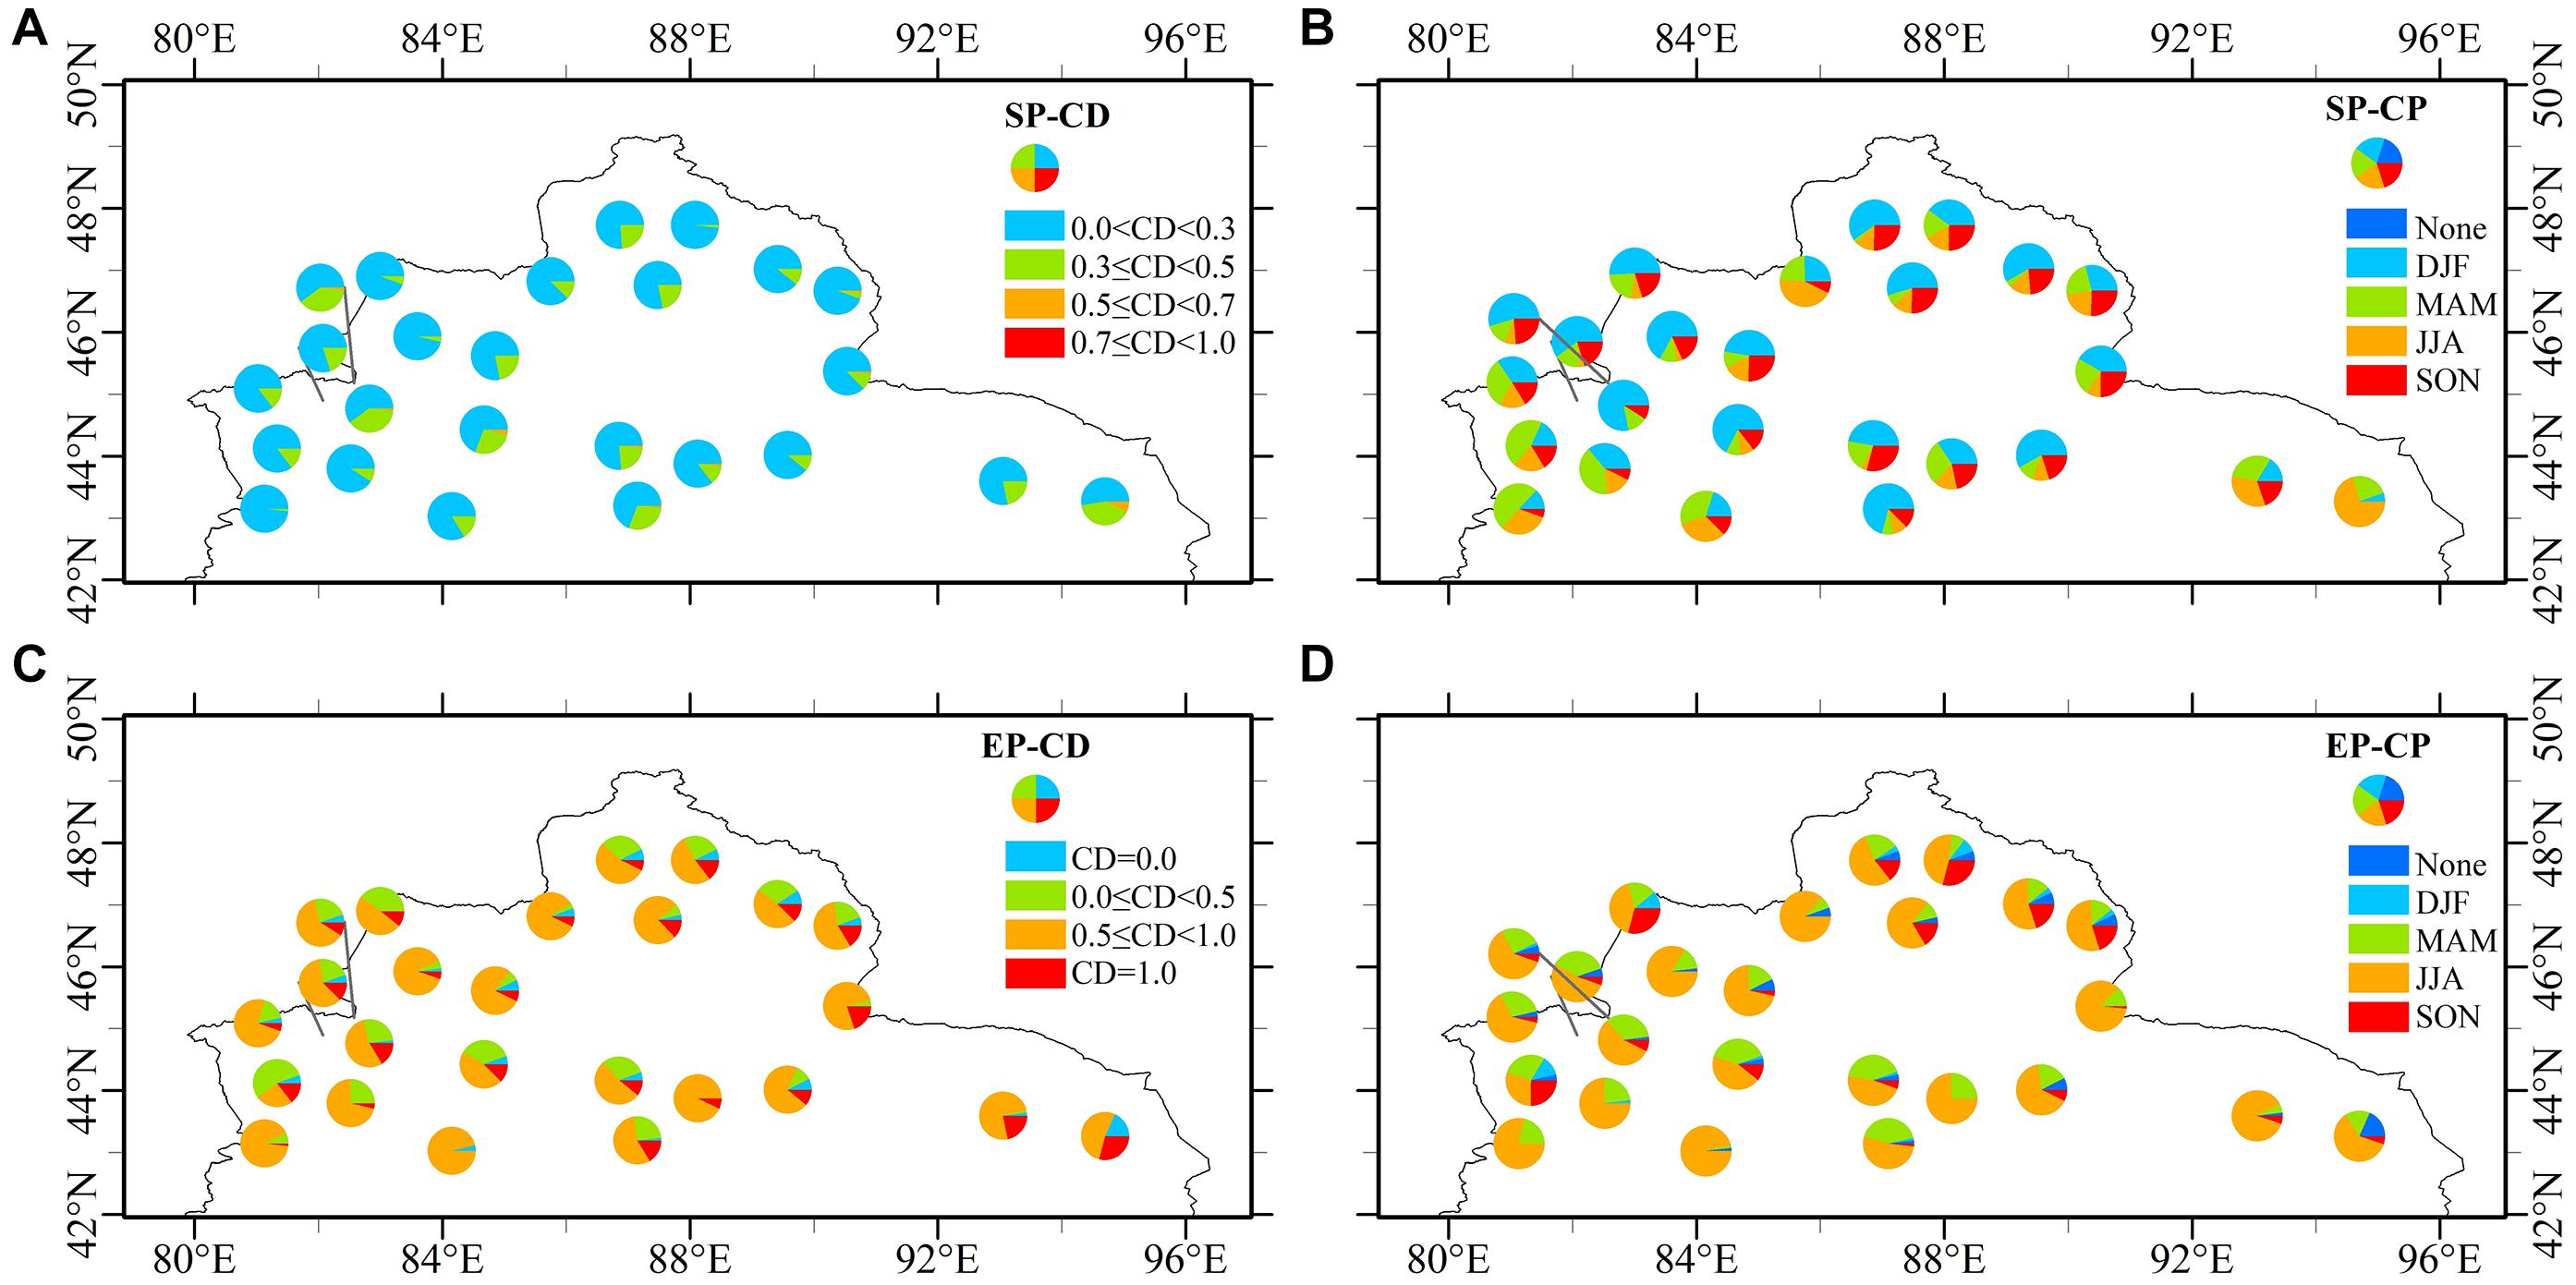
Figure 6. Annual values of (A) CD, and (B) CP for SP events at each station in Northern Xinjiang from 1963 to 2017; (C,D) are as (A,B), but for EP events. (Values of 55 years were classified into different categories).
There are some years in which CD is 1 (or 0) for EP events (Figure 6C), reflecting the fact that only one EP event occurred (or none). Apart from these two cases, CD for EP events is greater than 0.5 for most years at most stations, suggesting that EP events are concentrated in time on an intra-annual scale. However, it should be noted that at some stations, CD is less than 0.5 for more than a quarter of the years included in the study period, indicating that EP events were spaced further apart in time in those years. The most common CP for EP events between 1963 and 2017 was in summer (JJA; Figure 6D), but MAM is the second most probable season for EP event occurrence. The mean number of years for which the CP was in MAM, averaged across all 25 stations, is 11.8, which is nearly a third of the number of years for which it was in JJA, and twice the number of years for which most EP events occur in SON. The low annual frequency and high CD values for EP events imply that EP events in Northern Xinjiang are most likely to occur in the warmer seasons, which is very different to the timing of SP events.
There are clear inter-annual and long-term variations in SP and EP events (Figure 4), and both exhibit notable intra-annual variability. The inter-annual variability of CD for EP and SP events is shown at a regional scale in Figure 7 and suggests that the concentration of both SP and EP events has changed in recent decades. Moreover, the changes to CD for SP and EP events are related to long-term trends in SP and EP events. There is a significant upward trend in regionally averaged CD values for SP events (Figure 7A), which results from a marked shift from lower to higher values around the late 1990s that is clearly related to changes in the frequency of SP events (Figure 4A). In contrast, there is notable decline in the regionally averaged CD values for EP events (Figure 7B). This decrease is clearly relevant to the increased frequency of EP events over recent decades (Figure 4C) because an increase in event frequency can easily lead to a decrease in event concentration, particularly when the increase does not occur in the main season.
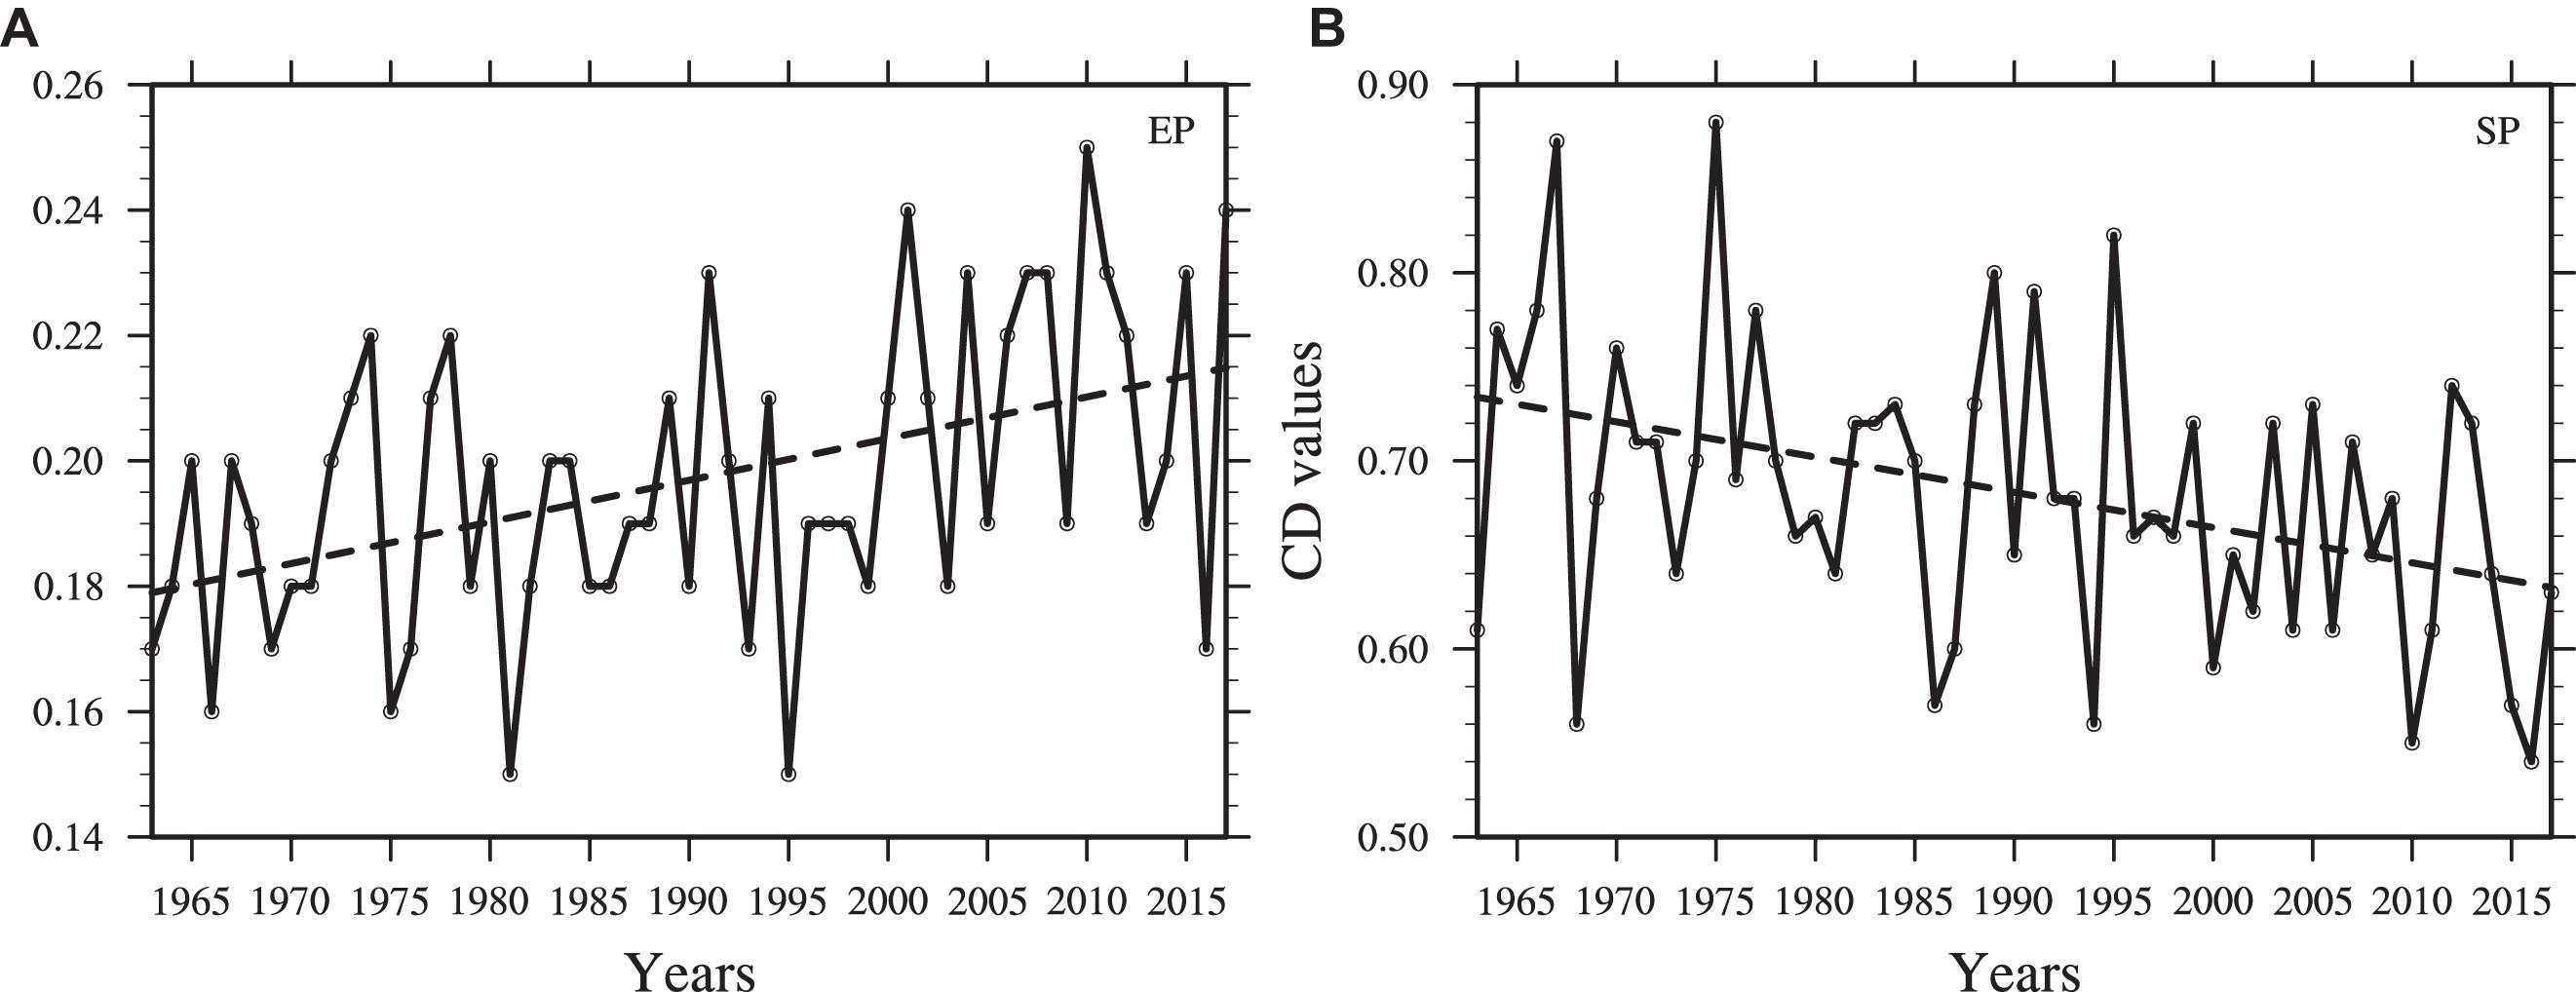
Figure 7. Regionally averaged CD for: (A) SP, and (B) EP events over Northern Xinjiang from 1963 to 2017.
The large difference between the concentration of SP and EP events originates from the significant differences in the statistical characteristics of SP and EP events, including in their mean annual frequency and the trends they have followed over recent decades. The annual frequency for SP events is high and they may occur in almost any month in a year, while EP events are less frequent and usually occur in the warmer months, when the air column is warmer and can hold more water vapor. As a result, EP events are more concentrated than SP events over the course of a year. In addition, due to the opposing trends for SP and EP event frequency, trends in the concentration of SP and EP events are also opposing.
Connections Between Precipitation Distribution and Daily Mean Temperature
The seasonal variations in the frequency of SP and EP events suggests that air temperature may also influence their occurrence. We used the empirical orthogonal function (EOF) method to assess how the spatial distribution of precipitation varies with daily mean temperature. To be specific, the occurrence of SP and EP events at each daily mean temperature were checked for every Northern Xinjiang station, then the temperature range of SP and EP occurrence for the whole region was calculated. At each station, for each degree in the temperature range covering the SP events, the number of SP events was counted and we then calculated the mean intensity of these SP events. The frequency (or intensity) of the SP events from the 25 stations varied with the different daily mean temperatures and can be seen as a spatiotemporal field, as can that of EP event frequency and EP event intensity. The EOF analysis was then performed on the original values of these four fields, and four first modes were obtained. These first modes for the variations in SP and EP events with temperature are shown in Figures 8, 9, and the variance contributions of EOF1 from SP event frequency, SP event intensity, EP event frequency, and EP event intensity were 81.3, 91.8, 70.9, and 81.2%, respectively. All of the first eigenvectors are positive over the whole of Northern Xinjiang (Figure 8), and the differences between them reflect the distribution of areas where their individual values are high. The first eigenvector from the EOF analysis of the variability in the frequency of SP events with temperature has a high value in western areas, including the northwest part of the Junggar Basin and the western part of the Tianshan mountains (Figure 8A). The region where the first eigenvector for the EOF analysis of the variability in SP event intensity with temperature has high values is the northeastern area of Junggar Basin (Figure 8B). For the analysis of EP event frequency with temperature, the first eigenvector has a positive maximum in the western part of the Tianshan mountains (Figure 8C), and the first eigenvector for the analysis of variability in EP event intensity with temperature is in the southern part of the Junggar Basin (Figure 8D).
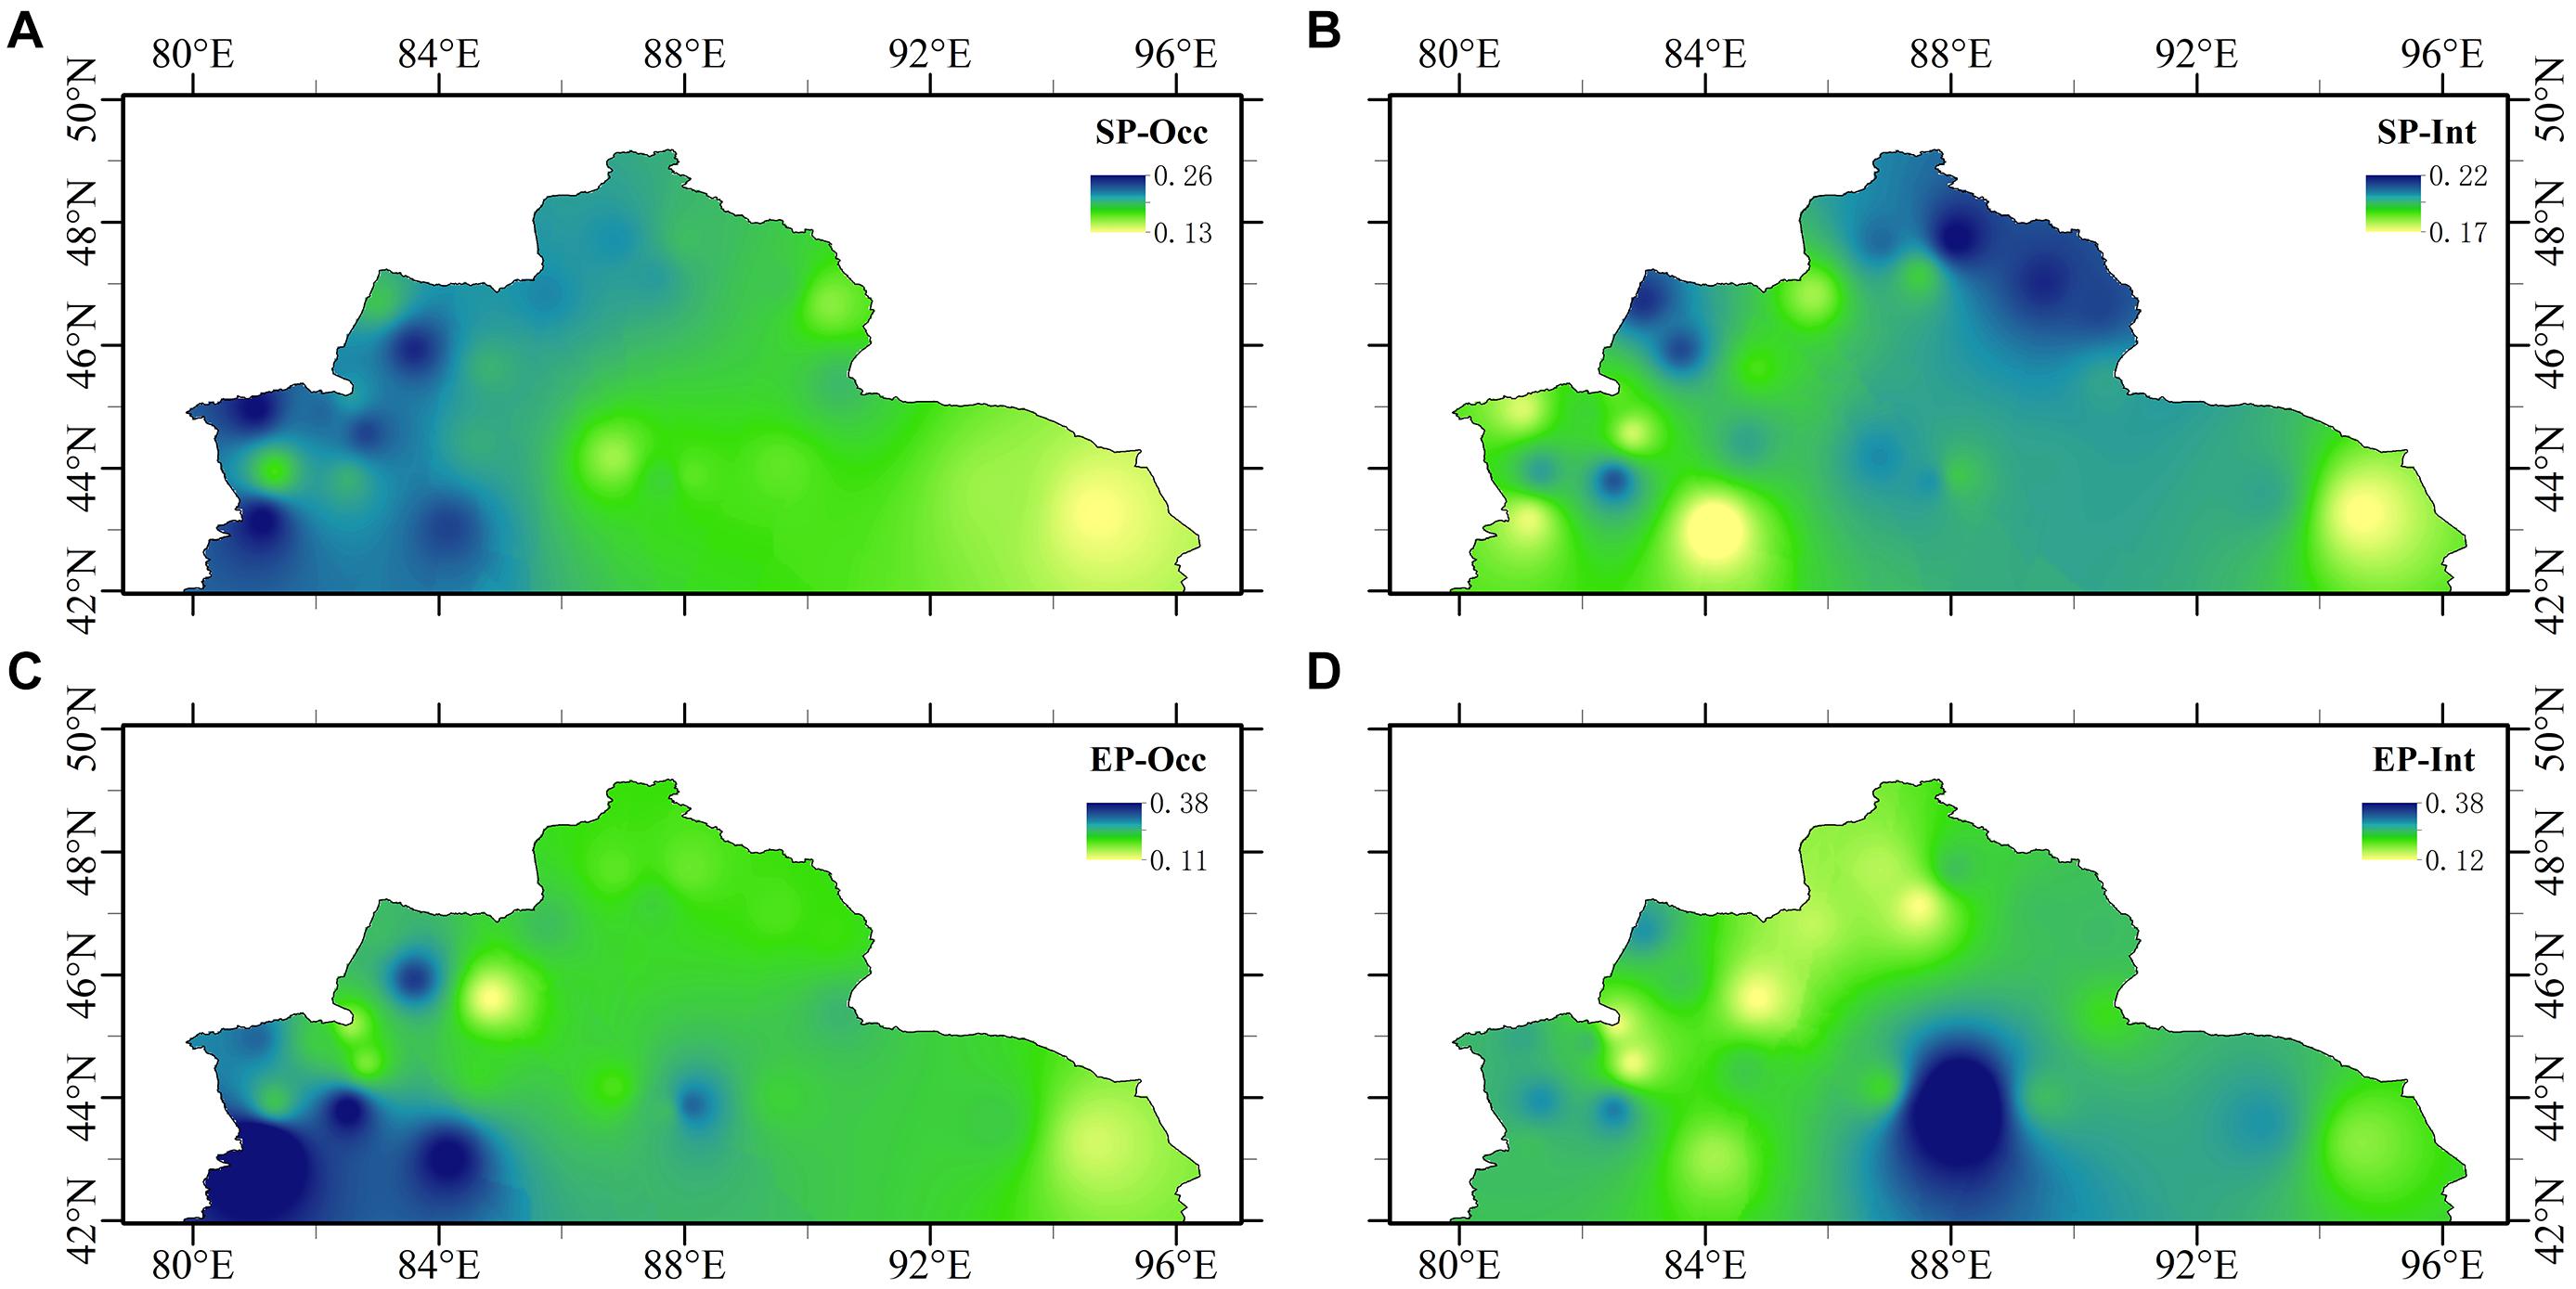
Figure 8. The first eigenvectors from the EOF analysis of variations in (A) SP event frequency, (B) SP event intensity, (C) EP event frequency, and (D) EP event intensity with daily mean temperature change.
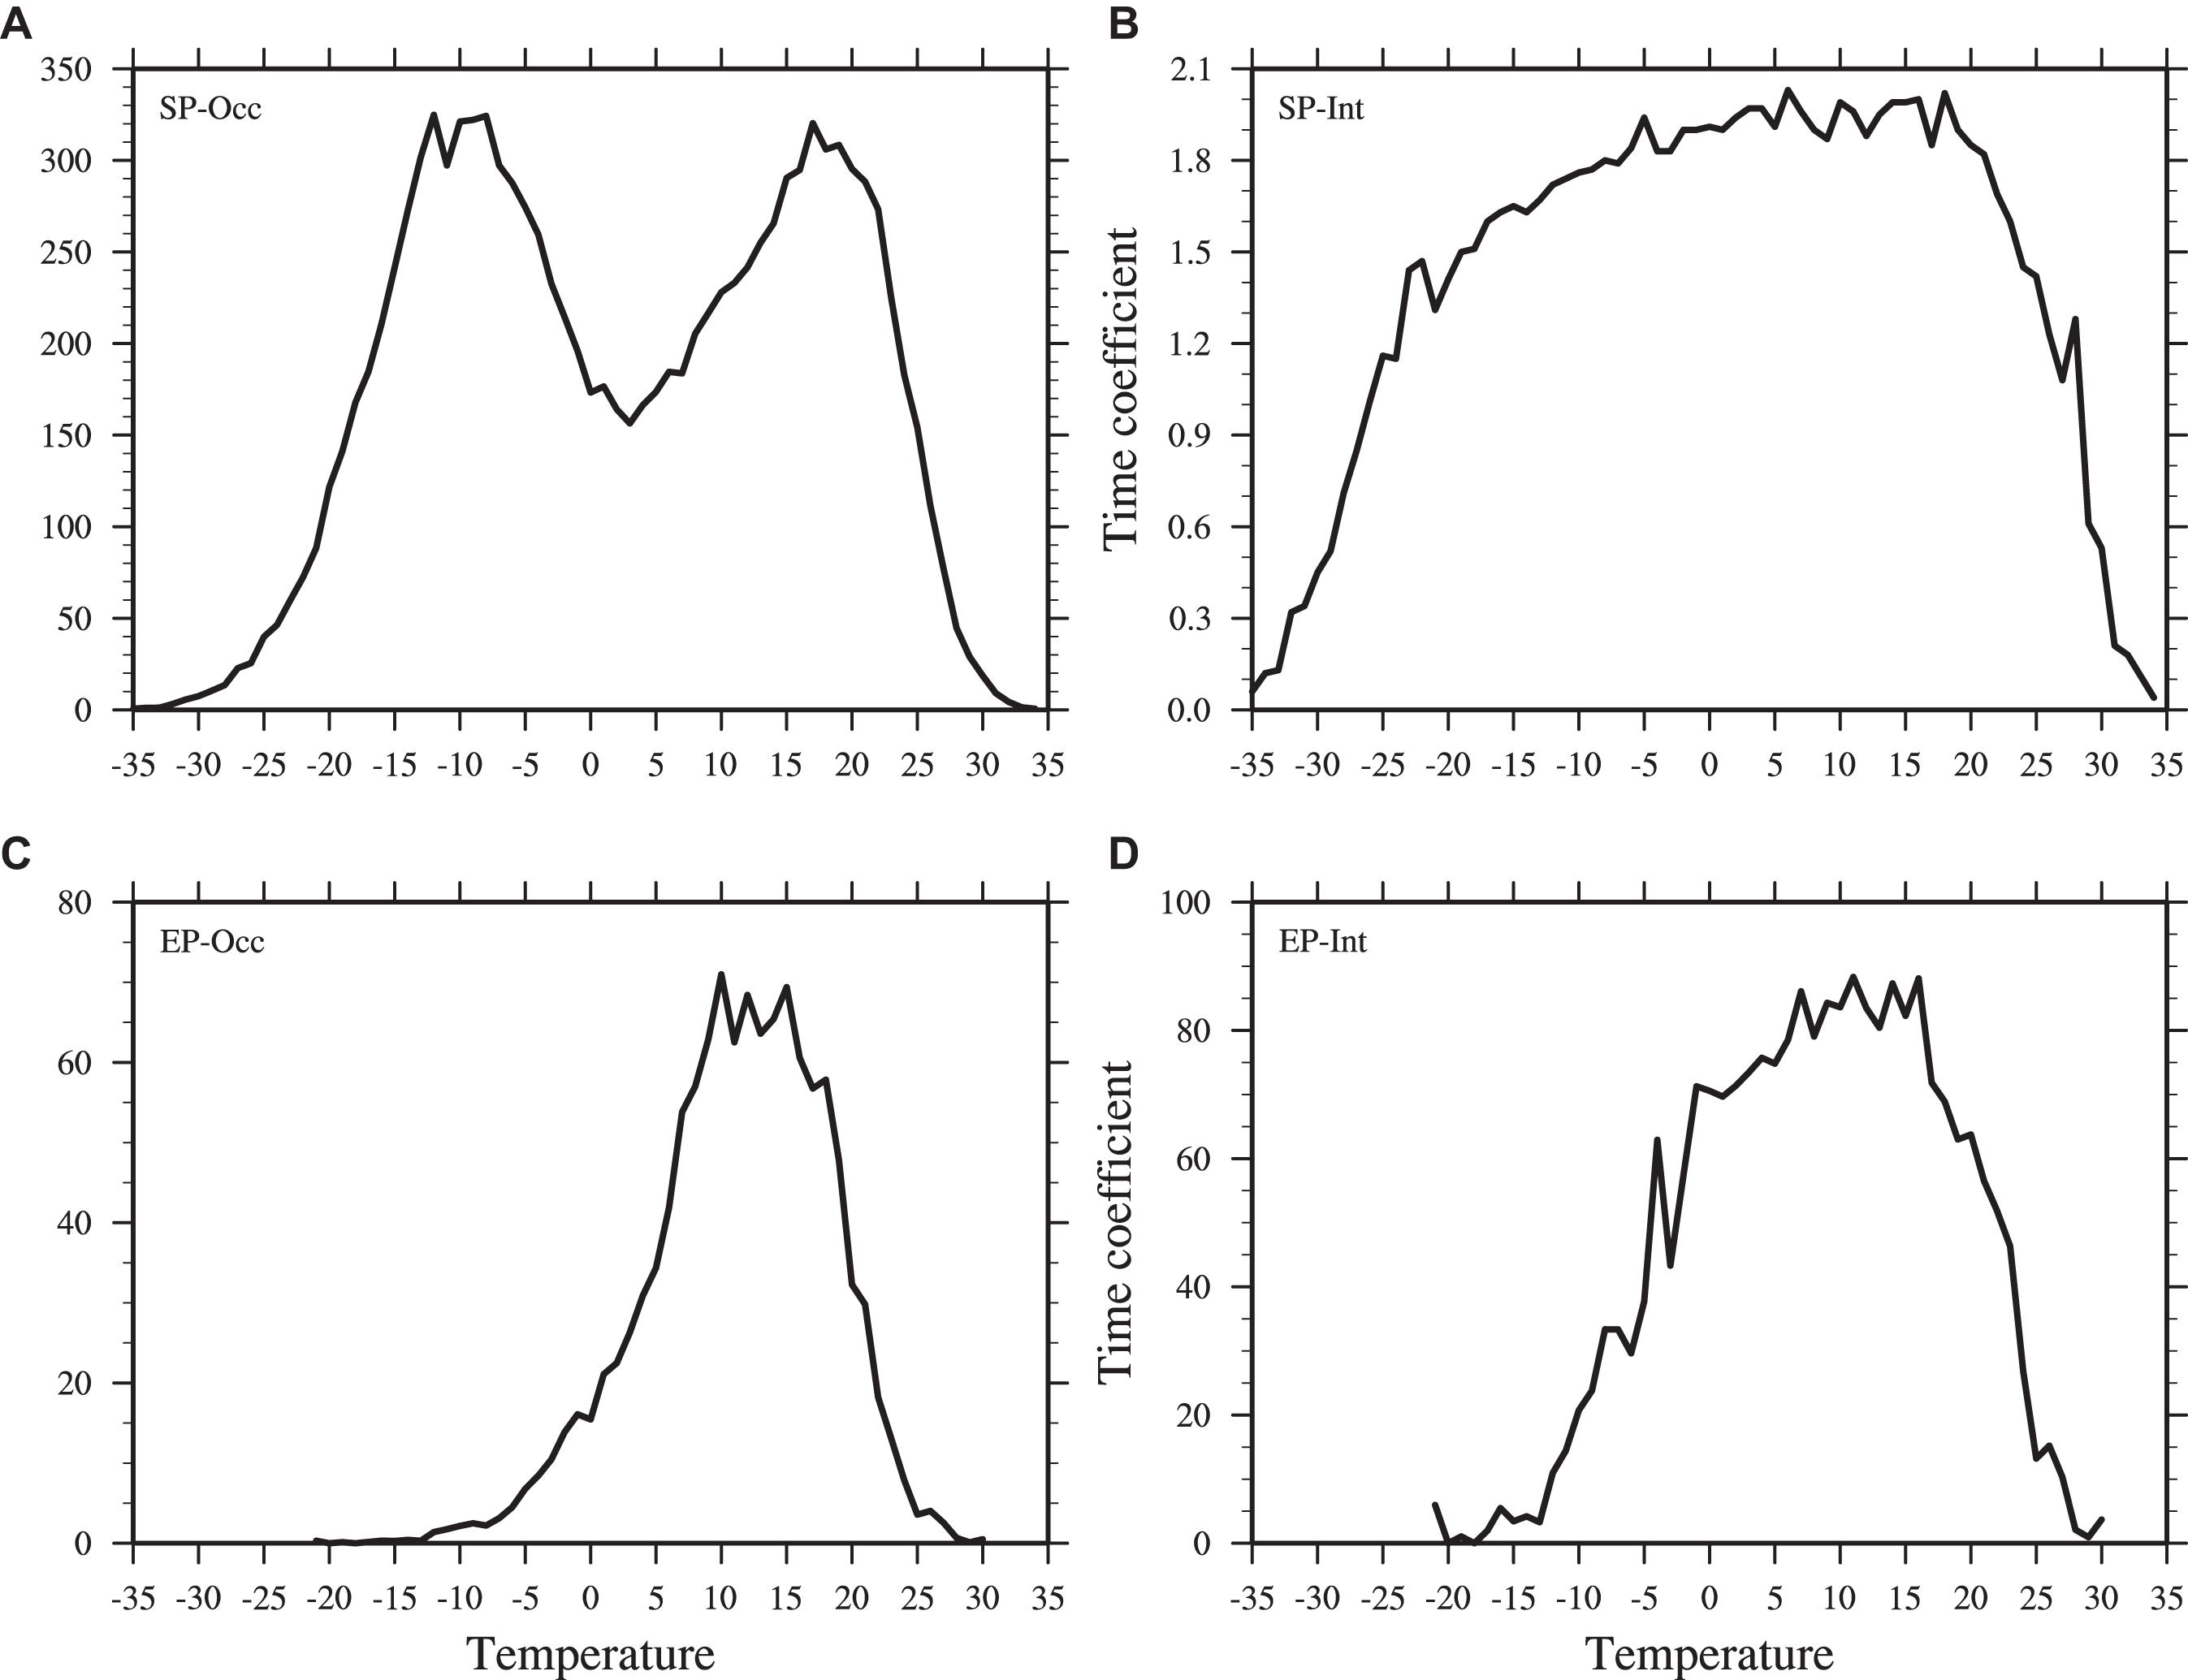
Figure 9. The time coefficient of the first modes from the EOF analysis of variations in (A) SP event frequency, (B) SP event intensity, (C) EP event frequency, and (D) EP event intensity with daily mean temperature change.
Although the locations of the maxima for the eigenvectors differ between the analysis of the SP and EP events, there are some similarities in the spatial distribution of the first eigenvector for the analysis of both events. However, the time coefficient from the EOF analysis of changes in SP and EP events with temperature is very different for the SP and EP events (Figure 9). SP events occur within a daily mean temperature range of –35 to +34°C and EP events occur within –21 to +30°C. There are two maxima for the variability of SP event frequency within the daily mean temperature range of –35 to +34°C: one from –14 to –5°C, and one from 14 to 22°C (Figure 9A). There is a temperature interval between these two peaks that corresponds to relatively low variability for the occurrence of SP events, but the variabilities in this interval is still larger than that in the intervals between –18 and –35°C and between 25 and 34°C. The variability of the intensity of SP events varies slowly with temperature, gradually increasing between –35 and +18°C, then dropping notably (Figure 9B). Apart from differences in the temperature range, the most obvious difference between the distributions of variability for SP and EP event frequency with temperature is that there is only one maximum for EP event frequency with temperature (Figure 9C). As shown in Figure 9C, EP events occur more frequently in the temperature interval 7 to 18°C, and less frequently below 2°C and above 21°C. Compared with the results for SP events, changes in the intensity of EP events with temperature are more dramatic and there is a peak at temperatures between 6 and 16°C, where EP event intensity is clearly higher, while the intensity of EP events quickly drops at temperatures above 16°C (Figure 9D).
Precipitation in many areas around the world has changed strikingly in response to the warming climate (IPCC, 2013). To understand the connections between changes in temperature and SP and EP events in Northern Xinjiang, we calculated the trends for the annual frequency of different daily mean temperatures and that of SP and EP events at different daily mean temperatures; these trends are shown in Figure 10 alongside their climatic averages. The daily mean temperature in Northern Xinjiang generally ranges from –35 to +34°C, and has a distribution with two peaks, and the mean number of days each year that fall within each 1° division of this range is 5.21 (Figure 10A). The first peak is low and flat and ranges from –9 to –6°C, within which temperature range the average annual frequency remains above 7 days. The second peak is more prominent and ranges from 9 to 23°C, within which range the average annual frequency remains above 8 days. Consistent with the warming climate over recent decades, the frequency of warm daily mean temperatures (above 18°C) has increased, and the frequency of cold daily mean temperatures (below –15°C) has decreased. There is no significant trend in the frequency of days where the mean temperature is between –15 and 18°C, but there are continuous upward and downward trends for daily mean temperatures within smaller ranges inside this interval, for example there is a negative trend in the frequency of daily mean temperatures between 0 and 17°C (Figure 10A).
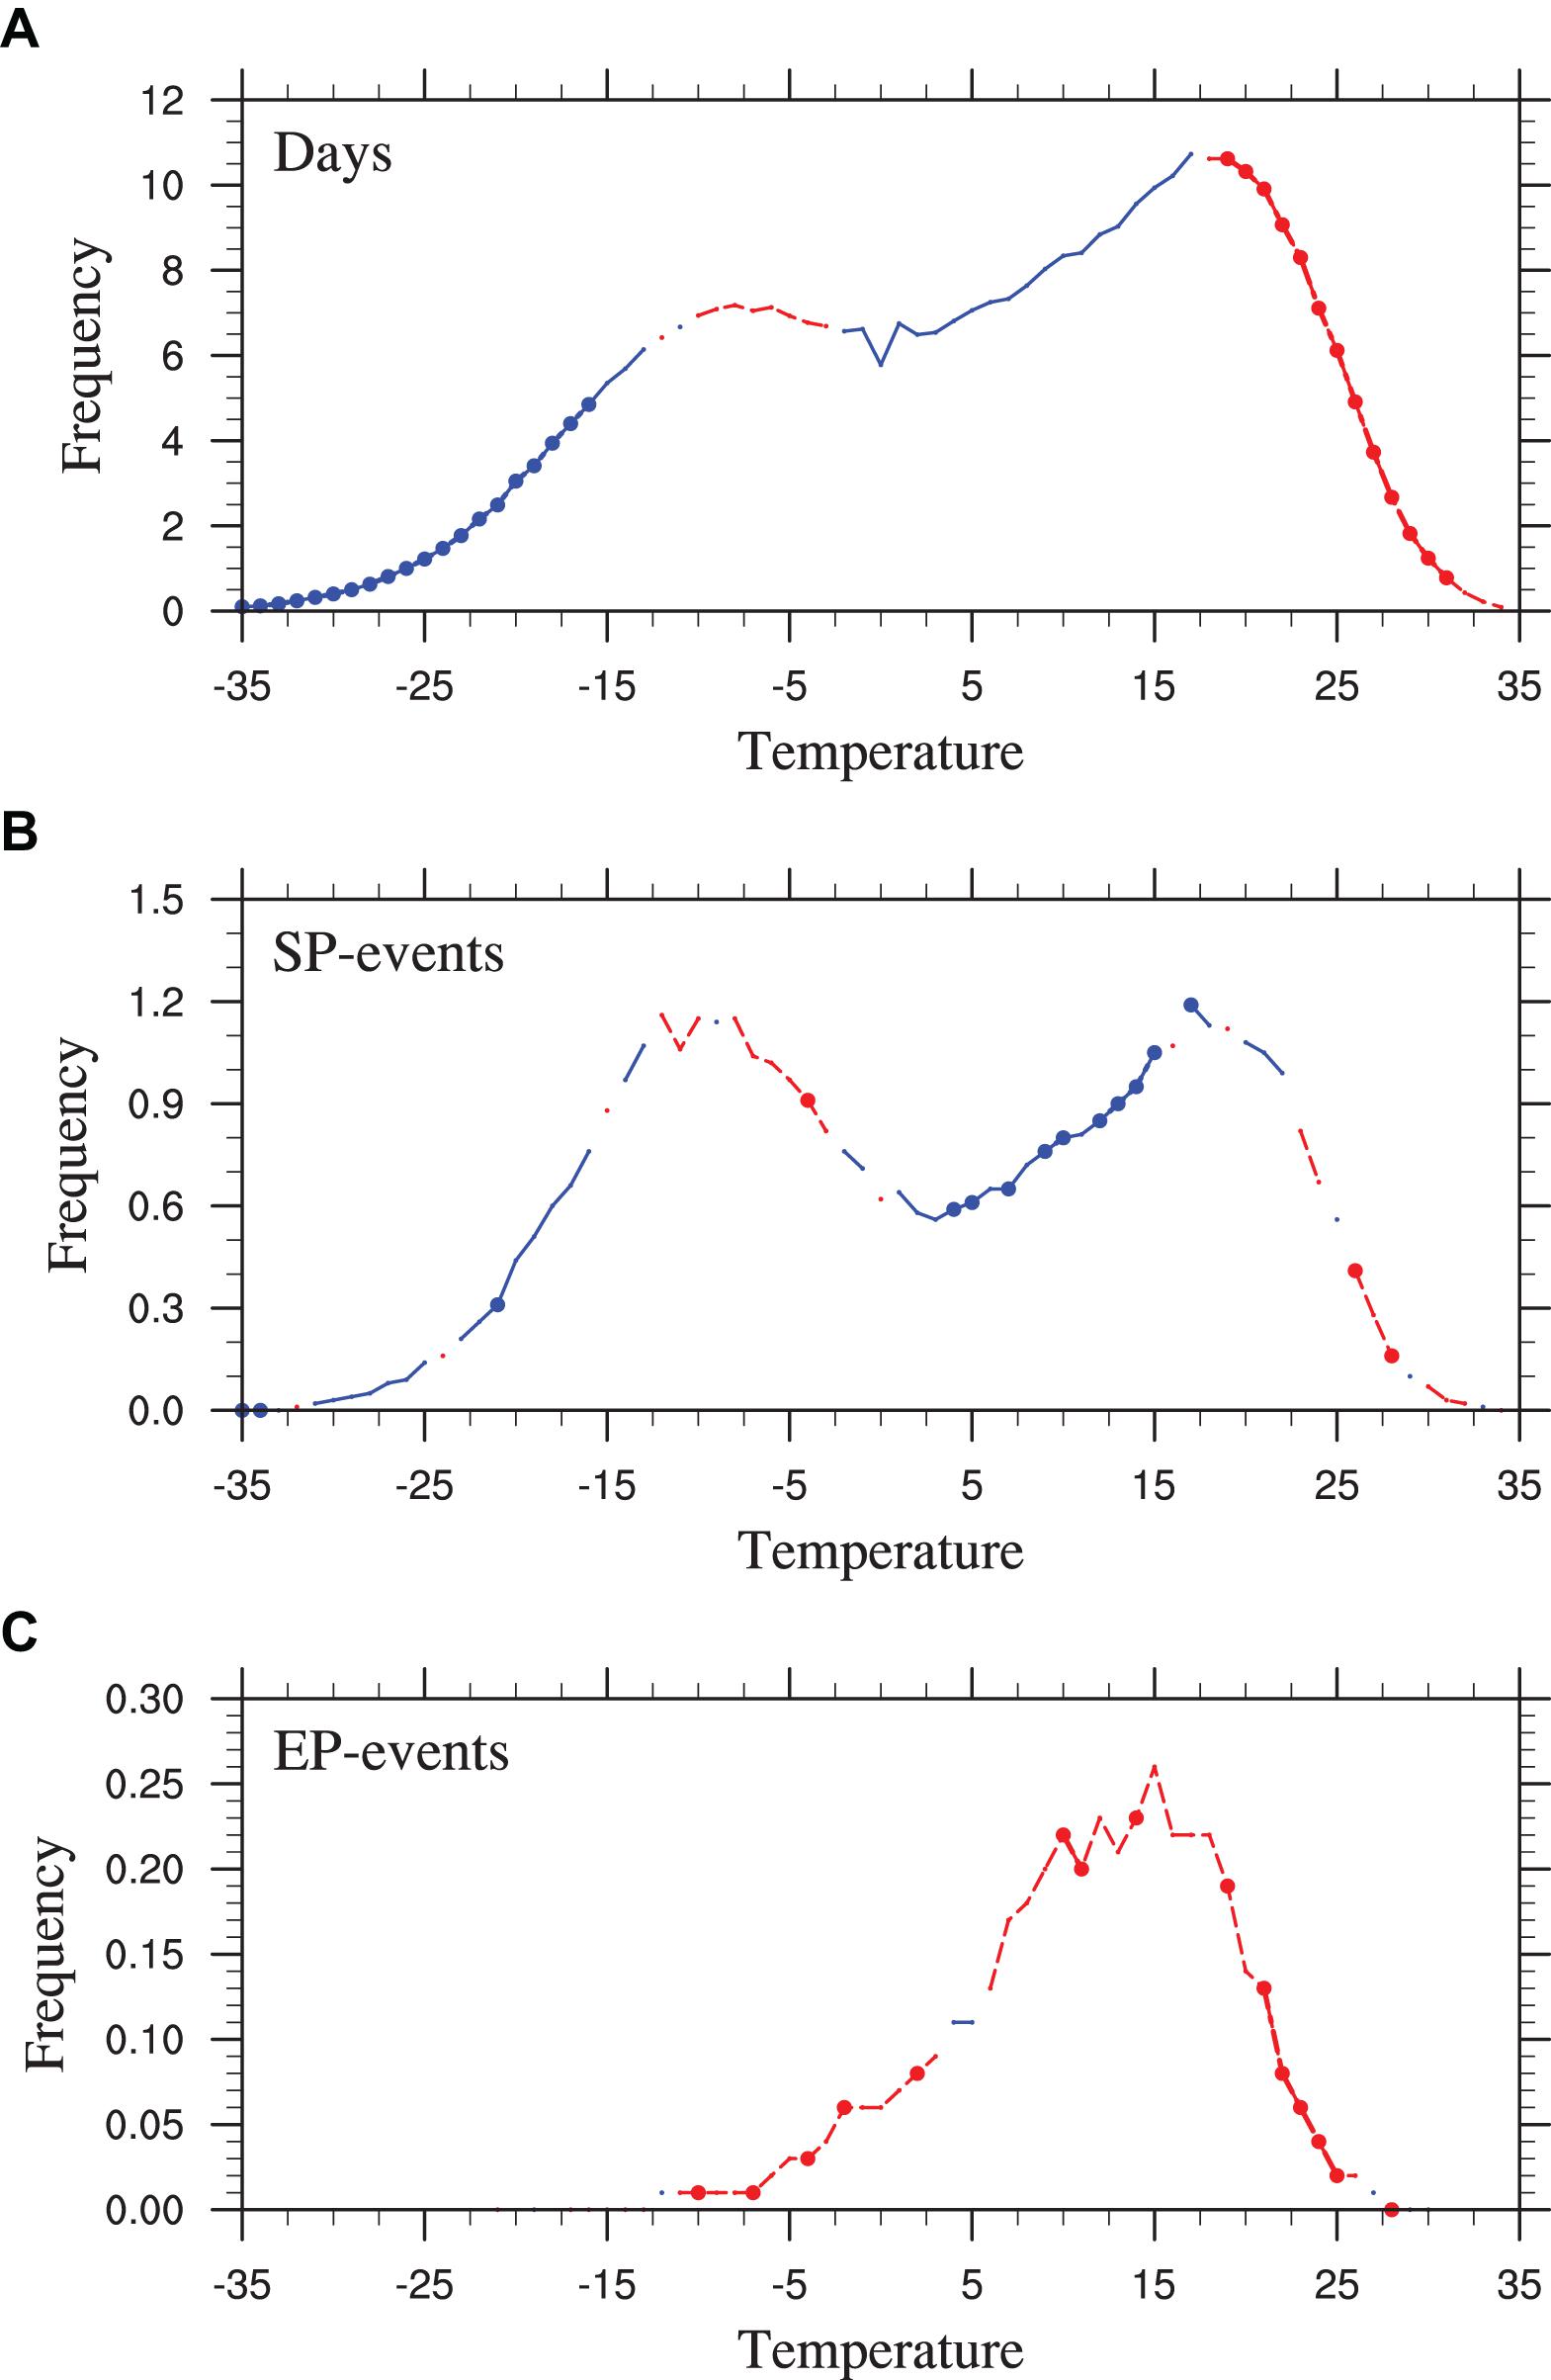
Figure 10. (A) Average annual frequency of days with different daily mean temperatures. (B) Average annual frequency of SP events on days with different daily mean temperatures. (C) Average annual frequency of EP events on days with different daily mean temperatures. Plotted data represent the mean across all stations, calculated from data covering 1963–2017. Red (blue) lines indicate a positive (negative) linear trend over the 55 years; lines marked with dots show trends that are significant at the 95% confidence level.
As shown in Figures 10B,C, the distributions of SP and EP event frequency with temperature have a bimodal and a unimodal distribution, respectively, which agrees with the results of the EOF analysis in Figure 9. For some temperatures, there are similarities between the trends for the number of days with that temperature (Figure 10A) and for the frequency of SP events (Figure 10B). For example, there are negative trends for SP event frequency, and for the average number of days with temperatures between 1 and 15°C, or below –16°C, and there is a positive trend in both the average number of days and SP event frequency for temperatures around –5°C (Figure 10B). From inspection of the changes in daily mean temperature and SP event frequency, it is clear that there is a positive relationship between temperature and SP event occurrence over most time intervals. When daily mean temperatures within a certain temperature range become more frequent, then the occurrence of SP events within that temperature range generally also increases, and vice versa. There are significant decreases in SP event frequency between 4 and 15°C. In contrast, EP events occur more frequently at most temperatures over recent decades, with the exception of a few narrow intervals, such as between 4 and 5°C (Figure 10C), which suggests that the relationship between temperature and EP event frequency is more complicated. Although the trends for number of days with different daily mean temperatures (Figure 10A) and EP event frequency (Figure 10C) have the same sign at temperatures above 18°C and at around –5°C, the trends are opposite between 6 and 17°C.
There are differences between the distributions and trends for the frequency of SP and EP events at different mean daily temperatures. Firstly, the temperature range for days when SP events occur is from –35 to +34°C, which is broader than the range for EP events, which is from –21 to 30°C. Secondly, there are differences between the frequency distribution for SP and EP events with temperature: there are two peaks in the SP event frequency distribution, and one for the EP event frequency distribution. Lastly, the trends for the number of days and for SP event frequency agree better over different temperatures than the trends for the number of days and for EP event frequency. The trends for the number of days and for the frequency of SP events are the same over nearly the entire temperature range, but the trends for the number of days and for the frequency of EP events do not always agree, and are opposite for temperatures between 6 and 17°C.
Conclusion and Discussion
We used daily precipitation and mean temperature data from 25 stations from 1963 to 2017, to compare statistical features and changes for SP and EP events over various timescales, and to investigate and compare relationships between SP and EP events and daily mean temperature. Our main conclusions are as follows:
(1) In Northern Xinjiang, from a regional perspective, SP events contribute strongly to and account for 49.5% of the total annual number of wet days, and contribute weakly to and account for 8.5% of the total annual precipitation amount. By contrast, EP events contribute strongly to and account for 28.8% of the total annual precipitation amount, and contribute weakly to and account for 5% of the total annual number of wet days.
(2) Over recent decades, in consist with the negative trend in SP events, the contribution of SP events to the total annual precipitation amount and the total annual number of wet days decreased significantly. Meanwhile, the contribution of EP events to the total annual precipitation amount increased significantly with the positive trend in EP events.
(3) The CD and CP values for SP event over the past 55 years show that SP events generally occur spaced through all months of the year, while EP events are generally concentrated in JJA. Regionally averaged CD values for SP and EP events have significantly increased and decreased, respectively, over Northern Xinjiang during the past 55 years, and this is related to the frequency of SP and EP events, which have experienced significant negative and positive trends, respectively.
(4) There are distinct differences between the relationships of SP and EP events to daily mean temperature. The daily mean temperatures at which SP events occur range from –35 to +34°C at the stations across Northern Xinjiang, while the temperature range for EP events is from –21 to +30°C. There are two peaks in the regionally averaged curve between SP event frequency and temperature and only one peak in the curve for EP events. Trends for daily mean temperatures and for the frequency of SP events at different temperatures agree well over nearly the entire temperature range, while trends for daily mean temperatures and for the frequency of EP events at different temperatures are not always consistent.
Long-term changes to precipitation characteristics that vary on a decadal scale are often related to changes in sea surface temperature (Wang et al., 2014; Ning and Bradley, 2015; Yan et al., 2019). For example, an increase in the daily variability of precipitation from the Indian monsoon was caused by a warming trend in the tropical Indian Ocean, which resulted in more heavy precipitation events and fewer moderate precipitation events (Goswami et al., 2006). Signals such as the basin mode (IOBM) and the dipole mode (IOD) in the tropical Indian Ocean have an important influence on precipitation in East China (Guan and Yamagata, 2003; Yang et al., 2007; Xie et al., 2009). There may also be links between IOBM and precipitation in Xinjiang indicated from recent studies. For example, Zhao et al. (2014, 2018) suggested that the weakened Indian monsoon is conducive to cooling of the middle and upper troposphere over central Asia in summer, and to increased water vapor transport from the tropical Indian Ocean to Central Asia, which may both contribute to increased precipitation in southern Xinjiang. Similar relationships between the Indian Ocean and Central Asia are also suggested by the results of climate projections from the CMIP5 experiment (Zhao and Zhang, 2015). In future work, we intend to study the impacts of signals from the Indian Ocean on SP and EP events in Northern Xinjiang, and the mechanisms that connect them.
Data Availability Statement
Publicly available datasets were analyzed in this study. This data can be found here: http://data.cma.cn/data/cdcdetail/dataCode/SURF_CLI_CHN_MUL_DAY_V3.0.html.
Author Contributions
YZ contributed to the development and planning of the study. ML performed the data analysis and wrote the manuscript. YL assisted with data analysis and figures. XZ helped perform the precipitation concentration analysis. SZ helped perform the analysis of precipitation response to the rise in temperature. All authors contributed to the article and approved the submitted version.
Funding
This work was jointly supported by the National Key R&D Program of China (Grant No. 2018YFC1507103), Sichuan Science and Technology Program (Grant No. 2020JDJQ0050), National Natural Science Foundation of China (Grant Nos. 41971026 and 41805054), and the Scientific Research Foundation of CUIT (Grant No. KYTZ201727).
Conflict of Interest
The authors declare that the research was conducted in the absence of any commercial or financial relationships that could be construed as a potential conflict of interest.
References
Bonsal, B. R., Zhang, X., Vincent, L. A., and Hogg, W. D. (2001). Characteristics of daily and extreme temperatures over Canada. J. Clim. 14, 1959–1976. doi: 10.1175/1520-0442(2001)014<1959:CODAET>2.0.CO;2
Chen, F. H., Wang, J. S., Jin, L. Y., Zhang, Q., Li, J., and Chen, J. H. (2009). Rapid warming in mid-latitude central Asia for the past 100 years. Front. Earth Sci. China 3:42–50. doi: 10.1007/s11707-009-0013-9
Chen, Y. N., Li, W. H., Deng, H. J., Fang, G. Z., and Li, Z. (2016). Changes in central Asia’s water tower: past, present and future. Sci. Rep. 6:35458. doi: 10.1038/srep39364
Deng, H. J., Chen, Y. N., Shi, X., Li, W. H., Wang, H. J., Zhang, S. H., et al. (2014). Dynamics of temperature and precipitation extremes and their spatial variation in the arid region of northwest China. Atmos. Res. 138, 346–355. doi: 10.1016/j.atmosres.2013.12.001
Fu, J. L., Qian, W. H., Lin, X., and Chen, D. L. (2008). Trends in graded precipitation in China from 1961 to 2000. Adv. Atmos. Sci. 25, 267–278. doi: 10.1007/s00376-008-0267-2
Goswami, B. N., Venugopal, V., Sengupta, D., Madhusoodanan, M. S., and Xavier, P. K. (2006). Increasing trend of extreme rain events over India in a warming environment. Science 314, 1442–1445. doi: 10.1126/science.1132027
Guan, Z. Y., and Yamagata, T. (2003). The unusual summer of 1994 in East Asia: IOD teleconnections. Geophys. Res. Lett. 30:1544. doi: 10.1029/2002GL016831
Held, I. M., and Soden, B. J. (2006). Robust responses of the hydrological cycle to global warming. J. Clim. 19, 5686–5699. doi: 10.1175/JCLI3990.1
Huang, D. Q., Zhu, J., and Kuang, X. Y. (2011). Decadal variation of different durations of continuous Meiyu precipitation and the possible cause. Chin. Sci. Bull. 56, 424–431. doi: 10.1007/s11434-010-4241-x
Huang, J. P., Ji, M. X., Xie, Y. K., Wang, S. S., He, Y. L., and Ran, J. Q. (2016a). Global semi-arid climate change over last 60 years. Clim. Dyn. 46, 1131–1150. doi: 10.1007/s00382-015-2636-8
Huang, J. P., Ma, J. R., Guan, X. D., Li, Y., and He, Y. L. (2019). Progress in semi-arid climate change studies in China. Adv. Atmos. Sci. 36, 922–937. doi: 10.1007/s00376-018-8200-9
Huang, J. P., Yu, H. P., Guan, X. D., Wang, G. Y., and Guo, R. X. (2016b). Accelerated dryland expansion under climate change. Nat. Clim. Chang. 6, 166–171. doi: 10.1038/nclimate2837
Huang, P., Xie, S.-P., Hu, K., Huang, G., and Huang, R. (2013). Patterns of the seasonal response of tropical rainfall to global warming. Nat. Geosci. 6, 357–361. doi: 10.1038/ngeo1792
IPCC (2013). Climate Change 2013: The Physical Science Basis. Contribution of Working Group I to the Fifth Assessment Report of the Intergovernmental Panel on Climate Change. Cambridge: Cambridge Univ. Press.
Jiang, F. Q., Hu, R. J., Wang, S. P., Zhang, Y. W., and Tong, L. (2013). Trends of precipitation extremes during 1960–2008 in Xinjiang, the northwest China. Theor. Appl. Climatol. 111, 133–148. doi: 10.1007/s00704-012-0657-3
Jiang, Z. H., Huang, Q., and Li, Q. X. (2008). Study of precipitation series homogeneous adjustment and their correction over China in the last 50 years. Clim. Environ. Res. 13, 67–74.
Li, B. F., Chen, Y. N., Li, W. H., Chen, Z. S., Zhang, B. H., and Guo, B. (2013). Spatial and temporal variations of temperature and precipitation in the arid region of northwest China from 1960-2010. Fresenius Environ. Bull. 22, 362–371.
Li, X. M., Jiang, F. Q., Li, L. H., and Wang, G. G. (2011). Spatial and temporal variability of precipitation concentration index, concentration degree and concentration period in Xinjiang, China. Int. J. Climatol. 31, 1679–1693. doi: 10.1002/joc.2181
Li, Y., Huang, J. P., Ji, M. X., and Ran, J. J. (2015). Dryland expansion in northern China from 1948 to 2008. Adv. Atmos. Sci. 32, 870–876. doi: 10.1007/s00376-014-4106-3
Liao, X. M., Chen, D. L., and Xie, Y. (2012). Spatial and temporal distribution of dry spells in China. Acta Meteor. Sin. 67, 321–336.
Liu, B. H., Xu, M., Henderson, M., and Qi, Y. (2005). Observed trends of precipitation amount, frequency, and intensity in China, 1960-2000. J. Geophys. Res. 110:D08103. doi: 10.1029/2004JD004864
Ning, L., and Bradley, R. S. (2015). Winter climate extremes over the northeastern United States and southeastern Canada and teleconnections with large-scale modes of climate variability. J. Clim. 28, 2475–2493. doi: 10.1175/JCLI-D-13-00750.1
Qian, W., and Lin, X. (2005). Regional trends in recent precipitation indices in China. Meteor. Atmos. Phys. 90, 193–207. doi: 10.1007/s00703-004-0101-z
Qian, W. H., Fu, J. L., and Yan, Z. W. (2007). Decrease of light rain events in summer associated with a warming environment in China during 1961–2005. Geophys. Res. Lett. 34:L11705. doi: 10.1029/2007GL029631
Shi, Y. F., Shen, Y. P., and Hu, R. J. (2002). Preliminary study on signal, impact and foreground of climatic shift from warm-dry to warm-humid in northwest China. J. Glaciol. Geocryol. 24, 219–226.
Shi, Y. F., Shen, Y. P., Li, D. L., Zhang, G. W., Ding, Y. J., Hu, R. J., et al. (2003). Discussion on the present climate change from warm-dry to warm-wet in northwest China. Quat. Sci. 23, 152–164.
Trenberth, K. E., Dai, A. G., Rasmussen, R. M., and Parsons, D. B. (2003). The changing character of precipitation. Bull. Amer. Meteor. Soc. 84, 1205–1217. doi: 10.1175/BAMS-84-9-1205
Utsumi, N., Seto, S., Kanae, S., Maeda, E. E., and Oki, T. (2011). Does higher surface temperature intensify extreme precipitation? Geophys. Res. Lett. 38:L16708. doi: 10.1029/2011GL048426
Wang, F., Yang, S., Higgins, W., Li, Q. P., and Zuo, Z. Y. (2014). Long-term changes in total and extreme precipitation over China and the United States and their links to oceanic–atmospheric features. Int. J. Climatol. 34, 286–302. doi: 10.1002/joc.3685
Wang, H. J., Chen, Y. N., and Chen, Z. S. (2013). Spatial distribution and temporal trends of mean precipitation and extremes in the arid region, northwest of China, during 1960-2010. Hydrol. Process. 27, 1807–1818. doi: 10.1002/hyp.9339
Wang, H. J., Chen, Y. N., Xun, S., Lai, D. M., Fan, Y. T., and Li, Z. (2012). Changes in daily climate extremes in the arid area of northwestern China. Theor. Appl. Climatol. 112, 15–28. doi: 10.1007/s00704-012-0698-7
Wang, Y. J., Zhou, B. T., Qin, D. H., Wu, J., Gao, R., and Song, L. C. (2017). Changes in mean and extreme temperature and precipitation over the arid region of northwestern China: observation and projection. Adv. Atmos. Sci. 34, 289–305. doi: 10.1007/s00376-016-6160-5
Xiao, C., Wu, P. L., Zhang, L. X., and Song, L. C. (2017). Robust increase in extreme summer precipitation intensity during the past four decades observed in China. Sci. Rep. 6:38506. doi: 10.1038/srep38506
Xie, S. P., Deser, C., Vecchi, G. A., Ma, J., Teng, H., and Wittenberg, A. T. (2010). Global warming pattern formation: sea surface temperature and rainfall. J. Clim. 23, 966–986. doi: 10.1175/2009JCLI3329.1
Xie, S. P., Hu, K. M., Hafner, J., Tokinaga, H., Du, Y., Huang, G., et al. (2009). Indian ocean capacitor effect on Indo-Western Pacific climate during the summer following El Niño. J. Clim. 22, 730–747. doi: 10.1175/2008JCLI2544.1
Xin, Y., Cui, C. X., Zhang, G. X., Zhang, X., Liu, X. W., and Sheng, X. Q. (2008). Spatial-temporal variation of precipitation for different grade and the events of extreme precipitation over Bole, Xinjiang. J. Desert Res. 28, 362–369.
Yan, P. W., Huang, D. Q., Zhu, J., Kuang, X. Y., and Huang, Y. (2019). The decadal shift of the long persistent precipitation over the northern part of China and the associated ocean conditions. Int. J. Climatol. 39, 3043–3056. doi: 10.1002/joc.6001
Yang, J. L., Liu, Q. Y., Xie, S. P., Liu, Z. Y., and Wu, L. X. (2007). Impact of the Indian Ocean SST basin mode on the Asian summer monsoon. Geophys. Res. Lett. 34:L02708. doi: 10.1029/2006GL028571
Yang, S., and Li, Q. X. (2014). Improvement in homogeneity analysis method and update of China precipitation data. Adv. Clim. Chang. Res. 10, 276–281.
Yao, J. Q., Yang, Q., Chen, Y. N., Hu, W. F., Liu, Z. H., and Zhao, L. (2013). Climate change in arid areas of northwest China in past 50 years and its effects on the local ecological environment. Chin. J. Ecol. 32, 1283–1291.
Yao, J. Q., Yang, Q., Liu, Z. H., and Li, C. Z. (2015). Spatio-temporal change of precipitation in arid region of the northwest China. Acta Ecol. Sin. 35, 5846–5855. doi: 10.5846/stxb201310242567
Zhai, P. M., Liao, Z., Chen, Y., Yu, R., Yuan, Y. F., and Lu, H. (2017). A review on changes in precipitation persistence and phase under the background of global warming. Acta Meteor. Sin. 75, 527–538. (in Chinese)
Zhai, P. M., Zhang, X. B., Wan, H., and Pan, X. H. (2005). Trends in total precipitation and frequency of daily precipitation extremes over China. J. Clim. 18, 1096–1108. doi: 10.1175/JCLI-3318.1
Zhang, L. J., and Qian, Y. F. (2003). Annual distribution features of precipitation in China and their interannual variations. Acta Meteor. Sin. 17, 146–163.
Zhang, Q., Singh, V. P., Li, J. F., Jiang, F. Q., and Bai, Y. G. (2012). Spatio-temporal variations of precipitation extremes in Xinjiang, China. J. Hydrol. 434–435, 7–18. doi: 10.1016/j.jhydrol.2012.02.038.
Zhang, Q., Yao, Y. B., Li, Y. H., Huang, J. P., Ma, Z. G., Wang, Z. L., et al. (2020). Causes and changes of drought in China: research progress and prospects. J. Meteor. Res. 34, 460–481. doi: 10.1007/s13351-020-9829-8
Zhang, Q., Zhang, C. J., Bai, H. Z., Li, L., Sun, L. D., Liu, D. X., et al. (2010). New development of climate change in northwest China and its impact on arid environment. J. Arid Meteorol. 28, 1–7.
Zhao, Y., Huang, A. N., Zhou, Y., Huang, D. Q., Yang, Q., Ma, Y. F., et al. (2014). Impact of the middle and upper tropospheric cooling over central Asia on the summer precipitation in the Tarim Basin, China. J. Clim. 27, 4721–4732. doi: 10.1175/JCLI-D-13-00456.1
Zhao, Y., Yu, X. J., Yao, J. Q., Dong, X. X., and Li, H. J. (2018). The concurrent effects of the South Asian monsoon and the plateau monsoon over the Tibetan Plateau on summer rainfall in the Tarim Basin of China. Int. J. Climatol. 39, 74–88. doi: 10.1002/joc.5783
Zhao, Y., and Zhang, H. Q. (2015). Impacts of SST warming in tropical Indian ocean on CMIP5 model projected summer rainfall changes over central Asia. Clim. Dyn. 46, 3223–3238. doi: 10.1007/s00382-015-2765-0
Zhao, Y., Zhou, Y., Wang, M. Z., Huo, W., Huang, A. N., Yang, X. H., et al. (2017). Annual distributions and variations of dust weather occurrence over the Tarim Basin, China. Theor. Appl. Climatol. 132, 209–217. doi: 10.1007/s00704-017-2081-1
Zheng, X. Q., Li, X. J., Yang, Fan, Sang, C. Q., and Gu, R. (2014). Changing features of precipitation in Urumqi during 1961-2010. J. Arid Land Resour. Environ. 28, 178–184.
Keywords: slight precipitation, extreme precipitation, Northern Xinjiang, temporal concentration, precipitation response to warming
Citation: Li M, Zhao Y, Li Y, Zhou X and Zhang S (2021) Changes in Slight and Extreme Precipitation Events From 1963 to 2017 Over Northern Xinjiang, China. Front. Earth Sci. 9:622889. doi: 10.3389/feart.2021.622889
Received: 29 October 2020; Accepted: 24 February 2021;
Published: 19 March 2021.
Edited by:
Lin Wang, Institute of Atmospheric Physics (CAS), ChinaReviewed by:
Xiaojian Zhang, Nanjing University, ChinaXingwen Jiang, China Meteorological Administration, China
Ruidan Chen, Sun Yat-sen University, China
Copyright © 2021 Li, Zhao, Li, Zhou and Zhang. This is an open-access article distributed under the terms of the Creative Commons Attribution License (CC BY). The use, distribution or reproduction in other forums is permitted, provided the original author(s) and the copyright owner(s) are credited and that the original publication in this journal is cited, in accordance with accepted academic practice. No use, distribution or reproduction is permitted which does not comply with these terms.
*Correspondence: Yong Zhao, emhhb3k2MDhAY3VpdC5lZHUuY24=