 Yingqin Wu
 Yanhong Liu
 Tong Wang2
94% of researchers rate our articles as excellent or good
Learn more about the work of our research integrity team to safeguard the quality of each article we publish.
Find out more
ORIGINAL RESEARCH article
Front. Earth Sci., 17 September 2021
Sec. Geochemistry
Volume 9 - 2021 | https://doi.org/10.3389/feart.2021.620161
This article is part of the Research TopicGas Geochemistry: New Progresses and ApplicationsView all 24 articles
In order to understand the influence of source rock types and maturity on hydrocarbon gases carbon isotope change more objectively, a closed-system pyrolysis experiment was carried out on six samples from 250 to 550°C. The values of δ13C1, δ13C2, and δ13C3 were ranged from −73.3 to −29.8%, from −36.3 to −9.5%, and from −38.5 to −12.4%, respectively. The range of δ13C1 was the largest, reaching a top value of 43.5%. The results showed that the temperature has an effect on the carbon isotope value of pyrolysis gas. With the increase of the degree of thermal evolution, the carbon isotope value of methane in all samples, except for huangxian gangue, had a change trend from heavy to light firstly, then got heavier. In addition, the carbon isotope values of methane, ethane and propane had the features of δ13C1 < δ13C2 < δ13C3 when the temperatures were under 550°C, which were made up of a series of positive carbon isotopes. However, when the temperature increased above 550°C, there was an inversion of the simulated gas carbon isotope values in Huangxian coal gangue, Minqin oil shale and Huaan carbonaceous shale, i.e., δ13C2 > δ13C3 and δ13C2 > δ13C1. It indicates that the secondary cracking has occurred at high maturity or over maturity stage.
The distribution and evolution of stable carbon isotopes contain important information of natural gas. As a result, carbon stable isotope has an important role in the study of natural gas genesis, oil and gas filling history, migration and oil source correlation (Cramer, 2004; Duan et al., 2011; Tian et al., 2012; Hao and Zou, 2013; Wu et al., 2015; Han et al., 2018). The most widely used and technically mature index is the stable carbon isotopes of methane and ethane in the previous studies (Peter, 2020; Hill et al., 2007; Li et al., 2013; Wu et al., 2017). As an important means to understand the natural evolution of geochemical characteristics, hydrothermal pyrolysis simulation experiment makes multi-parameter analysis of the controlled system possible, and the analysis results can be applied to practical production. In order to meet the needs of oil and gas exploration, many scholars have studied the relationship between methane stable carbon isotopes and temperature and maturity by simulating hydrocarbon generation in immature and low-mature sediments (Dieckmann et al., 2006; Lewan and Roy, 2011; Duan et al., 2011; Li et al., 2018). Thus, the thermal evolution of methane stable carbon isotopes was been quantitatively calibrated. Previous studies showed that the stable carbon isotopes of methane decrease first and then increase with the increase of thermal evolution under thermal simulation conditions. Besides, the relationship between the stable carbon isotopes of methane and the maturity of corresponding parent rocks was established, and it was proved with a linear correlation. Obviously, the variation trend of methane carbon isotope was different from that of thermal simulation results. Furthermore, there were still many differences in the thermal evolution of methane stable carbon isotopes under experimental conditions.
Most researchers have used methane, ethane, and propane from global natural gas reserves to derive a normal sequence of carbon isotopes, such as δ13C methane (C1) < δ13C ethane (C2) < δ13C propane (C3) (Clayton 1991; Pan et al., 2010). However, in the study of unconventional shale gas, it was found that the change of carbon isotope in natural gas was reversed and had two characteristics: partially reversed (δ13C1 > δ13C2 < δ13C3) and completely reversed (δ13C1 > δ13C2 > δ13C3) (Tilley and Muehlenbachs, 2013; Cheng et al., 2020; Milkov and Eriope, 2018, 2020). The Wufeng Formation of the Upper Ordovician to the Longmaxi Formation of the Lower Silurian in Sichuan Basin is the only strata in China that have realized commercial shale gas development at present, but there are still some differences on the origin of shale gas, mainly due to the lack of direct experimental evidence. However, the lack of these early understandings had restricted the evaluation of natural gas accumulation and the deployment of natural gas exploration strategies. Thus, the purpose of this study is to analyze the composition of natural gas and carbon isotope composition characteristics, and further to improve the understanding of gas-source correlation. In addition, the effects of temperature and kerogen types on light hydrocarbon isotopes were also poorly understood. In this paper, the composition and evolution of carbon isotopes of hydrocarbon gases were studied by the hydrous pyrolysis of several immature organic sources under the condition of continuous heating at 250–550°C. Furthermore, the evolution and inversion of gas stable carbon isotopes at different temperatures were systematically studied. These results have an important contribution to the exploration of shale gas.
The six samples used in this study included different types source rocks and a higher plant sample. The samples were all thermally immature, and the geochemical data were shown in Table 1. I) Green River shale, from the Green River Basin in US, was collected from the Eocene Green River Formation containing Type-I kerogen; II) Minqin oil shale, from the Ordos Basin in Northwest China, was from the Triassic Guodikeng Formation containing Type-I-II kerogen; It is deposited in a deep-semi-deep lake environment, the Minqin Oasis is located in the western part of the Gansu Province, northwestern China. III) Huaan carbonaceous shale, from the Huaan Basin in Northwest China, was mainly collected from the Eocene-Oligocene Jijuntun Formation with Type-III kerogen; IV) Cangcan 1# shale from the Bohai Bay Basin in Northeast China, was formed in the Cenozoic Eocene epoch with Type-II kerogen; Ⅴ) Huangxian coal gangue, from the Tertiary humus coals, was collected from the Lijiaya Formation of the Huangxian Basin in the eastern of China’s Shandong peninsula with Type-III kerogen. Ⅵ) Pine needle, from higher plant, was collected from a 10 years old pine tree of Lanzhou, China. The characterstics and data for TOC, Rock-Eval pyrolysis values, and Ro for the studied samples were showed in Table 1.
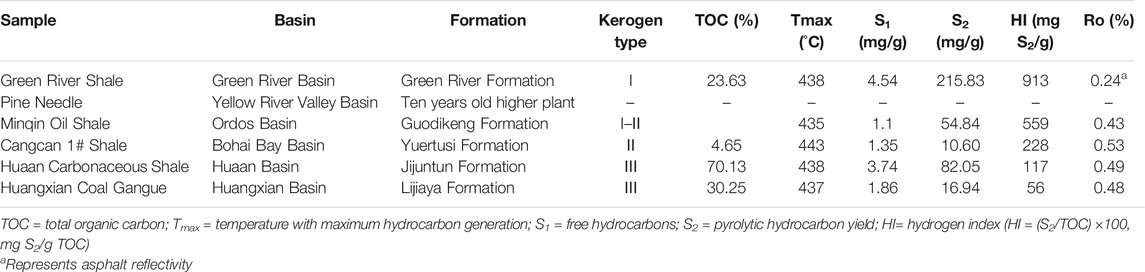
TABLE 1. Characterstics and data for TOC, Rock-Eval pyrolysis values, and Ro for the studied samples.
The hydrolysis experiment was carried out in a stainless steel reactor. The samples were crushed into powder ≤100 mesh and dried at 50°C for 24 h. The weighed sample and distilled water are first placed in a reactor (details are provided in Supplementary Data Sheet 1). The reactor (with an internal volume of 0.27 L) loaded with sample was vacuumized and replaced with He gas for 3 times, then heated in a furnace with a temperature controller. Isothermal pyrolysis was then heated from room temperature to the final temperature (250, 300, 350, 400, 450, 500, and 550°C) for 72 h, with a heating rate of 20°C/min. During experiments, the accuracy of temperature measurements was better than ±0.5°C. The pressure during the heating was equal to the vapor pressure of water and gas at each temperature level.
Stable carbon isotope analysis was performed with a MAT 253 (Thermo Fisher Scientific Corp., Bremen, Germany) gas chromatographic isotope ratio mass spectrometer (GC-IRMS). The Gas chromatography (GC) was equipped with an HP-5 fused silica column (100 m × 0.32 mm × 0.25 μm, Agilent, United States), helium as carrier gas, fixed at 1.1 ml/min. In splitless mode, the GC inlet temperature was maintained at 280°C. The oven temperature was started at 80°C (held 2 min), and increased to 300°C at 4°C/min (held 30 min). The temperature of combustion furnace was 800°C, and CuO and Pt wires were loaded as oxidant and catalyst, respectively.
Samples was injected at an initial temperature of 50°C (maintained for 3 min), then the sample was heated at a rate of 15°C/min to 190°C, 5°C/min to 250°C, and kept for 15 min. To ensure the standard deviation was less than ±0.3%, each sample was analyzed continuously for at least 3 times, and a known standard sample (5°C/min) was also measured every day to monitor the analysis accuracy.
In general, the carbon isotopic composition (δ13C) indicated the stability of gaseous hydrocarbons in geochemical reactions (Deines 2002; Zhou et al., 2014). In the present study, the carbon isotope values of methane, ethane, and propane showed two trends. Early in the pyrolysis process, methane, ethane and propane were enriched in 12C. After reaching a 13C minimum, methane and ethane become enriched in 13C as temperature increases other than propane of the samples contained Type-Ⅲ kerogen, which shift to 13C enrichment at 550°C (Figure 1). The phenomenon was similar to the previously reported hydrous pyrolysis experiments (Liu et al., 2012). The most negative 13C value was observed approximately at 300 or 350 C for each gas.
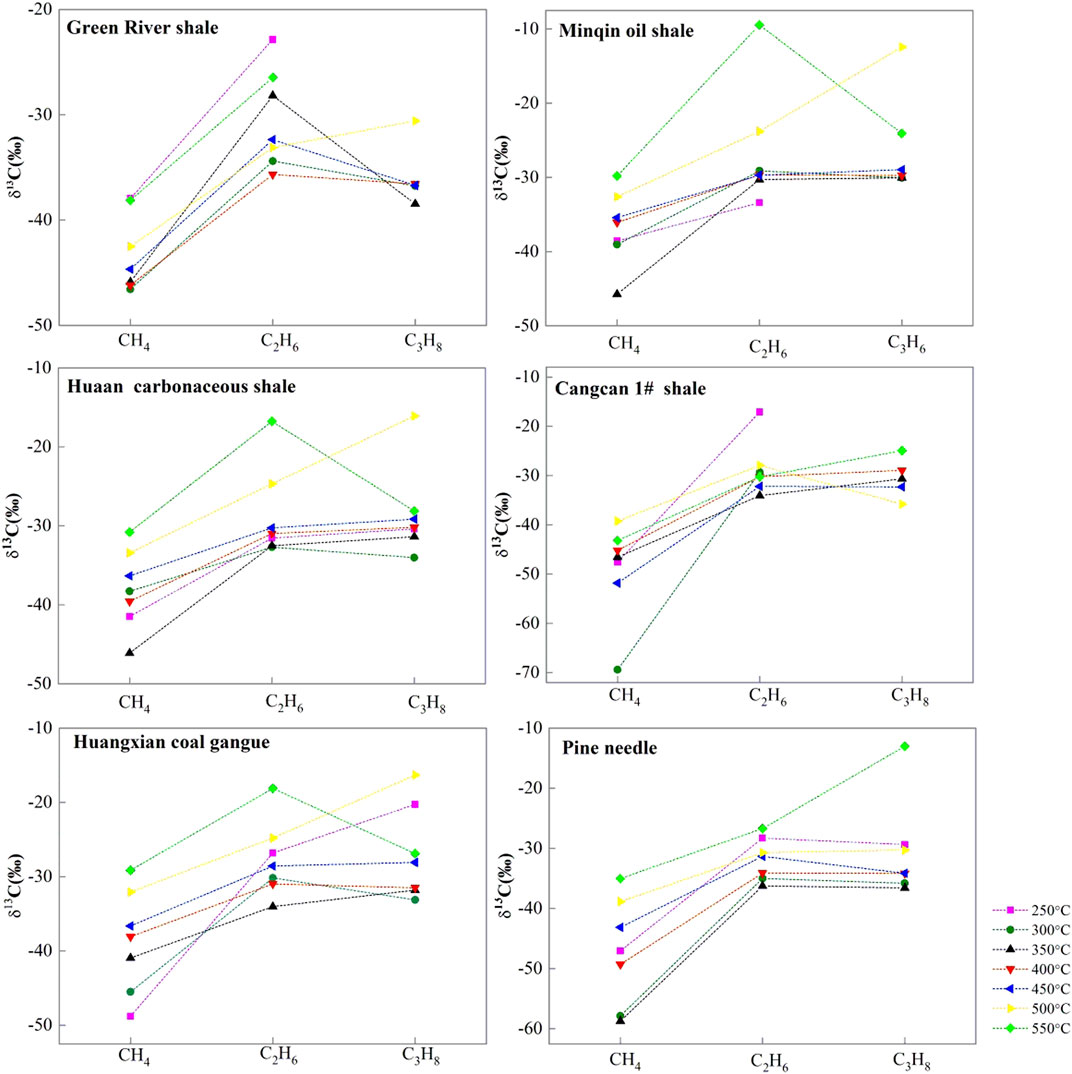
FIGURE 1. Evolution characteristics of gas carbon isotope in thermal simulation.
In Figure 2, the difference and relationship between the “normal” and “reversed” distributions can be clearly observed in plots of δ13C vs. carbon-number reciprocal. Type-I kerogen at 250–450°C, Type-Ⅱ kerogen at 500°C and Type-Ⅲ kerogen at 300, 550°C respectively showed the “reversed” isotope distribution patterns. Compared with methane and propane, the δ13C values of ethane produced from the hydrous pyrolysis were more positive, showing an obvious significant “dogleg” trend. As the temperature increased from 250 to 350°C, the isotopes reverse trend was also increased significantly in all Type-I, Ⅱ and Ⅲ kerogen samples, then the phenomenon was weakened or even disappeared when the temperature was rised from 350 to 500°C. However, as the temperature was increased from 500 to 550°C, the change in carbon isotopic compositions became more and more obvious. There were showed more significant reversal phenomenon for Huangxian coal gangue, Huaan carbonaceous shale (Type Ⅲ kerogen), Minqin oil shale (Type I-Ⅱ kerogen) at 550°C (Figure 3). This was typical coal-formed gas characteristics. In general, the degree of ethane enriching 13C was far more than methane and propane in all samples other than Pine needle and Green River shale. They showed positive sequences in Pine needle and Green River shale, where propane enriched at 13C far outweighed methane and ethane. This phenomenon may be also applied to the Type-I kerogen samples. With the increase of temperature, the trend of isotope inversion was gradually appeared for Cangcan 1# shale between 350 and 500°C and the carbon sequence was positive at 550°C. The isotopic variation of ethane was obviously different from that of methane and propane, which leads to the evolution of this carbon isotope.
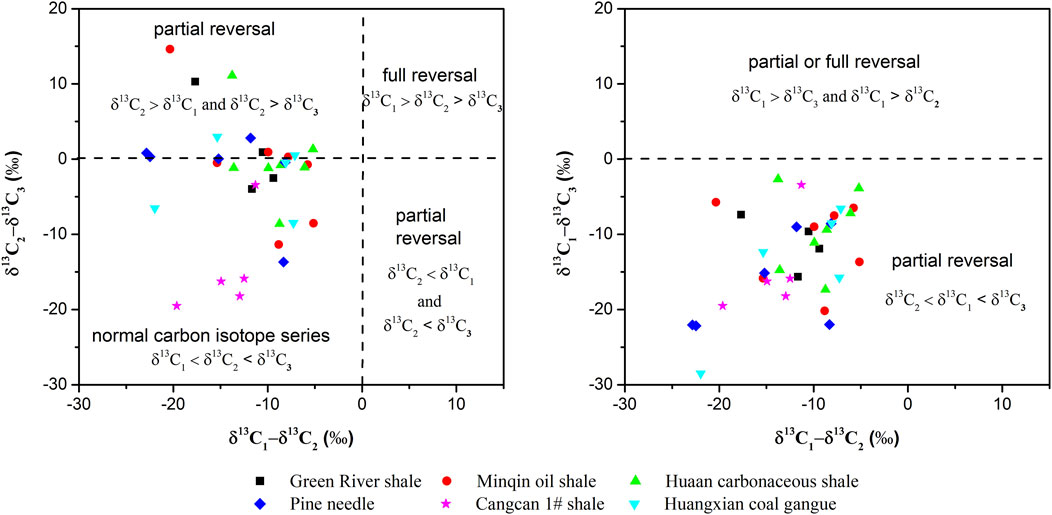
FIGURE 2. Reversal distribution mode of carbon isotopic composition of shale gas (Modified from References (Rodriguez and Philp, 2010; Tilley and Muehlenbachs, 2013).
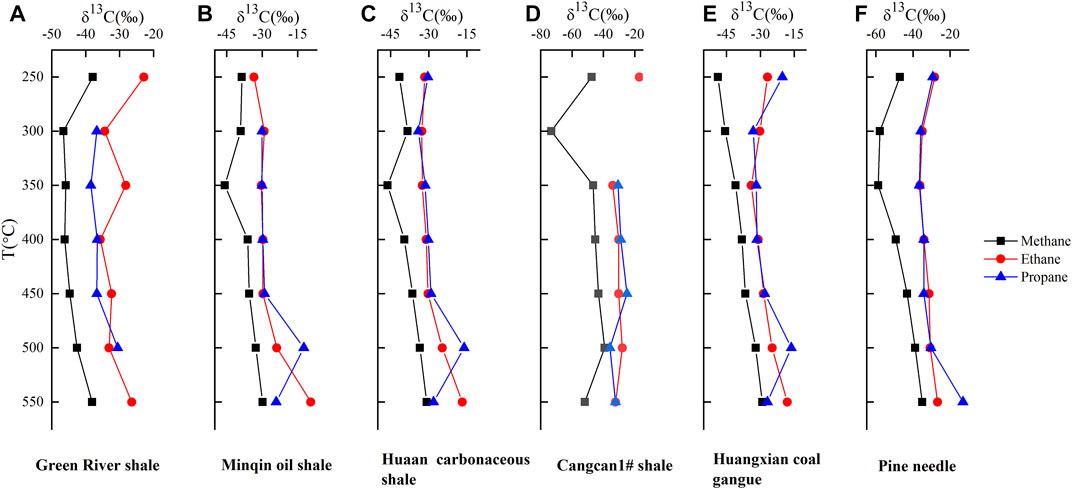
FIGURE 3. Evolution characteristics of the isotopes of methane, ethane, and propane with temperature.
As shown in Figure 3, when the temperature reached 300°C, the heavier carbon isotope of ethane appeared. That was, the value of δ13C2 was heavier than that of δ13C1 and δ13C3 respectively, which was especially prominent in the Green River shale (Figure 3A; Type I). It was not obvious in Type II (Figures 3B,D) and Type III kerogen (Figures 3C,E) and Pine needle (Figure 3F). After 300°C, kerogen began to produce hydrocarbons. The reason why the carbon isotopic of methane from crude pyrolysis gas was lighter was that carbon isotopic fractionation had occurred to a certain extent during the conversion from kerogen to oil. At the same time, since most of the methane came from the cracking of ethane and other heavy hydrocarbons, and the carbon isotopic value of ethane and other heavy hydrocarbons at the cracking stage was lower than that of crude oil, the carbon isotopic value of the methane generated by ethane must be low (Xiong et al., 2016). This was because that ethane cracking first cracks the 12C–12C bond, and more remaining 12C–13C bond made the δ13C2 heavier. When the evolution degree was very high, oil and even light hydrocarbon ran out, and finally ethane, propane and other moisture could no longer be formed, and a large number of pyrolysis started. Under the influence of activation energy, the less ethane content was, the heavier the isotope value of ethane. In the Rayleigh Distill stage, no new ethane and propane were generated, but the synchronous cracking of both continued to meet the similar isotopic fractionation model. The isotopic values of ethane and propane increased together, but ethane increased faster, and soon showed the phenomenon that δ13C2 was heavier than δ13C3. The increase rate of the isotopic values of ethane and propane was determined by the isotope fractionation factor during pyrolysis. Tang et al. (2000) had already proved that the isotope fractionation factor of ethane during pyrolysis was greater than that of propane. So that’s why the carbon isotopes of ethane in Green River shale (Type I) showed heavier than the carbon isotopes of methane and propane in the whole process. This phenomenon was unknown in Type II and Type-Ⅲ kerogen, and the cause remained to be studied.
The carbon isotopic compositions of methane from the pyrolysis of the six samples are compared in Figures 1, 3. The methane carbon isotopes generated from pyrolysis experiment in the Green River shale, Minqin oli shale, Huaan carbonaceous shale, Huangxian coal gangue, Pine needle and Cangcan 1# shale were changed in a range of −46.6% to −37.9%, −45.7% to −29.8%, −46.1% to −30.8%, −48.8% to −29.1%, −58.7% to −335.0% and −73.3% to −39.2%, respectively (Table.2). In general, methane from the Cangcan 1# shale was more enriched in 12C1 than other samples at the same thermal maturity levels. For example, the methane carbon isotopic value for the Huaan carbonaceous shale was as heavy as −38.3% whereas the value for the Cangcan 1# shale was as light as −73.3% at 300°C, with a difference as high as −35.0%. The environment of deposition, tectonic activity and evolutionary sequence determined chemical property and methane carbon isotopes, resulting in significant difference in the influence of kerogen type on methane carbon isotopes.
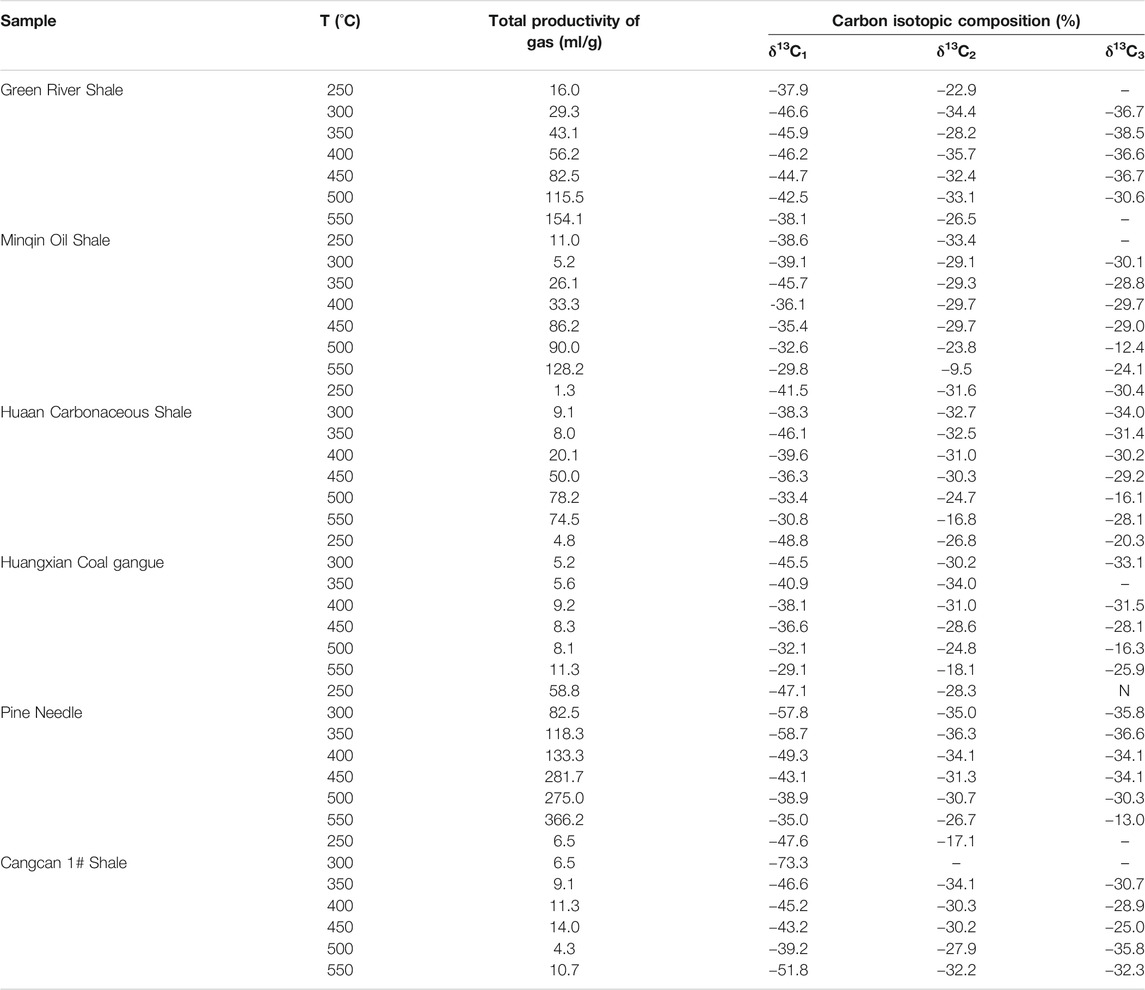
TABLE 2. Geochemical composition and stable carbon isotopic of gas in different temperatures.
As can be seen from Figure 3, with the increase of thermal evolution degree, the carbon isotope values of methane in each sample, except for Huangxian coal gangue (Figure 3E), showed a trend of becoming lighter firstly and then becoming heavier with increasing thermal simulation temperature. The reason may be that cracked gas in high-temperature causes methane carbon isotope to heavy between 350 and 400°C. This indicated that methyl radicals increase significantly during the pyrolysis of organic matter between 350 and 400°C, which was likely to generate more methane with heavy isotope composition after exchanging with inorganic carbon during the pyrolysis process.
According to the research results from Lorant et al. (1998) and Tang et al. (2000), the 12C–12C bond is more reactive than 12C–13C bond, which is more likely to be broken than 12C–13C bond because it has a slightly higher bond energy than 12C–12C bond. Therefore, after reaching the oil window, the 12C–12C bond was firstly enriched in methane molecules, this makes the methane isotope lighter. But as the temperature continued to rise, the 12C–13C bond also began to break, making the carbon isotope of methane heavier and heavier.
Another phenomenon can be seen in Figure 4. There was a dramatic increase in the carbon isotope values of methane (Figure 4A), ethane (Figure 4B), and propane (Figure 4C) in all samples when the temperature reaches 500°C, which was caused by Rayleigh Distill at the high over-maturity stage. The hydrocarbon generation of source rocks is divided into three stages: primary generation, secondary cracking and Rayleigh Distill, and the principles in different stages are different (James, 1983; Xiong et al., 2016). During the Rayleigh Distill phase, the isotopes became much heavier with the deepening of cracking and exceeded the commonly used identification basis. Thus, the carbon isotopic value of methane is no longer suitable for identification of hydrocarbon source relationship in the high-over mature stage. Therefore, in the future exploration of deep gas fields, the type of natural gas parent material cannot be judged by heavy hydrocarbon isotopic composition only, but should be judged comprehensively by combining with other indicators.
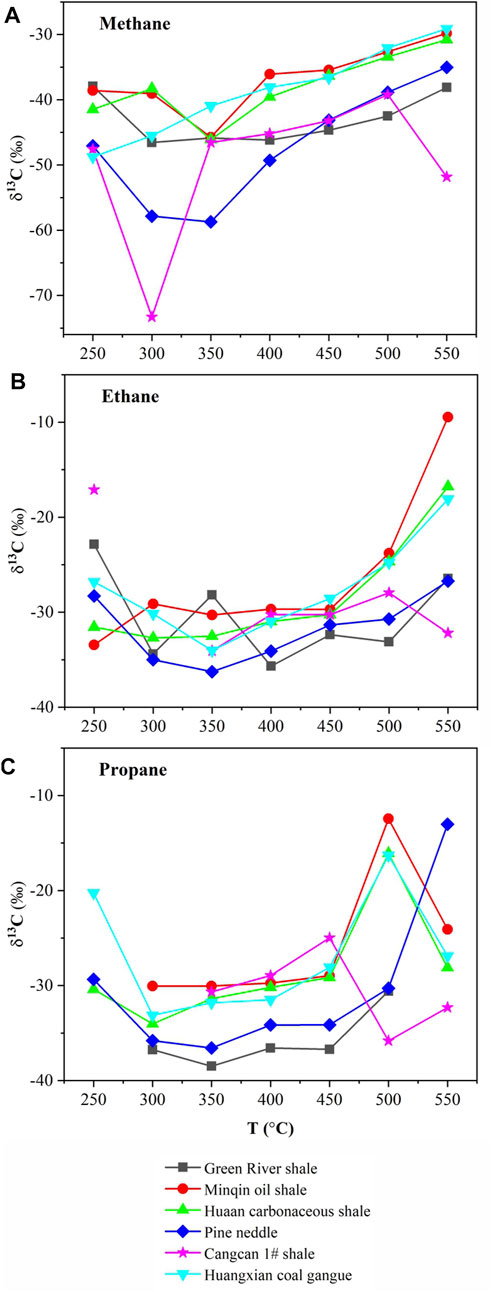
FIGURE 4. Evolution law of gas carbon isotopic of alkane simulated products from different hydrocarbon sources.
The methane carbon isotope value from different types of hydrocarbon source products were first light and then heavy with the increase of thermal simulation temperature, and an inflection point occurred after reaching the oil window.
At low temperature, there was a linear negative correlation between methane carbon isotope and simulated temperature. However, in the high temperature evolution phase, the simulated temperature was positively correlated with the carbon isotopes of methane.
In the process of hydrocarbon generation by different types of source rocks, the carbon isotope composition of their parent source had a little degree of fractionation, and which was mainly controlled by the type of parent material, with strong inheritance effect and good tracer significance. This conclusion can be used for oil source comparison and hydrocarbon source tracer research.
The evolution characteristics of gas δ13C values may be caused by the combination of organic matter type and thermal maturation under the experimental conditions. This research would provide more insights into the distribution of “reverse” isotopes of natural gases.
The original contributions presented in the study are included in the article/Supplementary Material, further inquiries can be directed to the corresponding author.
YW, YX, and YL contributed ideas and design to the study and executed the thermal simulation experiments. TW, ZW, and LY performed chemical analysis and data processing. YW wrote the first draft of the manuscript.
Financial support from the National Science Foundation (Grant Nos. 42072180; 41772147; 41272147; 41831176), the National Key R&D Program of China (Grant No. 2017YFA0604803) and the Chinese Academy of Sciences Instrument Equipment Function Development Technology Innovation Project (Grant No. E0280101). We are also particularly grateful to the anonymous reviewers for their constructive comments for the manuscript.
The authors declare that the research was conducted in the absence of any commercial or financial relationships that could be construed as a potential conflict of interest.
All claims expressed in this article are solely those of the authors and do not necessarily represent those of their affiliated organizations, or those of the publisher, the editors and the reviewers. Any product that may be evaluated in this article, or claim that may be made by its manufacturer, is not guaranteed or endorsed by the publisher.
The Supplementary Material for this article can be found online at: https://www.frontiersin.org/articles/10.3389/feart.2021.620161/full#supplementary-material
Cheng, B., Xu, J., Deng, Q., Liao, Z., Wang, Y., Faboya, O. L., et al. (2020). Methane Cracking within Shale Rocks: A New Explanation for Carbon Isotope Reversal of Shale Gas. Mar. Pet. Geology. 121, 104591. doi:10.1016/j10.1016/j.marpetgeo.2020.104591
Clayton, C. (1991). Carbon Isotope Fractionation during Natural Gas Generation from Kerogen. Mar. Pet. Geology. 8, 232–240. doi:10.1016/0264-8172(91)90010-X
Cramer, B. (2004). Methane Generation from Coal during Open System Pyrolysis Investigated by Isotope Specific, Gaussian Distributed Reaction Kinetics. Org. Geochem. 35, 379–392. doi:10.1016/j.orggeochem.2004.01.004
Deines, P. (2002). The carbon isotope geochemistry of mantle xenoliths. Earth-Sci. Rev. 58, 247–278. doi:10.1016/j.lithos.2020.105774
Dieckmann, V., Ondrak, R., Cramer, B., and Horsfield, B. (2006). Deep basin Gas: New Insights from Kinetic Modelling and Isotopic Fractionation in Deep-Formed Gas Precursors. Mar. Pet. Geology. 23, 183–199. doi:10.1016/j.marpetgeo.2005.08.002
Duan, Y., Wu, B., He, J., and Sun, T. (2011). Characterization of Gases and Solid Residues from Closed System Pyrolysis of Peat and Coals at Two Heating Rates. Fuel 90, 974–979. doi:10.1016/j.fuel.2010.10.039
Han, W., Ma, W., Tao, S., Huang, S., Hou, L., and Yao, J. (2018). Carbon Isotope Reversal and its Relationship with Natural Gas Origins in the Jingbian Gas Field, Ordos Basin, China. Int. J. Coal Geology. 196, 260–273. doi:10.1016/j.coal.2018.06.024
Hao, F., and Zou, H. (2013). Cause of Shale Gas Geochemical Anomalies and Mechanisms for Gas Enrichment and Depletion in High-Maturity Shales. Mar. Pet. Geology. 44, 1–12. doi:10.1016/j.marpetgeo.2013.03.005
Hill, R. J., Zhang, E., Katz, B. J., and Tang, Y. (2007). Modeling of Gas Generation from the Barnett Shale, Fort Worth Basin, Texas. Bulletin 91, 501–521. doi:10.1306/12060606063
James, A. T. (1983). Correlation of Nature Gas by Use of Carbon Isotopic Distribution between Hydrocarbon Components. AAPG Bull. 67 (7), 1176–1191. doi:10.1306/03B5B722-16D1-11D7-8645000102C1865D
Lewan, M. D., and Roy, S. (2011). Role of Water in Hydrocarbon Generation from Type-I Kerogen in Mahogany Oil Shale of the Green River Formation. Org. Geochem. 42, 31–41. doi:10.1016/j.orggeochem.2010.10.004
Li, E., Pan, C., Yu, S., Jin, X., and Liu, J. (2013). Hydrocarbon Generation from Coal, Extracted Coal and Bitumen Rich Coal in Confined Pyrolysis Experiments. Org. Geochem. 64, 58–75. doi:10.1016/j.orggeochem.2013.09.004
Li, W., Zhu, Y.-M., and Liu, Y. (2018). Gas Evolution and Isotopic Fractionations during Pyrolysis on Coals of Different Ranks. Int. J. Coal Geology. 188, 136–144. doi:10.1016/j.coal.2018.02.009
Liu, W., Wang, J., Tenger, G. E., Qin, J., and Zheng, L. (2012). Stable Carbon Isotopes of Gaseous Alkanes as Genetic Indicators Inferred from Laboratory Pyrolysis Experiments of Various marine Hydrocarbon Source Materials from Southern China. Sci. China Earth Sci. 55, 966–974. (in Chinese). doi:10.1007/s11430-012-4392-5
Lorant, F., Prinzhofer, A., Behar, F., and Huc, A.-Y. (1998). Carbon Isotopic and Molecular Constraints on the Formation and the Expulsion of Thermogenic Hydrocarbon Gases. Chem. Geology. 147, 249–264. doi:10.1016/S0009-2541(98)00017-5
Milkov, A. V., and Etiope, G. (2018). Revised Genetic Diagrams for Natural Gases Based on a Global Dataset of >20,000 Samples. Org. Geochem. 125, 109–120. doi:10.1016/j.orggeochem.2018.09.002
Milkov, A. V., Faiz, M., and Etiope, G. (2020). Geochemistry of Shale Gases from Around the World: Composition, Origins, Isotope Reversals and Rollovers, and Implications for the Exploration of Shale Plays. Org. Geochem. 143, 103997. doi:10.1016/j.orggeochem.2020.103997
Pan, C., Jiang, L., Liu, J., Zhang, S., and Zhu, G. (2010). The Effects of Calcite and Montmorillonite on Oil Cracking in Confined Pyrolysis Experiments. Org. Geochem. 41, 611–626. doi:10.1016/j.orggeochem.2010.04.011
Peter, D. (2002). The Carbon Isotope Geochemistry of Mantle Xenoliths. Earth-Science Rev. 58, 247–278. doi:10.1016/s0012-8252(02)00064-8
Rodriguez, N. D., and Philp, R. P. (2010). Geochemical Characterization of Gases from the Mississippian Barnett Shale, Fort Worth Basin, Texas. Bulletin 94, 1641–1656. doi:10.1306/04061009119
Tang, Y., Perry, J. K., Jenden, P. D., and Schoell, M. (2000). Mathematical modeling of stable carbon isotope ratios in natural gases. Geochim. Cosmochim. Acta 64, 2673-2687. doi:10.1016/S0016-7037(00)00377-X
Tian, H., Xiao, X., Wilkins, R. W. T., and Tang, Y. (2012). An Experimental Comparison of Gas Generation from Three Oil Fractions: Implications for the Chemical and Stable Carbon Isotopic Signatures of Oil Cracking Gas. Org. Geochem. 46, 96–112. doi:10.1016/j.orggeochem.2012.01.013
Tilley, B., and Muehlenbachs, K. (2013). Isotope Reversals and Universal Stages and Trends of Gas Maturation in Sealed, Self-Contained Petroleum Systems. Chem. Geology. 339, 194–204. doi:10.1016/j.chemgeo.2012.08.002
Wu, W., Fang, C. C., Dong, D. Z., and Liu, D. (2015). Shale Gas Geochemical Anomalies and Gas Source Identification. Acta Petrolei Sinica 36, 1332–1340. doi:10.7623/syxb201511002
Wu, X., Liu, Q., Zhu, J., Li, K., Liu, G., Chen, Y., et al. (2017). Geochemical Characteristics of Tight Gas and Gas-Source Correlation in the Daniudi Gas Field, the Ordos Basin, China. Mar. Pet. Geology. 79, 412–425. doi:10.1016/j.marpetgeo.2016.10.022
Xiong, Y. Q., Zhang, L., Chen, Y., Wang, X. T., Li, Y., Wei, M. M., et al. (2016). The Origin and Evolution of Thermogenic Gases in Organic-Rich marine Shales. J. Pet. Sci. Eng. 143, 8–13. doi:10.1016/j.marpetgeo.2014.04.001
Keywords: pyrolysis, hydrocarbon source rocks, organic matter types, gas carbon isotope, isotope inversion
Citation: Wu Y, Liu Y, Wang T, Wang Z, Yuan L and Xia Y (2021) Inversion Characteristics of Hydrocarbon Gases Carbon Isotopes Varying With Temperature and Implications for Shale Exploration. Front. Earth Sci. 9:620161. doi: 10.3389/feart.2021.620161
Received: 22 October 2020; Accepted: 23 July 2021;
Published: 17 September 2021.
Edited by:
Giovanni Martinelli, National Institute of Geophysics and Volcanology, Section of Palermo, ItalyReviewed by:
Ksenija Stojanovic, University of Belgrade, SerbiaCopyright © 2021 Wu, Liu, Wang, Wang, Yuan and Xia. This is an open-access article distributed under the terms of the Creative Commons Attribution License (CC BY). The use, distribution or reproduction in other forums is permitted, provided the original author(s) and the copyright owner(s) are credited and that the original publication in this journal is cited, in accordance with accepted academic practice. No use, distribution or reproduction is permitted which does not comply with these terms.
*Correspondence: Yingqin Wu, eWluZ3Fpbnd1QGx6Yi5hYy5jbg==
†These authors have contributed equally to this work and share first authorship
Disclaimer: All claims expressed in this article are solely those of the authors and do not necessarily represent those of their affiliated organizations, or those of the publisher, the editors and the reviewers. Any product that may be evaluated in this article or claim that may be made by its manufacturer is not guaranteed or endorsed by the publisher.
Research integrity at Frontiers
Learn more about the work of our research integrity team to safeguard the quality of each article we publish.