 Miaoling Liang1,2
 Xing Yuan2,3*
- 1National Meteorological Centre, China Meteorological Administration, Beijing, China
- 2School of Hydrology and Water Resources, Nanjing University of Information Science and Technology, Nanjing, China
- 3Key Laboratory of Regional Climate-Environment for Temperate East Asia, Institute of Atmospheric Physics, Chinese Academy of Sciences, Beijing, China
The unprecedented 2012 summer drought over the central United States was characterized by rapid intensification and severe impact and was known as a flash drought. Since then, flash drought has raised a wide concern, with considerable progresses on the definition, detection of anthropogenic footprints, and assessment of ecological impact. However, physical mechanisms related to the flash drought predictability remain unclear. Here, we show that the severity of the 2012 flash drought will be heavily underestimated without realistic initial soil moisture condition. The global Weather Research and Forecasting (GWRF) model was employed during the summers of 1979–2012, driven by observed sea surface temperature but without lateral boundary controls, which is similar to two-tier global seasonal prediction. The 2012 United States drought pattern was roughly captured by the GWRF ensemble global simulations, although with obvious underestimation of the severity. To further diagnose the role of soil moisture memory, dry and wet simulations that decrease and increase initial soil moisture by 10% were conducted. While the dry case does not significantly differ from the control case, the wet case totally missed the drought over the Central and Southern Great Plains by changing the anticyclonic circulation anomaly to a cyclonic anomaly and simulating a northward anomaly of meridional wind that brought anomalous moisture from the Gulf of Mexico and finally resulted in a failure to predict the drought. This study highlights the importance of soil moisture memory in predicting flash drought that often occurred without strong oceanic signal.
Introduction
The research on extremes is usually boosted by a few severe events. The 2012 central United States summertime drought that started from May and persisted until August was regarded as one of the most severe United States droughts since the 1930s Dust Bowl (Hoerling et al., 2014; PaiMazumder and Done, 2016). It has raised a wide concern due to its rapid onset and severe impact and has been referred to as “flash drought” (Otkin et al., 2017; Yuan et al., 2018) to differentiate from traditional drought that takes months or years to fully develop (Mo, 2011). Since 2012, flash drought has been extensively investigated from the perspectives of index development (Yuan et al., 2015a; Mo and Lettenmaier, 2015; Mo and Lettenmaier, 2016; Ford and Labosier, 2017; Christian et al., 2019; Yuan et al., 2019), detection, and attribution of long-term changes or specific extreme events (Yuan et al., 2018; Yuan et al., 2019), and assessment of drought impacts (Otkin et al., 2016; Zhang et al., 2020; Zhang and Yuan, 2020). However, the flash drought prediction remains challenging because of the lack of external signals.
The sea surface temperature (SST) anomalies have usually been considered as the main source of drought predictability, especially at interannual to decadal time scales (Smith et al., 2012). The El Niño–Southern Oscillation (ENSO), which represents the 2–7 years oscillation in winds and SSTs over the tropical eastern Pacific Ocean, affects seasonal drought predictability around the globe (Yuan et al., 2015b). The external forcings from tropical Pacific and tropical Atlantic oceans account for up to 40% of rainfall variability over the Southern Great Plains and the Gulf Coast (Seager and Hoerling, 2014). However, seasonal climate forecast models that captured the 2012 central United States drought may have an overrepresented ENSO precipitation teleconnection, which resulted in false alarms for drought prediction during nondrought years (Kam et al., 2014). Yuan and Wood (2013) suggested that global climate forecast models have false alarm rates of 40–50% for seasonal drought onset predictions, and Yuan et al. (2015b) showed that appropriate initialization of soil moisture could significantly reduce the false alarms. Based on partial correlation analysis, Yoon and Leung (2015) also found that antecedent soil moisture is as important as concurrent ENSO condition in controlling rainfall anomalies over the United States, and the former has larger influence than the latter during spring and early summer. Therefore, initial land surface conditions provide an essential source of drought predictability that needs further investigations.
The regional climate models (RCMs) have been shown as useful tools to downscale and improve seasonal climate prediction than their driving global climate forecast models (Yuan and Liang, 2011; Yuan et al., 2012; De Sales and Xue, 2013; Shukla and Lettenmaier, 2013). However, if the global climate forecast models cannot provide reasonable lateral boundary conditions for RCMs, it is difficult for RCMs to add value, especially for the predictions at long leads. The recent development of regional earth system models that incorporate the regional ocean model is expected to extend the forecast lead through regional ocean-atmosphere interaction, but the lateral boundary conditions for RCMs still influence the diagnosis, e.g., the assessment of the contributions of ocean and land surface to drought predictability might be influenced by lateral boundary conditions. As the resolution of global climate models (GCMs) increases, they have been used to investigate the effect of ocean-land-atmosphere interactions on seasonal drought predictability and prediction (Yuan and Wood, 2013; Hoerling et al., 2014; Kam et al., 2014; Wang et al., 2016; Wang et al., 2017). Nevertheless, GCMs are not tuned for a specific region, so they do not necessarily perform better than the RCMs for the regional drought simulations or predictions.
In this study, we used the global Weather Research and Forecasting model (GWRF; Richardson et al., 2007; Zhang et al., 2012) to investigate the 2012 central United States flash drought predictability from the perspective of soil moisture memory. The GWRF simulation with realistic oceanic and land surface conditions was first evaluated during the drought period, May–August of 2012. Then, the effect of initial soil moisture on drought prediction was investigated by sensitivity experiments, driven by observed SSTs. The Data, Model, and Experimental Design section describes the data, model, and experimental design, the Results section presents the simulation results, and the Conclusion and Discussion section gives the conclusions and discussion.
Data, Model, and Experimental Design
Observed Precipitation and Reanalysis Data
The daily precipitation observation was derived from the Climate Prediction Center (CPC) Unified Gauge-Based daily data (Xie et al., 2007), where gauge-observed precipitation was interpolated to 0.5 degree resolution and was then adjusted to match the climatology of the Parameter-Elevation Regression on Independent Slopes Model (PRISM) monthly precipitation to account for the orographic effects.
The atmospheric and land surface initial conditions, as well as SSTs, are provided by the Climate Forecast System Reanalysis (CFSR; Saha et al., 2010). Figure 1 shows the CFSR soil moisture anomaly on May 1, 2012 (the values in 2012 minus the average values of 1979–2012 for May 1), suggesting a slightly dry soil condition over the central United States.
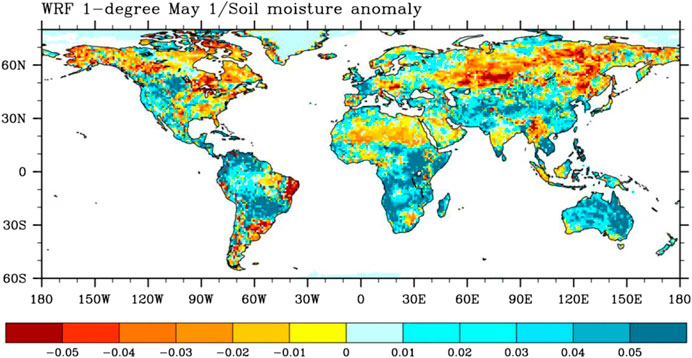
FIGURE 1. GWRF global 1 degree simulation domain. Colors represent the CFSR top 1 m soil moisture anomaly (mm/mm) on May 1, 2012, which was used as initial condition for GWRF global baseline simulations (CTL). The climatology is 1979–2012.
GWRF Model and Experimental Design
The WRF model is a state-of-the-art mesoscale model at the regional scale. However, its dynamical core is quite general and suitable for simulations from meters to thousands of kilometers (Richardson et al., 2007). In this study, the GWRF (Richardson et al., 2007; Zhang et al., 2012) was used for conducting global simulations at 1 degree resolution (Figure 1). In the GWRF simulation, the land and atmosphere were freely coupled, while the observed SST was used as lower boundary conditions over ocean. This is different from typical WRF regional climate simulation in which there is no need for the lateral atmospheric boundary conditions from reanalysis or the global climate model. So, the GWRF is suitable for land-atmosphere interaction studies without the influence of lateral boundary conditions. According to the test of physical configurations (Liang et al., 2012; Yuan et al., 2012), we used the Thompson microphysics scheme, Grell 3D ensemble cumulus scheme, NOAH land surface scheme, CAM radiation scheme, and YSU PBL scheme for GWRF simulations.
The GWRF ensemble simulations consist of 11 global simulations at 1 degree resolution, where the first set of ensemble simulations was initialized from April 21 and run to August 31 for 1979–2012, the second set of ensemble simulations was initialized from April 22 and run to August 31 for 1979–2012, and so on. The 11th set of ensemble simulations was initialized from May 1 and run to August 31 for 1979–2012. The observed SSTs from CFSR were updated every 6 h to provide lower boundary conditions over ocean. Therefore, the ensemble mean can reduce the atmospheric noises while keeping the influence from SSTs. The simulation started from May 1, 2012, was regarded as the control experiment (CTL), which has realistic land surface conditions. The dry (dry10) and wet (wet10) experiments also started from May 1, but with initial soil moisture over the United Statesdecreased or increased by 10%, respectively. The sensitivity experiments were used to explore the effect of soil moisture memory on the 2012 central United States flash drought prediction. To obtain the anomaly of model simulation results for 2012, the GWRF model was also used to simulate global May–August climate during 1979–2011, started from May 1 in each year.
Results
Figure 2A shows the May-June-July-August (MJJA) mean precipitation anomaly from CPC observation. The 2012 drought center is located over the Central Great Plains, with rainfall deficit up to 200 mm that is close to 50% of the climatology (Figure 2B). Even for the surrounding areas including eastern part of the West United States, North Plains, and eastern part of Midwest, the rainfall deficit is larger than 70 mm. The pattern of the MJJA mean rainfall anomaly is different from the pattern of initial soil moisture anomaly where southeast had a soil moisture drought on May 1 (Figure 1) but recovered during MJJA due to positive rainfall anomaly (Figure 2A). However, the dry soil over parts of the Central and Southern Great Plains (Figure 1) suggests that there might be a connection between antecedent dry soil condition and the follow-on severe meteorological drought (Figure 2A). Hoerling et al. (2014) diagnosed the circulation patterns that are responsible for the 2012 drought and found that a zonal ridge of high pressure anomalies blocked the cold fronts from Canada during May-June. During July 2012, an anticyclonic anomaly centered over the Northern Great Plains and inhibited deep convection (Hoerling et al., 2014). During August 2012, a deep Ohio Valley trough prevented moisture transporting from the Gulf of Mexico (Hoerling et al., 2014). Although the circulation patterns are different during different months, they all contribute to the severe drought.
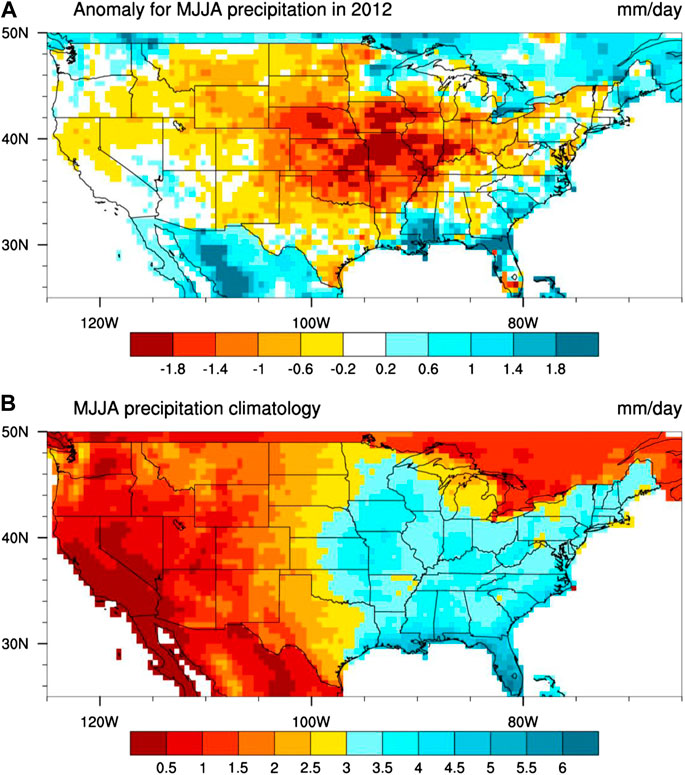
FIGURE 2. (A) Observed May-June-July-August (MJJA) mean precipitation anomaly (mm/day) during 2012, and (B) MJJA mean precipitation climatology (mm/day) during 1979–2012. The observation is from CPC-unified gauge-based analysis of global daily precipitation.
Figure 3 shows the GWRF ensemble simulation of the MJJA mean rainfall anomaly, driven by observed SSTs. This is similar to the AMIP-type simulation that can extract the oceanic signal or forcing from atmospheric noise. It is found that the model can generally reproduce the drought pattern, but the drought severity has been underestimated significantly. The underestimation could either originate from the weak forcings of oceanic anomaly or the model uncertainty. According to previous studies (Hoerling et al., 2014), there was a moderate La Niña during the winter of 2011-12, which partly contributes to the central United States drought, but it cannot fully explain the severity. Other processes, including the land-atmosphere coupling, require further investigation.
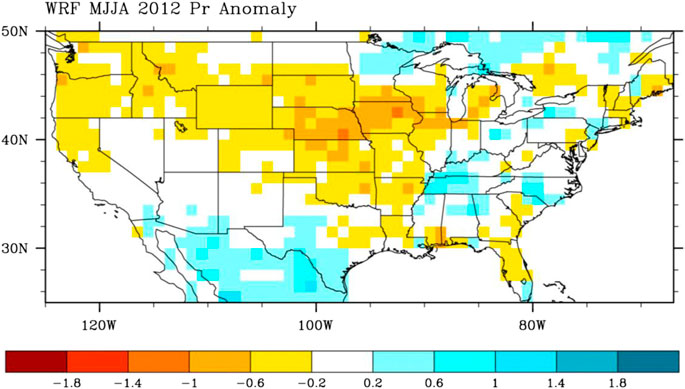
FIGURE 3. GWRF ensemble simulations of precipitation anomaly (mm/day) during May-June-July-August (MJJA) of 2012. The climatology is from GWRF global simulations during 1979–2012. The ensemble consists of 11 GWRF global 1 degree simulations with starting dates from April 21 to May 1 of 2012.
Here, we focus on the influence of soil moisture memory on drought prediction. As introduced in the GWRF Model and Experimental Design section, the initial soil moisture was increased or decreased to investigate the sensitivity. Note that, only the initial soil moisture over the United States was changed, while it was the same as the CTL experiment over other land areas of the world for the GWRF global simulation. Figure 4 shows the MJJA mean precipitation anomaly from the simulations started from May 1, 2012. Different from the GWRF ensemble simulation, the GWRF CTL simulation better reproduced the drought severity over most areas except Missouri and Arkansas (Figure 4). Decreasing initial soil moisture by 10% (dry10) does not necessarily improve drought prediction (it shows improvement over Arkansas while degradation over Midwest), but increasing initial soil moisture by 10% (wet10) results in a wet anomaly over most areas except the Midwest (Figure 4).
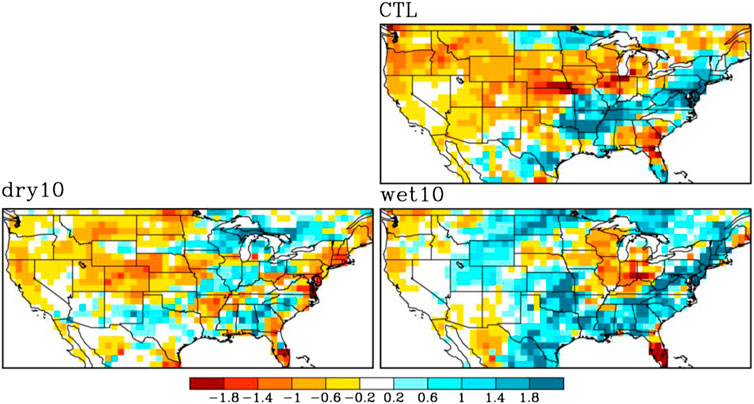
FIGURE 4. GWRF-simulated MJJA mean precipitation anomaly (mm/day) from control (CTL, started from May 1, 2012), dry (dry10, decrease initial soil moisture on May 1 by 10%), and wet (wet10, increase initial soil moisture on May 1 by 10%) experiments. All anomalies were obtained as the respective simulations (CTL, dry10 or wet10 simulations during 2012) minus the climatology (CTL simulations during 1979–2012).
To explore the reason why the GWRF wet10 experiment totally missed the drought, we analyzed the simulated anomalies in soil moisture, evapotranspiration (ET), and convective rainfall month by month (Figures 5–7), as well as the anomalies of seasonal mean atmospheric circulations (Figures 8, 9). GWRF CTL experiment shows an intensifying soil moisture drought condition from May to August for the Central Great Plains (left column of Figure 5). Meanwhile, the simulated ET anomaly switched from positive to negative over the Central Great Plains (left column of Figure 6). May was regarded as the onset stage of the 2012 flash drought, and the simulations suggest that ET increased although precipitation decreased (upper left panel of Figure 7). This is a typical hydroclimate condition for triggering a flash drought (Yuan et al., 2019), where the lack of rainfall and the enhanced ET lead to a rapid decline in soil moisture. The anomalies of convective precipitation (left column in Figure 7) are similar to the anomalies of total precipitation (not shown), and they are correlated with ET anomalies over the Central and Southern Great Plains during June–August, suggesting that both the atmosphere and land surface reach the drought condition in June. For May, the pattern of ET anomalies is quite different from the pattern of convective precipitation anomalies (upper left panel in Figures 6, 7) because the ET is not suppressed by the reduced rainfall.
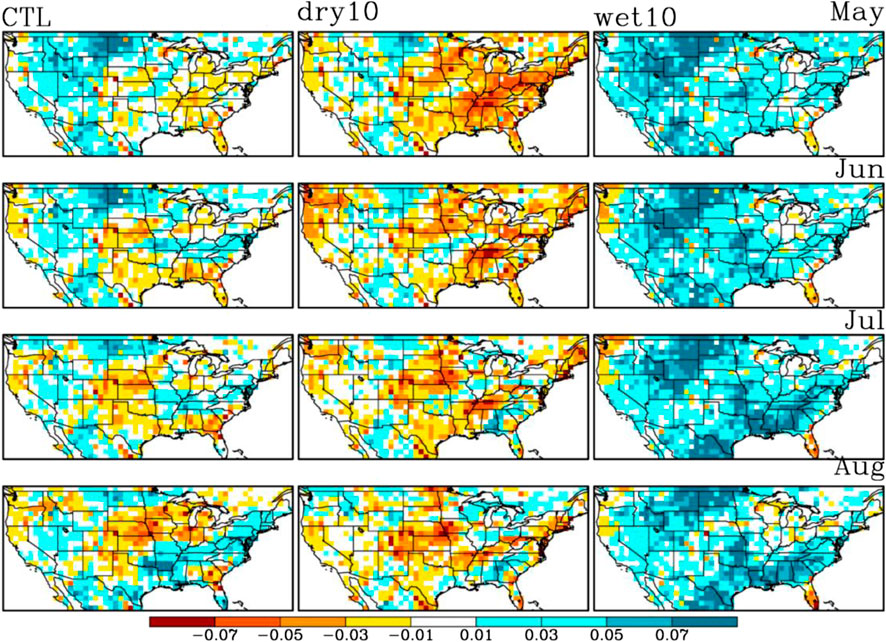
FIGURE 5. Same as Figure 4, but for GWRF-simulated monthly mean top 1 m soil moisture anomaly (mm/mm) during May–August 2012.
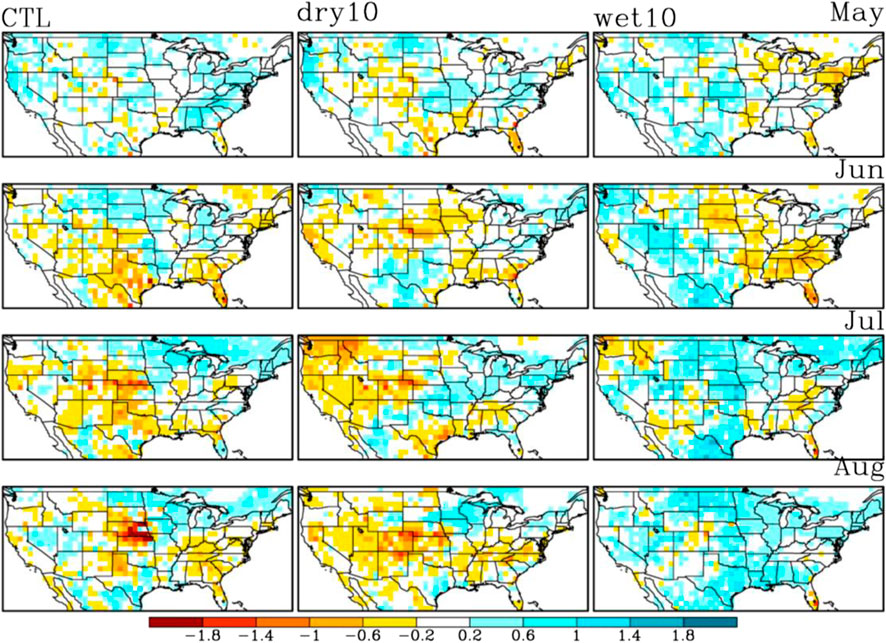
FIGURE 6. Same as Figure 4, but for GWRF-simulated monthly mean evapotranspiration (ET) anomaly (mm/day) during May–August 2012.
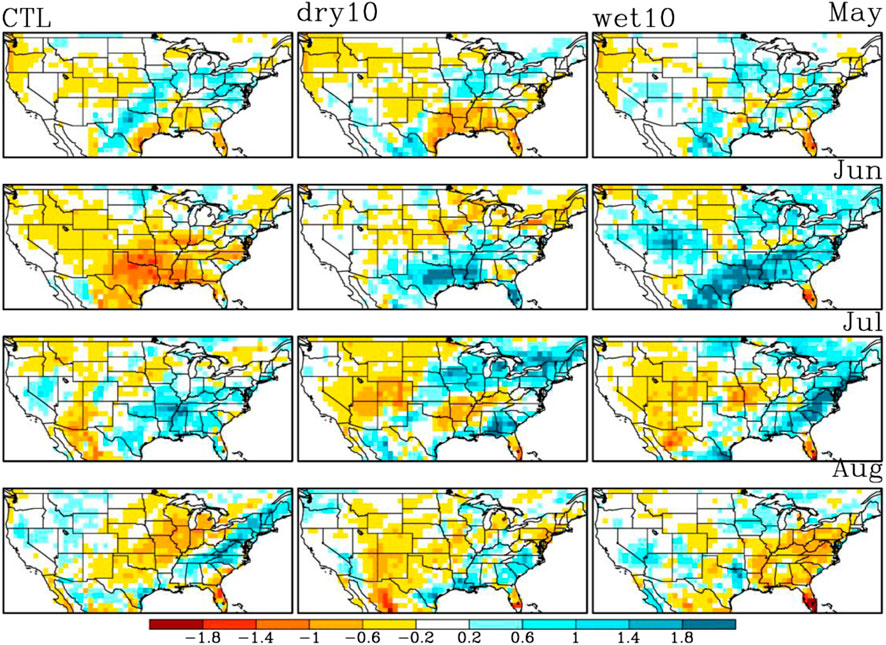
FIGURE 7. Same as Figure 4, but for GWRF-simulated monthly mean convective precipitation anomaly (mm/day) during May–August 2012.
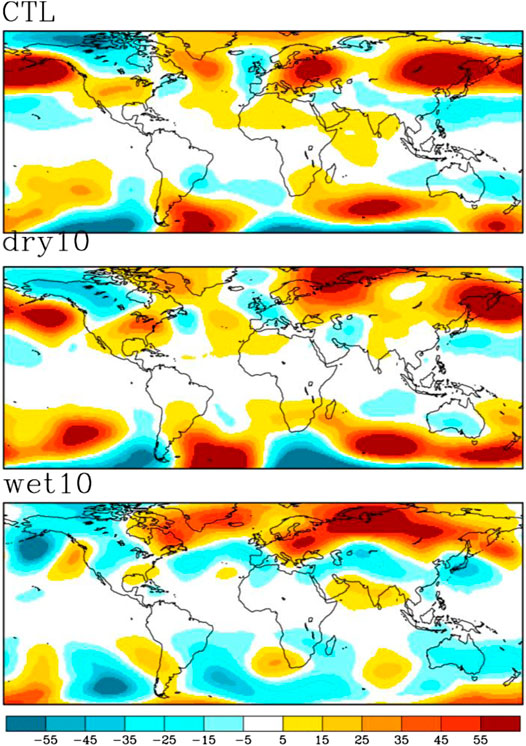
FIGURE 8. Same as Figure 4, but for GWRF-simulated MJJA mean anomalies of 500 hPa geopotential height (gpm) in 2012.

FIGURE 9. same as Figure 4, but for GWRF-simulated MJJA mean anomalies of 850 hPa meridional wind speed (m/s) in 2012. The positive anomaly means northward meridional wind, while negative anomaly means southward meridional wind.
For the dry10 experiment (middle column in Figure 5), the soil moisture is drier than the CTL experiment throughout the study period, but it does not affect the ET anomaly pattern in May (Figure 6). The ET is decreased over the Northern Great Plains in June, southeast in July, and the western United Statesin August (middle column in Figure 6). Correspondingly, the dry10 convective precipitation shows similar decreases over these regimes (middle column in Figure 7). Therefore, it takes a month for fully transferring the signal of the perturbation of soil moisture conditions to the precipitation at the regional scale. The increases in ET and convective precipitation over the Southern Great Plains during June for the dry10 experiment suggest that the land-atmosphere coupling is highly nonlinear, where soil moisture decrease does not necessary results in ET or convective precipitation decreases everywhere.
For the wet10 experiment, the differences are dramatic. Figure 5 shows that the “wet west, dry east” soil moisture anomaly does not hold, while wet anomalies occur over the whole contiguous United States (CONUS; right column). As a result, the ET anomalies are positive, except for the eastern United States in June (right column in Figure 6). Figure 7 shows that wet10 simulation does not capture the drought during May-June, with simulated convective rainfall close to or larger than climatology (right column). Even though the wet10 simulation shows a drought condition during July-August, the locations are quite different from the CTL simulation (Figure 7). The wet10 simulation suggests that increasing initial soil moisture by 10% will consistently increase MJJA mean ET and convective rainfall, but ET increase is not necessarily concurrent with the increase in convective rainfall.
Figures 8, 9 show the MJJA mean anomalies of 500 hPa geopotential height and 850 hPa meridional wind speed simulated by GWRF. In the CTL simulation, there was a positive height anomaly over the United States (top row in Figure 8), which blocked the cold air from the north and atmospheric moisture from the south and created a perfect atmospheric condition for drought. The dry10 simulation switched the position of the positive geopotential height anomaly, but it is still located over the United States (middle row in Figure 8). Meanwhile, the northward anomaly of meridional wind over the Central and Northern Great Plains also prevents cold air transported from the north (middle row in Figure 9). Therefore, the drought pattern does not change significantly in the dry10 simulation (Figure 4). However, the wet10 simulation shows a negative anomaly of geopotential height over the United States(bottom row in Figure 8), and the cyclonic atmospheric circulation anomaly not only increase total rainfall (Figure 4) but also convective rainfall, especially during the first two months (right column in Figure 7). The wet soil moisture changes surface heat fluxes, where it increases latent heat and decreases sensible heat, and the decrease in sensible heat cools the atmosphere and reduces the geopotential height due to the contraction of air parcel. Moreover, the northward anomaly of meridional wind over the Southern Great Plains and Gulf of Mexico suggests that more moisture will be transferred from the ocean to the Great Plains (bottom row in Figure 9), causing the failure to simulate the drought condition. Given that the only difference between CTL and wet10 simulations is the initial soil moisture condition over the United States, this study highlights the importance of the regional-scale soil moisture memory for regional climate prediction (Figure 9), as well as for the global climate prediction (Figure 8) because local land-atmosphere coupling can affect downstream areas by interacting with the quasistationary waves (Wang et al., 2019; Zeng et al., 2019).
Conclusion and Discussion
This study investigated the effect of soil moisture memory on flash drought prediction, by using the 2012 central United States flash drought as an example. The WRF model was employed globally (which is referred to as GWRF simulations) during the summers of 1979–2012. Given the initial conditions, the GWRF simulations were driven by observed SSTs, which are similar to the two-tier seasonal prediction. There was a moderate La Niña during the winter of 2011–12, the information of SST anomalies fed into the GWRF ensemble simulations helped to capture the drought pattern, although with significant underestimation. The AMIP-type simulations suggest that the oceanic anomaly cannot fully explain the severity of the 2012 central United States flash drought.
With a capability in roughly reproducing the 2012 flash drought, the GWRF model was used to explore the sensitivity of drought prediction to the initial soil moisture conditions. The results show that the CTL simulation with realistic initial conditions has better simulation in drought severity, followed by the dry10 simulation that decreased the initial soil moisture over the United States by 10% (while keeping soil moisture over other land areas unchanged), but the wet10 simulation that increased the initial soil moisture by 10% totally missed the drought. Further diagnosis indicates that the wet10 simulation delayed the drought by two months, with positive anomalies of ET and convective precipitation in May-June 2012. In the wet10 simulation, the MJJA mean anomalies of 500 hPa geopotential height showed a negative anomaly over the central United States, accompanied by northward anomaly of meridional wind that brought more moisture from the Gulf of Mexico and caused a wet anomaly over the central United States. While the results are based on sensitivity experiments, they imply the essential role of soil moisture memory in predicting flash drought, especially for those without strong oceanic signal.
Future study should investigate the impact of soil moisture memory based on more flash drought cases in the history and around the world (e.g., South China, southern Africa, and eastern Australia) with different climate conditions. The influence of soil moisture memory could be estimated in this study because we focused on the seasonal time scale where ocean has moderate control. In fact, the typical time scale of flash droughts is 20–40 days (Yuan et al., 2020), which is at the subseasonal time scale. Exploring flash drought predictability at the subseasonal time scale is quite necessary, and the intraseasonal oscillation (ISO) could be the potential source of predictability. Understanding the subseasonal land-atmosphere coupling is also expected to detect the additional source of flash drought predictability, and the detection could be more interesting but also more challenging if we consider the land-atmosphere-ocean interaction. The signal from land surface could be quite different with a different background of oceanic anomaly, where one could expect that the impact of land surface anomaly would be reduced if the oceanic signal is strong. This suggests that advanced land-atmosphere-ocean coupled models that incorporate multiscale interactions among various components of the climate system are necessary to predict flash droughts.
In short, flash drought is not a “monster” drought that is totally different from traditional drought, and it should be investigated within the multiscale drought framework (Yuan et al., 2020), so that our knowledge and experiences on predicting drought at seasonal to interannual time scales could be inherited and utilized.
Data Availability Statement
The raw data supporting the conclusions of this article will be made available by the authors, without undue reservation.
Author Contributions
XY conceived and designed the study. ML conducted the simulations and performed the analyses. ML and XY wrote the paper.
Funding
This work was supported by the National Natural Science Foundation of China (41875105), the National Key R&D Program of China (2018YFA0606002), and the Startup Foundation for Introducing Talent of NUIST.
Conflict of Interest
The authors declare that the research was conducted in the absence of any commercial or financial relationships that could be construed as a potential conflict of interest.
Acknowledgments
The authors would like to thank the Climate Prediction Center (CPC) for providing observed precipitation data, the National Centers for Environmental Prediction (NCEP) for providing CFSR reanalysis data, and the National Center for Atmospheric Research (NCAR) for providing the code for the WRF model.
References
Christian, J. I., Basara, J. B., Otkin, J. A., Hunt, E. D., and Xiao, X. (2019). A methodology for flash drought identification: application of flash drought frequency across the United States. J. Hydrometeorol. 20 (5), 833–846. doi:10.1175/JHM-D-18-0198.1
De Sales, F., and Xue, Y. (2013). Dynamic downscaling of 22-year CFS winter seasonal hindcasts with the UCLA-ETA regional climate model over the United States. Clim. Dyn. 41, 255–275. doi:10.1007/s00382-012-1567-x
Ford, T. W., and Labosier, C. F. (2017). Meteorological conditions associated with the onset of flash drought in the eastern United States. Agric. For. Meteorol. 247, 414–423. doi:10.1016/j.agrformet.2017.08.031
Hoerling, M., Eischeid, J., Kumar, A., Leung, R., Mariotti, A., Mo, K., et al. (2014). Causes and predictability of the 2012 Great Plains drought. Bull. Am. Meteorol. Soc. 95 (2), 269–282. doi:10.1175/BAMS-D-13-00055.1
Kam, J., Sheffield, J., Yuan, X., and Wood, E. F. (2014). Did a skilful prediction of sea surface temperatures help or hinder forecasting of the 2012 Midwestern US drought? Environ. Res. Lett. 9, 034005. doi:10.1088/1748-9326/9/3/034005
Liang, X. Z., Xu, M., Yuan, X., Ling, T., Choi, H. I., Zhang, F., et al. (2012). Regional climate-weather research and forecasting model. Bull. Am. Meteorol. Soc. 93, 1363–1387. doi:10.1175/BAMS-D-11-00180.1
Mo, K. C. (2011). Drought onset and recovery over the United States. J. Geophys. Res. 116, D20106. doi:10.1029/2011JD016168
Mo, K. C., and Lettenmaier, D. P. (2015). Heat wave flash droughts in decline. Geophys. Res. Lett. 42 (8), 2823–2829. doi:10.1002/2015GL064018
Mo, K. C., and Lettenmaier, D. P. (2016). Precipitation deficit flash droughts over the United States. J. Hydrometeorol. 17 (4), 1169–1184. doi:10.1175/JHM-D-15-0158.1
Otkin, J. A., Anderson, M. C., Hain, C., Svoboda, M. D., and Brown, J. (2016). Assessing the evolution of soil moisture and vegetation conditions during the 2012 United States flash drought. Agric. For. Meteorol. 218-219, 230–242. doi:10.1016/j.agrformet.2015.12.065
Otkin, J. A., Svoboda, M., Hunt, E. D., Ford, T. W., Anderson, M. C., Hain, C., et al. (2017). Flash droughts: a review and assessment of the challenges imposed by rapid-onset droughts in the United States. Bull. Am. Meteorol. Soc. 99 (5), 911–919. doi:10.1175/BAMS-D-17-0149.1
PaiMazumder, D., and Done, J. M. (2016). Potential predictability sources of the 2012 U.S. drought in observations and a regional model ensemble. J. Geophys. Res. Atmos. 121, 12. doi:10.1002/2016JD025322
Richardson, M. I., Toigo, A. D., and Newman, C. E. (2007). Planet WRF: a general purpose, local to global numerical model for planetary atmospheric and climate dynamics. J. Geophys. Res. 112, E09001. doi:10.1029/2006JE002825
Saha, S., Moorthi, S., Pan, H. L., Wu, X., Wang, J., Nadiga, S., et al. (2010). The NCEP climate forecast system reanalysis. Bull. Am. Meteorol. Soc. 91 (8), 1015–1057. doi:10.1175/2010BAMS3001.1
Seager, R., and Hoerling, M. (2014). Atmosphere and ocean origins of north American droughts. J. Clim. 27, 4581–4606. doi:10.1175/JCLI-D-13-00329.1
Shukla, S., and Lettenmaier, D. P. (2013). Multi-RCM ensemble downscaling of NCEP CFS winter season forecasts: implications for seasonal hydrologic forecast skill. J. Geophys. Res. Atmos. 118, 10770–10790. doi:10.1002/jgrd.50628
Smith, D. M., Scaife, A. A., and Kirtman, B. P. (2012). What is the current state of scientific knowledge with regard to seasonal to decadal forecasting. Environ. Res. Lett. 7, 15602–15612. doi:10.1088/1748-9326/7/1/015602
Wang, H. L., Schubert, S., Koster, R. D., and Chang, Y. (2019). Phase locking of the boreal summer atmospheric response to dry land surface anomalies in the Northern Hemisphere. J. Clim. 32, 1081–1099. doi:10.1175/JCLI-D-18-0240.1
Wang, L., Yuan, X., Xie, Z., Wu, P., and Li, Y. (2016). Increasing flash droughts over China during the recent global warming hiatus. Sci. Rep. 6, 30571. doi:10.1038/srep30571
Wang, S., Yuan, X., and Li, Y. (2017). Does a strong el Niño imply a higher predictability of extreme drought? Sci. Rep. 7, 40741. doi:10.1038/srep40741
Xie, P., Yatagai, A., Chen, M., Hayasaka, T., Fukushima, Y., Liu, C., et al. (2007). A gauge-based analysis of daily precipitation over east Asia. J. Hydrometeorol. 8, 607–626. doi:10.1175/JHM583.1
Yoon, J.-H., and Leung, L. R. (2015). Assessing the relative influence of surface soil moisture and ENSO SST on precipitation predictability over the contiguous United States. Geophys. Res. Lett. 42. doi:10.1002/2015GL064139
Yuan, X., Wang, L., Wu, P., Ji, P., Sheffield, J., and Zhang, M. (2019). Anthropogenic shift towards higher risk of flash drought over China. Nat. Commun. 10 (1), 4661. doi:10.1038/s41467-019-12692-710.1038/s41467-019-12692-7
Yuan, X., Liang, X.-Z., and Wood, E. F. (2012). WRF ensemble downscaling seasonal forecasts of China winter precipitation during 1982-2008. Clim. Dyn. 39, 2041–2058. doi:10.1007/s00382-011-1241-8
Yuan, X., and Liang, X. Z. (2011). Improving cold season precipitation prediction by the nested CWRF-CFS system. Geophys. Res. Lett. 38 (2), L02706. doi:10.1029/2010GL046104
Yuan, X., Ma, Z., Pan, M., and Shi, C. (2015a). Microwave remote sensing of short-term droughts during crop growing seasons. Geophys. Res. Lett. 42, 4394–4401. doi:10.1002/2015GL064125
Yuan, X., Roundy, J. K., Wood, E. F., and Sheffield, J. (2015b). Seasonal forecasting of global hydrologic extremes: system development and evaluation over GEWEX basins. Bull. Am. Meteorol. Soc. 96, 1895–1912. doi:10.1175/BAMS-D-14-00003.1
Yuan, X., Wang, L., and Wood, E. F. (2018). Anthropogenic intensification of southern African flash droughts as exemplified by the 2015/16 season. Bull. Am. Meteorol. Soc. 99 (1), S86–S90. doi:10.1175/BAMS-D-17-0077.1
Yuan, X., Wang, Y., Zhang, M., and Wang, L. (2020). A few thoughts on flash drought. Trans. Atmos. Sci. [in Chinese, with English summary] 43 (6), 1086–1095. doi:10.13878/j.cnki.dqkxxb.20200914002
Yuan, X., and Wood, E. F. (2013). Multimodel seasonal forecasting of global drought onset. Geophys. Res. Lett. 40 (18), 4900–4905. doi:10.1002/grl.50949
Zeng, D., Yuan, X., and Roundy, J. K. (2019). Effect of teleconnected land-atmosphere coupling on Northeast China persistent drought in spring-summer of 2017. J. Clim. 32 (21), 7403–7420. doi:10.1175/JCLI-D-19-0175.1
Zhang, M., Yuan, X., and Otkin, J. A. (2020). Remote sensing of the impact of flash drought events on terrestrial carbon dynamics over China. Carbon Balance Manag. 15, 20. doi:10.1186/s13021-020-00156-1
Zhang, M., and Yuan, X. (2020). Rapid reduction in ecosystem productivity caused by flash drought based on decade-long FLUXNET observations. Hydrol. Earth Syst. Sci. 24, 5579–5593. doi:10.5194/hess-2020-185
Keywords: flash drought, WRF, soil moisture, prediction, circulation 3
Citation: Liang M and Yuan X (2021) Critical Role of Soil Moisture Memory in Predicting the 2012 Central United States Flash Drought. Front. Earth Sci. 9:615969. doi: 10.3389/feart.2021.615969
Received: 10 October 2020; Accepted: 18 January 2021;
Published: 09 March 2021.
Edited by:
Vimal Mishra, Indian Institute of Technology Gandhinagar, IndiaReviewed by:
Victor Mikhailovich Stepanenko, Lomonosov Moscow State University, RussiaJasti S Chowdary, Indian Institute of Tropical Meteorology, India
Copyright © 2021 Liang and Yuan. This is an open-access article distributed under the terms of the Creative Commons Attribution License (CC BY). The use, distribution or reproduction in other forums is permitted, provided the original author(s) and the copyright owner(s) are credited and that the original publication in this journal is cited, in accordance with accepted academic practice. No use, distribution or reproduction is permitted which does not comply with these terms.
*Correspondence: Xing Yuan, eHl1YW5AbnVpc3QuZWR1LmNu