 Anna P. M. Michel
 Victoria L. Preston
 Kristen E. Fauria
 David P. Nicholson
94% of researchers rate our articles as excellent or good
Learn more about the work of our research integrity team to safeguard the quality of each article we publish.
Find out more
ORIGINAL RESEARCH article
Front. Earth Sci., 29 April 2021
Sec. Biogeoscience
Volume 9 - 2021 | https://doi.org/10.3389/feart.2021.613234
This article is part of the Research TopicRecent Advances in Natural Methane Seep and Gas Hydrate SystemsView all 14 articles
Open questions exist about whether methane emitted from active seafloor seeps reaches the surface ocean to be subsequently ventilated to the atmosphere. Water depth variability, coupled with the transient nature of methane bubble plumes, adds complexity to examining these questions. Little data exist which trace methane transport from release at a seep into the water column. Here, we demonstrate a coupled technological approach for examining methane transport, combining multibeam sonar, a field-portable laser-based spectrometer, and the ChemYak, a robotic surface kayak, at two shallow (<75 m depth) seep sites on the Cascadia Margin. We demonstrate the presence of elevated methane (above the methane equilibration concentration with the atmosphere) throughout the water column. We observe areas of elevated dissolved methane at the surface, suggesting that at these shallow seep sites, methane is reaching the air-sea interface and is being emitted to the atmosphere.
Methane (CH4) seeps are found throughout the ocean at continental margins, geologically active sites (e.g., mud volcanoes), and in hydrate fields (McGinnis et al., 2006; Reeburgh, 2007). A vast number of seep sites with CH4 bubble plumes have been identified. A central question has been whether CH4 from these seeps reaches the sea surface and impacts the global atmospheric carbon budget (e.g., James et al., 2016; Ruppel and Kessler, 2017). Recent work suggests that CH4 gas emitted in the deep ocean does not regularly reach the atmosphere because of gas exchange during bubble ascent, methane dissolution, and aerobic microbial oxidation of gas (e.g., Ruppel and Kessler, 2017). Yet, methane emitted from shallow sites has the potential to reach the ocean surface (McGinnis et al., 2006) and therefore has a disproportionate impact on gas flux across the air-sea interface. Several studies have documented the fate of methane gas from shallow (<100 m) seeps (Shakhova et al., 2010, 2014; Thornton et al., 2016; Pohlman et al., 2017). However, thorough assessments of shallow seep sites have not been completed in part because of the difficulty associated with studying bubble plumes due to their transient nature, stochastic release, and variable vigor. In this study, we contribute new observations from two shallow seep sites offshore Oregon that show elevated levels of dissolved methane are present close to the ocean surface and above bubble plumes. Bubble streams have been shown to be numerous on the Cascadia Margin; for example, during a single cruise on the E/V Nautilus (NA072), over 800 bubble streams were located with multibeam sonar at depths between 104 and 2,073 m (Baumberger et al., 2018). Bubble plumes found along Hydrate Ridge, at depths greater than 500 m, have been observed using acoustic imaging to remain coherent to approximately 460 m before dissolution, and further studies have observed elevated concentrations of CH4 in water samples around 200 m at these sites (Heeschen et al., 2003, 2005). The majority of closely studied seep sites have been found at the boundary of the hydrate stability zone, at depths between 400 and 600 m (Johnson et al., 2015), where negligible amounts of methane have been estimated to enter the atmosphere (Grant and Whiticar, 2002; Heeschen et al., 2005). Methane from shallow seep sites, just as in lakes, and reservoirs, may be greater contributors to atmospheric CH4, as bubbles can reach the surface coherently (McGinnis et al., 2006). Therefore, shallow plume sites may significantly influence the overall contribution of CH4 from the Cascadia Margin.
Methane within bubbles diffuses into seawater such that the concentration of dissolved CH4 may become elevated in the water surrounding bubble plumes (e.g., McGinnis et al., 2006). Areas of elevated dissolved CH4 have been observed at the surface of waters along Hydrate Ridge in addition to elevated surface concentrations near the coast due to upwelling (Rehder et al., 2002; Heeschen et al., 2005). Yet, few studies have demonstrated the existence of methane bubble plumes below areas of elevated CH4 recorded at the surface ocean (Reeburgh, 2007). In addition, the spatial distribution of dissolved CH4 in near surface waters has not been well resolved. Typically, to measure dissolved CH4 in the water column at sea, CTD rosettes are used to collect water samples for ex situ analysis. The number of CTD casts that can be conducted is small compared to the size of the entire region, and the sparsity makes resolving the distribution of CH4 in surface layers difficult.
Gas bubbles are strong acoustic reflectors such that bubble plumes can be identified by their “flare” shapes and high backscatter signal using acoustic instruments (Heeschen et al., 2003; Leifer et al., 2006; Westbrook et al., 2009). Shipboard multibeam acoustic surveys have been used to identify bubble plumes in the water column (Greinert et al., 2010; Colbo et al., 2014; Wilson et al., 2015; Loher et al., 2018). Acoustic surveys can then be used to identify plumes to ultimately inform target locations for dissolved methane measurements (e.g., via CTD casts).
In order to investigate and spatially resolve surface concentrations of dissolved methane, which would otherwise be difficult or impossible to do with CTD casts and acoustic studies alone, we apply a coupled technological approach. Specifically, we combined multibeam sonar with a field-portable laser-based spectrometer which was mounted on the ChemYak (Nicholson et al., 2018), a robotic surface kayak equipped with a suite of chemical sensors, to examine the concentration of dissolved methane near active bubble plumes. We demonstrate our technique at two shallow (<75 m depth) seep sites on the Cascadia Margin. Elevated dissolved methane (above the methane equilibration concentration with the atmosphere) was present from the seafloor throughout the water column including at the surface, suggesting that at these shallow sites, methane is reaching the air-sea interface and being emitted to the atmosphere.
Ship-based multibeam acoustic sonar on the R/V Falkor was used to locate areas of methane seepage on the Cascadia Margin in September 2018 (Schmidt Ocean Institute Hunting Bubbles Cruise – FK180824). This multibeam sonar was utilized to find bubble plumes during bathymetric mapping surveys by searching for mid-water plume signatures in the sonar signal. At the areas of active seepage, a Niskin rosette along with a CTD were deployed for water column analysis. Dissolved methane concentrations within the Niskin bottle water samples were analyzed shipboard, immediately after collection, using a field-portable dissolved gas extractor and a laser-based spectrometer. After confirming elevated methane was present in the water column, an unmanned surface vehicle, the ChemYak, equipped with the same gas extractor and laser-based spectrometer was launched to take dense spatial measurements of dissolved methane in the near-surface waters. A surface vehicle has great benefit to shallow seep sites as they are too shallow for diving utilizing a large, deep submergence remotely operated vehicle (ROV).
The R/V Falkor has a hull-mounted Kongsberg EM710 multibeam system with an operational range of 70–100 kHz, well suited for observing shallow (<2000 m) sites. The swath width of the system is 175–250 m when working at depths of 35–75 m. Bubble plumes were initially visually identified in real time during bathymetric mapping of the areas. The latitude and longitude of the bubble plume sources were determined using the ship’s location. Following the cruise, FM Midwater (QPS, Fledermaus) was used to fully process the EM710 data and for confirming bubble plume locations. The plume sites reported in this article represent all observations conducted by repeated multibeam surveys. Due to the challenges of defining unique plumes from multiple observations (Johnson et al., 2015, 2019) and the spatially and temporally discontinuous nature of bubble emissions (Westbrook et al., 2009; Römer et al., 2016), not all reported sites may be unique. Multiple bubble streams were classified as one plume when they were within close proximity (<50 m of each other).
Bubble plumes were located in two shallow areas, Yachats seep site and Stonewall Bank seep site, based on the sonar surveys, utilizing a water column view approach (Figure 1). The Yachats seep site (44°21′N, 124°10′ W) has an average depth of 46 m, whereas the Stonewall Bank seep site (44°27′N, 124°16′ W), located further from shore, is slightly deeper with an average depth of 68 m. The seafloor at both sites is located above the gas hydrate stability zone. Bubble plumes in the vicinity of the Stonewall Bank site have been previously reported (NOAA Northwest Fisheries Science Center and Southwest Fisheries Science Center, 2015; Riedel et al., 2018) using an EK60 sonar. To the best of our knowledge, the Yachats seep site has not been previously identified, possibly due to its close proximity to the shore.
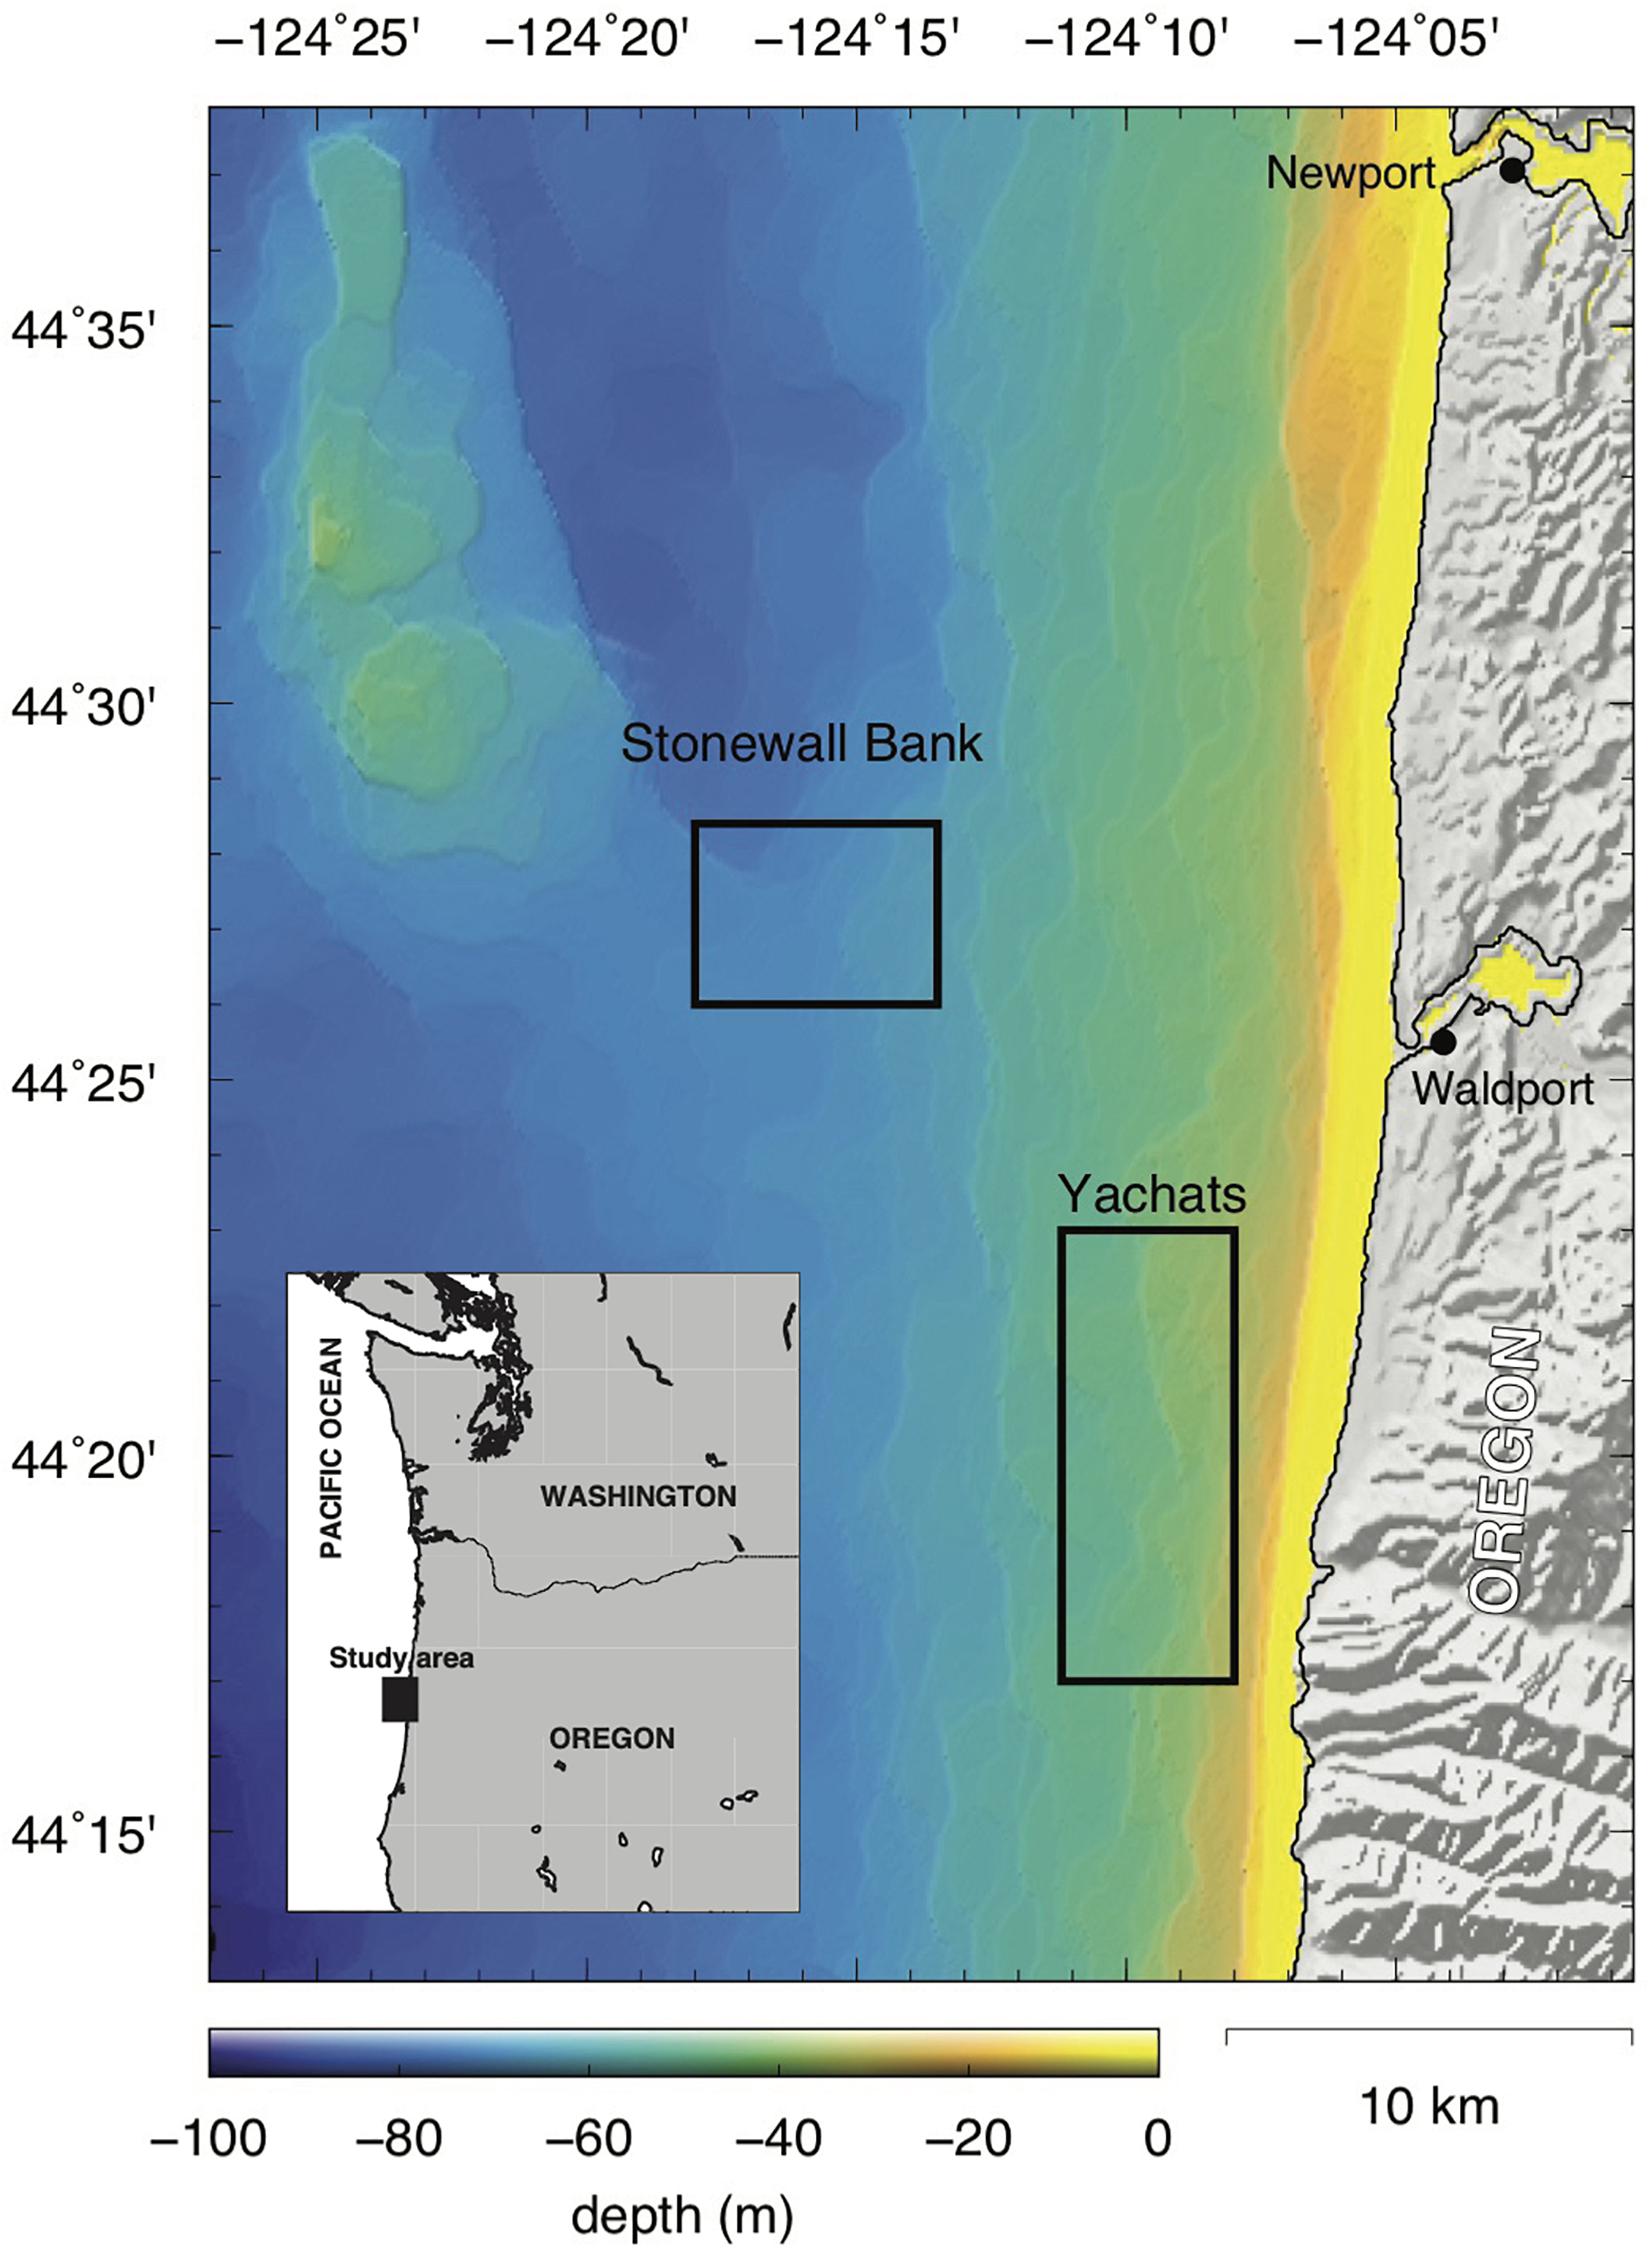
Figure 1. Locations of Yachats and Stonewall Bank seep sites on the Cascadia Margin, offshore Oregon, United States. Background bathymetry sourced from GeoMapApp (http://www.geomapapp.org/).
A Los Gatos Research (LGR) Dissolved Gas Extraction Unit (DGEU), which utilizes a membrane contactor for dissolved gas extraction, was coupled to an LGR Greenhouse Gas Analyzer (GGA) to measure dissolved methane in seawater (Nicholson et al., 2018). The GGA utilizes off-axis integrated cavity output spectroscopy (OA-ICOS), for making fast (1 Hz), precise [<2 parts per billion (ppb)] measurements of methane. The GGA has a measurement range of 0 - 100 ppm and a precision of < 2 ppb (1 s). Calibration of the methane concentration was completed using gas standards (Mesa Gas) (Supplementary Figure 1). Methane concentration is measured by the GGA in parts per million (ppm), which is then converted to nM (nanomolar) using the salinity and temperature of the target water mass measured with a coupled CTD. The gas extraction technique does not completely separate gas from a water sample, so we apply a compensating extraction efficiency correction. For the DGEU used in this study, an extraction efficiency of 5.09% was determined by a series of validation tests previously performed in the Arctic (Manning et al., 2020) and applied to all data. When this extraction efficiency was applied to the data reported here, it resulted in consistent values for the baseline dissolved methane concentrations that are in equilibrium with atmospheric values.
To investigate the vertical distribution of dissolved methane in the water column, water samples were collected for analysis shipboard using a Niskin rosette (SBE32 Carousel Water Sampler) at both Stonewall Bank and Yachats seep sites. Mounted to the rosette was a CTD (SBE 9 Plus) for measuring water column salinity and temperature along with a dissolved oxygen sensor (SBE 43). Three casts were made at the Yachats seep site and one cast was made at the Stonewall Bank seep site for water collection (Table 1). At the conclusion of each cast, water samples collected by the rosette were immediately analyzed shipboard by plumbing the DGEU inlet directly to a Niskin bottle and using the GGA to measure the methane concentration of the extracted gas. The coupling of the GGA to the DGEU for seawater analysis enables a high-precision, high sensitivity atmospheric methane sensor to be used for the rapid analysis of dissolved gases in ocean waters shipboard. It should be noted that there was a time delay between when each water sample was collected and when each Niskin bottle was analyzed with the GGA. However, any degassing that occurs from a Niskin bottle will result in an underreporting of dissolved methane concentration and not an overreporting.
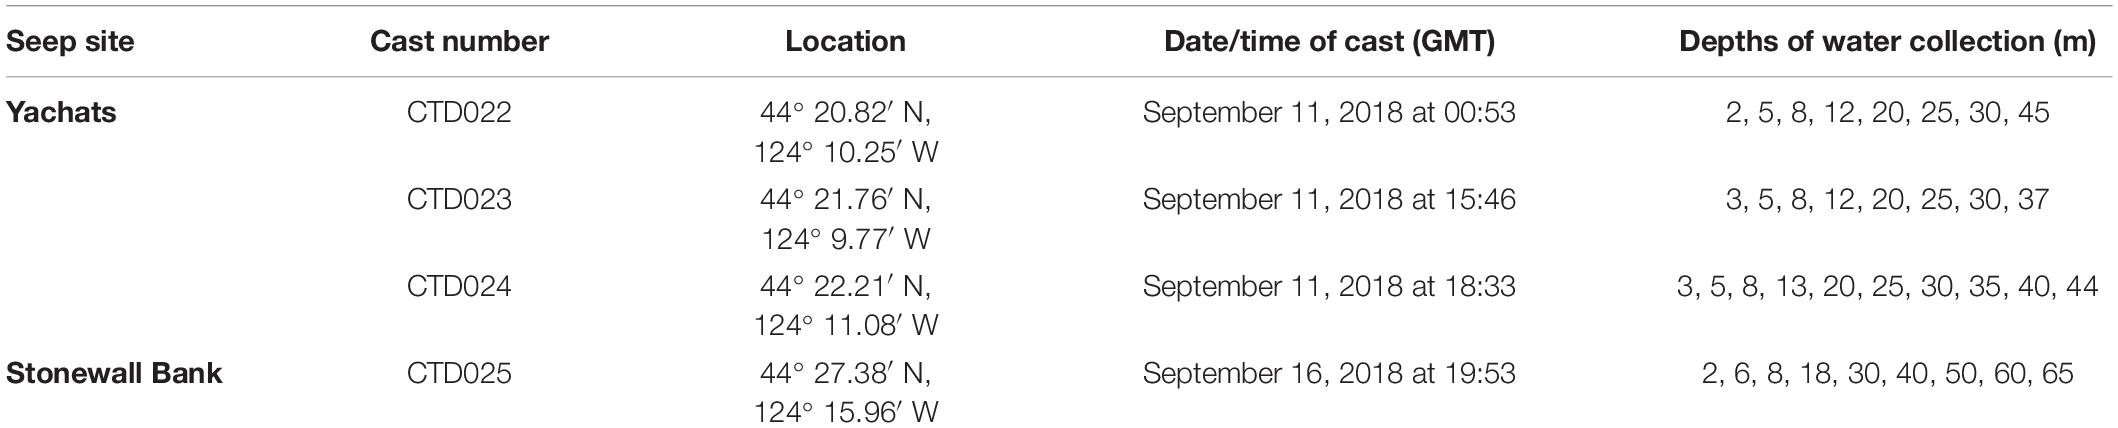
Table 1. Niskin rosette/CTD casts.
In order to identify areas of elevated dissolved methane in the water column, a baseline atmospheric methane fraction of 1.86 ppm was utilized for both the Yachats and Stonewall Bank seep sites to calculate an expected equilibrium value. To convert this measurement to nM, spatially averaged, depth-dependent salinity and temperature measurements were computed from aggregated transects completed by the ChemYak for surface waters at both Yachats and Stonewall Banks sites. A dissolved methane concentration of 2.7 nM was found for the surface by using an average salinity of 32.47 PSU and a temperature of 13.18°C. For all three casts at the Yachats seep site, the equilibrium value of dissolved methane at different depths was estimated based on the salinity and temperature values measured at each of those depths during the CTD024 cast. At the Stonewall Bank seep site, the salinity and temperature values were obtained from cast CTD025.
The ChemYak (Figure 2) is a remotely controlled robotic kayak, or JetYak surface vehicle, developed at the Woods Hole Oceanographic Institution outfitted with a suite of chemical sensors for in situ greenhouse gas measurements in coastal and polar environments (Kimball et al., 2014; Nicholson et al., 2018; Manning et al., 2020). The ChemYak chassis is a Mokai gas-powered air-jet propulsion kayak with servo-driven controls. A PixHawk autopilot and wireless radio network (2.4 GHz) is used to remotely operate the vehicle, and an onboard computer is used for data logging. The ChemYak has a draft of less than 20 cm and above water height of less than 2 m and is driven at an average speed of 1 m/s.
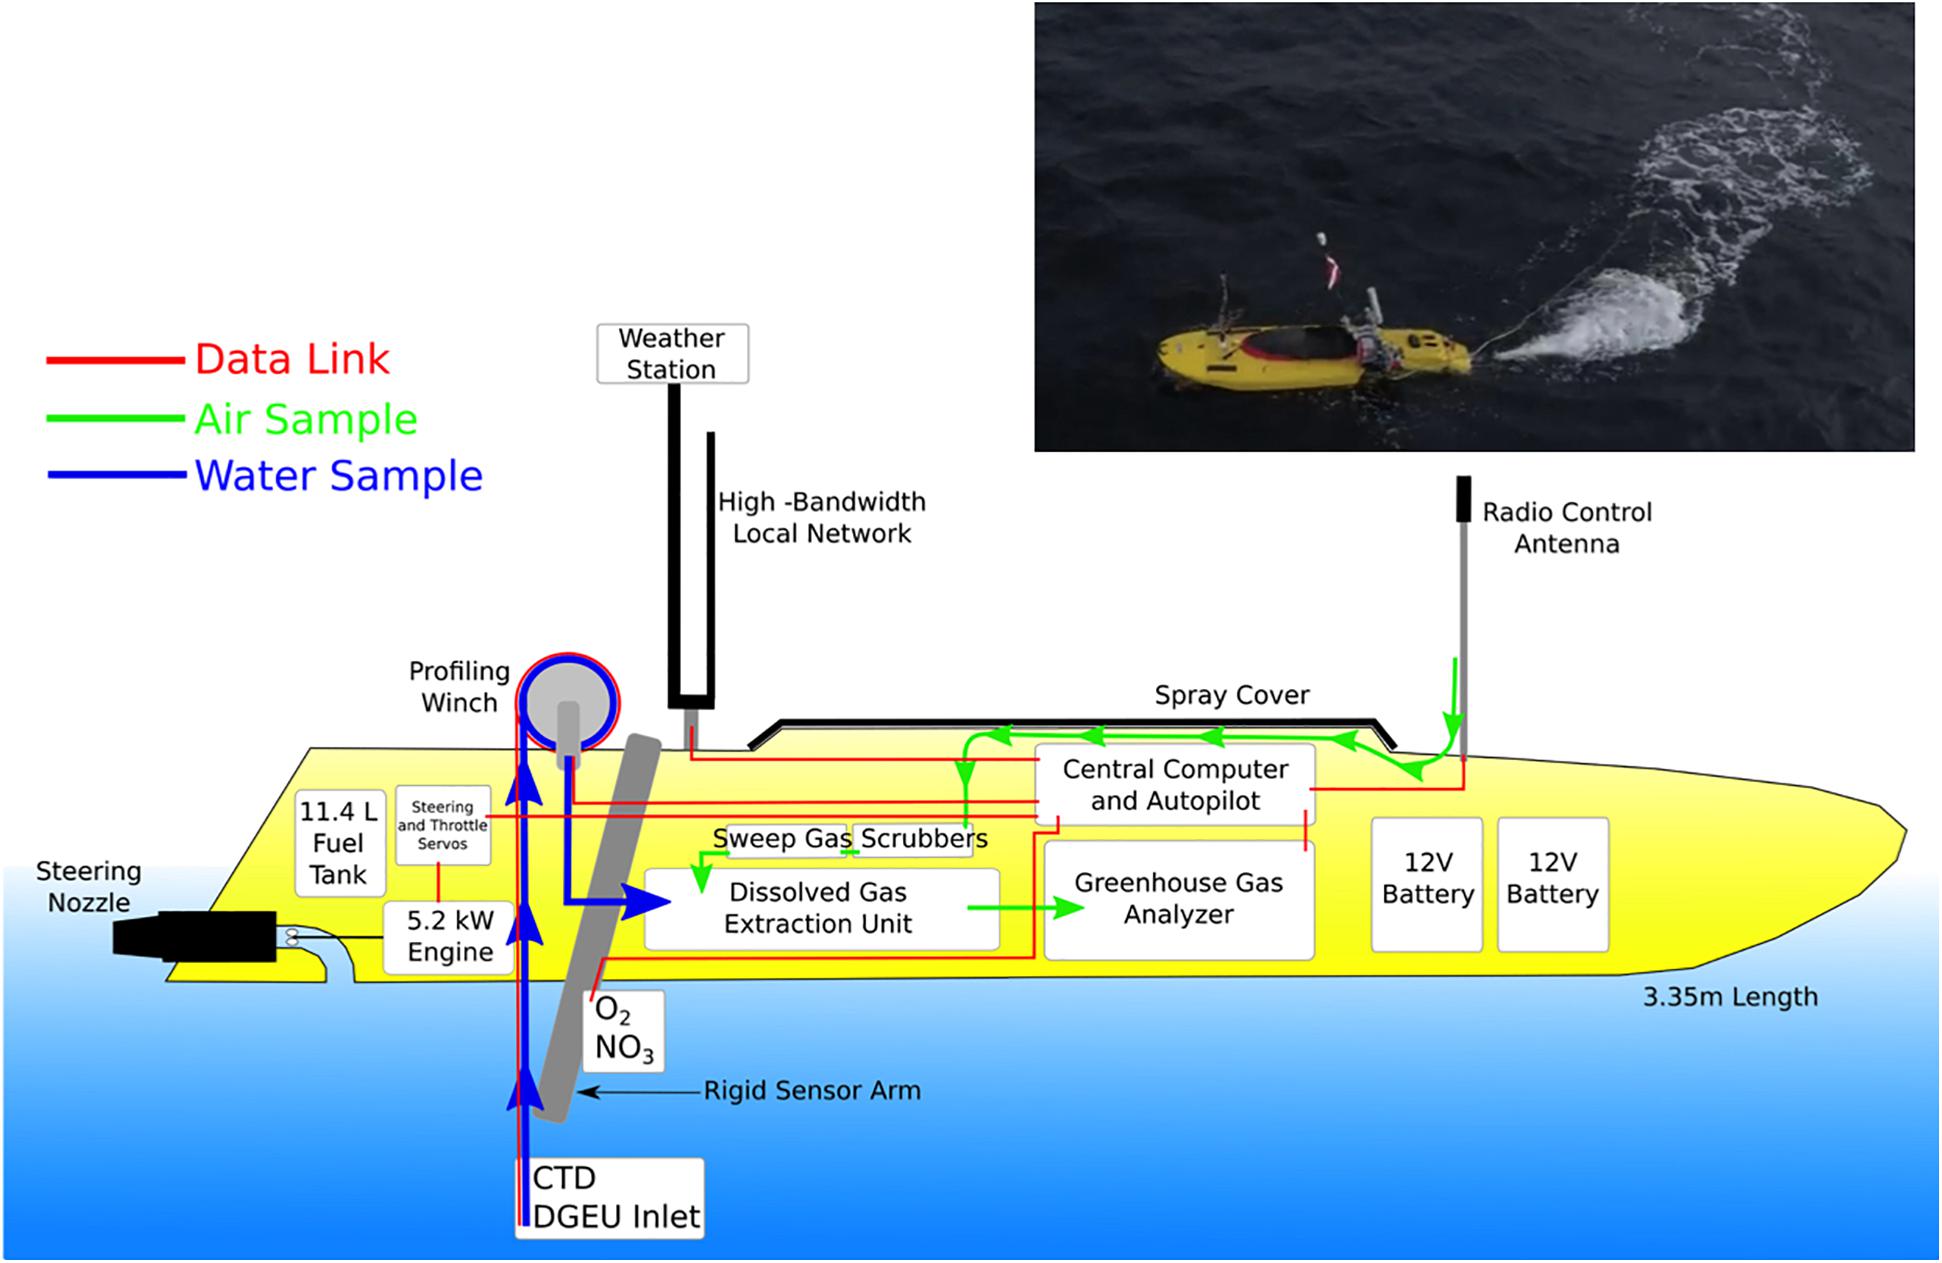
Figure 2. The ChemYak, an unmanned surface vehicle, utilizes a suite of chemical sensors for surface water analysis (Kimball et al., 2014; Nicholson et al., 2018; Manning et al., 2020). Inset shows an image of the ChemYak deployed at Cascadia Margin.
The ChemYak was deployed at the Cascadia Margin with a payload suite consisting of the DGEU, GGA, a CTD (RBR Concerto), and an air-marine weather station. All instruments were set to log at 1 Hz. The weather station was mounted to the mast of the vehicle (∼1.5 m above sea level), and used to log the GPS location of the vehicle, with standard 3 m accuracy for GPS navigation. A winch, with a 10 m cable, mounted at the back of the ChemYak was used to lower the CTD and the inlet tube for the DGEU into the surface waters, allowing measurements of methane to be made throughout the top 10 m of the water column. A small lag time (14–20 s) exists between the water entering the sampling tubing and the actual measurement in the GGA. The ChemYak enables fine resolution observations of surface waters due to the sampling rate of its instruments coupled to its speed, helping to reveal spatial features and resolve methane measurements in a target region of the water column that is classically difficult to capture with a Niskin rosette or with a ship flow-through system.
The ChemYak was deployed over the side of the R/V Falkor in sea state 2 conditions (smooth wavelets 0.1–0.5 m average wave height; Table 2) and remotely operated by a human pilot, in a secondary watercraft, who was equipped with a set of preliminary bubble plume coordinates determined from the shipboard multibeam. The secondary watercraft was deployed to enable driving and monitoring of the ChemYak in the open ocean, and to allow the human pilot to better observe sea-state conditions while operating the vehicle. The time between plume location using multibeam sonar and the deployment of the ChemYak was on the order of hours.
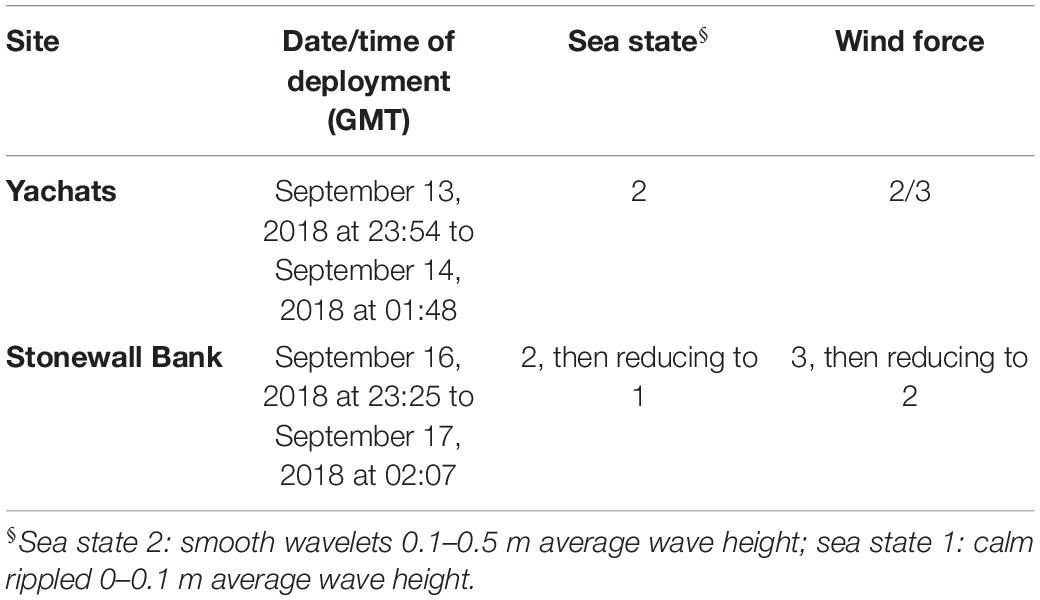
Table 2. ChemYak deployment conditions.
Following a mission and upon return to the ship, the data logged on the ChemYak computer were saved to external drives for post-processing and analysis. Quality control of the data collected by each instrument was performed by human inspection, largely to remove launch and recovery segments of the mission which tended to be noisy due to pulling air through the DGEU, to check for data dropout, and to correct for instrument time-response. Measurements from all instruments were linearly interpolated onto a common time frame in order to directly associate methane measurements with salinity, temperature, depth, and geolocation recorded by other instruments. Additionally, observations from the GGA were converted from ppm to nM following the procedure previously outlined (from Nicholson et al., 2018), using the salinity and temperature measurements from the CTD which was co-located with the DGEU inlet.
A single survey of the surface waters of each of the two seep sites, Yachats and Stonewall Bank, was completed using the ChemYak. In aggregate across the two sites, over 16,500 measurements (>4.5 recorded hours at 1 Hz logging frequency) of dissolved methane were recorded using the combined DGEU and GGA set-up on the ChemYak, representing over 20 km traveled by the ChemYak.
Multibeam sonar acoustic surveys of the Yachats area resulted in the identification of 92 seep sites with bubble plumes (Figure 3, Supplementary Figure 2 and Supplementary Table 1). Many of these plumes were composed of multiple bubble streams (Figure 4). We resurveyed portions of the Yachats area 2–3 times such that a single seep site may be represented multiple times in our dataset. We do not attempt to quantify duplicate observations because: (1) the tracklines of the ship varied between surveys making direct comparisons difficult (Supplementary Figure 2); and (2) the intensity of bubble plumes can vary in time which also adds uncertainty to comparisons of repeat surveys.
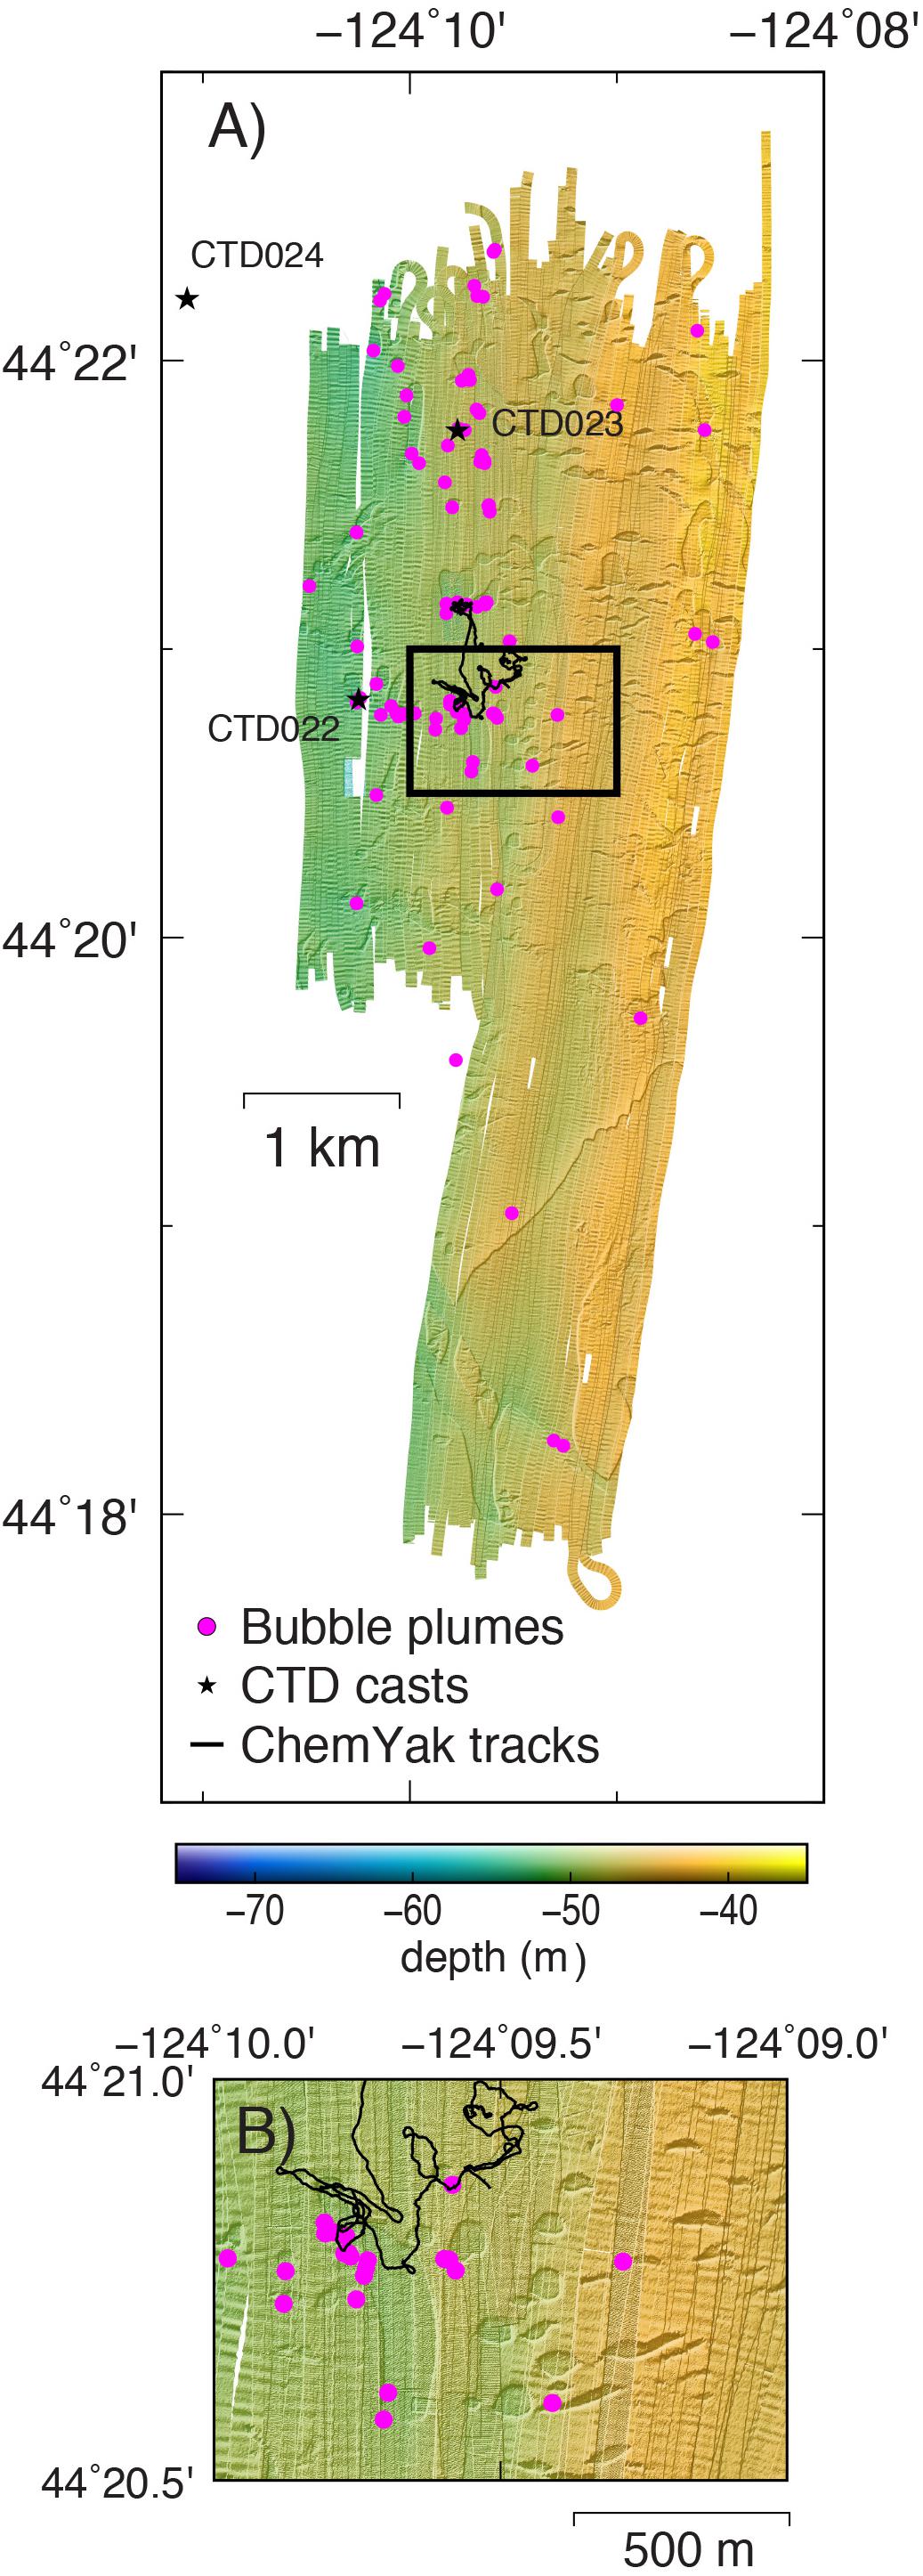
Figure 3. Yachats seep site. (A) Locations of bubble plumes, CTD casts, and ChemYak tracks are plotted with the bottom bathymetry derived from the EM710 multibeam data and gridded at 1 m resolution. (B) The zoomed in area shows the pockmark features on the seafloor located close to bubble plume sites.
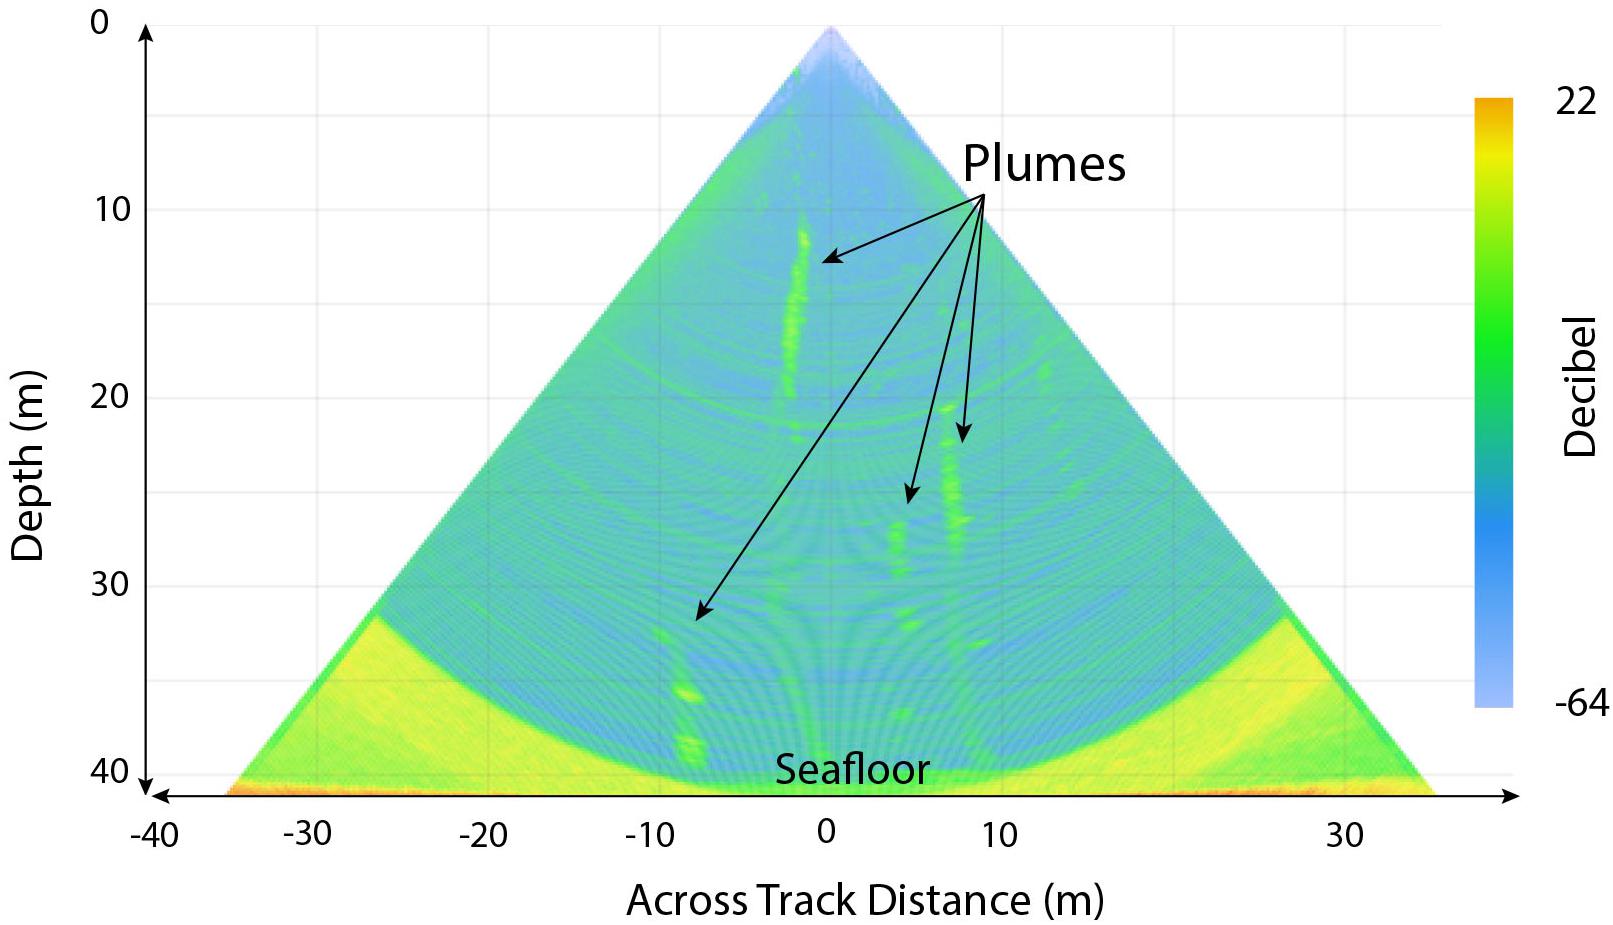
Figure 4. Representative bubble plumes detected with the Kongsberg EM710 multibeam system within the Yachats study area. This image shows how multiple bubble plumes were sometimes present in close proximity on the seafloor. The plumes rise vertically and to variable distances in the water column. This 2D fan view image was created by selecting the highest hydroacoustic sounding from a 14 m thick swath and using Qimera software. These plumes were detected on September 11, 2018 at 1:39:27 UTC and at 44° 20.78′ N, 124° 9.78′ W.
Of the 92 bubble plumes identified, 68 were located within 50 m of the edge of a seafloor depression (i.e., potential pockmarks or trawl marks), 9 were located farther than 50 m from a seafloor depression, and 15 were located above bathymetric features that were not resolvable (Figure 3).
The three CTD profiles collected at the Yachats site all showed elevated methane at depths throughout the water column (Figure 5 and Supplementary Table 2). CTD022 and CTD023 were made at sites with reported bubble plumes. CTD024 was made at a location where no multibeam sonar data were collected; thus, we do not have information about its proximity to a plume. However, methane concentrations measured from CTD024 are lower than concentrations measured during casts near verified plumes (CTD022 and CTD023). During all three casts, significantly elevated methane of 9–22 nM was observed at depths between 12 and 45 m. Low oxygen levels, including hypoxic conditions at the deepest 3–7 m of each cast, were correlated with higher methane measurements.
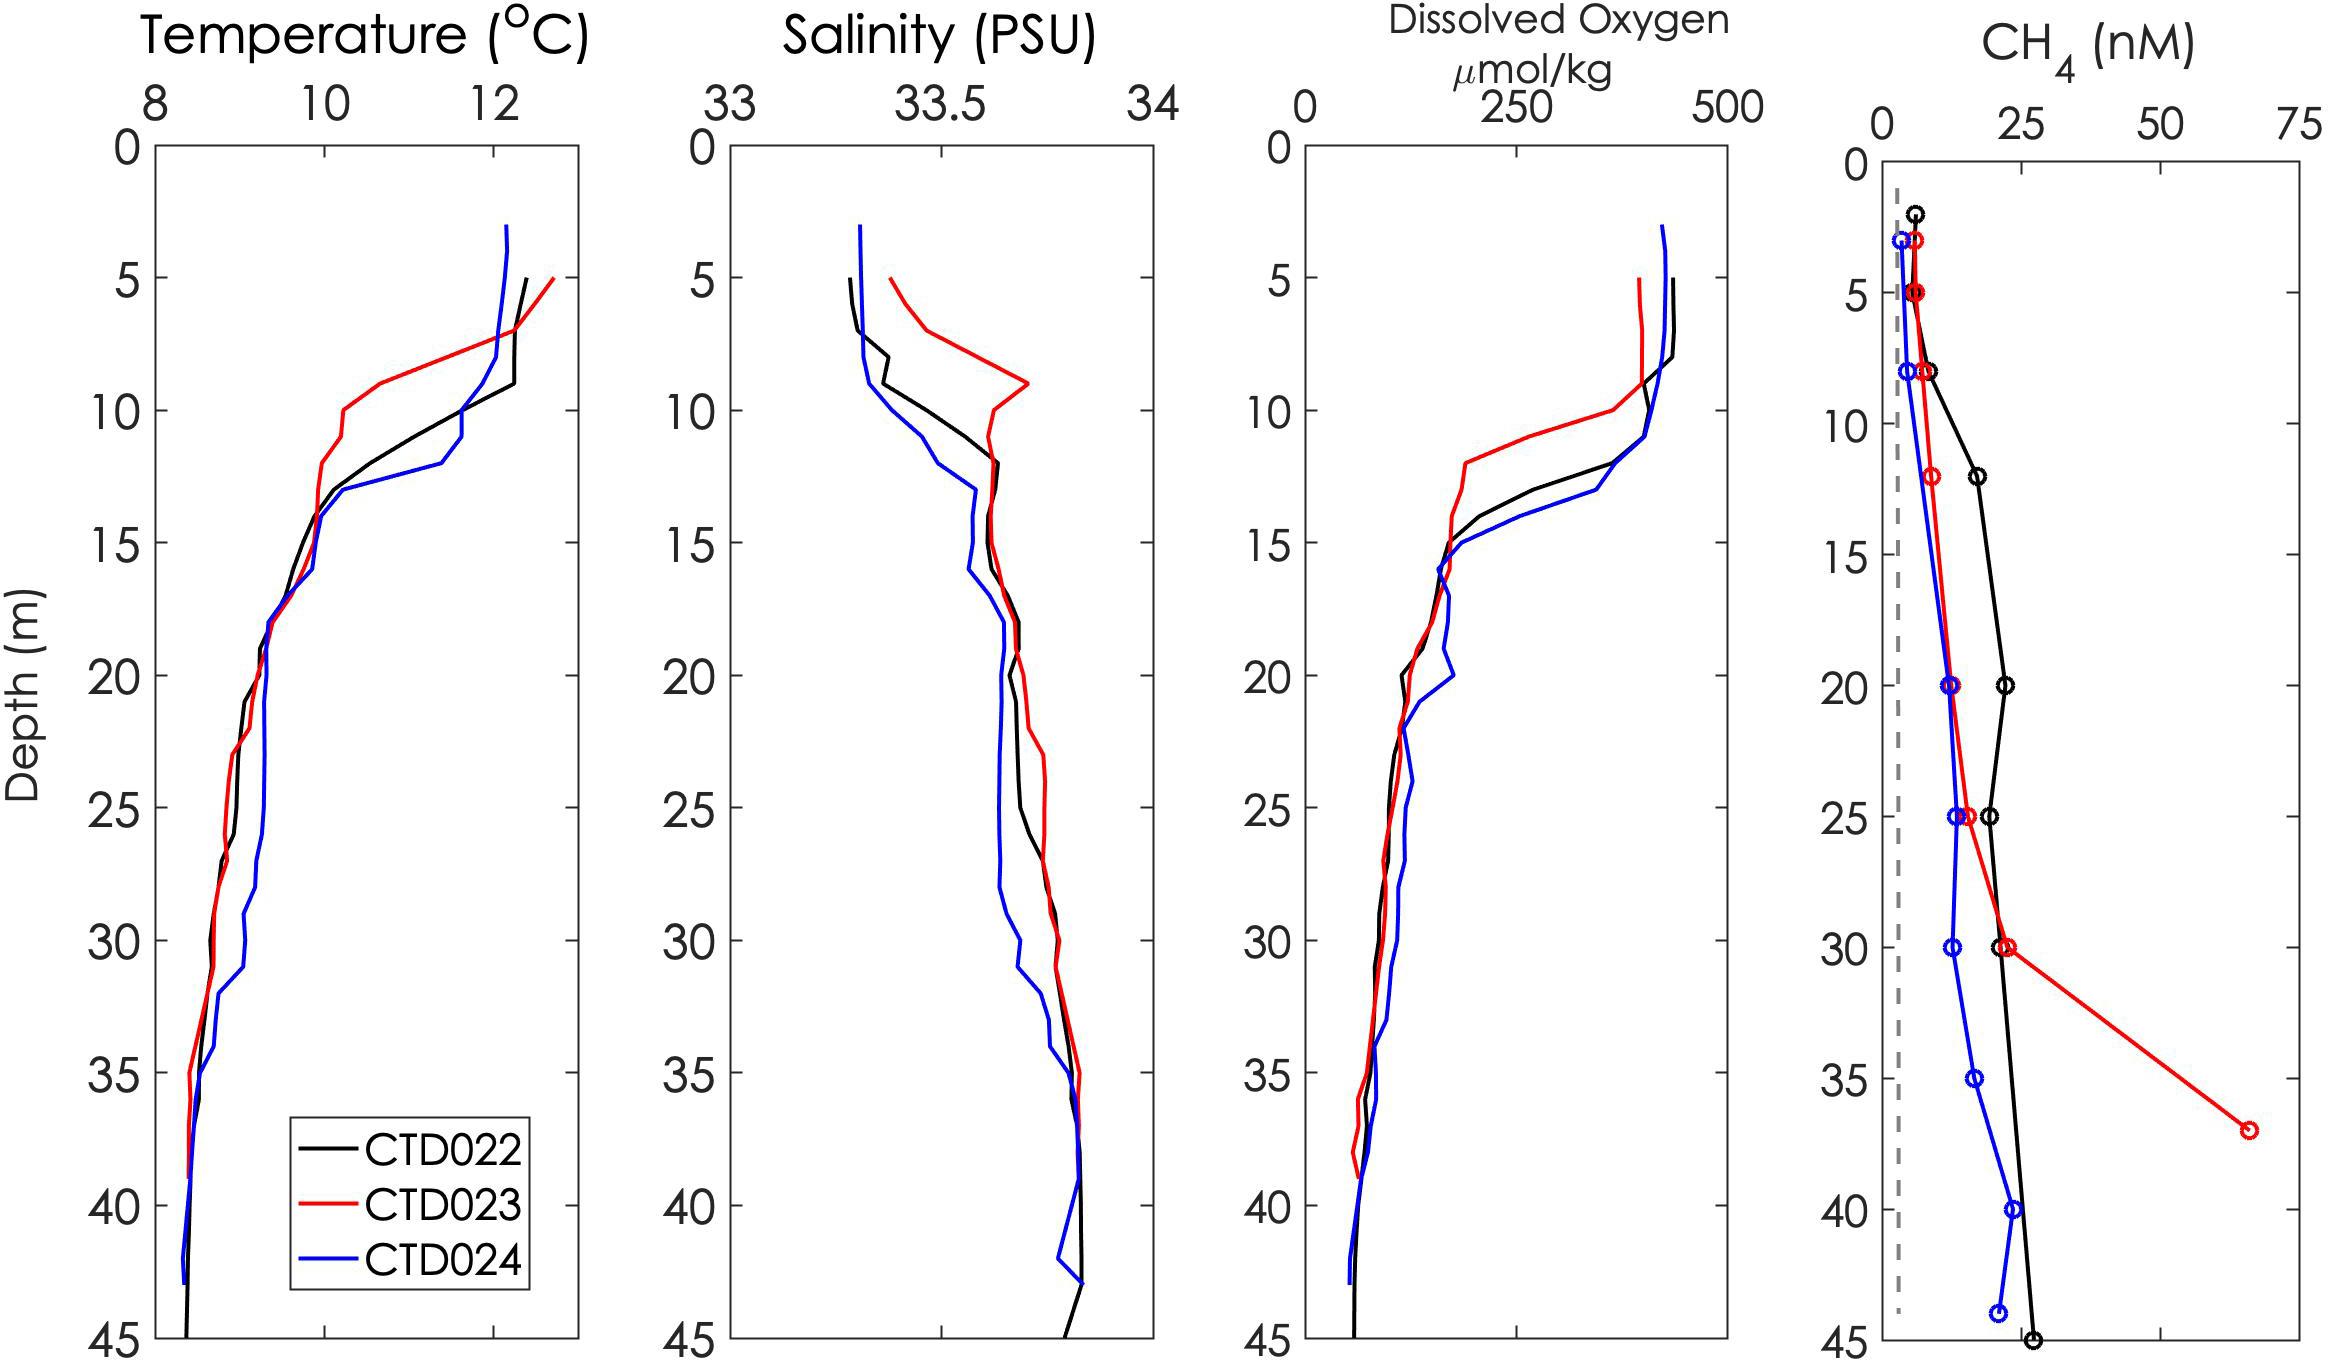
Figure 5. Three CTD casts were made at the Yachats seep site. Colors shown represent: CTD022, black; CTD023, red; CTD024, blue. Analysis of the water samples collected with the Niskin bottles show the presence of elevated methane in the water column. The dashed gray line shows the methane equilibration concentration with the atmosphere calculated using temperature and salinity conditions from CTD024.
Within the region mapped by the ChemYak, at least one coherent region of elevated methane reaching 6.5 nM was observed at the surface centered at 44° 20.93′ N, 124° 9.67′ W (Figure 6 and Supplementary Figure 3).
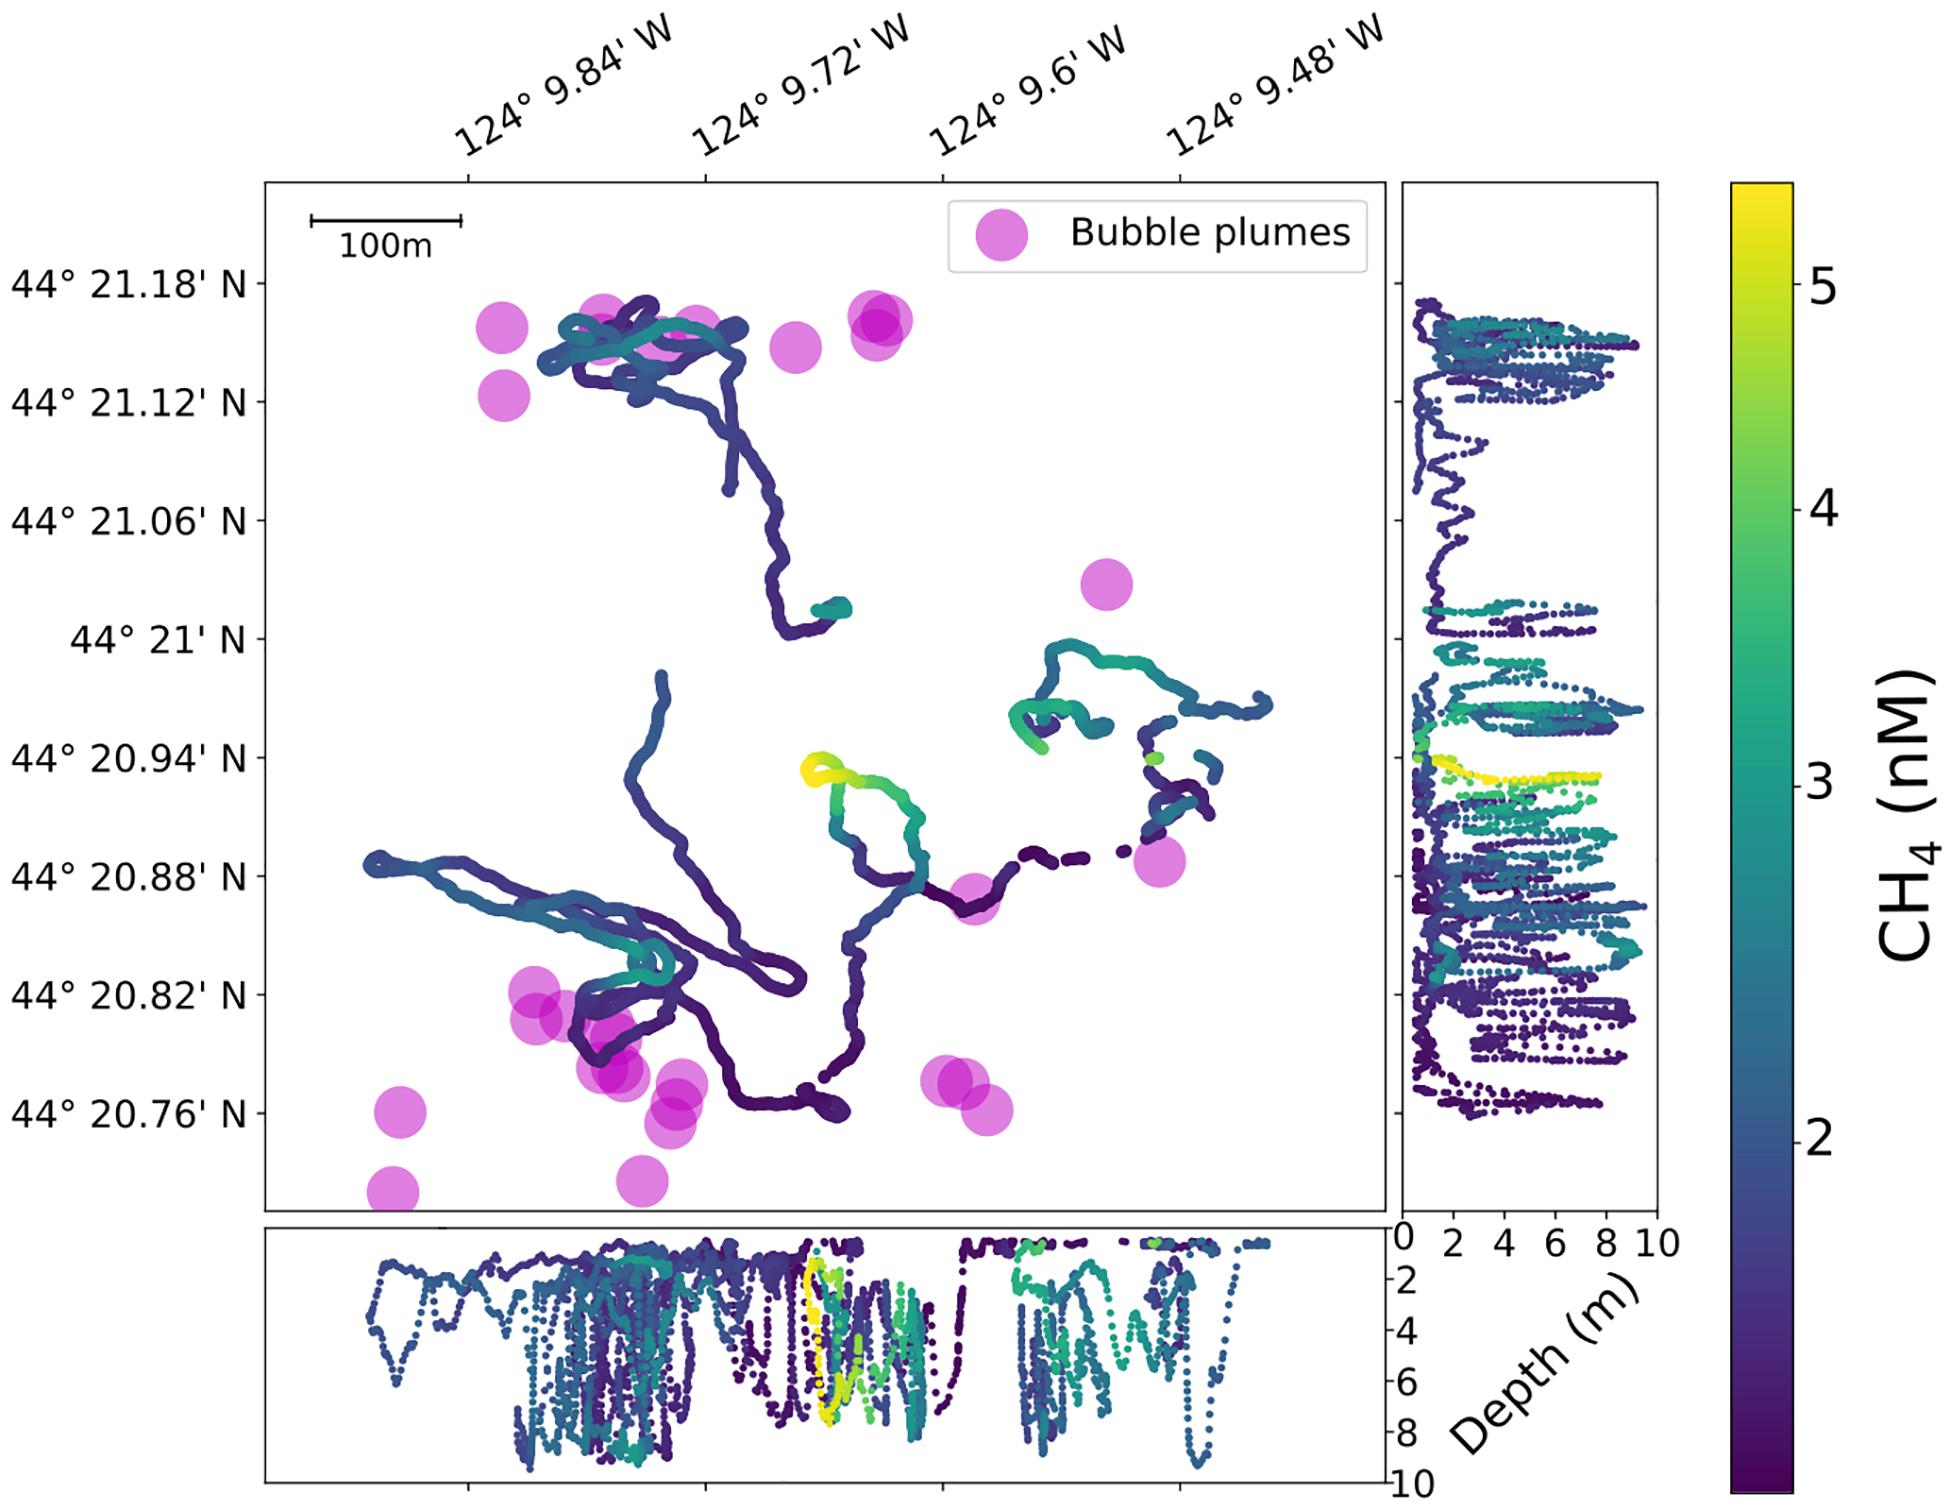
Figure 6. ChemYak tracks at Yachats (September 14, 2018). The ChemYak was piloted by a human user given GPS coordinates of the bubble plumes (marked with magenta circles). The map, center, shows an overhead view of the path the ChemYak took, and the two side panels at the bottom and right show the depth of the CTD probe and gas analyzer inlet for each sample. Relatively little CH4 elevation was observed at this site as a whole; however, several concentrated expressions of 3–7 nM were observed at depths below the top 1–2 m.
Four bubble plumes were observed in the acoustic surveys of the Stonewall Bank seep site (Figure 7, Supplementary Figure 4 and Supplementary Table 3). In the one CTD cast made at the Stonewall Bank seep site (Figure 8 and Supplementary Table 4), close in proximity to an identified bubble plume, elevated methane (above expected 2.7 nM based on equilibrium) was present at depths greater than ∼ 5 m. Only above this depth, were values at or below the equilibrium value. Low oxygen levels were present along with higher methane concentrations at depth; reaching hypoxic levels at 51 m depth, and remaining hypoxic below that depth.
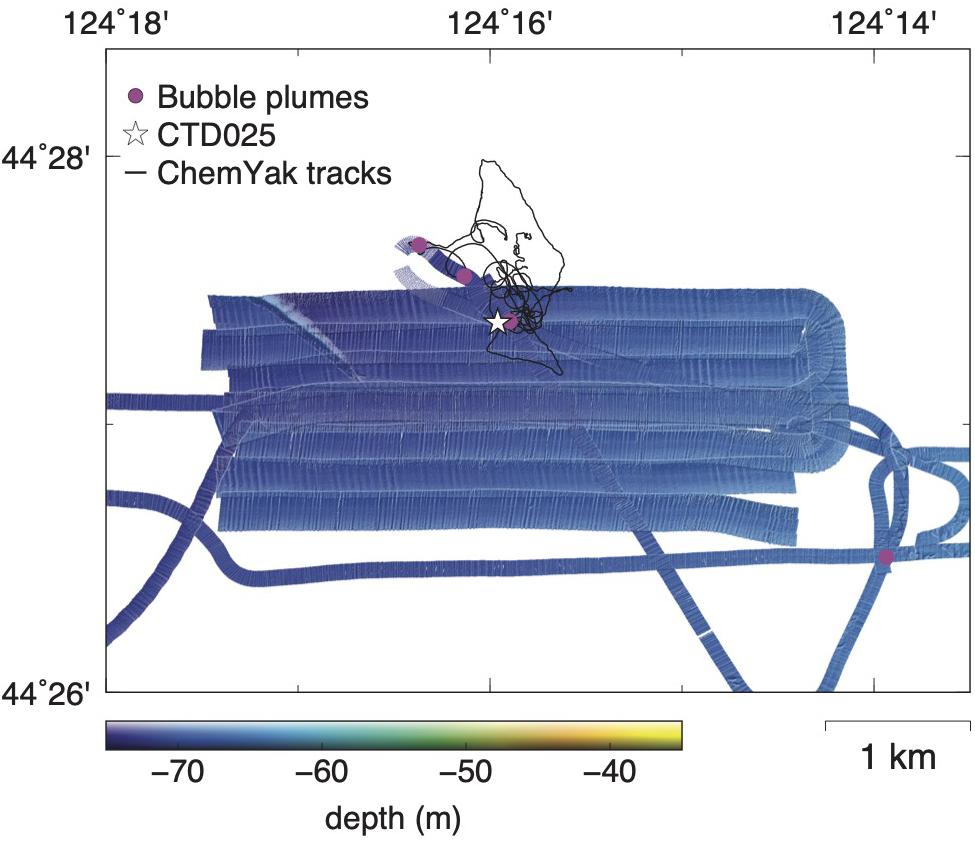
Figure 7. The locations of the four bubble plumes located at Stonewall Bank seep site and CTD cast along with the ChemYak tracks. The bottom bathymetry is shown and was derived from the EM710 multibeam data and gridded at 1 m.
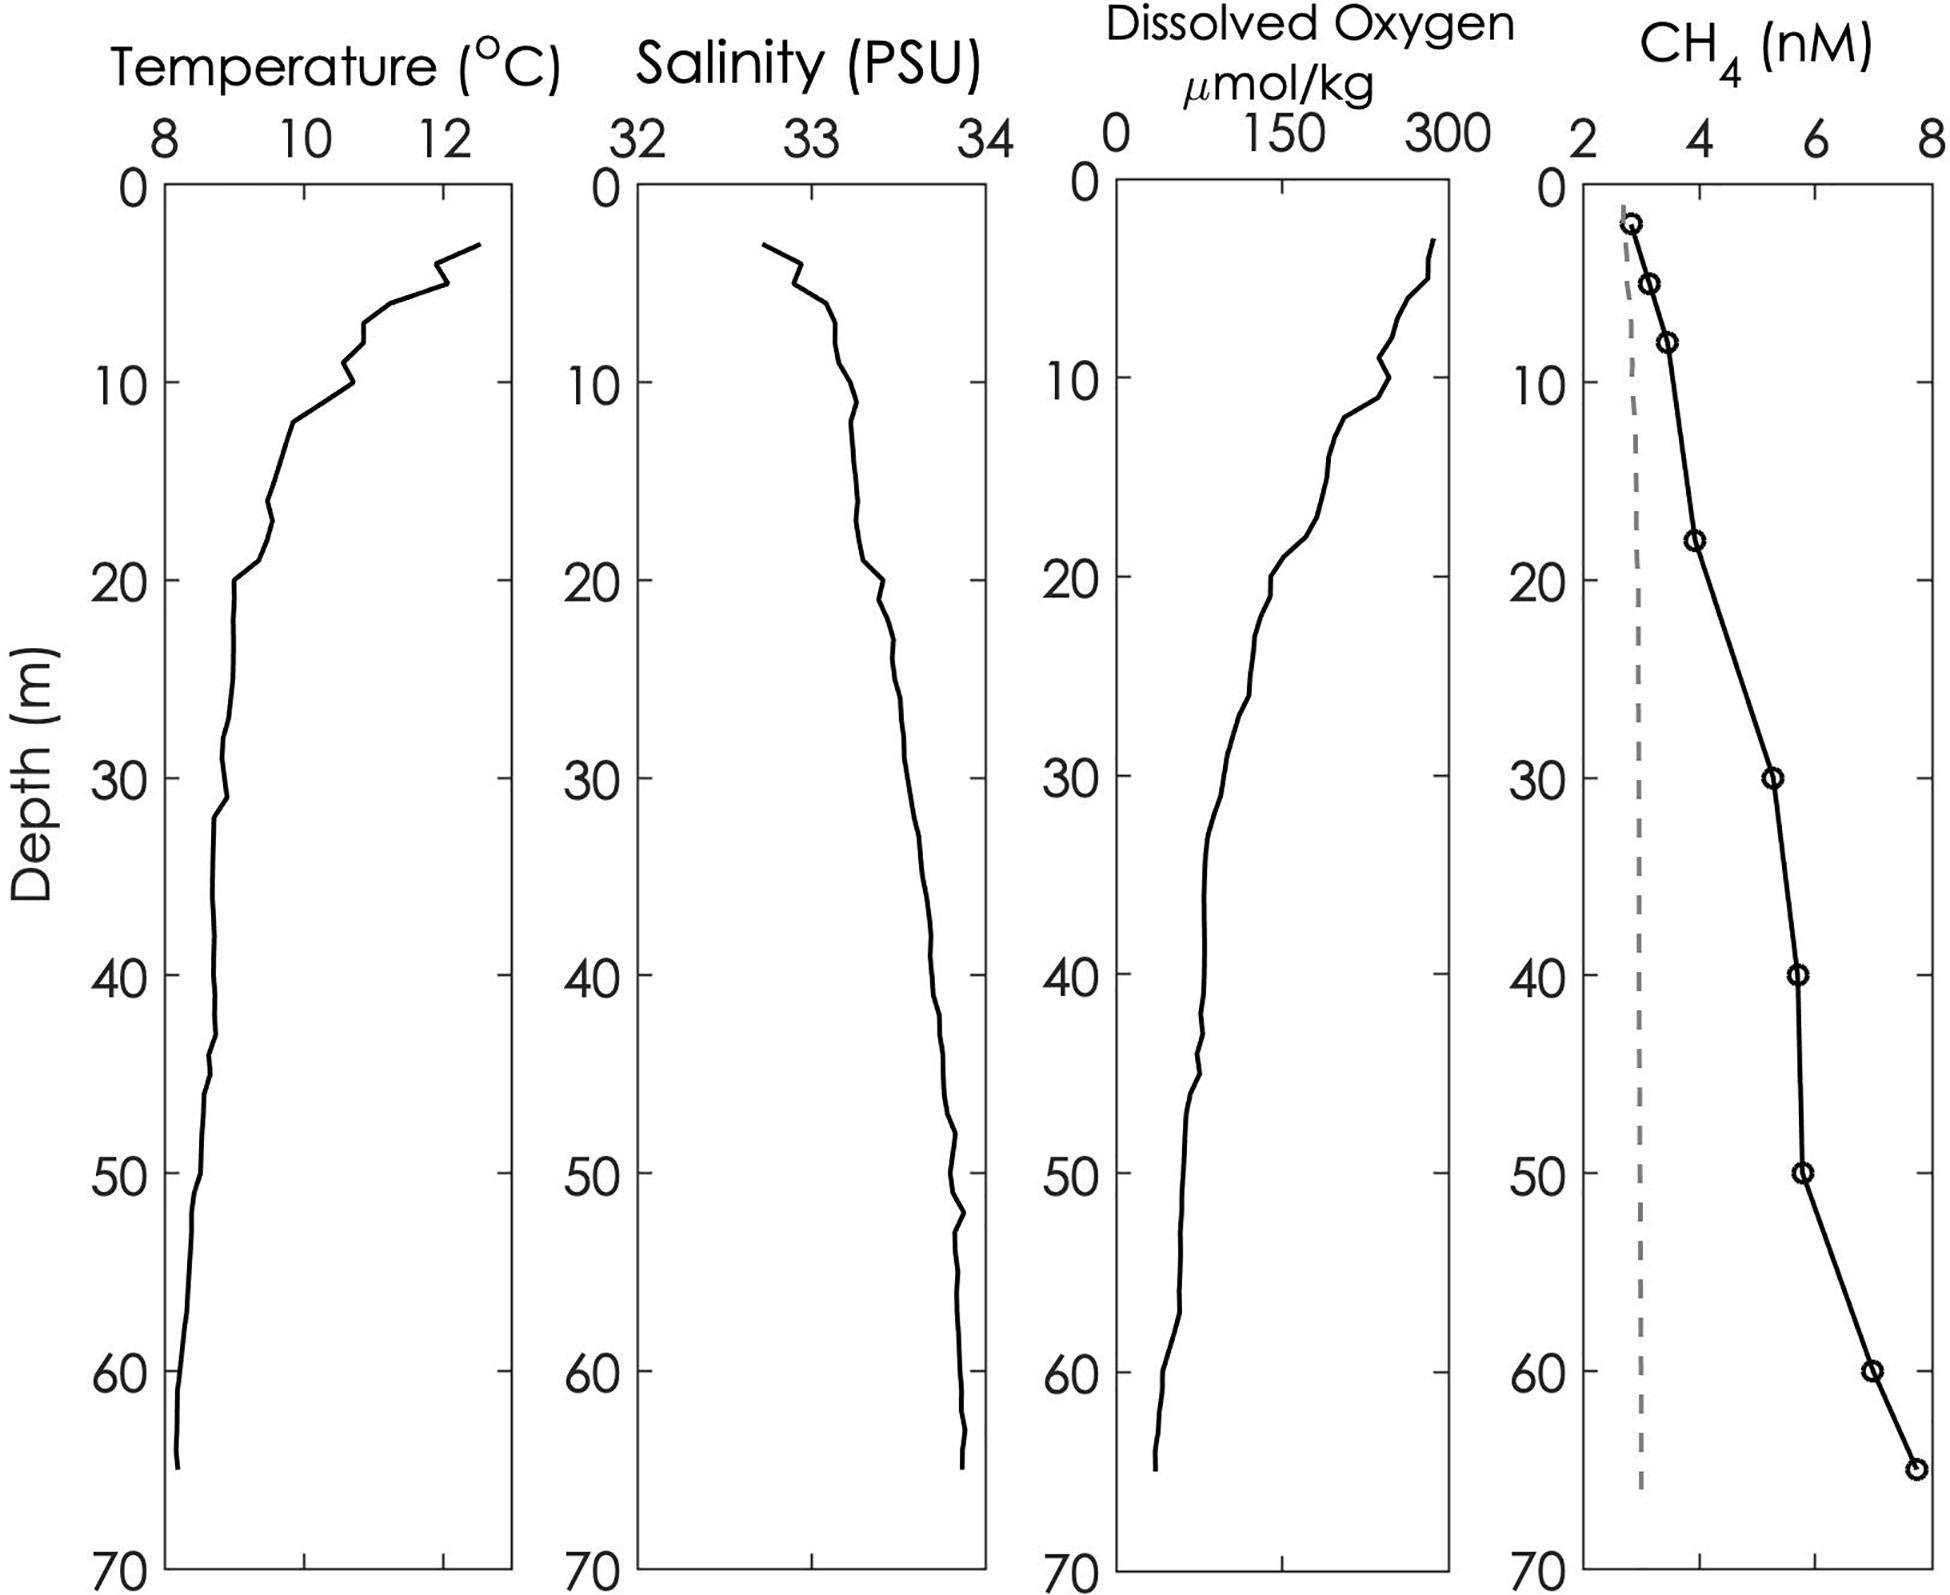
Figure 8. One CTD cast (CTD025) was made at the Stonewall Bank seep site. The water samples collected with the Niskin bottles show the presence of elevated methane in the water column. The dashed gray line shows the methane equilibration concentration with the atmosphere calculated using temperature and salinity conditions from CTD025.
At Stonewall Bank, a single ChemYak survey was completed of the surface waters (Figure 9 and Supplementary Figure 5). These data show several areas of elevated methane [centered at locations: (1) 44°27.7′ N, 124°16.1′ W, (2) 44°27.7′ N, 124°25.9′ W, and (3) 44°27.6′ N, 124°16.1′ W], with a high excursion (up to 40 nM) above equilibrium levels of methane at an area to the north-east of the study region at 44°27.7′ N, 124°12.1′ W, 8 m depth. Several other regions of elevated methane are observed between 0.5 and 7 m. The elevated readings at 0.5 m may be indicative of methane that can be discharged to the atmosphere.
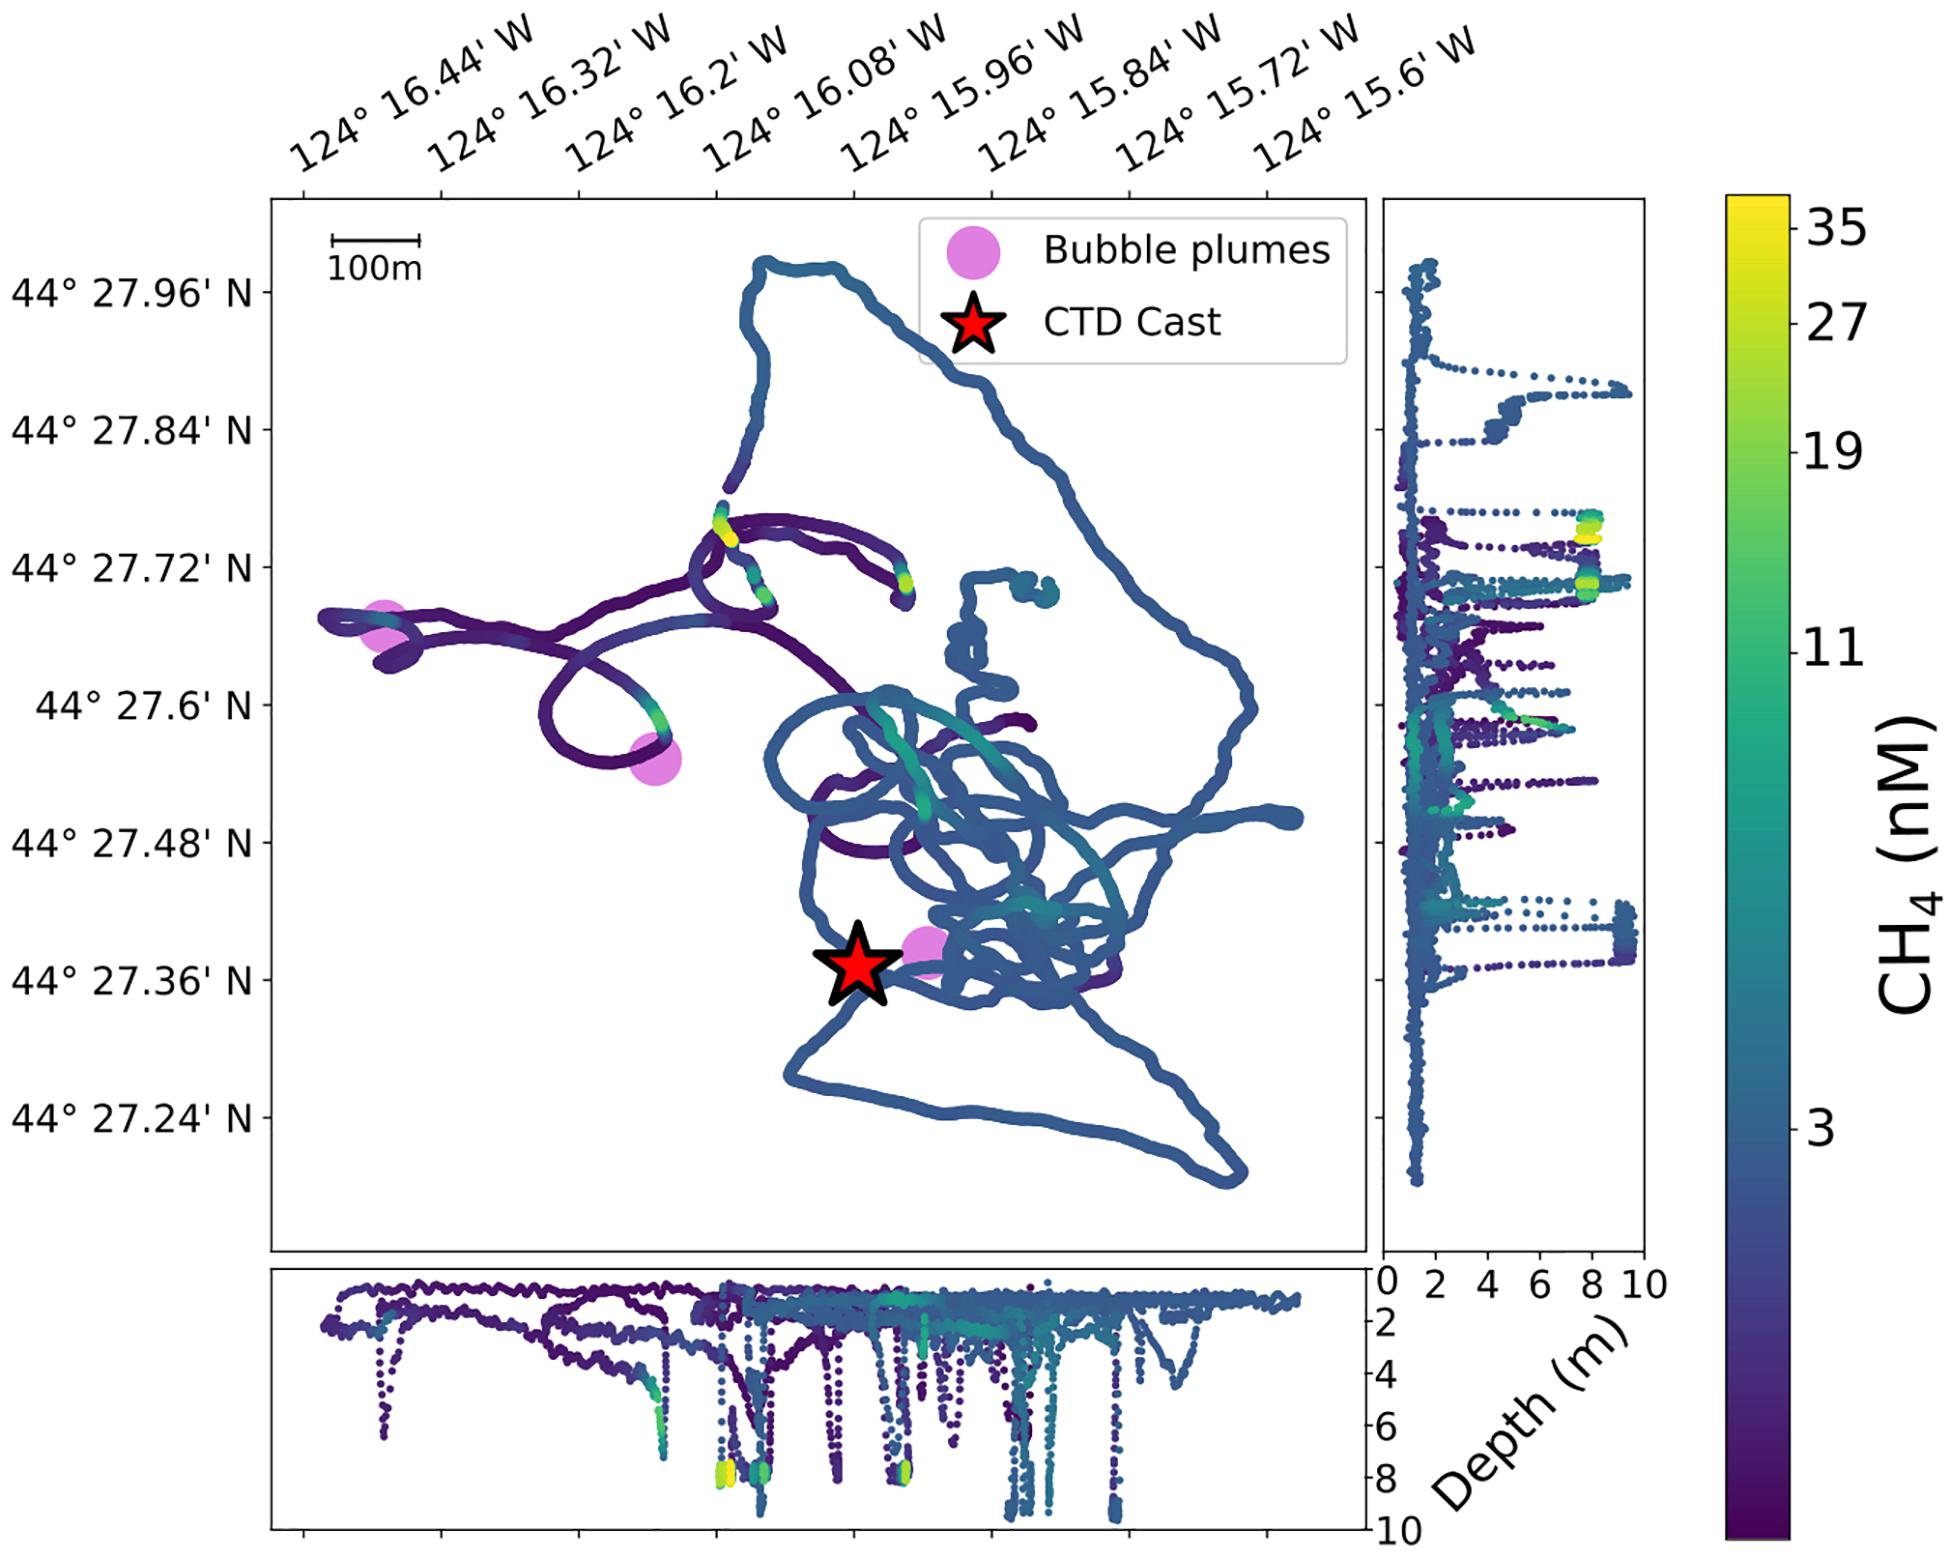
Figure 9. ChemYak tracks at Stonewall Bank (September 17, 2018). The ChemYak was piloted by a human user given rough GPS coordinates of the bubble plumes (marked with magenta circles) and the CTD cast (marked with a red star). The map, center, shows an overhead view of the path the ChemYak took, and the two side panels at the bottom and right show the depth of the CTD probe and gas analyzer inlet for each sample. Significantly elevated CH4 is found at several sites, with a peak at 38 nM detected at 8 m. CH4 concentration levels above 2.7 nM were largely observed to the north and southeast of the field site, at depths of 0.5–7 m.
From our examination of these two shallow (<75 m) seep sites on the Cascadia Margin, Yachats seep site and Stonewall Bank seep site, elevated dissolved methane was observed throughout the entire water column to the surface waters through the analysis of both Niskin rosette casts and the ChemYak in situ measurements (Supplementary Figure 6). Acoustic surveys demonstrated the presence of bubble plumes. ChemYak surface chemistry plots revealed that at both Yachats and Stonewall Bank, regions of elevated methane above atmospheric equilibrium values existed within the top 10 m of the water column, including elevated measurements as close as 0.5 m beneath the surface, which was our observational upper-bound in depth. The presence of elevated dissolved methane concentrations near the ocean surface suggests that outgassing of methane to the atmosphere occurs at these sites.
The concentration of dissolved methane near the ocean surface, and as measured by the ChemYak, demonstrates high spatial variability (Figures 6, 9). Dissolved methane values in the top 0.5–5 m of the Yachats site range from 2.28 to 6.62 nM with a mean of 2.96 ± 0.65 nM. At the Stonewall Bank site, dissolved methane in the top 0.5–5 m ranges from 0.98 to 11.63 nM with a mean of 2.31 ± 0.93 nM. Dissolved methane values in the top 0.5–1.5 m of the Yachats site range from 2.28 to 6.37 nM with a mean of 2.76 ± 0.49 nM. At the Stonewall Bank site, dissolved methane in the top 0.5–5 m ranges from 0.99 to 7.64 nM with a mean of 2.55 ± 0.76 nM. The spatial variability in surface dissolved methane that we observe suggests that point measurements (e.g., with CTD rosettes) may not be representative of even a small (<1 km2) area.
The source of the elevated near-surface methane is important because this methane can ventilate to the atmosphere (James et al., 2016; Ruppel and Kessler, 2017). There are several possible sources for the elevated dissolved methane: the bubble plumes identified in acoustic surveys, coastal upwelling of deep and methane rich waters, and bacterial methane production. Tides can also influence the methane concentration distribution. The methane levels observed may be impacted by in situ aerobic methanogenesis in the water column and anaerobic methanogenesis in the sediment. In Sparrow et al. (2018), methane in surface waters of the U.S. Beaufort Sea shelf was found to be mostly derived from modern-aged carbon, both atmospheric-sourced and in situ produced. Offshore Oregon is also known to be a highly productive upwelling region (e.g., Mooers et al., 1976). Although we cannot rule out coastal upwelling and the importance of other sources, we suggest that bubble plumes contribute to the elevated near-surface dissolved methane concentrations we observed. The spatial variability of dissolved methane (e.g., Figures 6, 9) supports arguments for local sources of methane (e.g., plumes). Local bubble plumes may also supply dissolved methane even in the event of background upwelling and other influences such as methane produced in situ.
Our observations reveal that the areas of highest dissolved surface methane are spatially offset from the seep sites (e.g., Figures 6, 9). As a result, we conclude that the locations of methane seeps do not directly map onto areas of elevated dissolved methane at the meter scale. Instead, we speculate that dynamics in the water column (e.g., waves, inertial effects of tides, eddies, and mixing) impact dissolved methane concentrations near plumes, even when the plumes are not highly bent (e.g., Figure 4). One could probe water column mixing processes by examining velocity data from moorings from the nearby Coastal Endurance Array, part of the Ocean Observatories Initiative. Such analysis is outside the scope of this study and specifically is not done because our study area is ∼30 km from the closest shallow mooring. An additional source of potential offset between plume sites and elevated surface methane is the temporal offset between the ChemYak and acoustic surveys. The ChemYak and the acoustic surveys were offset by hours such that the nature of venting may have changed between surveys.
To examine the error of these measurements due to environmental variability (temperature and salinity) and any instrument error within the greenhouse gas analyzer and the dissolved gas extractor, an error analysis was completed using 50,000 Monte Carlo samples drawn from empirical distributions of salinity and temperature, and a Gaussian distribution of efficiency centered at 0.05 with 0.01 standard deviation (Supplementary Figure 7). At low concentration measurements, the error bound is very small, but increases with larger concentrations. Considering the interquartile range of the posterior samples of methane, converted values that represent the 1st quartile measure still imply that significant elevation of methane is present.
At Stonewall Bank seep site, dissolved CH4 was spatially variable and elevated concentrations were highly localized. At Yachats seep site, local high concentration spots were also observed, and measurements taken throughout the water column were found to be slightly above the expected equilibrium value. We estimate the potential methane flux rate per year (due primarily to diffusive transport) at these two sites based on our study measurements. The diffusive gas flux across the air-sea interface is calculated as:
where F is the air-sea flux (mass area–1 time–1), k is the gas transfer velocity (length time–1), K0 is the solubility of the gas (mass volume–1 pressure–1), and pCw and pCa are the partial pressures of methane in the water and air, respectively (Wanninkhof, 2014). The term k is calculated according to Wanninkhof (2014) and requires an estimate of the 10-m wind speed, w, and Schmidt number SC (a function of salinity and temperature):
The equilibrium pressure of CH4 with the atmosphere is set to 1.86 μatm for these calculations. Wind speed measurements reported from the ship were observed to be approximately 10 m s–1 sustained. By virtue of the square factor in the gas transfer velocity, wind speed is a generally dominating factor for estimating emissions. To show this, Supplementary Figure 8 provides the relationship between wind speed and estimated flux for varying partial pressure estimates of CH4 in water.
To constrain an estimate of flux in the study regions and demonstrate the impact of the highly localized but potent methane “hotspots,” we first identify the range of observations that represent elevated methane values at the sites. This is done by empirically setting a threshold based on the distribution of methane observations (Supplementary Figure 9) such that the dominating background signal is separated from a long-tail, representing observations from hotspots. To estimate how hotspots change the effective annual flux at the study sites, we compute the average methane surface value with and without hotspots at each site to serve as a representative methane concentration. We then draw 50,000 samples from the empirical distributions of salinity, temperature, and wind (Supplementary Figure 10). Using this method, we find that the background annual flux for the Yachats site is −129 ± 50 μmol × m–2 × y–1; including the impact of hotspots increases this estimate to 62 ± 24 μmol × m–2 × y–1. For the Stonewall Banks site, background flux is estimated to be −455 ± 177 μmol × m–2 × y–1; including hotspots also increases this estimate to −305 ± 119 μmol × m–2 × y–1. Using a Welch’s t-test, the difference in these distributions is statistically significant to the p = 0.01 level. At both sites, background saturation of methane indicates that these sites would likely serve as methane sinks, however, the influence of hotspots can reduce the efficacy of these sinks, or even create weak sources of outgassing methane. Given the relatively small area of these expressions, their potentially outsized effect on the methane budget of the region is of considerable interest, and highlights the utility of dense spatial sampling enabled by the ChemYak platform.
The flux of methane to the atmosphere could be higher than calculated if the gaseous bubbles that reach the ocean surface are considered. The acoustic water column data suggest that gas rich plumes within 10 m of the surface (e.g., Figure 4) are present. However, we cannot resolve features in the upper meters of the ocean surface because the Kongsberg EM710 echosounder has a minimum acquisition depth 3 m below its transducers.
Pockmarks are concave crater-like depressions that can form on the seafloor as a result of fluid expulsion including methane gas venting (e.g., Cathles et al., 2010; Davy et al., 2010). At the Yachats seep site we observe dozens of depressions that are <3 m deep and 50–1000 m wide, consistent with the morphology of pockmarks. A fraction of the seafloor depressions have lens or almond shapes and are elongated in the southwest-northeast direction; these depressions may be trawl marks. Most (68 out of 92) of the bubble plumes at the Yachats site were found within 50 m of seafloor depressions that resemble pockmarks. However, we do not resolve the specific mechanisms that relate the pockmarks to the presence of methane venting at this site.
The coupled methodology presented here: identifying plume sources with shipboard multibeam sonar, water column analysis with a Niskin rosette, and near-surface chemistry mapping with a surface vehicle, leverages the strengths of multi-resolution approaches for understanding methane emissions and fate at shallow-water seep sites. The ChemYak, a novel surface vehicle, enabled the direct observation of near-surface dissolved methane and at a spatial resolution that cannot be assessed with CTD casts. Similar vehicles may prove useful for quantifying the chemical variability of near-surface waters at higher spatial resolutions than are currently reported. Furthermore, by combining technologies we move closer to being able to connect the discharge of methane bubbles along the seafloor to their transport and fate in the water column.
Using multibeam sonar we identified 92 and 4 bubble plumes with the Yachats and Stonewall Bank sites, respectively. The discovery of the Yachats seep site during this cruise suggests other shallow bubble sites may remain undiscovered along the Cascadia Margin. We found hot spots of dissolved methane concentrations above the atmospheric equilibrium value both at depth, as measured by the CTD casts, and near the surface as measured by the ChemYak. In addition, measurements of dissolved methane within the surface waters demonstrated that dissolved methane is highly spatially variable and included concentrations up to 11.63 nM. The CTD values measured were at similar levels to those reported at depths up to 74 m below the surface by Heeschen et al. (2005). Bubbles were observed by Di et al. (2019); however, the seeps studied were much shallower (<20 m) than those in our study. The levels of dissolved methane measured by our study may be different than those measured by Di et al. (2019) due to proximity to a plume, currents, depth, and plume intensity.
Due to the presence of significantly elevated methane hotspots on the surface ocean, we found that methane ventilation was significantly increased as compared to presumptive background levels; at Yachats our model estimated an increase of approximately 191 μmol × m–2 × y–1 and at Stonewall Bank an increase of approximately 150 μmol × m–2 × y–1. Although we found that methane plumes are not decisively co-located with surface anomalies in methane concentration, the mismatch identified through high-resolution sampling invites questions about mixing processes in the water column and the temporal variability of plume discharge. We do not rule out coastal upwelling in contributing to the elevated levels of dissolved methane near the ocean surface or the transport of methane from other plumes. However, the existence of methane bubble plumes seen by the multibeam data along with areas of elevated near-surface dissolved methane suggests that shallow seeps contribute methane to the sea-air methane flux. Future work is needed to resolve the factors that contribute to the variability in methane concentrations, including examining tidal influences and bacterial methane production. In addition, further information could be gleaned about sources through the measurement of the carbon and hydrogen isotopic ratios of the methane.
The datasets generated for this study can be found in the Supplementary Material, at the R2R rolling deck to repository (10.7284/907968), and at the WHOAS data repository (https://hdl.handle.net/1912/25040).
AM served as Chief Scientist on the R/V Falkor cruise, co-led all ChemYak deployments, supervised all data processing efforts, and processed CTD data. DN co-led all ChemYak deployments and supervised all data processing efforts. VP processed and analyzed all ChemYak data. KF processed and analyzed all multibeam data. All authors contributed to the article and approved the submitted version.
Funding for VP was provided by an NDSEG Fellowship. Funding for KF was provided by a WHOI Postdoctoral Scholar Fellowship. Ship time on the R/V Falkor was provided by the Schmidt Ocean Institute (FK180824).
The authors declare that the research was conducted in the absence of any commercial or financial relationships that could be construed as a potential conflict of interest.
The authors thank the Schmidt Ocean Institute and the Captain and entire crew and staff of the R/V Falkor and ROV Subastian team during the 2018 Hunting Bubbles cruise (FK180824) to Cascadia Margin. The authors thank S. D. Wankel for his contributions to the entire cruise and its planning and to B. Colson for his assistance with the ChemYak deployments. The authors greatly acknowledge K. Manganini for his work in developing the ChemYak. The authors thank K. McHugh for taking the ChemYak image shown in Figure 2 with his drone. The authors also thank S. Soule and M. Jones for their assistance with multibeam processing, and A. Morrison for her assistance in extraction efficiency laboratory experiments for the DGEU.
The Supplementary Material for this article can be found online at: https://www.frontiersin.org/articles/10.3389/feart.2021.613234/full#supplementary-material
Baumberger, T., Embley, R. W., Merle, S. G., Lilley, M. D., Raineault, N. A., and Lupton, J. E. (2018). Mantle−derived helium and multiple methane sources in gas bubbles of cold seeps along the Cascadia continental margin. Geochem. Geophys. Geosyst. 19, 4476–4486. doi: 10.1029/2018GC007859
Cathles, L. M., Su, Z., and Chen, D. (2010). The physics of gas chimney and pockmark formation, with implications for assessment of seafloor hazards and gas sequestration. Mar. Pet. Geol. 27, 82–91. doi: 10.1016/j.marpetgeo.2009.09.010
Colbo, K., Ross, T., Brown, C., and Weber, T. (2014). A review of oceanographic applications of water column data from multibeam echosounders. Estuar. Coast. Shelf Sci. 145, 41–56. doi: 10.1016/j.ecss.2014.04.002
Davy, B., Pecher, I., Wood, R., Carter, L., and Gohl, K. (2010). Gas escape features off New Zealand: evidence of massive release of methane from hydrates: massive NZ gas escape features. Geophys. Res. Lett. 37:L21309. doi: 10.1029/2010GL045184
Di, P., Feng, D., and Chen, D. (2019). The distribution of dissolved methane and its air-sea flux in the plume of a seep field, Lingtou Promontory, South China Sea. Geofluids 2019:3240697. doi: 10.1155/2019/3240697
Grant, N. J., and Whiticar, M. J. (2002). Stable carbon isotopic evidence for methane oxidation in plumes above Hydrate Ridge, Cascadia Oregon Margin: isotope evidence for methane oxidation at Hydrate Ridge. Glob. Biogeochem. Cycles 16, 71–71. doi: 10.1029/2001GB001851
Greinert, J., Lewis, K. B., Bialas, J. I., Pecher, A., Rowden, A., Bowden, D. A., et al. (2010). Methane seepage along the Hikurangi Margin. New Zealand: Overview of studies in 2006 and 2007 and new evidence from visual, bathymetric and hydroacoustic investigations. Mar. Geol. 272, 6–25. doi: 10.1016/j.margeo.2010.01.017
Heeschen, K. U., Collier, R. W., de Angelis, M. A., Suess, E., Rehder, G., Linke, P., et al. (2005). Methane sources, distributions, and fluxes from cold vent sites at Hydrate Ridge, Cascadia Margin: methane fluxes at Hydrate Ridge. Glob. Biogeochem. Cycles 19, n/a–n/a. doi: 10.1029/2004GB002266
Heeschen, K. U., Tréhu, A. M., Collier, R. W., Suess, E., and Rehder, G. (2003). Distribution and height of methane bubble plumes on the Cascadia Margin characterized by acoustic imaging: acoustic image of methane bubble plumes. Geophys. Res. Lett. 30:1643. doi: 10.1029/2003GL016974
James, R. H., Bousquet, P., Bussmann, I., Haeckel, M., Kipfer, R., Leifer, I., et al. (2016). Effects of climate change on methane emissions from seafloor sediments in the Arctic Ocean: a review: methane emissions from arctic sediments. Limnol. Oceanogr. 61, S283–S299. doi: 10.1002/lno.10307
Johnson, H. P., Merle, S., Salmi, M., Embley, R., Sampaga, E., and Lee, M. (2019). Anomalous concentration of methane emissions at the continental shelf edge of the Northern Cascadia Margin. J. Geophys. Res. Solid Earth 124, 2829–2843. doi: 10.1029/2018JB016453
Johnson, H. P., Miller, U. K., Salmi, M. S., and Solomon, E. A. (2015). Analysis of bubble plume distributions to evaluate methane hydrate decomposition on the continental slope: Plumes on Cascadia. Geochem. Geophys. Geosyst. 16, 3825–3839. doi: 10.1002/2015GC005955
Kimball, P., Bailey, J., Das, S., Geyer, R., Harrison, T., Kunz, C., et al. (2014). “The WHOI Jetyak: an autonomous surface vehicle for oceanographic research in shallow or dangerous waters,” in Proceedings of the 2014 IEEE/OES Autonomous Underwater Vehicles (AUV), (Oxford, MS: IEEE), 1–7.
Leifer, I., Luyendyk, B. P., Boles, J., and Clark, J. F. (2006). Natural marine seepage blowout: contribution to atmospheric methane: marine Seep Blowout. Glob. Biogeochem. Cycles 20, doi: 10.1029/2005GB002668
Loher, M., Pape, T., Marcon, Y., Römer, M., Wintersteller, P., Praeg, D., et al. (2018). Mud extrusion and ring-fault gas seepage–upward branching fluid discharge at a deep-sea mud volcano. Sci. Rep. 8:6275. doi: 10.1038/s41598-018-24689-1
Manning, C. C., Preston, V. L., Jones, S. F., Michel, A. P. M., Nicholson, D. P., Duke, P. J., et al. (2020). River inflow dominates methane emissions in an Arctic coastal system. Geophys. Res. Lett. 47:e2020GL087669. doi: 10.1029/2020GL087669
McGinnis, D. F., Greinert, J., Artemov, Y., Beaubien, S. E., and Wüest, A. (2006). Fate of rising methane bubbles in stratified waters: how much methane reaches the atmosphere? J. Geophys. Res. 111:C09007. doi: 10.1029/2005JC003183
Mooers, C., Collins, C., and Smith, R. (1976). The dynamic structure of the frontal zone in the coastal upwelling region off Oregon. J. Phys. Oceanogr. 6, 3–21.
Nicholson, D. P., Michel, A. P. M., Wankel, S. D., Manganini, K., Sugrue, R. A., Sandwith, Z. O., et al. (2018). Rapid mapping of dissolved methane and carbon dioxide in coastal ecosystems using the ChemYak autonomous surface vehicle. Environ. Sci. Technol. 52, 13314–13324. doi: 10.1021/acs.est.8b04190
NOAA Northwest Fisheries Science Center and Southwest Fisheries Science Center (2015). EK60 Water Column Sonar Data Collected During SH1507. NOAA National Centers for Environmental Information. doi: 10.7289/V5D50JZQ
Pohlman, J. W., Greinert, J., Ruppel, C., Silyakova, A., Vielstädte, L., Casso, M., et al. (2017). Enhanced CO2 uptake at a shallow Arctic Ocean seep field overwhelms the positive warming potential of emitted methane. Proc. Natl. Acad. Sci. U.S.A. 114, 5355–5360. doi: 10.1073/pnas.1618926114
Reeburgh, W. S. (2007). Oceanic methane biogeochemistry. Chem. Rev. 107, 486–513. doi: 10.1021/cr050362v
Rehder, G., Brewer, P. W., Peltzer, E. T., and Friederich, G. (2002). Enhanced lifetime of methane bubble streams within the deep ocean: enhanced lifetime of methane bubbles. Geophys. Res. Lett. 29, 21–21. doi: 10.1029/2001GL013966
Riedel, M., Scherwath, M., Römer, M., Veloso, M., Heesemann, M., and Spence, G. D. (2018). Distributed natural gas venting offshore along the Cascadia margin. Nat. Commun. 9:3264. doi: 10.1038/s41467-018-05736-x
Römer, M., Riedel, M., Scherwath, M., Heesemann, M., and Spence, G. D. (2016). Tidally controlled gas bubble emissions: a comprehensive study using long-term monitoring data from the NEPTUNE cabled observatory offshore Vancouver Island: tidally controlled gas bubble emissions. Geochem. Geophys. Geosyst. 17, 3797–3814. doi: 10.1002/2016GC006528
Ruppel, C. D., and Kessler, J. D. (2017). The interaction of climate change and methane hydrates: climate-hydrates interactions. Rev. Geophys. 55, 126–168. doi: 10.1002/2016RG000534
Shakhova, N., Semiletov, I., Leifer, I., Salyuk, A., Rekant, P., and Kosmach, D. (2010). Geochemical and geophysical evidence of methane release over the East Siberian Arctic Shelf. J. Geophys. Res. 115:C08007. doi: 10.1029/2009JC005602
Shakhova, N., Semiletov, I., Leifer, I., Sergienko, V., Salyuk, A., Kosmach, D., et al. (2014). Ebullition and storm-induced methane release from the East Siberian Arctic Shelf. Nat. Geosci. 7, 64–70. doi: 10.1038/ngeo2007
Sparrow, K. J., Kessler, J. D., Southon, J. R., Garcia-Tigreros, F., Schreiner, K. M., Ruppel, C. D., et al. (2018). Limited contribution of ancient methane to surface waters of the US Beaufort Sea shelf. Sci. Adv. 4:eaao4842. doi: 10.1126/sciadv.aao4842
Thornton, B. F., Geibel, M. C., Crill, P. M., Humborg, C., and Mörth, C.-M. (2016). Methane fluxes from the sea to the atmosphere across the Siberian shelf seas: CH4 fluxes from Siberian shelf seas. Geophys. Res. Lett. 43, 5869–5877. doi: 10.1002/2016GL068977
Wanninkhof, R. (2014). Relationship between wind speed and gas exchange over the ocean revisited: gas exchange and wind speed over the ocean. Limnol. Oceanogr. Methods 12, 351–362. doi: 10.4319/lom.2014.12.351
Westbrook, G. K., Thatcher, K. E., Rohling, E. J., Piotrowski, A. M., Pälike, H., Osborne, A. H., et al. (2009). Escape of methane gas from the seabed along the West Spitsbergen continental margin: Arctic methane gas plumes. Geophys. Res. Lett. 36, n/a–n/a. doi: 10.1029/2009GL039191
Keywords: methane, bubbles, Cascadia Margin, laser spectrometer, ocean sensing, surface vehicle, multibeam sonar, seeps
Citation: Michel APM, Preston VL, Fauria KE and Nicholson DP (2021) Observations of Shallow Methane Bubble Emissions From Cascadia Margin. Front. Earth Sci. 9:613234. doi: 10.3389/feart.2021.613234
Received: 01 October 2020; Accepted: 06 April 2021;
Published: 29 April 2021.
Edited by:
Tamara Baumberger, Oregon State University, United StatesReviewed by:
Marvin D. Lilley, University of Washington, United StatesCopyright © 2021 Michel, Preston, Fauria and Nicholson. This is an open-access article distributed under the terms of the Creative Commons Attribution License (CC BY). The use, distribution or reproduction in other forums is permitted, provided the original author(s) and the copyright owner(s) are credited and that the original publication in this journal is cited, in accordance with accepted academic practice. No use, distribution or reproduction is permitted which does not comply with these terms.
*Correspondence: Anna P. M. Michel, YW1pY2hlbEB3aG9pLmVkdQ==
Disclaimer: All claims expressed in this article are solely those of the authors and do not necessarily represent those of their affiliated organizations, or those of the publisher, the editors and the reviewers. Any product that may be evaluated in this article or claim that may be made by its manufacturer is not guaranteed or endorsed by the publisher.
Research integrity at Frontiers
Learn more about the work of our research integrity team to safeguard the quality of each article we publish.