 Ameha A. Muluneh
94% of researchers rate our articles as excellent or good
Learn more about the work of our research integrity team to safeguard the quality of each article we publish.
Find out more
ORIGINAL RESEARCH article
Front. Earth Sci., 03 May 2021
Sec. Volcanology
Volume 9 - 2021 | https://doi.org/10.3389/feart.2021.610165
This article is part of the Research TopicSeismicity in Volcanic AreasView all 20 articles
Lower crustal earthquakes at plate boundaries and intraplate settings occur at depth where deformation is normally expected to occur in a ductile manner. Here we use the available earthquake catalogs and compute theoretical predictions for a range of conditions for the occurrence of lower crustal earthquakes beneath the Main Ethiopian Rift (MER) and adjacent north-western (NW) plateau. Yield strength envelops are constructed using information on geothermal gradient, strain rate, and composition constrained by geophysical observations. Our models suggest that away from the MER beneath the NW plateau the depth distribution of earthquakes in the lower crust is best explained by strong mafic lower crustal rheology and hydrostatic fluid pore pressure conditions. In the same region the effective elastic thickness is similar to seismogenic thickness showing that the lower crust has long-term strength and hence can physically support brittle deformation. On the contrary, in the central MER the seismogenic thickness is much larger than the effective elastic layer thickness implying that the lower crust has no long-term strength. Here our models show that both hydrostatic and near-lithostatic fluid pore pressures fail to explain the observed seismicity and instead a combination of near-lithostatic pore fluid pressure and transient high strain rate due to the movement of fluids provide a plausible mechanism for the occurrence of seismicity in the lower crust. Our interpretations are supported by occurrence of swarms of deep earthquakes beneath the MER, as opposed to more continuous background deep seismicity away from the rift. Using time-depth progression of earthquakes, we estimate permeability values of 5.9 × 10⁻¹⁵ m2 and 1.8 × 10⁻¹⁴ m2 at lower crustal depth. The range of permeability implies that seismicity can be induced by pore-pressure diffusion, likely from fluids sourced from the mantle that reactivate preexisting faults in the lower crust. Our thermo-rheological models explain the first order differences in lower crustal earthquakes both directly beneath and outboard of the rift valley.
Lower crustal earthquakes have been observed at both plate boundaries and intraplate settings at a depth where deformation is normally expected to occur in a ductile manner. As such, the origin of these deep crustal earthquakes is debated (e.g., Maggi et al., 2000; Jackson, 2002). In some studies from the East African Rift System (EARS), strong lower crust is invoked for lower crustal earthquakes to occur (e.g., Albaric et al., 2009). Modeling studies from the EARS show that earthquakes at lower crustal pressure-temperature (P-T) conditions can nucleate in mafic (Hellebrekers et al., 2019), and/or anhydrous materials (Craig and Jackson, 2021). Brittle faults penetrating the entire crust in regions with more normal crustal compositions are interpreted to occur beneath the Tanganyika rift (Craig et al., 2011; Lavayssiere et al., 2019a), with the brittle failure enabled by the exceptionally thick lithosphere and low geothermal gradient keeping the lower crust relatively cool (O'Donnell et al., 2016; Lavayssiere et al., 2019a). Alternatively, other studies suggest that lower crustal earthquakes are facilitated by high pore fluid pressure (Lindenfeld et al., 2012; Lee et al., 2016; LaRosa et al., 2021), which can locally induce high enough strain rates to cause earthquakes even in areas with high heat flow and weak long-term rheology. However, it is usually unclear whether the high pore fluid pressure is a transient or a long-term feature.
Lower crustal seismicity has also specifically been observed in the volcanically active Main Ethiopian Rift (MER) as well as beneath the NW plateau (Figure 1; Keir et al., 2009; Lapins et al., 2020), two regions which are characterized by contrasting deformation history and thermo-rheological properties. Here, we aim to investigate the role of thermo-rheological properties and fluid flow in controlling the depth of lower crustal earthquakes in and around the MER, a major volcanically and tectonically active continental rift.

Figure 1. Location of the Main Ethiopian Rift (MER) and adjacent plateau. Earthquakes focal mechanisms are taken from Hofstetter and Beyth (2003) and Keir et al. (2006). The geology and faults are taken from 1:2M scale geological map (Tefera et al., 1990). The open red box on the inset map shows the location of the main map. The red triangles show active volcanoes.
The MER accommodates the ongoing opening of the Nubia and Somalia plates at the northern part of the EARS. The MER is largely defined by NNE to NE striking border faults that separate the rift valley from the adjacent NW plateau and the southeastern (SE) plateau. Pre-existing lithospheric scale heterogenities are thought to significantly control the initial locus of extension to the border faults (e.g., Corti, 2009; Corti et al., 2018), which accommodated most of the opening of the rift during Miocene times starting at ~20 Ma (e.g., Wolfenden et al., 2004). In the northern MER, faulting has generally progressively localized in rift to the point that since the Quaternary, extension has been mainly focused in narrow magmatic segments arranged en-echelon in the rift floor (e.g., Ebinger and Casey, 2001). In contrast, in the central and southern MER faulting is still mainly accommodated by the border faults with subordinate activity in the rift center (Corti et al., 2020).
The NW plateau and the MER show a marked contrast in crustal thickness. Wide-angle controlled source seismic imaging shows that the crust beneath the NW plateau is ~45 km thick, with a 28 km thick upper crust (e.g., Mackenzie et al., 2005). The P-wave seismic velocity variations coupled with inversion of gravity data for rock density suggest that the upper crust is similar to standard continental crust, whereas the middle and lower crust include a significant proportion of mafic rock (Mackenzie et al., 2005; Cornwell et al., 2010). On the contrary, the SE plateau has been interpreted to be underlain by only felsic or intermediate compositions (Mackenzie et al., 2005). The plateaus have contrasting patterns of strain, with GPS and seismicity data showing that the NW plateau experiences distributed extension (Birhanu et al., 2016), which is accompanied by earthquakes in the upper and lower crust down to ~32 km depth (Figures 2A,B; Keir et al., 2009).
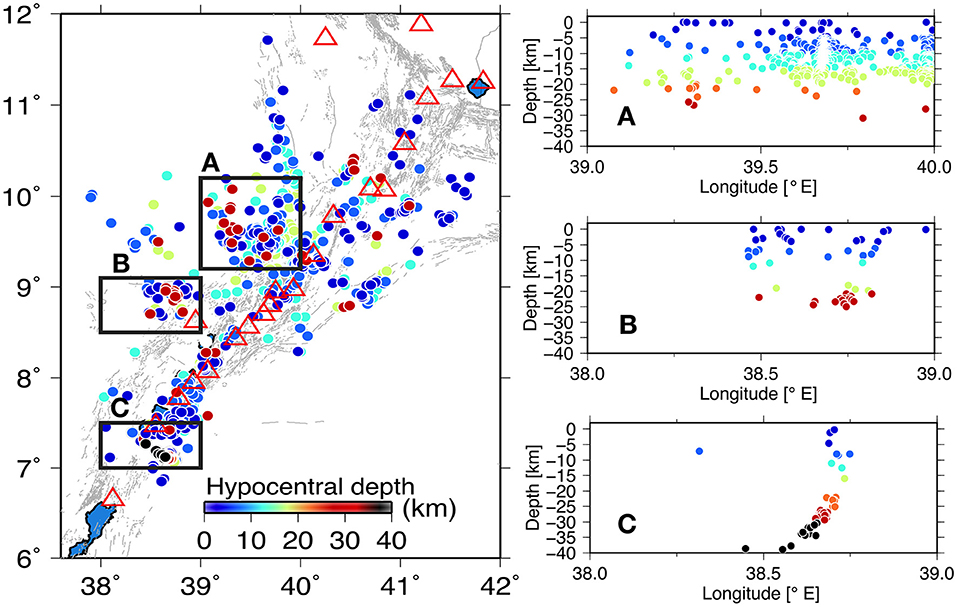
Figure 2. Depth distribution of seismicity in the NW plateau (A), Yerrer Tullu-Wellel volcanic lineament (YTVL) (B) and central MER (C). The open black boxes show the location of cross-sections in (A–C). Seismicity extends to ~32 km (A), whereas in the central MER earthquake occurs to a depth of ~38 km. In cross section (C), we show only earthquakes from Lapins et al. (2020). These earthquakes have maximum lateral uncertainty <10 km (Lloyd et al., 2018).
In the central MER the crust has a thickness of 38 km with upper crustal thickness of ~20 km (Keranen et al., 2009). Similar to the plateaus, the upper crust in the rift is dominated by felsic rheology (e.g., Keranen et al., 2009), which is in line with the Vp/Vs ratio of ~1.75 recorded for upper crustal local earthquakes (Keir et al., 2006; Greenfield et al., 2019), as well as recent modeling studies suggesting that upper/middle crustal seismicity is best explained by wet quartzite rheology (Muluneh et al., 2020). In contrast, the Vp/Vs ratio based on shear wave velocity from Rayleigh wave/receiver function joint inversion (Keranen et al., 2009) and compressional wave velocity determined by wide-angle data (Maguire et al., 2006) indicates that the lower crust is dominated by mafic granulite composition (Keranen et al., 2009).
Earthquakes within the MER were until recently thought to be confined to depths of less than ~18 km, where they are mainly localized on both the border faults and fault systems within the magmatic segments (Keir et al., 2006; Wilks et al., 2017; Greenfield et al., 2019; Lavayssiere et al., 2019b). However recently, Lapins et al. (2020) reported lower crustal earthquakes beneath the eastern side of the central MER in the vicinity of Corbetti caldera (Figure 2C). Subsequent studies nearby did not observe deep events, which coupled with the anomalous depths and swarm like nature of deep seismic sequence led Lapins et al. (2020) to conclude that the mechanism for lower crustal seismicity in the area might be due to transient high strain rate and pore fluid pressure conditions.
In our study we used the earthquake catalogs of Keir et al. (2006) and Lapins et al. (2020) to test thermo-rheological property of the Ethiopian lithosphere. For the Keir et al. (2006) catalog local earthquakes were derived during October 2001 to February 2003 from arrival times of earthquakes at four or more seismic stations composing the EAGLE seismic network (Keir et al., 2006), and using a best-fit 1-D seismic velocity model derived from tomography (Daly et al., 2008). The seismic network was mostly composed of 30 broadband seismic stations distributed in the central and northern Ethiopian rift and both adjacent plateaus. The catalog includes 1957 earthquakes with local magnitude (ML) between 0 and 4 and a magnitude of completeness of ~ ML 2.1. The error bars on the earthquake locations are on average ±600 m in horizontal directions and ±2000 m in depth (Keir et al., 2006; Mazzarini et al., 2013). In contrast, the Lapins et al. (2020) catalog uses 15 seismic stations deployed on Aluto and Corbetti volcanoes during 2012 and 2013. Earthquakes were located with seven or more phase arrivals, including at least one S phase. A number of 1D velocity models, including the (Daly et al., 2008) model were tested and yielded similar locations. The catalog includes 58 earthquakes up to a maximum Mw of 3.7, with most of the earthquakes occurring in March and April 2012. Due to sub-optimal seismic stations positions relative to the earthquakes individual error bars of earthquake depth are larger, and approximated at ±5 km (Lapins et al., 2020).
Brittle behavior of the upper crust can be modeled using Equation (1) (Sibson, 1974).
where (σ1-σ3) is differential stress; β is a parameter that depends on the tectonic setting and friction coefficient (e.g., Ranalli, 1997) and is equal to 0.6 (Muluneh et al., 2018); ρ is density; g is acceleration due to gravity and pf is the pore fluid factor. The linear frictional failure bounds the strength envelop.
The ductile regime is represented by power law dislocation creep (e.g., Turcotte and Schubert, 2002) and is given by Equation (2)
where ˙ϵ is the strain rate in s−1; T(z) is temperature in degrees Kelvin; R is the universal gas constant; A, E, and n depend on the rheology considered.
Numerical simulation of lithospheric deformation using wet quartzite upper crust and seismic moment release show that upper to middle crustal earthquakes in the MER can be explained by the rheology of the crust (Muluneh et al., 2020). For the lower crust, we use mafic granulite rheology for the NW plateau and beneath the rift. The inferred rheology agrees with the elevated Vp/Vs ratio (e.g., Keranen et al., 2009) and high densities constrained by inversion of gravity data (Mahatsente et al., 1999; Cornwell et al., 2006). The creep parameters for mafic granulite are A = 1.4 × 10⁴ MPan s−1, E = 445 KJ/mol and n = 4.2 (Ranalli, 1997). The density for wet quartzite is 2,640 kg/m3.
Calculation of ductile rheology is sensitive to temperature variation with depth (Equation 2). The steady state, one-dimensional heat conduction equation with exponentially decreasing radioactive heat production is given as (e.g., Pasquale et al., 2014).
where A0 is crustal radioactive heat production, K is thermal conductivity, b is the Characteristics thickness of the layer enriched with radioactive elements and taken here to be 10 km (Pasquale et al., 2014).
Integration of Equation (3) results in the geothermal gradient given by the following equation:
where T0 is surface temperature and considered here to be equal to 273 K, Q0 is surface heat flow. Crustal heat production, A0, is assumed to be 2 μW/m3 and thermal conductivity, K, is equal to 3 W/m K (Pasquale et al., 2014).
We use P-T independent thermal conductivity and hence the T(z) (Equation 4) depends mainly on the surface heat flow value, which is estimated to be 50 and 70 mW/m2 for NW plateau and the MER, respectively. We compute these values by using a steady state geothermal gradient by assuming the lithosphere is in a state of thermal equilibrium (e.g., Sippel et al., 2017). However, this assumption may not hold for the rift, beneath which active upwelling and small scale convections likely occur in the asthenosphere (Civiero et al., 2016; Gallacher et al., 2016) and where crustal magmatism is ongoing (Chambers et al., 2019). This is well-shown by the difficulty in constructing a typical geotherm for the rift due to a wide range of temperature estimates even for a single locality (Rooney et al., 2005).
In the calculation of ductile strength (Equation 2), strain rate (˙ϵ) is one of the questionable parameters. Rheological profiles can be modeled by considering spatially invariable strain rate (10−15 s−1; Albaric et al., 2009; Sippel et al., 2017). Here we use strain rate determined using a finite element numerical modeling of deformation across the MER (Muluneh et al., 2020). The model in Figure 3 shows the present day strain rate in the MER, which is comparable to GPS observations (Birhanu et al., 2016; Knappe et al., 2020). Both GPS observation and numerical modeling of deformation indicate that strain rate is distributed over a wide region (Knappe et al., 2020; Muluneh et al., 2020) but with a significant proportion localized to the magmatic segments with strain rate of ~2 × 10⁻¹⁴ s−1 (Kogan et al., 2012; Muluneh et al., 2020). We then consider a strain rate of 10−16 and 10−15 s−1 for the NW plateau.
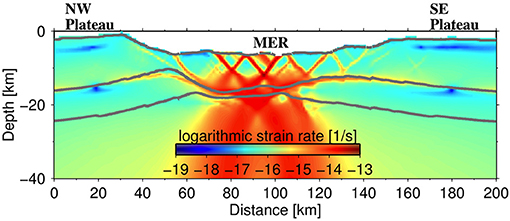
Figure 3. Present day 2D strain rate in the MER and adjacent plateau (from Muluneh et al., 2020). In the MER, high strain rate is localized in ~30 km wide zone.
The results of our yield strength envelopes (YSE) calculations presented in Figure 4 allow us to model both the long-term strength of the crust as well as short term earthquake processes (Bürgmann and Dresen, 2008; Hauksson and Meier, 2018). Several studies have evaluated the consistency between crustal rheology and depth distribution of earthquakes (Déverchere et al., 2001; Albaric et al., 2009; Dong et al., 2018; Hauksson and Meier, 2018; Muluneh et al., 2020) by making an assumption that increased strength results in more seismicity (Hauksson and Meier, 2018). In the present study, we also make a similar assumption.
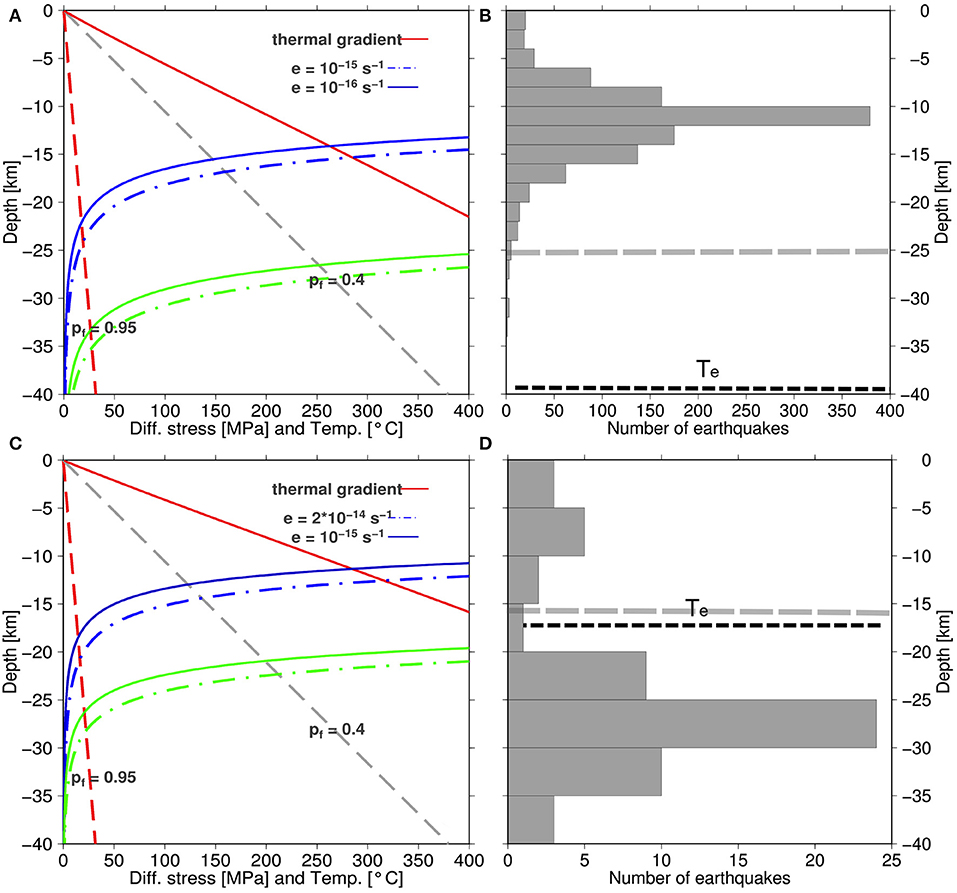
Figure 4. Yield Strength Envelope (YSE) and seismicity in the NW plateau (A,B; respectively) and the MER (C,D; respectively). There is a good match between modeled BDT and depth distribution of seismicity in the NW plateau. In the rift, there is a big mismatch between the two parameters. The seismicity is in 2 and 5 km depth bins in the NW plateau and the MER, respectively. The YSE is constructed for wet quartzite upper crust (blue lines) and mafic granulite (green lines) lower crust for both NW plateau and the MER. The pf is the pore fluid factor [0.4 for hydrostatic and 0.95 for (near-) lithostatic states shown in broken gray and red lines, respectively]. Te refers to the effective elastic thickness (Ebinger and Hayward, 1996). The broken gray line in (B,D) is the boundary between upper and lower crust (Mackenzie et al., 2005).
Figures 4A,B show the YSE calculated for the NW plateau and the rift, respectively. In the NW plateau brittle deformation occurs down to depth of ~28 km under hydrostatic pore fluid pressure conditions. Increasing the pore fluid pressure to near-lithostatic fluid pressure conditions increases the brittle layer to a depth of 32 km. Comparing the yield strength envelope with depth distribution of earthquakes in the lower crust shows that hydrostatic pore fluid pressure explains the observed seismicity (Figures 2A,B, 4A). Considering the hypocentral depth uncertainty (~2 km; Keir et al., 2006), we interpret that hydrostatic pore pressure and mafic rheology are sufficient conditions for lower crustal seismicity.
Similarly, we construct the YSE for the central MER using strain rate that varies by an order of magnitude and pore fluid factor of 0.4 and 0.95 (Figure 4C). The higher strain rate corresponding to the strain rate value beneath the magmatic segments increases the brittle layer thickness by about ~1 km in both upper and lower crust. Increasing the pore fluid factor to 0.95 allows brittle deformation down to ~28 km depth, which is a similar depth to the peak in lower crustal seismicity beneath the MER (Figure 4D).
Here we discuss our interpretation of the depth distribution of earthquake beneath the NW plateau and MER alongside independent geodynamic constraints. Support of our interpretation of hydrostatic pore pressure and mafic rheology being sufficient to generate lower crustal earthquakes beneath the NW Plateau comes from insights into the long-term strength of the crust from comparison of between the effective elastic (Te) and seismogenic (Ts) thickness (Maggi et al., 2000; Watts and Burov, 2003; Pérez-Gussinyé et al., 2009). The depth distribution of earthquakes constrain the seismogenic layer thickness (Watts and Burov, 2003). Ebinger and Hayward (1996) estimate the Te for different tectonic sectors of Ethiopia including the NW plateau, by computing the transfer function between gravity and topography as a function of wavelength of coherence. The Te is ~40 km in the NW plateau, which agrees well with the seismogenic layer thickness (~32 km). Therefore, the lower crust in the region has a long-term strength to allow brittle failure (Keir et al., 2009).
The deep seismicity is broadly distributed beneath the NW plateau and Yerrer-Tullu-Wellel volcanic lineament, in areas where magnetotelluric (MT) shows intermediate conductivities (Whaler and Hautot, 2006; Keir et al., 2009). A caveat to this is that denser and localized clusters of deep seismicity are also observed in localized regions of high conductivity beneath volcanoes near the rift, suggesting that in some localized regions fluid pressure higher than hydrostatic may also contribute to deep seismicity in some regions. However, in general we observe a good correlation between the depth distribution of earthquakes and modeled crustal rheology in the NW plateau (Figures 4A,B).
In contrast beneath the MER, estimates of plate strength are that Te is 17 ± 2 km in the central MER (Ebinger and Hayward, 1996). However, deeper earthquakes (down to 38 km) occur in the central MER than is predicted by both our rheological model and the estimate of Te (Figure 2C; Lapins et al., 2020). Therefore, in the following sections we present theoretical considerations for a range of conditions that allow lower crustal seismicity in the central MER.
The lower crust exhibits variable behavior over different time scales in thermally active areas (Thatcher and Pollitz, 2008). Transient high strain rate during localized creep in the lower crust allows earthquakes to occur (Campbell and Menegon, 2019). Similarly, magma injection laboratory experiments shows that the strain rate could reach about ten orders of magnitude faster than plate tectonic rates (Tuffen et al., 2008). Such high strain rate localizes deformation in a narrow zone in otherwise underformed lower crust (Hawemann et al., 2018; Campbell and Menegon, 2019). Translating the laboratory determined strain rates to natural shear zones show that the value ranges from 10−9 to 10−13 s−1 (Bürgmann and Dresen, 2008). Geophysical observations from the MER show that high strain rates at lower crustal depth can be induced by movement of magma and/or fluids exsolved from magma (Chambers et al., 2019; Iddon and Edmonds, 2020; Lapins et al., 2020).
Figure 4C shows that near-lithostatic pore fluid pressure allows brittle failure only down to ~30 km, yet deeper earthquakes down to a depth of ~38 km occur beneath the MER (Lapins et al., 2020). We therefore conduct an alternative experiment using a strain rate of 10−9 and 10−10 s−1 and pore-fluid pressure approaching the lithostatic condition (Figure 5). Strictly speaking, transient deformations should be modeled using a dynamic approach (e.g., Albert et al., 2000). However, here we make the simpler assumption that the crust reaches instantaneous equilibrium with the migrating fluid. The transient deformation modifies the strength envelope greatly.
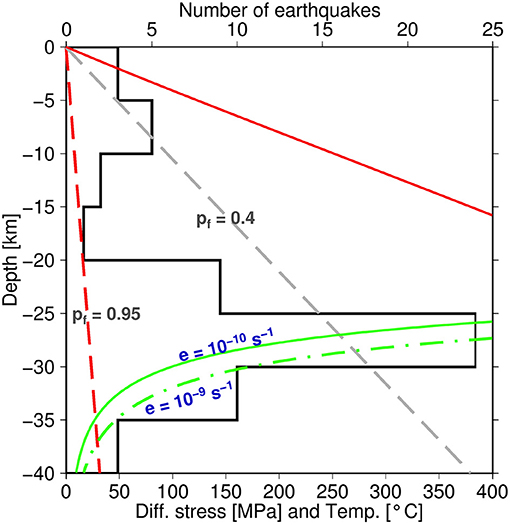
Figure 5. Yield Strength Envelope (YSE) constructed using transient strain rate of 10−10 and 10−9 s−1 (For the sake of clarity, we only show the curves for the lower crust). The stairs-step shows the depth distribution of earthquakes in the rift, similar to Figure 4D. This transient high pore fluid pressure and strain rate explains the observed lower crustal seismicity in the central MER (Lapins et al., 2020). The flow law and geothermal gradient are similar to Figure 4C.
The results of our new YSE calculation in Figure 5 shows that the load bearing element under near-lithostatic pore fluid pressure conditions moves down to ~35 and ~38 km under a strain rate of 10−10 and 10−9 s−1, respectively. The stress due to transient fluid flow allows failure to occur at a depth of 38 km with a differential stress with a magnitude of 32 MPa (Figure 5). The differential stress at 38 km depth is consistent with the minimum shear stress (i.e., ~15 MPa; Muluneh et al., 2018) measured as (σ1 − σ3)/2 to cause seismicity in the crust. Unlike previous studies which uses seismicity cut-off of either D90 or D95 (i.e., a depth above which 90 or 95% of seismicity occurs), we consider the maximum depth of earthquake here (38 km) in order not to lose earthquakes due to hypocentral uncertainty. However, choosing 38 km or D90 or D95 does not significantly affect the analysis presented here as only three earthquakes are located below 35 km.
We interpret the results as strong evidence that the combined effect of transient high strain rate and pore fluid pressure due to the movement of magma and volatiles provide a straightforward mechanism to cause lower crustal seismicity. Unless these conditions are met, the maximum depth of lower crustal earthquakes in the central MER remain difficult to explain.
Here we discuss our interpretation in light of global evidence for deep fluid related seismicity. High strain rates due to the intrusion of magma in the lower crust facilitates lower crustal seismicity, as for example observed at Lake Tahoe, California (Smith et al., 2004). Introduction of fluids to initially dry lower crust is associated with earthquakes, which in turn causes fracturing and allow fluids to migrate (Jamtveit et al., 2019). The intimate link between high pore fluid pressure and lower crustal seismicity has been interpreted in a number of settings (Reyners et al., 2007; Lindenfeld et al., 2012; Martens and White, 2013; Weinstein et al., 2017). Compelling evidence from other parts of the EARS argue that the pore fluid pressure in the lower crust must be in near-lithostatic conditions mainly due to fluid migrating from the mantle and consequently induce lower crustal seismicity (Lindenfeld et al., 2012; Weinstein et al., 2017). The lower crustal earthquakes reported by Lapins et al. (2020) and modeled here, are the first observed in the MER.
Based on the framework provided above by the modeling in the previous section we use the space-time pattern of the observed lower crustal earthquake swarm to model the flow of fluid through the crust. We assume that the pore fluid pressure in the lower crust is in near-lithostatic condition, and sourced from a reservoir of partial melt localized near the Moho (Chambers et al., 2019) and/or exsolved volatiles from solidified melt in the lowermost crust (Keir et al., 2009; Iddon and Edmonds, 2020).
We assume that the earthquakes show space-time progression as given by the square root of time, t, and hydraulic diffusivity, D, (Equation 5)
where r is the distance (depth). The above equation assumes isotropic media. We assume that the fluid migrates from ~30 km depth to the upper crust and also that seismicity starts and ends on the 25th and 120th day from the beginning of seismicity on the 31 January 2012 (Lloyd et al., 2018; Lapins et al., 2020). We have started our modeled flow at 30 km depth since this is assumed to be the depth at which the migration front starts (Figure 6).
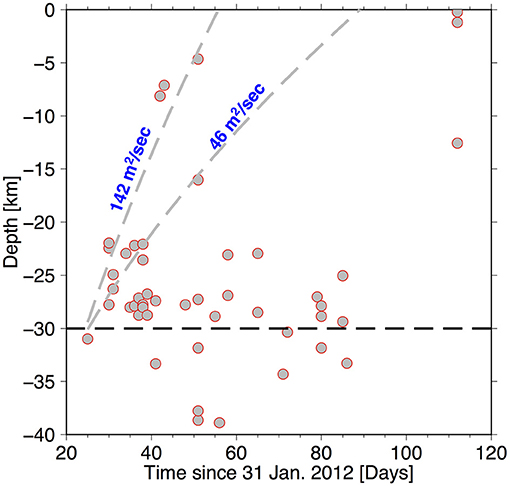
Figure 6. Time-depth progression of earthquakes in the central MER (Lapins et al., 2020) for hydraulic diffusivity, D, of 142 and 46 m2/s. The broken black line at 30 km depth shows where most of the seismicity nucleates.
The results of the modeling in Figure 6 shows the diffusivity values by fitting the envelope of migrating front of seismicity (Shapiro et al., 1999). We estimate two values of hydraulic diffusivity, i.e., D = 46 and 142 m2/s, which are at least an order of magnitude higher than the expected crustal hydraulic diffusivity values ranging from 0.01 to 10 m2/s (Scholz, 2002). The permeability, κ, in m2 is estimated using Equation (6)
where η is viscosity; ϕ* is porosity; βf,r are the compressibility of the fluid and the rock, respectively.
Considering the standard values for the above parameters (i.e., βf,r = 10−9 and 10−11Pa −1, respectively; ϕ* = 3 × 10⁻³), CO2 as fluid medium (η = 10−5 Pa s) and diffusivity of 46 and 142 m2/s result in permeability values of 5.9 × 10⁻¹⁵ m2 and 1.8 × 10⁻¹⁴ m2, respectively. The permeability values increase to 4.7 × 10⁻¹⁴ m2 and 1.5 × 10⁻¹³ m2 for hydraulic diffusivity of 46 and 142 m2, respectively, if we consider water as a dominant fluid.
Comparison of our results to other similar studies shows that the permeability estimated here is similar to the permeability estimates at seismogenic depth [i.e., 5 × 10⁻¹⁶–5 × 10⁻¹⁴ m2–referred to as seismogenic permeability by Talwani et al. (2007)]. According to Talwani et al. (2007) permeability values less or greater than the seismogenic permability do not allow pore-fluid diffusion and hence no seismicity. Therefore, our estimate of permeability indicate that high pore fluid pressure can form and hence seismicity occurs in the lower crust.
Our permeability values are two to four orders of magnitude higher than the expected permeability at lower crustal depth (Ingebritsen and Manning, 2010), which implies that the diffusivity must be controlled by large scale fractures (Scholz, 2002). The high pore fluid pressure eventually reactivates preexisting faults in the lower crust and results in the enhancement of permeability and as a result the fluid pressure drops (Scholz, 2002). Rock fracture experiment shows that seismicity is continuous even after fluid pressure drops (Passelégue et al., 2018). Despite such high permeability, CO2 degassing measurement in the region does not observe anomalously high flux (Hunt et al., 2017), which might indicate that the permeability estimate is transient.
Fault reactivation in the upper crust due to magmatic fluids have been reported from the other parts of the EARS (Muirhead et al., 2016; Jones et al., 2019). These studies argue that optimally oriented faults act as passageways for fluids from deep-seated magma chambers.
Figure 7 shows accumulated plastic strain, interpreted here as faults, in numerical models at 3 and 11 Myr since model initiation (Muluneh et al., 2020). Sibson (2000) presented an expression (Equation 7) to relate the differential stress (σ1 − σ3) for frictional reactivation of cohesion-less normal faults at earthquake focal depth to dip angle (90°-ϕ; where ϕ is the angle σ1 makes with the fault plane) of faults.
Using the near-lithostatic pore fluid factor (pf = 0.95) and the corresponding differential stress of 32 MPa (Figure 5) results in reactivation of optimally oriented preexisting normal fault with a friction coefficient of less than 0.42, which corresponds to a dip angle of 56° and lockup dip angle of 23° (Figure 8A). The lock-up angle is less than the 30° dip angle below which faults are not expected to slip (Anderson, 1951). High pore fluid pressure may allow slip to occur on faults which dip <30°. It is also possible that faults with low cohesion slip with dip angle < 20° (Reston, 2020).
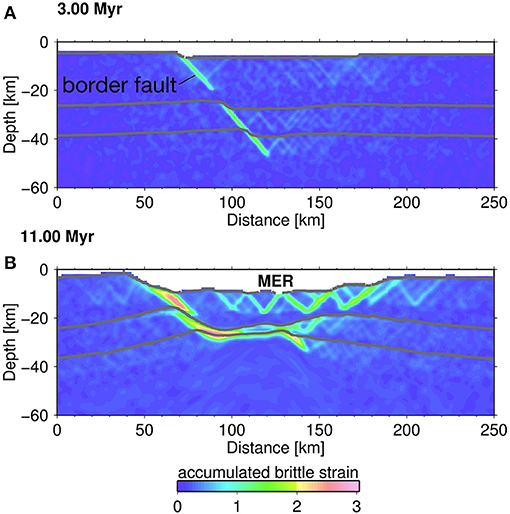
Figure 7. Sequence of formation of faults in the MER (from Muluneh et al., 2020) at 3 Myr (A) and 11 Myr (B) after model initiation. The high pore fluid pressure can potentially reactivate faults in the lower crust.

Figure 8. (A) Dip (90-ϕ) of reactivated fault in the lower crust for pore fluid factor of 0.95 for different friction coefficients. (B) Depth distribution of earthquakes projected on E-W line, along the dip direction of rift parallel faults. The linear seismicity streak in the lower crust is bounded by an optimal (56°) and lock-up (23°) dip angles for friction coefficient of 0.42.
The optimal dip angle of the reactivated pre-existing fault is similar to the dip of upper crustal earthquake focal mechanisms (ranging from 33° to 75°; Keir et al., 2006; Muluneh et al., 2018), and the surface expression of active faults (~60°; Agostini et al., 2011). In addition, similar dip angles for crustal scale border faults feature at rift initiation of the MER in numerical models (Muluneh et al., 2020). The reactivated faults channeling fluids from the lower crust to the upper crust explain the fault geometry and crustal permeability values constrained by the lower crustal seismicity swarm (Figure 8B).
We present thermo-rheological models for the Main Ethiopian Rift and adjacent NW plateau to understand the mechanism for lower crustal earthquakes. Lower crustal earthquakes are observed in both regions, despite difference in crustal structure and thermal regimes. Our findings showed lower crustal earthquakes in the NW plateau is mainly controlled by the strong rheology under hydrostatic pore fluid pressure conditions. Comparison between the effective elastic thickness (Te) and seismogenic layer thickness (Ts) also supports the long-term strength of the lower crust in the region. On the contrary, the lower crust in the rift shows no long-term strength, in agreement with our modeling of yield strength envelope and comparison between Te and Ts. Instead, earthquakes at this depth require transient stress pulses with a combination of high pore fluid pressure and transient strain rate inducing the seismicity in the lower crust. In addition, our modeling suggests that high pore fluid pressure reactivates preexisting faults in the lower crust which enhances the permeability and hence fluid migration through the crust.
The datasets presented in this study can be found in online repositories. The names of the repository/repositories and accession number(s) can be found below: Lapins et al. (2020): https://doi.org/10.1029/2020JB020030; Keir et al. (2006): https://doi.org/10.1029/2005JB003748.
AM conceived the study, carried out the calculations, created the figures and wrote the first draft. DK contributed to the interpretation of the results and writing of the paper. GC contributed to the writing of the paper. All authors gave final approval for publication.
DK was supported by NERC grant NE/L013932/1. DK and GC are supported by Ministero dell'Università e della Ricerca (MiUR) through PRIN grant 2017P9AT72.
The authors declare that the research was conducted in the absence of any commercial or financial relationships that could be construed as a potential conflict of interest.
AM acknowledges the support from the Canon Foundation, Japan-Africa Exchange program for sponsoring his stay at Kyoto University, where a significant portion of this study was conducted. Constructive comments from the two reviewers and chief Editor, Prof. Valerio Acocella, improved the quality of the manuscript. Python (https://www.python.org/) was used to construct the yield strength envelopes. Figures were drafted using Generic Mapping Tools (Wessel and Smith, 1998).
Agostini, A., Bonini, M., Corti, G., Sani, F., and Manetti, P. (2011). Distribution of Quaternary deformation in the central Main Ethiopian Rift, East Africa. Tectonics 30:TC4010. doi: 10.1029/2010TC002833
Albaric, J., Deverchere, J., Petit, C., and Gall, B. L. (2009). Crustal rheology and depth distribution of earthquakes: insight from the central and Southern East African Rift System. Tectonophysics 468, 28–41. doi: 10.1016/j.tecto.2008.05.021
Albert, R., Phillips, R., Dombard, A., and Brown, C. D. (2000). A test of the validity of yield strength envelopes with an elastoviscoplastic finite element model. Geophys. J. Int. 140, 399–409. doi: 10.1046/j.1365-246x.2000.00006.x
Birhanu, Y., Bendick, R., Fisseha, S., Lewi, E., Floyd, M., King, R., et al. (2016). GPS constraints on broad scale extension in the Ethiopian highlands and Main Ethiopian Rift. Geophys. Res. Lett. 43, 6844–6851. doi: 10.1002/2016GL069890
Bürgmann, R., and Dresen, G. (2008). Rheology of the lower crust and upper mantle: evidence from rock mechanics geodesy and field observations. Annu. Rev. Earth Planet. Sci. 36, 531–567. doi: 10.1146/annurev.earth.36.031207.124326
Campbell, L., and Menegon, L. (2019). Transient high strain rate during localized viscous creep in the dry lower continental crust (Lofoten, Norway). J. Geophys. Res. 124, 10240–10260. doi: 10.1029/2019JB018052
Chambers, E., Harmon, N., Keir, D., and Rychert, C. (2019). Using Ambient noise to image the northern East African Rift. Geochem. Geophys. Geosyst. 20, 2091–2109. doi: 10.1029/2018GC008129
Civiero, C., Goes, S., Hammond, J., Fishwick, S., Ahmed, A., Ayele, A., et al. (2016). Small-scale thermal upwellings under the northern East African Rift from S travel time tomography. J. Geophys. Res. 121, 7395–7408. doi: 10.1002/2016JB013070
Cornwell, D., Mackenzie, G., England, R., Maguire, P., Asfaw, L., and Oluma, B. (2006). “Northern main Ethiopian Rift crustal structure from new high-precision gravity data,” in From Yirgu, G., Ebinger, C., and Maguire, P.K.H. (eds) The Afar Volcanic Province Within the East African Rift System. Geological Society of London, Special Publications, Vol. 259 (London), 307–321.
Cornwell, D., Maguire, P., England, R., and Stuart, G. (2010). Imaging detailed crustal structure ad magmatic intrusion across the Ethiopian Rift using a dense linear broadband array. Geochem. Geophys. Geosyst. 11:Q0AB03. doi: 10.1029/2009GC002637
Corti, G. (2009). Continental rift evolution: from rift initiation to incipient break-up in the Main Ethiopian Rift, East Africa. Earth Sci. Rev. 96, 1–53. doi: 10.1016/j.earscirev.2009.06.005
Corti, G., Molin, P., Sembroni, A., Bastow, I., and Keir, D. (2018). Control of Pre-rift lithospheric structure on the architecture and evolution of continental rifts: insights from the Main Ethiopian Rift, East Africa. Tectonics 37, 477–496. doi: 10.1002/2017TC004799
Corti, G., Sani, F., Florio, A., Greenfield, T., Keir, D., Erbello, A., et al. (2020). Tectonics of the Asela-Langano marin, Main Ethiopian Rift (East Africa). Tectonics 39:e2020TC006075. doi: 10.1029/2020TC006075
Craig, T., Jackson, A., Priestley, K., and McKenzie, D. (2011). Earthquake distribution patterns in Africa: their relationship to variations in lithospheric and geological structure, and their rheological implications. Geophys. J. Int. 185, 403–434. doi: 10.1111/j.1365-246X.2011.04950.x
Craig, T., and Jackson, J. (2021). Variations in the seismogenic thickness of East Africa. J. Geophys. Res. 126:e2020JB020754. doi: 10.1029/2020JB020754
Daly, E., Keir, D., Ebinger, C., Stuart, G. W., Bastow, I., and Ayele, A. (2008). Crustal tomographic imaging of a transitional continental rift: the Ethiopian rift. Geophys. J. Int. 172, 1033–1048. doi: 10.1111/j.1365-246X.2007.03682.x
Déverchere, J., Petit, C., Gileva, N., Radziminovitch, N., Melnikova, V., and Sankov, V. (2001). Depth distribution of earthquakes in the Baikal rift system and its implications for the rheology of the lithosphere. Geophys. J. Int. 146, 714–730. doi: 10.1046/j.0956-540x.2001.1484.484.x
Dong, Y., Ni, S., Yuen, D., and Li, Z. (2018). Crustal rheology from focal depths in the North China Basin. Earth Planet. Sci. Lett. 497, 123–138. doi: 10.1016/j.epsl.2018.06.018
Ebinger, C., and Casey, M. (2001). Continental breakup in magmatic provinces: an Ethiopian example. Geology 29, 527–530. doi: 10.1130/0091-7613(2001)029<0527:CBIMPA>2.0.CO;2
Ebinger, C., and Hayward, N. (1996). Soft plates and hot spots: views from Afar. J. Geophys. Res. 101, 21859–21876.
Gallacher, R., Keir, D., Stuart, N. H. G., Leroy, S., Hammond, J., Kendall, J.-M., et al. (2016). The initiation of segmented buoyancy-driven melting during continental breakup. Nat. Commun. 7:13110. doi: 10.1038/ncomms13110
Greenfield, T., Keir, D., Kendall, J.-M., and Ayele, A. (2019). Seismicity of the Bora-Tullu Moye volcanic field, 2016-2017. Geochem. Geophys. Geosyst. 20, 548–570. doi: 10.1029/2018GC007648
Hauksson, E., and Meier, M. (2018). Applying depth distribution of seismicity to determine thermo-mechanical properties of the seismogenic crust in southern california: comparing lithotectonic blocks. Pure Appl. Geophys. 176, 1061–1081. doi: 10.1007/s00024-018-1981-z
Hawemann, F., Mancktelow, N., Pennacchioni, G., Wex, S., and Camacho, A. (2018). Weak and slow, strong and fast: how shear zones evolve in a dry continental crust (Musgrave Ranges, central Australia). J. Geophys. Res. 124, 219–240. doi: 10.31223/OSF.IO/58WA7
Hellebrekers, N., Niemeijer, A. R., Fagereng, Å., Manda, B., and Mvula, R. L. (2019). Lower crustal earthquakes in the East African Rift System: insights from frictional properties of rock samples from the Malawi rift. Tectonophysics 767:228167. doi: 10.1016/j.tecto.2019.228167
Hofstetter, R., and Beyth, M. (2003). The Afar Depression: interpretation of the 1960-2000 earthquakes. Geophys. J. Int. 155, 715–732. doi: 10.1046/j.1365-246X.2003.02080.x
Hunt, J., Zafu, A., Mather, T., Pyle, D., and Barry, P. (2017). Spatially variable CO2 degassing in the Main Ethiopian Rift: implications for magma storage, volatile transport and rift related emissions. Geochem. Geophys. Geosyst. 18, 3714–3737. doi: 10.1002/2017GC006975
Iddon, F., and Edmonds, M. (2020). Volatile-rich magmas distributed through the upper crust in the Main Ethiopian Rift. Geochem. Geophys. Geosyst. 21:e2019GC008904. doi: 10.1029/2019GC008904
Ingebritsen, S., and Manning, C. (2010). Permeability of the continental crust: dynamic variations inferred from seismicity and metamorphism. Geofluids 10, 193–205. doi: 10.1002/9781444394900.ch13
Jackson, J. (2002). Faulting, flow and the strength of the continental lithosphere. Int. Geol. Rev. 44, 39–61. doi: 10.2747/0020-6814.44.1.39
Jamtveit, B., Petley-Ragan, A., Incel, S., Dunkel, K., Aupart, C., Austrheim, H., et al. (2019). The effects of earthquakes and fluids on the metamorphism of the lower continental crust. J. Geophys. Res. 124, 7725–7755. doi: 10.1029/2018JB016461
Jones, J., Stamps, D., Wauthier, C., Saria, E., and Biggs, J. (2019). Evidence for slip on a border fault triggered by magmatic processes in an immature continental rift. Geochem. Geophys. Geosyst. 20, 2515–2530. doi: 10.1029/2018GC008165
Keir, D., Bastow, I., Whaler, K., Daly, E., Cornwell, D., and Hautot, S. (2009). Lower crustal earthquakes near the Ethiopian Rift induced by magmatic processes. Geochem. Geophys. Geosyst. 10:Q0AB02. doi: 10.1029/2009GC002382
Keir, D., Ebinger, C., Stuart, G., Daly, E., and Ayele, A. (2006). Strain accommodation by magmatism and faulting as rifting proceeds to breakup: seismicity of the northern Ethiopian rift. J. Geophys. Res. 111:B05314. doi: 10.1029/2005JB003748
Keranen, K., Klemprer, S., Julia, J., Lawrence, J., and Nyblade, A. (2009). Low lower crustal velocity across Ethiopia: is the Main Ethiopian Rift a narrow rift in a hot craton? Geochem. Geophys. Geosyst. 10. doi: 10.1029/2008GC002293
Knappe, E., Bendick, R., Ebinger, C., Birhanu, Y., Lewi, E., Floyd, M., et al. (2020). Accommodation of east African Rifting across the Turkana depression. J. Geophys. Res. 125:e2019JB018469. doi: 10.1029/2019JB018469
Kogan, L., Fisseha, S., Bendick, R., Reilinger, R., McClusky, S., King, R., et al. (2012). Lithospheric strength and strain localization in continental extension from observations of the East African rift. J. Geophys. Res. 117. doi: 10.1029/2011JB008516
Lapins, S., Kendall, J.-M., Ayele, A., Wilks, M., Nowacki, A., and Cashman, K. (2020). Lower crustal seismicity on the Eastern Border faults of the Main Ethiopian Rift. J. Geophys. Res. 125:e2020JB020030. doi: 10.1029/2020JB020030
LaRosa, A., Keir, D., Doubre, C., Sani, F., Corti, G., Leroy, S., et al. (2021). Lower crustal earthquakes in the March 2018 sequence along the western Margin of Afar. Geochem. Geophys. Geosyst. 22:e2020GC009614. doi: 10.5194/egusphere-egu2020-3084
Lavayssiere, A., Drooff, C., Ebinger, C., Gallacher, R., Illsley-Kemp, F., Oliva, S., et al. (2019a). Depth extent and kinematics of faulting in the southern Tanganyika Rift, Africa. Tectonics 38, 842–862. doi: 10.1029/2018TC005379
Lavayssiere, A., Greenfield, T., Keir, D., Ayele, A., and kendall, J.-M. (2019b). Local seismicity near the actively deforming Corbetti volcano in the Main Ethiopian Rift. J. Volcanol. Geotherm. Res. 381, 227–237. doi: 10.1016/j.jvolgeores.2019.06.008
Lee, H., Muirhead, J., Fischer, T., Ebinger, C., Kattenhorn, S., Sharp, Z., et al. (2016). Massive and prolonged deep carbon emissions associated with continental rifting. Nat. Geosci. 9, 145–149. doi: 10.1038/ngeo2622
Lindenfeld, M., Rumpker, G., Link, G., Koehn, D., and Batte, A. (2012). Fluid-triggered earthquake swarms in the Rwenzori region, East African Rift-Evidence for rift initiation. Tectonophysics 566, 95–104. doi: 10.1016/j.tecto.2012.07.010
Lloyd, R., Biggs, J., Wilks, M., Nowacki, A., Kendall, J.-M., Ayele, A., et al. (2018). Evidence for cross rift structural controls on deformation and seismicity at a continental rift caldera. Earth Planet. Sci. Lett. 487, 190–200. doi: 10.1016/j.epsl.2018.01.037
Mackenzie, G., Thybo, H., and Maguire, P. (2005). Crustal velocity structure across the Main Ethiopian Rift: results from two-dimensional wide-angle seismic modeling. Geophys. J. Int. 162, 994–1006. doi: 10.1111/j.1365-246X.2005.02710.x
Maggi, A., Jackson, J., McKenzie, D., and Priestley, K. (2000). Earthquake focal depths, effective elastic thickness, and the strength of the continental lithosphere. Geology 28, 495–498. doi: 10.1130/0091-7613(2000)28<495:EFDEET>2.0.CO;2
Maguire, P., Keller, G., Klemperer, S., Mackenzie, G., Keranen, K., Harder, S., et al. (2006). “Crustal structure of the northern Main Ethiopian Rift from the EAGLE controlled-source survey; a snapshot of incipient lithospheric break-up,” in From Yirgu, G., Ebinger, C., and Maguire, P.K.H. (eds) The Afar volcanic province within the East African Rift System. Geological Society of London, Special Publications, Vol. 259 (London), 269–291.
Mahatsente, R., Jentzsch, G., and Jahr, T. (1999). Crustal structure of the Main Ethiopian Rift from gravity data: 3-dimensional modeling. Tectonophysics 313, 363–382.
Martens, H., and White, R. (2013). Triggering of micro earthquakes in Iceland by volatiles released from a dyke intrusion. Geophys. J. Int. 194, 1738–1754. doi: 10.1093/gji/ggt184
Mazzarini, F., Keir, D., and Isola, I. (2013). Spatial relationship between earthquakes and volcanic vents in the central-northern Main Ethiopian Rift. J. Volcanol. Geotherm. Res. 262, 123–133. doi: 10.1016/j.jvolgeores.2013.05.007
Muirhead, J., Kattenhorn, S., Lee, H., Mana, S., Turrin, B., Fischer, T., et al. (2016). Evolution of upper crustal faulting assisted by magmatic volatile release during early-stage continental rift development in the East African Rift. Geosphere 12, 1670–1700. doi: 10.1130/GES01375.1
Muluneh, A., Brune, S., Illsley-Kemp, F., Corti, G., Keir, D., Glerum, A., et al. (2020). Mechanism for deep crustal seismicity: insight from modeling of deformation processes at the Main Ethiopian Rift. Geochem. Geophys. Geosyst. 21:e2020GC008935. doi: 10.1029/2020GC008935
Muluneh, A., Kidane, T., Corti, G., and Keir, D. (2018). Constraints on fault and crustal strength of the Main Ethiopian Rift from formal inversion of earthquake focal mechanism data. Tectonophysics 731–732, 172–180. doi: 10.1016/j.tecto.2018.03.010
O'Donnell, J., Selway, K., Nyblade, A., Brazier, R., and Tahir, N. E. (2016). Thick lithosphere, deep crustal earthquakes and no melt: a triple challenge to understanding extension in the western branch of the East African Rift. Geophys. J. Int. 204, 985–998. doi: 10.1093/gji/ggv492
Pasquale, V., Verdoya, M., and Chiozzi, P. (2014). Geothermics - Heat Flow in the Lithosphere. Heidelberg: Springer.
Passelégue, F., Brantut, N., and Mitchell, T. (2018). Fault reactivation by fluid injection: controls from stress state and injection rate. Geophys. Res. Lett. 45, 12837–12846. doi: 10.1029/2018GL080470
Pérez-Gussinyé, M., Metois, M., Fernandez, M., Verges, J., Fullea, J., and Lowry, A. (2009). Effective elastic thickness of Africa and its relationship to other proxies for lithospheric structure and surface tectonics. Earth Planet. Sci. Lett. 287, 152–167. doi: 10.1016/j.epsl.2009.08.004
Reston, T. (2020). On the rotation and frictional lock-up of normal faults: explaining the dip distribution of normal fault earthquakes and resolving the low-angle normal fault paradox. Tectonophysics 790:228550. doi: 10.1016/j.tecto.2020.228550
Reyners, M., Eberhart-Philips, D., and Stuart, G. (2007). The role of fluids in lower-crustal earthquakes near continental rifts. Nature 446, 1075–1078. doi: 10.1038/nature05743
Rooney, T., Furman, T., Yirgu, G., and Ayalew, D. (2005). Structure of the Ethiopian lithosphere: Xenolith evidence in the Main Ethiopian Rift. Geochim. Cosmochim. Acta 69, 3889–3910. doi: 10.1016/j.gca.2005.03.043
Scholz, C. (2002). The Mechanics of Earthquakes and Faulting. Cambridge: Cambridge University Press.
Shapiro, S., Audigane, P., and Royer, J. (1999). Large-scale in situ permeability tensor of rocks from induced microseismicity. Geophys. J. Int. 137, 207–213.
Sibson, R. (2000). Fluid involvement in normal faulting. J. Geodyn. 29, 469–499. doi: 10.1016/S0264-3707(99)00042-3
Sippel, J., Meeßen, C., Cacace, M., Mechie, J., Fishwick, S., Heine, C., et al. (2017). The Kenya rift revisited: insights into lithospheric strength through data-driven 3D gravity and thermal modeling. Solid Earth 8, 45–81. doi: 10.5194/se-8-45-2017
Smith, K., von Seggern, D., Blewitt, G., Preston, L., Anderson, J., Wernicke, B., et al. (2004). Evidence for deep magma injection beneath Lake Tahoe, Nevada-California. Science 305, 1277–1280. doi: 10.1126/science.1101304
Talwani, P., Chen, L., and Gahalaut, K. (2007). Seismogenic permeability, ks. J. Geophys. Res. 112:B07309. doi: 10.1029/2006JB004665
Tefera, M., Chernet, T., and Haro, W. (1990). Geological Map of Ethiopia. Scale 1:2,000,000. Addis Ababa: Ethiopian Institute of Geological Survey.
Thatcher, W., and Pollitz, F. (2008). Temporal evolution of continental lithospheric strength in actively deforming regions. GSA Today 18, 55–62. doi: 10.1130/GSAT01804-5A.1
Tuffen, H., Smith, R., and Sammonds, P. (2008). Evidence for seismogenic fracture of silicic magma. Nature 453, 511–514. doi: 10.1038/nature06989
Watts, A., and Burov, E. (2003). Lithospheric strength and its relationship to the elastic and seismogenic layer thickness. Earth Planet. Sci. Lett. 213, 113–131. doi: 10.1016/S0012-821X(03)00289-9
Weinstein, A., Oliva, S., Ebinger, C., Roecker, S., Tiberi, C., Aman, M., et al. (2017). Fault-magma interactions during early continental rifting: seismicity of the Magadi-Natron-Manyara basins, Africa. Geochem. Geophys. Geosyst. 18, 3662–3686. doi: 10.1002/2017GC007027
Wessel, P., and Smith, W. (1998). New, improved version of the generic mapping tools released. EOS 79, 579. doi: 10.1029/98EO00426
Whaler, K., and Hautot, S. (2006). “The electrical resistivity structure of the crust beneath the northern Main Ethiopian rift,” in From Yirgu, G., Ebinger, C., and Maguire, P.K.H. (eds) The Afar volcanic province within the African Rift System. Geological Society of London, Special Publications, Vol 259 (London), 293–305.
Wilks, M., Kendall, J.-M., Nowacki, A., Biggs, J., Wookey, J., Birhanu, Y., et al. (2017). Seismicity associated with magmatism, faulting and hydrothermal circulation at Aluto Volcano, Main Ethiopian Rift. J. Volcanol. Geotherm. Res. 340, 52–67. doi: 10.1016/j.jvolgeores.2017.04.003
Keywords: pore fluid pressure, rheology, main Ethiopian rift, lower crustal seismicity, strain rate, geothermal gradient
Citation: Muluneh AA, Keir D and Corti G (2021) Thermo-Rheological Properties of the Ethiopian Lithosphere and Evidence for Transient Fluid Induced Lower Crustal Seismicity Beneath the Ethiopian Rift. Front. Earth Sci. 9:610165. doi: 10.3389/feart.2021.610165
Received: 25 September 2020; Accepted: 29 March 2021;
Published: 03 May 2021.
Edited by:
Yosuke Aoki, The University of Tokyo, JapanReviewed by:
Sarah Jaye Oliva, University of British Columbia, CanadaCopyright © 2021 Muluneh, Keir and Corti. This is an open-access article distributed under the terms of the Creative Commons Attribution License (CC BY). The use, distribution or reproduction in other forums is permitted, provided the original author(s) and the copyright owner(s) are credited and that the original publication in this journal is cited, in accordance with accepted academic practice. No use, distribution or reproduction is permitted which does not comply with these terms.
*Correspondence: Ameha A. Muluneh, ameha.atnafu@aau.edu.et; amugeol@gmail.com
Disclaimer: All claims expressed in this article are solely those of the authors and do not necessarily represent those of their affiliated organizations, or those of the publisher, the editors and the reviewers. Any product that may be evaluated in this article or claim that may be made by its manufacturer is not guaranteed or endorsed by the publisher.
Research integrity at Frontiers
Learn more about the work of our research integrity team to safeguard the quality of each article we publish.