 Yaguo Zou
 Yunfa Miao
 Shiling Yang4,5,6
 Zisha Wang
 Shengli Yang
- 1Key Laboratory of Desert and Desertification, Northwest Institute of Eco-Environment and Resources, Chinese Academy of Sciences, Lanzhou, China
- 2College of Resources and Environment, University of Chinese Academy of Sciences, Beijing, China
- 3Center for Excellence in Tibetan Plateau Earth Sciences, Institute of Tibetan Plateau Research, Chinese Academy of Sciences, Beijing, China
- 4Key Laboratory of Cenozoic Geology and Environment, Institute of Geology and Geophysics, Chinese Academy of Sciences, Beijing, China
- 5CAS Center for Excellence in Life and Paleoenvironment, Beijing, China
- 6College of Earth and Planetary Sciences, University of Chinese Academy of Sciences, Beijing, China
- 7Key Laboratory of Western China's Environmental Systems (Ministry of Education), College of Earth and Environmental Sciences, Lanzhou University, Lanzhou, China
Microcharcoal is a proxy of biomass burning and widely used in paleoenvironment research to reconstruct the fire history, which is influenced by the climate and land cover changes of the past. At present, microcharcoal characteristics (amount, size, shape) are commonly quantified by visual inspection, which is a precise but time-consuming approach. A few computer-assisted methods have been developed, but with an insufficient degree of automation. This paper proposes a new methodology for microcharcoal statistical analysis based on digital image processing by ImageJ software, which improves statistical efficiency by 80–90%, and validation by manual statistical comparison. The method is then applied to reconstruct the fire-related environmental change in the Weiyuan loess section since about 40 thousand years before present (ka BP), northwest China with a semi-arid climate, found that the microcharcoal concentration is low in cold and dry climate and high in warm and humid climate. The two main contributions of this study are: 1) proposal of a new, reliable and high efficient automatic statistical method for microcharcoal analysis; and 2) using the new method in a semi-arid section, revealing the paleofire evolution patterns in the semi-arid region was mainly driven by the biomass rather than the aridity degree found in humid regions.
Introduction
Fire is an important ecological factor that can indicate changes of climate, vegetation and human activities. In recent years, with the frequent occurrence of extreme weather events, the incidence of biomass burning has increased (Jolly et al., 2015). This has had significant impacts: ecological damage, economic costs, and human casualties (Ashe et al., 2009; Goldammer et al., 2013), for example, the 2019–2020 Australian bushfire season (colloquially known as the Black Summer) (Campbell et al., 2020; Lindenmayer and Taylor, 2020). Therefore, it is of practical significance to understand the processes controlling wildfires. However, climate dynamics and vegetation variations operate at relatively larger scales than fire processes (Macias Fauria et al., 2011), which are considered to be the primary control factors of the fire (Moritz et al., 2005). Hence, understanding past fire dynamics and their relationship to environmental factors is a key aspect of preserving and managing present-day ecosystem functions and fire occurrence (Conedera et al., 2009).
An effective method to obtain paleofire data is from sedimentary records (Miao et al., 2016b; Han et al., 2020), using pyrogenic carbon as a proxy of paleofire, since this is produced by the incomplete combustion of organic matter during biomass burning or fossil fuel consumption (Goldberg, 1985). Microcharcoal is an indicator of pyrogenic carbon, and in palynological studies it is also extracted during the pollen extraction process. Microcharcoal can be characterized by its jet-black, opaque, angular particles in samples; otherwise, the clear or brown, amorphous, weakly -structured particles are considered as vegetal matter (Patterson et al., 1987).
At present, the statistical analysis of microcharcoal is mainly based on visual inspection, which is accurate in identifying the microcharcoal characteristics but time-consuming: the manual measurement of the size of each microcharcoal grain is not conducive to improving work efficiency. In terms of our work experience, it takes 2–8 h to count each sample depending on the impurity content, for instance, this study (Weiyuan loess section) includes 76 samples, it will take about 19–76 working days (8 h per working day) to complete the statistics. Therefore, an automatic approach would clearly be advantageous, by increasing the speed at which samples could be analyzed and allowing the analysis of larger numbers of samples (Rhodes, 1998). Automatic counting of microcharcoal is an area that has long been proposed, following the studies of MacDonald et al., (1991) and Horn et al., (1992). However, research in this field is restricted by the development of computer performance and microscopic imaging technology, and has only progressed slowly. In 2004, ImageJ, an open-source, high-performance and lightweight biological image processing software was proposed (Abràmoff et al., 2004). ImageJ was used in microcharcoal analysis for the first time in 2005 (Stevenson and Haberle, 2005), and the procedure has also been used by Hawthorne and Mitchell (2016), but the method is only suitable for a small sample amount (e.g., in a petri dish) and large microcharcoal particle size (>125 μm), and the automation is still inadequate. Another independent study on the automatic analysis of microcharcoal (Thevenon and Anselmetti, 2007) found a method that can be applied to a large number of samples, however, due to the lack of accurate assessment, the results cannot be used directly and still need manual verification. Therefore, the method can only be regarded as computer-aided analysis, rather than automatic analysis.
In this study, we firstly proposed a new automatic statistical method for microcharcoal analysis, based on ImageJ software (Abràmoff et al., 2004). We then applied the new method to the Weiyuan loess section in the semi-arid area of northwest China, to analyze environmental changes in this area since about 40 ka BP. As part of the second-largest arid to semi-arid area in the world, northwestern China is a unique location for studying fire history, along with vegetation and aridity evolution (Miao et al., 2016a); in addition, arid and semi-arid regions are also more vulnerable to global climate change (Prospero and Lamb, 2003; Cook et al., 2004; Sankaran et al., 2005). Therefore, studying the past fire evolution in this region (Huang et al., 2006; Tan et al., 2015; Han et al., 2020; Miao et al., 2020) is helpful to understand the impacts of future climate changes on the incidence and intensity of fire.
Materials and Methods
Study Site
The Weiyuan section (Yang S et al., 2015) (104.25°E, 35.13°N) is located in the west of the Loess Plateau, northwest China, at the boundary of the monsoon zone and non-monsoon zone. This region has a semi-arid and typical temperate continental climate, with an annual average temperature of about 6.8°C, and annual average precipitation of around 363 mm (Yang X et al., 2015; Figure 1A).
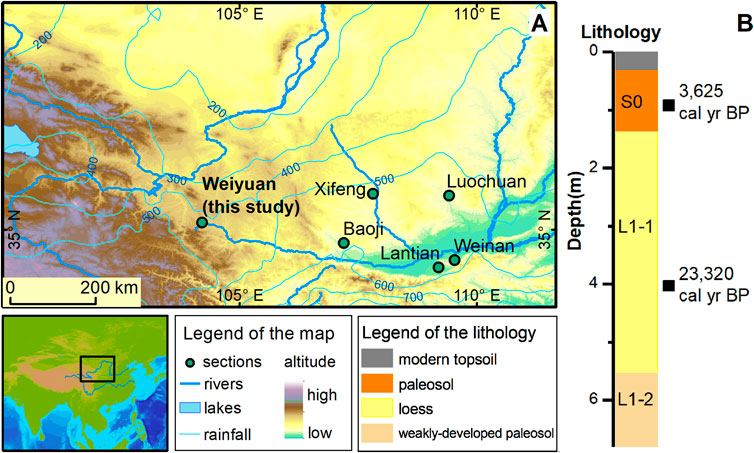
FIGURE 1. Overview of the Weiyuan section. (A): Location of the Weiyuan section and other sections; (B): the stratigraphic column with the Accelerator Mass Spectrometry (AMS) radiocarbon ages of the Weiyuan section (Yang S et al., 2015).
The section is located on a fluvial terrace of the upper Weihe River, and contains typical loess-paleosol sediment. The sampled section thickness is 6.8 m, with a sampling interval of 5–10 cm. The Weiyuan section can be divided into the following several layers (Figure 1B) (Yang X et al., 2015): 1) 0–20 cm: cultivated layer, disturbed by human planting activities; 2) 20–135 cm: paleosol (S0), developed under a warm and wet climate during the Holocene (11.7-0 ka BP), corresponding to marine isotope stage 1 (MIS 1); 3) 135–555 cm: loess (L1-1), developed under a cold and dry climate during the Last Glacial Maximum (26.5-20 ka BP, MIS2); 4) 555–680 cm: loess (L1-2), a weak paleosol developed during an interstadial of the Last Glacial Period (MIS 3, 57–32 ka BP), under a warmer and wetter climate. Two AMS 14C dates have been obtained for the L1-1 and S0 units in the Weiyuan section (Yang S et al., 2015) (Figure 1B).
Microcharcoal Extraction and Identification
The sediment samples of the Weiyuan section were extracted following standard palynological methodology (Miao et al., 2017) as follows. 1) One tablet of Lycopodium (each one containing about 27, 600 Lycopodium spores) was initially added to each weighted sample as a reference for the calculation of concentration (Maher, 1981); 2) acid digestion with 10% HCl removed carbonates; 3) acid digestion with 40% HF removed silicates; 4) fine sieving (10 μm mesh) to enrich the microcharcoal particles (as well as pollen grains); 5) microscope slides of each sample were prepared for identification.
The microcharcoal concentration can be calculated according to the following formula:
where: x is sample number; C is the identified number of microcharcoals; L is the identified number of Lycopodium spores; and W is the sample dry weight.
Image Processing and Statistics
To apply the image processing method, scanned RGB digital images were acquired from the microslides by the Zeiss slide scanner Axio Scan. Z1, a 10× magnification objective lens was used with a CCD camera with an imaging accuracy of 0.44 μm/pixel. For a standard slide of 26 mm × 76 mm in size, a 1.5 GB image file in Zeiss CZI format was generated and converted in Zeiss Zen software to the more common TIFF format for analysis in ImageJ. Note that converting to TIFF will increase the size of the file to about 5GB, which is very demanding for computer performance, therefore, the minimum performance recommendations of computer processor are 3 GHz of clock rate, eight cores, and 32 GB of RAM, moreover, cropping the image into subsets for processing is also a remedy. an example image, is shown in Figure 2A. The RGB color model is an additive color model applied to display images in electronic systems, based on human perception of colors. All other colors are then defined as mixtures of the three additive primary colors, red, green, and blue, in different proportions (Hirsch, 2004). In the commonly adopted 8-bit storage format, its mathematical representation is:
Here, the range 0–255 represents the resolution of typical 8-bit binary storage (28 = 256), for instance, (0, 0, 0) represents pure black and (255, 255, 255) represents pure white. Considering that microcharcoal is mainly characterized by being black in color, when image processing we convert RGB color to grayscale images in ImageJ (Ferreira and Rasband, 2012), using the formula:
The converted grayscale image is shown in Figure 2B. The automated method needs to distinguish both microcharcoal and Lycopodium spores; however, testing showed the microcharcoal particles were successfully separated from microcharcoal-like particles, while no efficient method was found to distinguish the Lycopodium spores from the Lycopodium-like particles. Therefore, the statistics for the Lycopodium spores were determined manually. Fortunately, counting the Lycopodium spores is a relatively easy task, because according to Wang et al., (2020), a minimum count of 300 Lycopodium spores will enable stable microcharcoal results.
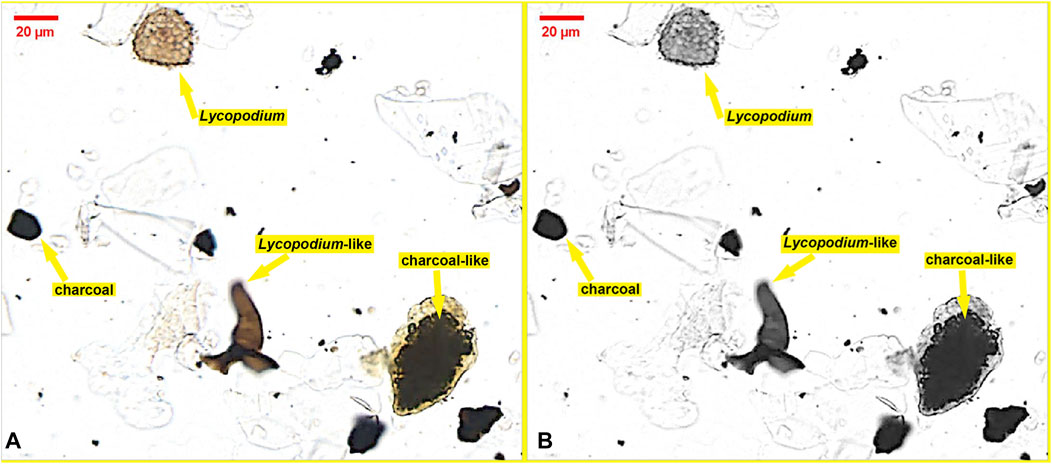
FIGURE 2. Spectral and morphological characteristics of microcharcoal, microcharcoal-like, Lycopodium spores, and Lycopodium-like objects in a RGB color model (A) and gray scale image (B). Lycopodium-like means that its spectral signature is similar to Lycopodium when classified by computer, although they can be easily distinguished manually.
The key to automatic analysis of microcharcoal samples is to convert the human eye identification criteria described in natural language into computer image processing criteria described in mathematical language. First of all, the most intuitive criterion is that the grayscale values of microcharcoal particles are low, and we suggest this as the basic standard. Furthermore, as shown in Figure 2B, the grayscale values of microcharcoal-like particles are also low, and these are hard to distinguish based only on the grayscale value. Further observations showed that the range of grayscale values of microcharcoal particles is smaller than that of the microcharcoal-like particles: this is because of the grayscale color of microcharcoal particles is relatively consistent, while that of microcharcoal-like particles may have some variability. Therefore, we propose the median grayscale value or the standard deviation of a single particle as a further distinguishing criterion.
Results
Image Interpretation by ImageJ
Microcharcoal image automatic recognition consists of two steps: training a classification model and testing the classification model. To train the classification model, we compiled a training set from sample Nos. 10, 20, 30, 40, 50, 60, and 70 to avoid individual samples introducing errors in the imaging system. We manually selected microcharcoal and microcharcoal-like particle samples from the seven test sets and calculated their statistical characteristics. Figure 3A shows histograms of the grayscale values of microcharcoal and microcharcoal-like pixels, and Figure 3B shows the frequency distributions; the grayscale value distributions of microcharcoal and microcharcoal-like particles are not clearly distinguishable, making it is difficult to simply set a threshold on a grayscale image and conclude that any pixel value less than that is definitely microcharcoal. However, the amount of microcharcoal is far greater than the amount of microcharcoal-like material, which supports the opinion that most of the black particles identified during pollen analysis could be regarded as microcharcoal (Sun et al., 2000). Therefore, further distinguishing strategies are needed. We calculated the median and standard deviation of the grayscale value of each selected particle (see Figures 3C,D); both achieve a better differentiation than the grayscale value alone, with the standard deviation performing better than the median. Therefore, we decided to use the standard deviation as a further distinction criterion.
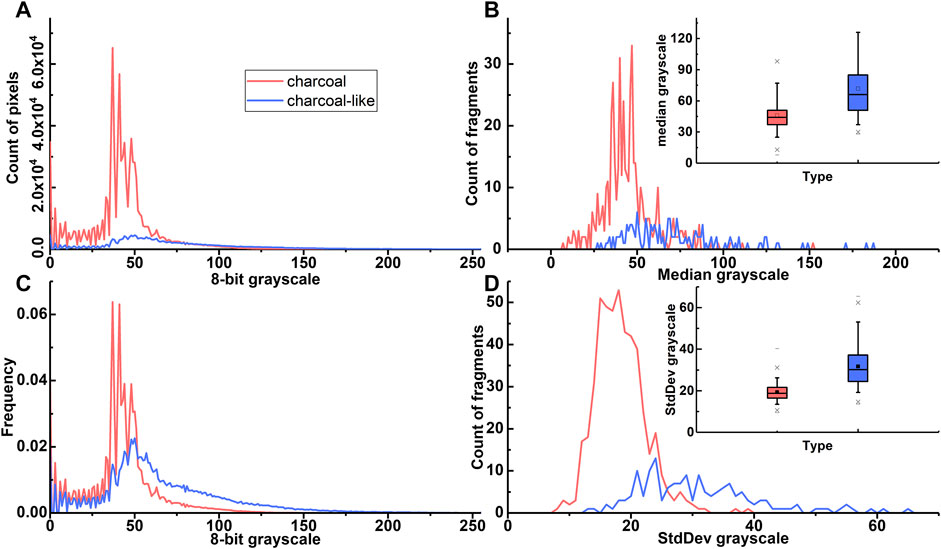
FIGURE 3. The distinction between microcharcoal and microcharcoal-like particles in a training set was manually selected from sample Nos. 10, 20, 30, 40, 50, 60, and 70. (A): histograms of grayscale values of microcharcoal and microcharcoal-like pixels; (B): the frequency distributions of the grayscale values of microcharcoal and microcharcoal-like pixels; (C): the distribution of median grayscale values of microcharcoal and microcharcoal-like particles; (D): the standard deviations of grayscale values of microcharcoal and microcharcoal-like particles.
Based on the above discussion, we propose the following distinguishing procedure based on ImageJ software. 1) Grayscale threshold: the image is converted from RGB to grayscale, and pixels with grayscale values of 100 or less are retained for the next step. According to the training set, the grayscale values of 98.28% of microcharcoal pixels and 84.41% of microcharcoal-like pixels meet this criterion. 2) Noise reduction: the selected results are processed in ImageJ to remove small patches and to fill holes. 3) Vector graph generation: raster images of individual pixels are converted to vector images of individual particles, using the ImageJ particle analysis tool. 4) Parameter analysis: required spectral and shape parameters can be calculated by ImageJ, such as median grayscale value, standard deviation of grayscale value, length, width, area, perimeter, etc. 5) Standard deviation threshold: objects with a grayscale standard deviation greater than 26 were excluded, because they were more likely to be not microcharcoal. 6) Removal of particles smaller than 10 microns in length, following standard palynological practice (Miao et al., 2017), because a 10 μm mesh is adopted for fine sieving of samples to remove the impurities. In addition, particles smaller than 10 microns are more difficult to identify, regardless of whether using computers or human eyes.
Evaluation by Comparison With Manual Analysis
Next, we manually tested the classification accuracy by selecting test samples. To avoid choosing samples from the training data, we selected test sets from sample Nos. 5, 15, 25, 35, 45, 55, 65, and 75 in a random position, each test sample size is approximately 1/9 to the result sample size. The results of ImageJ automatic analysis based on the above procedures were compared with the results of manual statistical analysis by three people: Yaguo Zou, Zisha Wang and Anxia Du (see Figure 4). The microcharcoal identification experience of the three people is 2 years, 3 years and 1 year respectively. The identification was done in ImageJ based on the cropped test sample from the scanned image under 400× magnification (the original image is scanned by 10× objective lens and CCD camera into an image with a resolution of 0.44 um/pixel, and can be further enlarged in ImageJ, similar to the function of the eyepiece), and the black, opaque, angular particles (Patterson et al., 1987) were identified as microcharcoal. Figure 4A shows the total number of counted particles, and reveals that the automatic statistical results are close to those of Yaguo Zou and Zisha Wang, but higher than those of Anxia Du; however, the trends of all four sets of results are consistent. It is interesting that anomalous values were produced by human analysis, not by the machine analysis, for the reasons explained below. Figure 4B shows the total area of counted particles, and unlike the number of particles, this is consistent across all four cases (3 humans, 1 machine). One obvious possibility to explain the statistical difference appeared in particle count but not in particle area, is that the smaller particles were overlooked: as a result, the number of particles recorded by Anxia Du was smaller but the total area was still similar. This is confirmed in Figure 4C, where the rank-size distributions of counted particles show that the four statistical sequences are broadly consistent in the large size particles range, but as the grain size gets smaller, the differences increase. This is easy to understand because our statistical rule requires that microcharcoal particles above 10 microns should be counted, but the visual implementation of this threshold requires experience – unless every particle is measured, which is time-consuming. Overall, the grayscale value distributions of counted pixels (Figure 4D) and the standard deviations of counted particles (Figure 4E) show that the four sets of results for manual and machine analysis are generally consistent with each other.
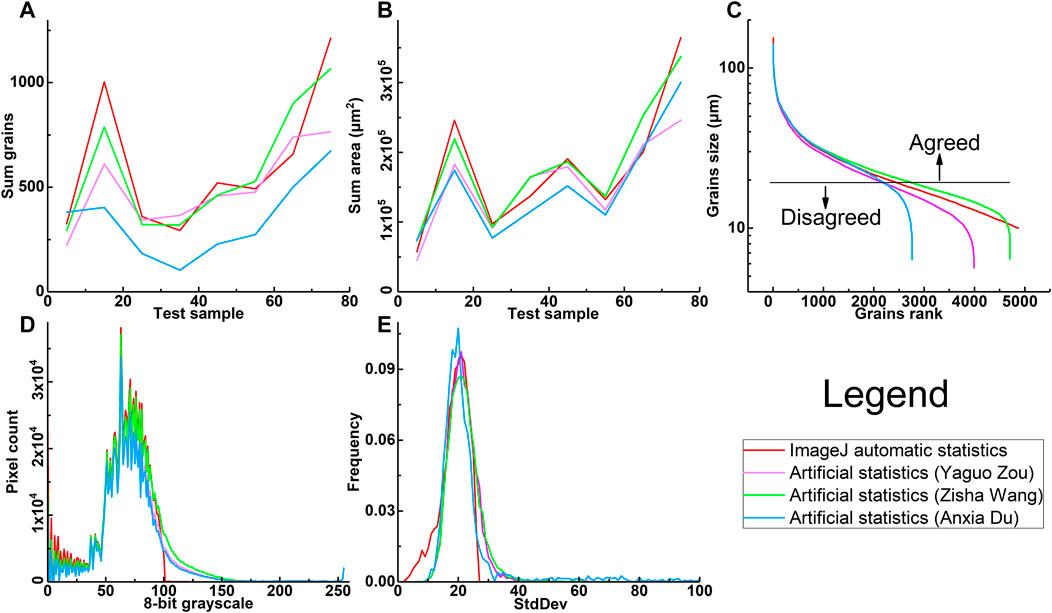
FIGURE 4. Comparison of automatic (ImageJ) and manual statistical analysis. (A): the total number of counted particles. (B): the total area of counted particles. (C): the rank-size distribution of counted particles; (D): the distributions of grayscale values of counted pixels; (E): the standard deviation of grayscale values of counted particles.
In conclusion, the results of the machine and manual statistical analysis achieve high levels of consistency in their distributions of pixel grayscale values (Figure 4D), particle grayscale standard deviations (Figure 4E), and particle rank-size distribution greater than 20 microns (Figure 4C). The main divergence occurs at around the 5–20 microns grain size (Figure 4C), because the visual measurement is needed in the manual statistical analysis to determine whether or not a microcharcoal particle is larger than 10 microns. Therefore, the results are consistent in the total area counted (Figure 4B), but not in the number of particles counted (Figure 4A), however, the trends are still consistent.
Statistical Results
The results of analyzed microcharcoal concentrations in the Weiyuan section are shown in Figure 5. Note that we provide the traditional particle concentration (Figure 5A), but for the convenience of comparing image processing with the manual statistics, the area concentration (Figure 5B) is also given. We believe that the area concentration is more accurate than the particle concentration in reflecting the amount of microcharcoal; however, the high correlation coefficient (0.97) between the two curves shows that the particle concentration and area concentration are closely matched. In addition, the results analyzed manually in Figure 4 are dotted on the curves in Figures 5A,B as a reference for the accuracy of the automatic method; however, we note that the test sample size in Figure 4 is only 1/9 to the result sample size in Figure 5; Nevertheless, we still find a good correlation between the manual and automatic analysis methods.
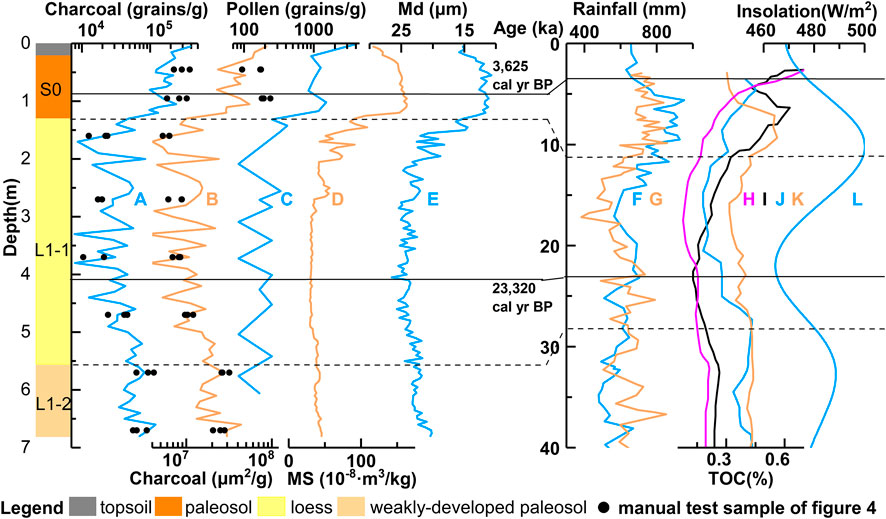
FIGURE 5. Comparison between the microcharcoal concentration in the Weiyuan section and other environmental indexes nearby. (A): particle concentration of microcharcoal in Weiyuan (this study); (B): area concentration of microcharcoal in Weiyuan (this study); (C): pollen concentration in the Weiyuan section (Yang X et al., 2015); (D): magnetic susceptibility (MS) in the Weiyuan section (Yang S et al., 2015); (E): median grain size (Md) in the Weiyuan section (Yang S et al., 2015); (F): 10Be based rainfall in the Baoji section (Beck et al., 2018); (G): phytoliths based mean annual precipitation (MAP) in the Weinan section (Lu et al., 2007); (H–K): Total organic carbon (Grant et al., 2019) (Grant et al.) content in Luochuan (H), Xifeng (I), Weinan (J), and Lantian (K) respectively (Lu et al., 2019). (L): summer insolation in 35°N (Laskar et al., 2004). The black dots in (A) and (B) are the results analyzed manually by 3 people in Figure 4 as a reference for the accuracy of the automatic method; however, we note that the test sample size in Figure 4 is only 1/9 to the result sample size in (A) and (B).
As the trend shown in the microcharcoal results, from the L1-2 layer (MIS 3) to the L1-1 layer (MIS2), along with the climate changed from cool and wet to dry and cold in the Last Glacial Period, it shows a low values state and a slowly decreasing trend in microcharcoal content. The S0 layer (MIS 1, Holocene), deposited during a warm and wet climate, shows three clear stages in its microcharcoal content: first, a rapid increase during the early Holocene, then a fluctuating state from ∼4 to 2 ka BP, and finally an increase since 2 ka BP. This pattern indicates that fire events in the region were weaker during the Last Glacial Period and stronger during the Holocene, which is inconsistent with the commonly recognized trends that fires occur more frequently in glacial periods and less frequently in interglacial periods.
Discussion
Comparison of Microcharcoal Statistical Methods
As an important proxy reflecting the occurrence of fire events, microcharcoal has a unique research value; however, manual statistical analysis of microcharcoal contents is time-consuming, which hinders the application and development of this method. Based on previous research on the automatic analysis of microcharcoal, this paper proposed and verifies a new automatic statistical method, our method reduce the time to count a sample from 2–8 h to 20–30 min, and there was no reduction in accuracy compared with manual statistics, which is more convenient and greatly improves the statistical efficiency of microcharcoal.
Scientific statistical work needs comprehensive evaluation in terms of both accuracy and efficiency. The automatic statistical analysis of microcharcoal is a long-standing but rarely discussed problem, first addressed by MacDonald et al., (1991) in their study using a transmitted light microscope and an image analysis system designed for optical densitometry; in their method, microcharcoal was identified according to its optical density (opacity). A more complete automatic statistical system was proposed by Horn et al., (1992), based on statistical characteristics such as grayscale and its standard deviation. However, due to the limited computer performance and at that time, these early explorations were not developed further, and their methods were not widely adopted.
With the continuous development of computer technology, and successive improvements in image processing software, automatic pattern recognition has become widely used in many fields: for example, ImageJ in biology, metallographic analyzer in materials science, ENVI and Erdas in remote-sensing. These image processing packages are also often used by other disciplines, including in research on computer-aided microcharcoal analysis (Stevenson and Haberle, 2005; Thevenon and Anselmetti, 2007; Lu et al., 2009; Tan et al., 2014; Hawthorne and Mitchell, 2016). However, many studies simply apply the software directly, without discussing the software’s statistical basis and without a thorough evaluation of its accuracy.
This study further analyzed the problem of microcharcoal statistics from the perspective of methodology, yielding preliminary results as described above. However, there are still many deficiencies in this study: for example, we are not sure whether the threshold chosen in this paper is applicable to other sedimentary sections, because of their different sedimentary environments and soil textures. In addition, the problem with the automatic statistical analysis of Lycopodium spores has not been satisfactorily resolved, although this may be addressed by using the WEKA (Hall et al., 2009) expansion package in ImageJ, which is an image classification algorithm based on training samples and machine learning; however, this algorithm requires high-performance computer, because the microscope images are too large. Alternatively, more recognisable markers may be used for instead of the Lycopodium spores, such as plastic markers (Ogden and Gordon, 1986). In this sense, automated statistical algorithms are evaluated not only for their accuracy, but also for their achievement of the same accuracy but with the consumption of fewer computational resources. Therefore, we suggest strengthening research efforts in this field in the future, not only the address the automatic statistical analysis of microcharcoal and Lycopodium spores, but also to extend the method to the analysis of all spores and pollen species encountered in palynological studies.
Spatial Heterogeneity of Fire Event Controlling Factors
In combustion theory, the fire triangle (Countryman, 1972) is a simple model for understanding the three necessary ingredients for ignition and combustion: heat, fuel, and an oxidizing agent (usually oxygen). This is a microscopic model from a chemical perspective, then Moritz et al., (2005) extended it to different scales of time and space, including the large scale which vegetation, climate, and ignition sources constitute the three vertices of the triangle. Among them, vegetation conditions and extreme weather (Miao et al., 2020) are considered to be two basic factors to control the production of microcharcoal (Herring, 1985; Clark, 1988; Whitlock and Larsen, 2002; Huang et al., 2006; Adolf et al., 2018). More specifically, the solar insolation drives the terrestrial temperature changes (Bond et al., 1997; Chen et al., 1997; Petit et al., 1999; Sun et al., 2012), and the moisture (precipitation) is coevolved with the temperature (Miao et al., 2012), moreover, the burning of the biomass is more easily in dry conditions (Huang et al., 2006; Pechony and Shindell, 2010; Miao et al., 2019; Han et al., 2020).
Based on the above discussion, we selected the environmental indexes related to fire activities for comparative analysis (Figure 5): 1) the pollen concentration (Yang X et al., 2015; Figure 5C) as a proxy for plant species richness; 2) the magnetic susceptibility (Yang S et al., 2015; Figure 5D) as a proxy for East Asian Summer Monsoon strength; 3) median grain size (Yang S et al., 2015; Figure 5E) as a proxy for East Asian Winter Monsoon; 4) the reconstructions of rainfall based on 10Be in the Baoji section (Beck et al., 2018; Figure 5F); 5) mean annual precipitation based on phytoliths in the Weinan section (Lu et al., 2007) (Figure 5G); 6) total organic carbon content in Luochuan (Figure 5H), Xifeng (Figure 5I), Weinan (Figure 5J), and Lantian (Figure 5K) respectively (Lu et al., 2019); 7) summer insolation in 35°N (Laskar et al., 2004; Figure 5L).
Based on the information in Figure 5, we interpret the paleofire characteristics in this section, since about 40 ka BP, as follows.
Fire activity during the Last Glacial Period was significantly reduced relative to that in the Holocene, which is contrary to the usual view of wildfire being more prevalent in cold and dry climates, leading to more microcharcoal in associated sediments (Kaars et al., 2000; Luo et al., 2001; Wang et al., 2005; Wang et al., 2012; Zhao et al., 2019; Xiao et al., 2020; Zhang et al., 2020). We speculate that the reason for this difference is that the above records are all from humid regions, while this study was located in a semi-arid region. Here, although the climate of the Last Glacial Period was dry and conducive to the occurrence of fire, the vegetation coverage in Weiyuan was low, as supported by palynological records (Yang X et al., 2015; Figure 5C), total organic carbon content (Lu et al., 2019) (Figures 5H–K) and model simulation (Liu et al., 2002; Ni et al., 2010). This would have limited the development of wildfire. Paleofire studies in other arid areas, for example, Sierra Leone in sub-Saharan Africa, have found similar patterns (Bird and Cali, 1998). However, long time-scale paleofire records in arid and semi-arid areas remain sparse, and often show strong spatial heterogeneity (Wang et al., 2005; Wang et al., 2012), so this hypothesis needs to be verified by additional microcharcoal studies in arid areas in the future.
The first significant increase of fire was from 12 ka BP to 5 ka BP, this period can be further divided into two stages. At the earlier stage, summer insolation was at a high level (Laskar et al., 2004; Figure 5L), which is considered as a contributing factor to the occurrence of wildfires (Whitlock et al., 2010), and it was confirmed by sedimentary records (Millspaugh et al., 2000; Brunelle and Whitlock, 2003; Whitlock et al., 2008; Gil-Romera et al., 2014; Inoue et al., 2018) and simulation results (Hély et al., 2010). At the later stage, summer insolation has decreased, but the rainfall began to increase (Beck et al., 2018; Lu et al., 2007; Figures 5F,G), which promoted plant growth (Yang X et al., 2015; Lu et al., 2019; Figures 5C,H–K) and resulted in an abundant fuel supply.
The second significant increase of fire, since 2 ka BP, is more likely to be associated with human activity. Weiyuan section is located near the center of early ancient China, and thus lies in a region with strong ancient human activities (Dong et al., 2013; An et al., 2017). Wang et al., (2003) suggest that human activity is the strongest additional factor superimposed on the natural background trend. With the development of human productivity, anthropogenic influence on natural processes has gradually strengthened: in areas where early human activity was intense, the increase in microcharcoal over the last few thousand years is often explained as a result of human use of fire, and this is more evident in the Holocene microcharcoal record (Xue et al., 2018).
Conclusion
(1) In this study, an automatic statistical method for microcharcoal was proposed, based on ImageJ software. The microcharcoal was identified using the pixel grayscale value threshold and the particle grayscale standard deviation threshold. Results from the statistical method were compared with manual analysis to demonstrate the method’s statistical effectiveness. This method is efficient and accurate, and provide a powerful tool for microcharcoal analysis.
(2) We applied the new automatic statistical method to reconstruct paleofire activity since ∼40 ka BP in the Weiyuan loess section, which is located in semi-arid northwest China. We compared this record with other related records, and revealed the spatial heterogeneity of factors controlling paleofire. We speculated that differences in vegetation coverage caused fire events in arid and humid areas to show opposing patterns. This is related to the contrasting abundance of fuel in arid and humid areas, but because of the lack of fire records in arid and semi-arid areas, more research is needed on the paleofire evolution in this area to verify this hypothesis.
Data Availability Statement
The raw data supporting the conclusions of this article will be made available by the authors, without undue reservation.
Author Contributions
YZ designed the experiment and wrote the manuscript, YM, YZ, and SY guided the work and modify the paper, SY collected samples and provided guidance, ZW and GT participated in the experiment.
Funding
The project is supported by NSFC (41772181, 41888101, 41807440, 42030505), the Strategic Priority Research Program of CAS (No. XDA20070200); Young Top Talents Project of the “Ten Thousand Youth Program” of the Organization Department of the Central Committee of the CPC; Youth Innovation Promotion Association, CAS (2014383); “Light of West China” Program, CAS; NSF of Gansu Province (18JR3RA395) and State Key Laboratory of Loess and Quaternary Geology, Institute of Earth Environment, CAS (SKLLQG1515).
Conflict of Interest
The authors declare that the research was conducted in the absence of any commercial or financial relationships that could be construed as a potential conflict of interest.
Acknowledgments
We are grateful to Yindi Duan, Xicai Zheng, Hongjie Yan helped in lab, Anxia Du contributed in manual statistical check. We thank the anonymous reviewers for their constructive suggestions.
References
Abràmoff, M. D., Magalhães, P. J., and Ram, S. J. (2004). Image processing with ImageJ. Biophot. Int. 11 (7), 36–42.
Adolf, C., Wunderle, S., Colombaroli, D., Weber, H., Gobet, E., Heiri, O., et al. (2018). The sedimentary and remote-sensing reflection of biomass burning in Europe. Global Ecol. Biogeogr. 27 (2), 199–212. doi:10.1111/geb.12682
An, C.-B., Tang, L., Barton, L., and Chen, F.-H. (2017). Climate change and cultural response around 4000 cal yr B.P. in the western part of Chinese Loess Plateau. Quat. Res. 63 (3), 347–352. doi:10.1016/j.yqres.2005.02.004
Ashe, B., McAneney, K. J., and Pitman, A. J. (2009). Total cost of fire in Australia. J. Risk Res. 12 (2), 121–136. doi:10.1080/13669870802648528
Beck, J. W., Zhou, W., Li, C., Wu, Z., White, L., Xian, F., et al. (2018). A 550,000-year record of East Asian monsoon rainfall from 10Be in loess. Science 360 (6391), 877–881. doi:10.1126/science.aam5825 |
Bird, M. I., and Cali, J. A. (1998). A million-year record of fire in sub-Saharan Africa. Nature 394 (6695), 767–769. doi:10.1038/29507
Bond, G., Showers, W., Cheseby, M., Lotti, R., Almasi, P., deMenocal, P., et al. (1997). A pervasive millennial-scale cycle in North Atlantic Holocene and glacial climates. Science 278 (5341), 1257. doi:10.1126/science.278.5341.1257
Brunelle, A., and Whitlock, C. (2003). Postglacial fire, vegetation, and climate history in the Clearwater Range, Northern Idaho, United States. Quat. Res. 60 (3), 307–318. doi:10.1016/j.yqres.2003.07.009
Campbell, S. L., Jones, P. J., Williamson, G. J., Wheeler, A. J., Lucani, C., Bowman, D. M. J. S., et al. (2020). Using digital technology to protect health in prolonged poor air quality episodes: a case study of the AirRater app during the Australian 2019–20 fires. Fire 3 (3), 40. doi:10.3390/fire3030040
Chen, F. H., Bloemendal, J., Wang, J. M., Li, J. J., and Oldfield, F. (1997). High-resolution multi-proxy climate records from Chinese loess: evidence for rapid climatic changes over the last 75 kyr. Palaeogeogr. Palaeoclimatol. Palaeoecol. 130 (1), 323–335. doi:10.1016/S0031-0182(96)00149-6
Clark, J. S. (1988). Particle motion and the theory of charcoal analysis: source area, transport, deposition, and sampling. Quat. Res. 30 (1), 67–80. doi:10.1016/0033-5894(88)90088-9
Conedera, M., Tinner, W., Neff, C., Meurer, M., Dickens, A. F., and Krebs, P. (2009). Reconstructing past fire regimes: methods, applications, and relevance to fire management and conservation. Quat. Sci. Rev. 28 (5–6), 555–576. doi:10.1016/j.quascirev.2008.11.005
Cook, E. R., Woodhouse, C. A., Eakin, C. M., Meko, D. M., and Stahle, D. W. (2004). Long-term aridity changes in the Western United States. Science 306 (5698), 1015–1018. doi:10.1126/science.1102586 |
Countryman, C. M. (1972). The fire environment concept. Berkeley, CA: U.S. Department of Agriculture Forest Service Pacific Southwest Forest and Range Experiment Station.
Dong, G., Jia, X., Elston, R., Chen, F., Li, S., Wang, L., et al. (2013). Spatial and temporal variety of prehistoric human settlement and its influencing factors in the upper Yellow River valley, Qinghai Province, China. J. Archaeol. Sci. 40 (5), 2538–2546. doi:10.1016/j.jas.2012.10.002
Gil-Romera, G., González-Sampériz, P., Lasheras-Álvarez, L., Sevilla-Callejo, M., Moreno, A., Valero-Garcés, B., et al. (2014). Biomass-modulated fire dynamics during the last glacial-interglacial transition at the central pyrenees (Spain). Palaeogeogr. Palaeoclimatol. Palaeoecol. 402, 113–124. doi:10.1016/j.palaeo.2014.03.015
Goldammer, J. G., Justice, C., Center, G. F. M., Unides, N., Csiszar, I., Reduction, U. N. O. f. D. R., et al. (2013). Vegetation fires and global change: challenges for concerted international action. A white paper directed to the United Nations and International Organizations. Remagen-Oberwinter: Kessel.
Grant, G. R., Naish, T. R., Dunbar, G. B., Stocchi, P., Kominz, M. A., Kamp, P. J. J., et al. (2019). The amplitude and origin of sea-level variability during the Pliocene epoch. Nature 574 (7777), 237–241. doi:10.1038/s41586-019-1619-z |
Hall, M., Frank, E., Holmes, G., Pfahringer, B., Reutemann, P., and Witten, I. H. (2009). The WEKA data mining software: an update. SIGKDD Explor. Newsl. 11 (1), 10–18. doi:10.1145/1656274.1656278
Han, Y., An, Z., Marlon, J. R., Bradley, R. S., Zhan, C., Arimoto, R., et al. (2020). Asian inland wildfires driven by glacial-interglacial climate change. Proc. Natl. Acad. Sci. U.S.A. 117 (10), 5184–5189. doi:10.1073/pnas.1822035117 |
Hawthorne, D., and Mitchell, F. J. G. (2016). Identifying past fire regimes throughout the Holocene in Ireland using new and established methods of charcoal analysis. Quat. Sci. Rev. 137, 45–53. doi:10.1016/j.quascirev.2016.01.027
Hély, C., Girardin, M. P., Ali, A. A., Carcaillet, C., Brewer, S., and Bergeron, Y. (2010). Eastern boreal North American wildfire risk of the past 7000 years: a model-data comparison. Geophys. Res. Lett. 37 (14), L14709. doi:10.1029/2010GL043706
Herring, J. R. (1985). “Charcoal fluxes into sediments of the North Pacific Ocean: the cenozoic record of burning,” in The carbon cycle and atmospheric CO2: natural variations Archean to present. Washington, D.C.: American Geophysical Union, 419–442.
Horn, S. P., Horn, R. D., and Byrne, R. (1992). An automated charcoal scanner for paleoecological studies. Palynology 16 (1), 7–12. doi:10.1080/01916122.1992.9989403
Huang, C., Pang, J., Chen, S. e., Su, H., Han, J., Cao, Y., et al. (2006). Charcoal records of fire history in the Holocene loess–soil sequences over the southern Loess Plateau of China. Palaeogeogr. Palaeoclimatol. Palaeoecol. 239 (1–2), 28–44. doi:10.1016/j.palaeo.2006.01.004
Inoue, J., Okuyama, C., and Takemura, K. (2018). Long-term fire activity under the East Asian monsoon responding to spring insolation, vegetation type, global climate, and human impact inferred from charcoal records in Lake Biwa sediments in central Japan. Quat. Sci. Rev. 179, 59–68. doi:10.1016/j.quascirev.2017.11.007
Jolly, W. M., Cochrane, M. A., Freeborn, P. H., Holden, Z. A., Brown, T. J., Williamson, G. J., et al. (2015). Climate-induced variations in global wildfire danger from 1979 to 2013. Nat. Commun. 6, 7537. doi:10.1038/ncomms8537 |
Kaars, S. v. d., Wang, X., Kershaw, P., Guichard, F., and Setiabudi, D. A. (2000). A Late Quaternary palaeoecological record from the Banda Sea, Indonesia: patterns of vegetation, climate and biomass burning in Indonesia and northern Australia. Palaeogeogr. Palaeoclimatol. Palaeoecol. 155 (1), 135–153. doi:10.1016/S0031-0182(99)00098-X
Laskar, J., Robutel, P., Joutel, F., Gastineau, M., Correia, A. C. M., and Levrard, B. (2004). A long-term numerical solution for the insolation quantities of the Earth. Astron. Astrophys. 428 (1), 261–285. doi:10.1051/0004-6361:20041335
Lindenmayer, D. B., and Taylor, C. (2020). New spatial analyses of Australian wildfires highlight the need for new fire, resource, and conservation policies. Proc. Natl. Acad. Sci. U.S.A. 117 (22), 12481. doi:10.1073/pnas.2002269117 |
Liu, J., Yu, G., and Chen, X. (2002). Palaeoclimate simulation of 21 ka for the Tibetan Plateau and Eastern Asia. Clim. Dynam. 19 (7), 575–583. doi:10.1007/s00382-002-0248-6
Lu, A., Li, Z., Li, J., Xuan, P., and Matsumoto, E. (2009). Comparative experiment of extracting charcoal from sediment with microscope in the Red River basin, Vietna. Quartenary Sci. 29 (4), 825–830. doi:10.3969/j.issn.1001-7410.2009.04.1 [in Chinese].
Lu, H.-Y., Wu, N.-Q., Liu, K.-B., Jiang, H., and Liu, T.-S. (2007). Phytoliths as quantitative indicators for the reconstruction of past environmental conditions in China II: palaeoenvironmental reconstruction in the Loess Plateau. Quat. Sci. Rev. 26 (5), 759–772. doi:10.1016/j.quascirev.2006.10.006
Lu, H., Liu, W., Yang, H., Wang, H., Liu, Z., Leng, Q., et al. (2019). 800-kyr land temperature variations modulated by vegetation changes on Chinese Loess Plateau. Nat. Commun. 10 (1), 1958. doi:10.1038/s41467-019-09978-1 |
Luo, Y., Chen, H., Wu, G., and Sun, X. (2001). Records of natural fire and climate history during the last three glacial-interglacial cycles around the South China Sea. Sci. China Earth Sci. 44 (10), 897. doi:10.1007/BF02907081
MacDonald, G. M., Larsen, C. P. S., Szeicz, J. M., and Moser, K. A. (1991). The reconstruction of boreal forest fire history from lake sediments: a comparison of charcoal, pollen, sedimentological, and geochemical indices. Quat. Sci. Rev. 10 (1), 53–71. doi:10.1016/0277-3791(91)90030-X
Macias Fauria, M., Michaletz, S. T., and Johnson, E. A. (2011). Predicting climate change effects on wildfires requires linking processes across scales. WIREs Clim. Change. 2 (1), 99–112. doi:10.1002/wcc.92
Maher, L. J. (1981). Statistics for microfossil concentration measurements employing samples spiked with marker grains. Rev. Palaeobot. Palynol. 32 (2), 153–191. doi:10.1016/0034-6667(81)90002-6
Miao, Y., Fang, X., Song, C., Yan, X., Zhang, P., Meng, Q., et al. (2016a). Late Cenozoic fire enhancement response to aridification in mid-latitude Asia: evidence from microcharcoal records. Quat. Sci. Rev. 139, 53–66. doi:10.1016/j.quascirev.2016.02.030
Miao, Y., Herrmann, M., Wu, F., Yan, X., and Yang, S. (2012). What controlled Mid–Late miocene long-term aridification in Central Asia? — global cooling or Tibetan Plateau uplift: a review. Earth Sci. Rev. 112 (3), 155–172. doi:10.1016/j.earscirev.2012.02.003
Miao, Y., Jin, H., and Cui, J. (2016b). Human activity accelerating the rapid desertification of the Mu us Sandy Lands, North China. Sci. Rep. 6 (1), 23003. doi:10.1038/srep23003 |
Miao, Y., Song, Y., Li, Y., Yang, S., Li, Y., Zhao, Y., et al. (2020). Late Pleistocene fire in the Ili Basin, Central Asia, and its potential links to paleoclimate change and human activities. Palaeogeogr. Palaeoclimatol. Palaeoecol. 547, 109700. doi:10.1016/j.palaeo.2020.109700
Miao, Y., Wu, F., Warny, S., Fang, X., Lu, H., Fu, B., et al. (2019). Miocene fire intensification linked to continuous aridification on the Tibetan Plateau. Geology 47 (4), 303–307. doi:10.1130/g45720.1
Miao, Y., Zhang, D., Cai, X., Li, F., Jin, H., Wang, Y., et al. (2017). Holocene fire on the northeast Tibetan Plateau in relation to climate change and human activity. Quat. Int. 443, 124–131. doi:10.1016/j.quaint.2016.05.029
Millspaugh, S. H., Whitlock, C., and Bartlein, P. J. (2000). Variations in fire frequency and climate over the past 17 000 yr in central Yellowstone National Park. Geology 28 (3), 211–214. doi:10.1130/0091-7613(2000)28<211:VIFFAC>2.0.CO;2
Moritz, M. A., Morais, M. E., Summerell, L. A., Carlson, J. M., and Doyle, J. (2005). Wildfires, complexity, and highly optimized tolerance. Proc. Natl. Acad. Sci. U.S.A. 102 (50), 17912. doi:10.1073/pnas.0508985102 |
Ni, J., Yu, G., Harrison, S. P., and Prentice, I. C. (2010). Palaeovegetation in China during the late Quaternary: biome reconstructions based on a global scheme of plant functional types. Palaeogeogr. Palaeoclimatol. Palaeoecol. 289 (1), 44–61. doi:10.1016/j.palaeo.2010.02.008
Ogden, I., and Gordon, J. (1986). An alternative to exotic spore or pollen addition in quantitative microfossil studies. Can. J. Earth Sci. 23 (1), 102–106. doi:10.1139/e86-010
Patterson, W. A., Edwards, K. J., and Maguire, D. J. (1987). Microscopic charcoal as a fossil indicator of fire. Quat. Sci. Rev. 6 (1), 3–23. doi:10.1016/0277-3791(87)90012-6
Pechony, O., and Shindell, D. T. (2010). Driving forces of global wildfires over the past millennium and the forthcoming century. Proc. Natl. Acad. Sci. U.S.A. 107 (45), 19167. doi:10.1073/pnas.1003669107 |
Petit, J. R., Jouzel, J., Raynaud, D., Barkov, N. I., Barnola, J. M., Basile, I., et al. (1999). Climate and atmospheric history of the past 420,000 years from the Vostok ice core, Antarctica. Nature 399 (6735), 429–436. doi:10.1038/20859
Prospero, J. M., and Lamb, P. J. (2003). African droughts and dust transport to the Caribbean: climate change implications. Science 302 (5647), 1024–1027. doi:10.1126/science.1089915 |
Rhodes, A. N. (1998). A method for the preparation and quantification of microscopic charcoal from terrestrial and lacustrine sediment cores. Holocene 8 (1), 113–117. doi:10.1191/095968398671104653
Sankaran, M., Hanan, N. P., Scholes, R. J., Ratnam, J., Augustine, D. J., Cade, B. S., et al. (2005). Determinants of woody cover in African savannas. Nature 438 (7069), 846–849. doi:10.1038/nature04070 |
Stevenson, J., and Haberle, S. G. (2005). Macro charcoal analysis: a modified technique used by the department of archaeology and natural history. Canberra University.
Sun, X., Li, X., and Chen, H. (2000). Evidence for natural fire and climate history since 37 ka Bp in the northern part of the South China Sea. Sci. China Earth Sci. 43 (5), 487–493. doi:10.1007/BF02875310
Sun, Y., Clemens, S. C., Morrill, C., Lin, X., Wang, X., and An, Z. (2012). Influence of Atlantic meridional overturning circulation on the East Asian winter monsoon. Nat. Geosci. 5 (1), 46–49. doi:10.1038/ngeo1326
Tan, Z., Han, Y., Cao, J., Chang Huang, C., and An, Z. (2015). Holocene wildfire history and human activity from high-resolution charcoal and elemental black carbon records in the Guanzhong Basin of the Loess Plateau, China. Quat. Sci. Rev. 109, 76–87. doi:10.1016/j.quascirev.2014.11.013
Tan, Z., Huang, C. C., Pang, J., and Ding, M. (2014). Wild fire history and human landuse over Weihe River Basin since Holocene: evidence from charcoal records. J. Jilin Univ.(Earth Sci. Ed.) 44 (4), 1297–1306. doi:10.13278/j.cnki.jjuese.201404208 [in Chinese].
Thevenon, F., and Anselmetti, F. S. (2007). Charcoal and fly-ash particles from Lake Lucerne sediments (Central Switzerland) characterized by image analysis: anthropologic, stratigraphic and environmental implications. Quat. Sci. Rev. 26 (19), 2631–2643. doi:10.1016/j.quascirev.2007.05.007
Wang, X., Ding, Z., and Peng, P. a. (2012). Changes in fire regimes on the Chinese Loess Plateau since the last glacial maximum and implications for linkages to paleoclimate and past human activity. Palaeogeogr. Palaeoclimatol. Palaeoecol. 315–316, 61–74. doi:10.1016/j.palaeo.2011.11.008 |
Wang, X., Peng, P. A., and Ding, Z. L. (2005). Black carbon records in Chinese Loess Plateau over the last two glacial cycles and implications for paleofires. Palaeogeogr. Palaeoclimatol. Palaeoecol. 223 (1), 9–19. doi:10.1016/j.palaeo.2005.03.023
Wang, Y., Xu, X., and Li, F. (2003). Geologist’s concern over environmental effect of human activities—with reference to charcoal fragment analysis for the Yellow River Delta. Adv. Mar. Sci. 21 (3), 251–258. doi:10.3969/j.issn.1671-6647.2003.03.002
Wang, Z., Zhao, Y., Miao, Y., Zou, Y., and Tang, G. (2020). A study of the statistical problem of microcharcoal in loess sediments based on the pollen methodology. Arid. Land Geogr. 43 (3), 661–670. doi:10.12118/j.issn.1000-6060.2020.03.12 [in Chinese].
Whitlock, C., Higuera, P. E., McWethy, D. B., and Briles, C. E. (2010). Paleoecological perspectives on fire ecology: revisiting the fire-regime concept. Open Ecol. J. 3 (1), 6–23. doi:10.2174/1874213001003020006
Whitlock, C., and Larsen, C. (2002). Charcoal as a fire proxy. 3, 75–97. doi:10.1007/0-306-47668-1_5
Whitlock, C., Marlon, J., Briles, C., Brunelle, A., Long, C., and Bartlein, P. (2008). Long-term relations among fire, fuel, and climate in the north-western US based on lake-sediment studies. Int. J. Wildland Fire. 17 (1), 72–83. doi:10.1071/WF07025
Xiao, X., Yao, A., Hillman, A., Shen, J., and Haberle, S. G. (2020). Vegetation, climate and human impact since 20 ka in central Yunnan Province based on high-resolution pollen and charcoal records from Dianchi, southwestern China. Quat. Sci. Rev. 236, 106297. doi:10.1016/j.quascirev.2020.106297
Xue, J., Zhong, W., Li, Q., Cheng, R., You, A., Wei, Z., et al. (2018). Holocene fire history in eastern monsoonal region of China and its controls. Palaeogeogr. Palaeoclimatol. Palaeoecol. 496, 136–145. doi:10.1016/j.palaeo.2018.01.029
Yang, S., Ding, Z., Li, Y., Wang, X., Jiang, W., and Huang, X. (2015). Warming-induced northwestward migration of the East Asian monsoon rain belt from the Last Glacial Maximum to the mid-Holocene. Proc. Natl. Acad. Sci. U.S.A. 112 (43), 13178. doi:10.1073/pnas.1504688112 |
Yang, X., Jiang, W., Yang, S., Kong, Z., and Luo, Y. (2015). Vegetation and climate changes in the western Chinese Loess Plateau since the Last Glacial Maximum. Quat. Int. 372, 58–65. doi:10.1016/j.quaint.2014.06.065
Zhang, X., Zheng, Z., Huang, K., Yang, X., and Tian, L. (2020). Sensitivity of altitudinal vegetation in southwest China to changes in the Indian summer monsoon during the past 68000 years. Quat. Sci. Rev. 239, 106359. doi:10.1016/j.quascirev.2020.106359
Keywords: microcharcoal, paleofire, automatic statistics, vegetation, Late Pleistocene, loess
Citation: Zou Y, Miao Y, Yang S, Zhao Y, Wang Z, Tang G and Yang S (2021) A New Automatic Statistical Microcharcoal Analysis Method Based on Image Processing, Demonstrated in the Weiyuan Section, Northwest China. Front. Earth Sci. 9:609916. doi: 10.3389/feart.2021.609916
Received: 24 September 2020; Accepted: 08 January 2021;
Published: 23 February 2021.
Edited by:
Atsushi Tsunekawa, Tottori University, JapanCopyright © 2021 Zou, Miao, Yang, Zhao, Wang, Tang and Yang. This is an open-access article distributed under the terms of the Creative Commons Attribution License (CC BY). The use, distribution or reproduction in other forums is permitted, provided the original author(s) and the copyright owner(s) are credited and that the original publication in this journal is cited, in accordance with accepted academic practice. No use, distribution or reproduction is permitted which does not comply with these terms.
*Correspondence: Yunfa Miao, bWlhb3l1bmZhQGx6Yi5hYy5jbg==