 Myriam Kars
 Annika Greve
 Lilly Zerbst3
94% of researchers rate our articles as excellent or good
Learn more about the work of our research integrity team to safeguard the quality of each article we publish.
Find out more
ORIGINAL RESEARCH article
Front. Earth Sci., 11 March 2021
Sec. Sedimentology, Stratigraphy and Diagenesis
Volume 9 - 2021 | https://doi.org/10.3389/feart.2021.603363
This article is part of the Research TopicAdvances in Magnetism of Soils and SedimentsView all 15 articles
Authigenic ferrimagnetic iron sulfides, essentially greigite (Fe3S4), are commonly found in gas hydrate-bearing marine sediments of active accretionary prisms. Greigite is a by-product, either intracellular or extracellular, of microbial activity, and therefore provides good indication of microbial processes which are closely related to the occurrence of gas hydrate. A high-resolution rock magnetic study was conducted at Site U1518 of International Ocean Discovery Program Expedition 375, located in the frontal accretionary wedge of the Hikurangi Margin, offshore New Zealand. Samples were collected throughout the entire recovered stratigraphic sequence, from the surface to ∼492 m below seafloor (mbsf) which includes the Pāpaku fault zone. This study aims to document the rock magnetic properties and the composition of the magnetic mineral assemblage at Site U1518. Based on downhole magnetic coercivity variations, the studied interval is divided into five consecutive zones. Most of the samples have high remanent coercivity (above 50 mT) and first-order reversal curves (FORC) diagrams typical of single-domain greigite. The top of the hanging wall has intervals that display a lower remanent coercivity, similar to lower coercivities measured on samples from the fault zone and footwall. The widespread distribution of greigite at Site U1518 is linked to methane diffusion and methane hydrate which is mainly disseminated within sediments. In three footwall gas hydrate-bearing intervals, investigated at higher resolution, an improved magnetic signal, especially a stronger FORC signature, is likely related to enhanced microbial activity which favors the formation and preservation of greigite. Our findings at the Hikurangi Margin show a close linkage between greigite, methane hydrate and microbial activity.
Gas hydrate is an ice-like crystalline structure containing hydrocarbon gas (mainly methane) trapped in a water lattice. In the last decades, gas hydrate has been intensively investigated for its energy resource potential (e.g., Kvenvolden, 1993; Buffet and Archer, 2004) and its possible impact on climate change (e.g., Ruppel and Kessler, 2017; Screaton et al., 2019). Moreover, gas hydrate can play a role on slope stability in continental margins. Gas hydrate dissociation can destabilize the seafloor and be at the origin of submarine landslides (e.g., Mountjoy et al., 2014). Gas hydrate is stable within a limited range of high pressure/low temperature with high methane/gas contents (e.g., You et al., 2019) and is, therefore, mainly found in permafrost and continental margins (for instance, Cascadia Margin, offshore Oregon; Nankai Trough, offshore Japan; Chile-Peru Margin). The presence of gas hydrate is generally inferred rather than proven because it dissociates very rapidly at ambient conditions in absence of pressure cores. Various analytical approaches on cores and during drilling are indicative of gas hydrate occurrences, including logging resistivity data (Collett, 2001), heat flow and thermal anomalies with lower core temperature (Kinoshita et al., 2015), isotopic and pore water anomalies (essentially chlorinity anomalies) (Hesse, 2003), and characteristic rock magnetic variations (e.g., Housen and Musgrave, 1996; Larrasoaña et al., 2007). Previous rock magnetic studies in the Cascadia Margin (e.g., Housen and Musgrave, 1996; Musgrave et al., 2006; Larrasoaña et al., 2007), in the Nankai Trough (Kars and Kodama, 2015a; Kars and Kodama, 2015b; Shi et al., 2017), in the Bay of Bengal (Badesab et al., 2019) and offshore Taiwan (e.g., Horng, 2018) report co-occurrence of authigenic iron sulfides and gas hydrate. Authigenic ferrimagnetic greigite (Fe3S4) is commonly observed in such environments. It is closely related to microbial activity as greigite can be formed either extracellularly or intracellularly (e.g., Mann et al., 1990; Roberts and Turner, 1993; Watson et al., 2000; Bazylinski and Williams, 2006).
Tectonically uplifted sediments of the Neogene marine sedimentary sequence from the Hikurangi Margin are known to contain authigenic greigite formed from magnetite dissolution during diagenesis after sediment deposition (Rowan and Roberts, 2005, 2006). In this study, we apply rock magnetic techniques in marine sediments of the Hikurangi Margin, offshore New Zealand, cored during recent International Ocean Discovery Program (IODP) expeditions (Pecher et al., 2019; Wallace et al., 2019) to investigate the occurrence of authigenic iron sulfides associated with gas hydrate. In this paper we present and discuss the distribution of greigite in marine sediments recovered during IODP Expedition 375 (Wallace et al., 2019). This study is the first systematic study in the Hikurangi Margin that establishes a close relationship between the occurrence of authigenic greigite, methane hydrate, and microbial activity. We also discuss how overthrusting along a subduction splay fault affected the diagenetic profile.
The northern part of the Hikurangi Margin is an erosional accretionary prism located offshore the North Island in New Zealand (Figure 1A). It is formed by the subduction of the Pacific Plate beneath the Australian Plate at a rate of 4.5–5.5 cm/year (Wallace et al., 2004).
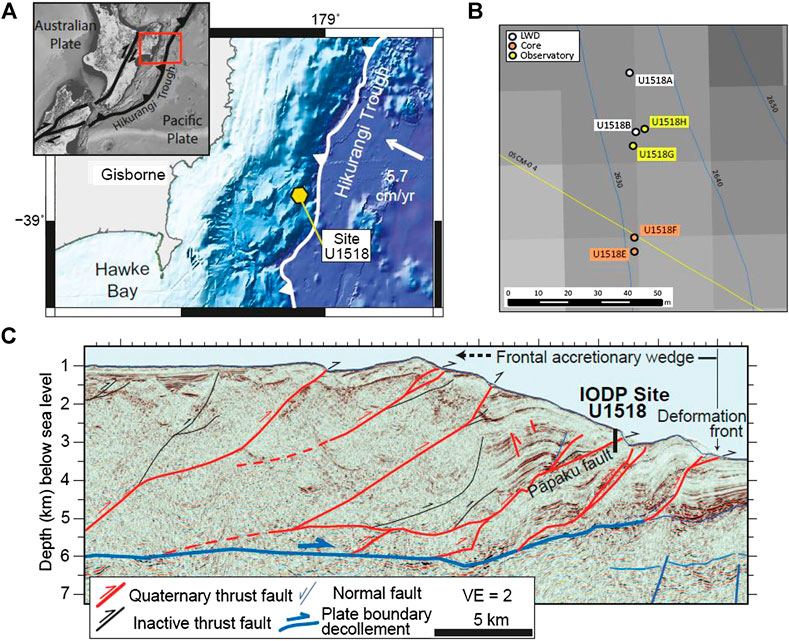
FIGURE 1. (A) Location and geotectonic setting of the Hikurangi subduction margin and the New Zealand plate boundary (inset). Displayed in the bathymetric map of the northern Hikurangi subduction margin are also the main thrust faults, IODP Site U1518 and the relative plate convergence vector (B) Detailed location map of holes drilled at Site U1518 (from Saffer et al., 2019) (C) Seismic cross section of the frontal accretionary wedge near the drilling transect of IODP Expedition 375, including interpretation after Barker et al. (2018). The location of IODP Site U1518 and trace of the Pāpaku fault are indicated. Figures (A) and (C) are modified from Fagereng et al. (2019) and Greve et al. (2020).
International Ocean Discovery Program (IODP) Expeditions 372 and 375 were undertaken to understand the mechanisms and the in situ conditions near the suggested source region of aseismic slow slip in the Hikurangi Margin. IODP Expedition 372 was mainly dedicated to collecting real-time logging-while-drilling (LWD) data (Pecher et al., 2019) and Expedition 375 to coring (Wallace et al., 2019).
Site U1518 (38°51.57S, 178°53.76’E) is located on the lower continental slope near the trench and ∼62 km from shore at ∼2630 m water depth (Saffer et al., 2019) (Figure 1C). Several holes were drilled at Site U1518 (Figure 1B). In this study, samples are from Holes U1518E and U1518F (IODP Expedition 375), and LWD data were acquired in Hole U1518B (IODP Expedition 372). Coring at Site U1518 penetrated sediments down to ∼495 m below sea floor (mbsf) and targeted the Pāpaku fault, a major frontal thrust, about 6.5 km west of the deformation front of the northern Hikurangi Margin (Saffer et al., 2019; Wallace et al., 2019). The Pāpaku fault zone was cored between 304.5 and 361.7 mbsf.
Three lithostratigraphic units were defined at Site U1518, all Quaternary in age. Sediment composition is mostly homogeneous, with silty clay(stone) as the dominant lithology alternating with thin beds of silt(stone) containing variable amounts of sand (Saffer et al., 2019). Mean sedimentation rate, based on calcareous nannofossil and planktonic foraminifer datums, has been estimated to 2.8 m/kyr in the Pleistocene. Some variability in sedimentation rate is likely related to the frequency and volume of gravity deposits (Saffer et al., 2019). Biostratigraphic observations identified an age inversion near the top of the fault zone suggesting that the majority of the fault zone interval is located within the younger footwall rock (<0.53 Ma; Saffer et al., 2019). Core observation and pore water downhole profiles indicate a well-preserved repetition of the early diagenetic sequence in the footwall, and diffusion modeling suggest recent overthrusting at ∼10–30 kya (Morgan et al., 2020, personal communication)1.
At Site U1518, an infra-red camera was used on the catwalk to image core temperature below 30 mbsf. A colder temperature indicated the dissociation of gas hydrate during depressurization in cores. Disseminated discrete gas hydrate in cores is inferred from ∼33 to ∼391 mbsf based on infra-red scanning and pore water chloride data (Holes U1518E and U1518F; Saffer et al., 2019). Small, centimeter-thick gas hydrate accumulations were identified at ∼399.5–400, ∼401.7–402.2 and ∼419.5–419.8 mbsf in three sections. The low core recovery (43%) from ∼198 to ∼495 mbsf may explain scattered observations of hydrate in cores. LWD data were recorded continuously in Hole U1518B, thus, allowing a better characterization of hydrate occurrence at Site U1518. Peaks in borehole resistivity (LWD) data suggest that methane hydrate accumulations are not continuous and occur in thin layers of concentrated hydrate (of the order of cm to 10s of cm) from ∼30 to the end of the hole at 585 mbsf. They seem to coincide mostly with coarse-grained sediments inferred from lower gamma ray counts (Cook et al., 2020). Methane hydrate is stable throughout Site U1518. The base of the gas hydrate stability zone, calculated from measured temperature, pore water salinity, and estimated pressure (Saffer et al., 2019), occurs at ∼585 mbsf (Cook et al., 2020). From LWD resistivity data in Hole U1518B, Cook et al. (2020) describe lower hydrate saturation Sh (Sh < 0.1) in parts of the hanging wall between 235 and 263 mbsf, in the fault zone, and the footwall between 455–485 mbsf. Intervals in the hanging wall (above ∼104 mbsf) were not logged for resistivity because of core gap and tool miscommunication (Wallace et al., 2019). Higher hydrate saturation (Sh > 0.2) is found in the immediate surrounding of the Pāpaku fault zone (∼304–314 mbsf and 345–370 mbsf), in the hanging wall at ∼230 mbsf and in the footwall at ∼397–418 and ∼488–498 mbsf (Cook et al., 2020). Cook et al. (2020) show that even though hydrate saturation varies with depth, it does not vary significantly between the hanging wall, fault zone and footwall.
A total of 236 samples was analyzed from working half sections of IODP Expedition 375 Site U1518 (Saffer et al., 2019). Samples in 7cc plastic sampling boxes were extracted from fine-grained lithologies (i.e., claystone) of all Lithostratigraphic Units. Our sampling strategy did not include coarse-grained lithologies. One to two samples per 1.5 m-section were collected depending on the core recovery. In three footwall intervals containing gas hydrate, namely at ∼399.5–400, ∼401.7–402.2 and ∼419.5–419.8 mbsf, samples were collected at a resolution of 5–10 cm to verify whether rock magnetic variations exist at a smaller scale where gas hydrate is present.
Paleomagnetic and rock magnetic measurements were performed at the paleomagnetic laboratory of the Center for Advanced Marine Core Research (Nankoku, Japan) and at Japan Agency for Marine Earth Science and Technology (Yokosuka, Japan). Low-field, low-frequency (0.465 kHz) magnetic susceptibility χlf was measured with a MS2B Bartington Instruments magnetic susceptibility meter (field = 250 µT). The natural remanent magnetization (NRM) and an anhysteretic remanent magnetization (ARM) were measured with a 2-G Enterprises 760R SQUID cryogenic magnetometer. ARM was imparted in a direct current (DC) bias field of 50 µT in the presence of an 80 mT peak alternating field (AF). A saturation isothermal remanent magnetization (SIRM) was subsequently imparted on the samples in the +z direction at 1.2 T by using a MMPM10 pulse magnetizer before being measured with a Natsuhara Giken spinner magnetometer. The samples were subsequently remagnetized in the −z direction with a DC field of 0.3 T and measured again to calculate the S−0.3T parameter (= [(‒IRM−0.3T)/SIRM) +1]/2; Bloemendal et al., 1992). The S−0.3T parameter provides an indication of the relative proportion of high coercivity minerals (e.g., hematite, goethite, ferrimagnetic iron sulfides) in a mixture with soft ferrimagnetic minerals (e.g., magnetite, maghemite).
Hysteresis loops with a maximum applied field of 1 T were measured on dry sediment powder at room temperature with a Princeton Measurements Corporation vibrating sample magnetometer (VSM). Saturation magnetization (Ms), saturation remanent magnetization (Mr), and coercivity (Bc) were extracted. Saturation is assumed above 70% of the maximum applied field, although this may underestimate Mr/Ms as discussed by Roberts et al. (2018) and references therein. Remanent coercivity (Bcr) was subsequently measured by backfield demagnetization of Mr. First-order reversal curves (FORCs; Pike et al., 1999; Roberts et al., 2000; Roberts et al., 2014) were measured for 60 samples selected at ∼5–10 m stratigraphic intervals, with a 1 T saturating field (averaging time: 100 ms; field increment: 2 mT; number of FORCs: 150). FORC diagrams were processed using the FORCinel software (Harrison and Feinberg, 2008) with the VARIFORC protocol of Egli (2013). First point and lower branches were subtracted.
Low-temperature magnetic measurements were made with a Quantum Design SQUID magnetic properties measurements system (MPMS) for 29 selected samples. The samples each have ∼50–120 mg mass and had been dried, ground lightly to a fine powder, and sealed in a gelatin capsule before being measured. A room temperature SIRM (RT-SIRM) was acquired at 2.5 T. A 300-10-300K cooling-warming cycle of the RT-SIRM was then measured in a zero magnetic field (trapped field inside the MPMS <20 µT). A low temperature SIRM (LT-SIRM) was imparted at 10K at 2.5 T. Samples were then warmed to room temperature in a zero magnetic field and measured (termed ZFC for zero-field-cooled). Samples were subsequently cooled to 10K in a 2.5 T magnetic field and the LT-SIRM was measured during warming to 300K (termed FC for field-cooled).
Thermomagnetic experiments in air were measured on 20 selected specimens with a Natsuhara Giken NMB-89 magnetic balance from room temperature to 700°C (with a heating rate of 10°C/min in a 0.3 T field).
NRM, ARM, magnetic susceptibility χlf and SIRM are proxies for magnetic mineral concentration. At Site U1518, NRM and ARM do not show significant variations with depth (Figure 2A). NRM and ARM average around 2.04 ± 2.01 µAm2/kg and 6.90 ± 5.08 µAm2/kg, respectively (Supplementary Table S1). ARM is sensitive to the amount of single domain (SD) magnetic particles, especially of magnetite. ARM is only three times higher than NRM, suggesting that grain size variations do not significantly affect the ARM/NRM ratio in the studied samples.
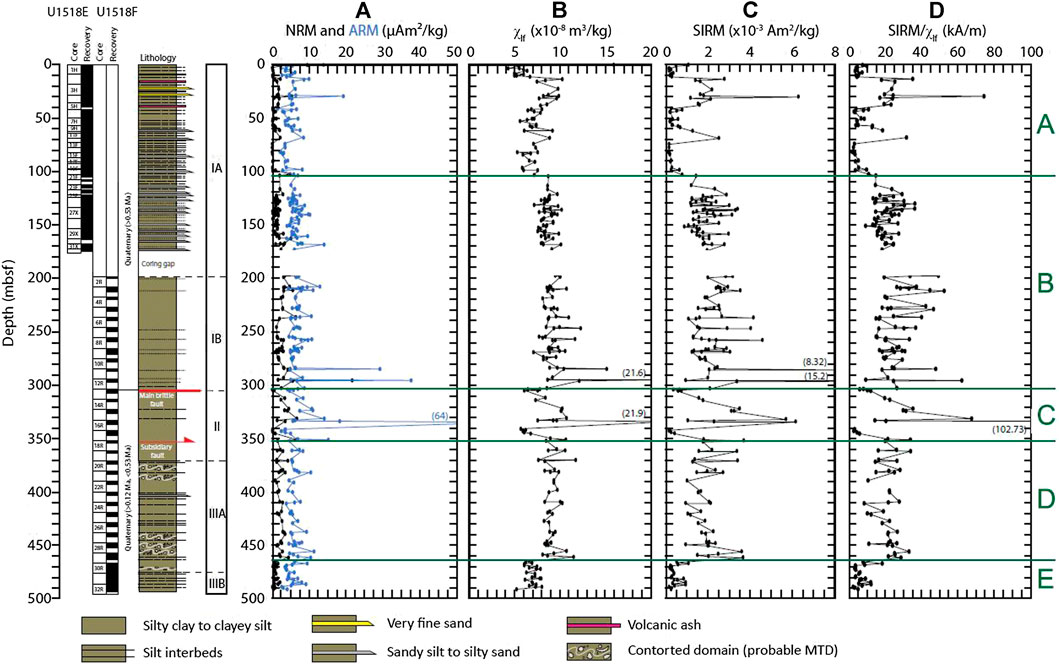
FIGURE 2. Downhole rock magnetic parameters at Site U1518 (A) Natural Remanent Magnetization (NRM) and Anhysteretic Remanent Magnetization (ARM) (B) Magnetic susceptibility χlf(C) Saturation Isothermal Remanent Magnetization (SIRM) (D) SIRM/χlf ratio. Spikes in NRM, ARM, χlf, and SIRM are likely due to coarser lithology. Zones A to E, defined from coercivity variations (see Figure 3), are indicated. Core recovery, age and lithologic description are from Wallace et al. (2019).
Magnetic susceptibility χlf and SIRM mimic each other with a similar trend to ARM (Figures 2B,C). χlf and SIRM average around 8.51 ± 1.93 × 10⁻⁸ m3/kg and 1.71 ± 1.46 × 10⁻³ Am2/kg, respectively (Supplementary Table S1). Even though care has been taken to sample homogenous fine-grained lithology (i.e., claystone), high peaks at ∼285.5, ∼296.3 and ∼335.6 mbsf may be due to coarser-grained lithology (suggesting a higher detrital input in the samples). SIRM/χlf, which is an indicator of iron sulfide concentration, mimics the variations of both SIRM and χlf (Figure 2D). The ratio averages around 18.84 ± 12.87 kA/m (Supplementary Table S1).
As defined and discussed further below in Magnetic coercivity, the studied interval can be divided in five zones from top to bottom as follows: Zone A (top to ∼104 mbsf), Zone B (from ∼104 to ∼304 mbsf), Zone C (from ∼304 to ∼352 mbsf), Zone D (from ∼352 to ∼463 mbsf), and Zone E (from ∼466 to ∼492 mbsf). In Zone A, NRM and ARM intensities alternate between higher and lower values of these parameters, while Zones B and D display higher than average values with no significant variations (Supplementary Table S1). Zone C, in between, which corresponds to the Pāpaku fault zone displays below average values in two narrow intervals (see also Greve et al., 2021). Zone E displays lower than average values (Supplementary Table S1). We propose that this zonation is caused by varying amount of ferrimagnetic minerals in the sediment. Higher (lower) values of the concentration-dependent parameters indicate higher (lower) concentration of ferrimagnetic minerals.
The ARM/χlf and ARM/SIRM ratios are commonly used as proxies for magnetic grain size (especially of magnetite) with higher (lower) values commonly indicating finer (coarser) grain size (Supplementary Figure S1). Peaks of the ARM/χlf ratio coincide with peaks in ARM. In clay-rich lithologies such as those found at Site U1518, the magnetic susceptibility χlf is usually dominated by paramagnetic minerals (Greve et al., 2020). In such a setting with an overall low concentration of ferrimagnetic minerals and low magnetic susceptibility (χlf < 10 × 10–8 m3/kg) the ARM/χlf signal does not solely reflect the effect of ferrimagnetic minerals (e.g., Lu and Banerjee, 1994; Greve et al., 2020). While ARM/χlf does not show significant variations with depth, ARM/SIRM behaves differently with marked variations. Above ∼110 mbsf, ARM/SIRM alternates between lower and higher values (Zone A). Between ∼110 and ∼460 mbsf, ARM/SIRM is low (generally below 4 × 10⁻³) except for peaks in the fault zone. Finally, below ∼460 mbsf (Zone E), the ratio is higher. The downhole ARM/SIRM variations are similar to coercivity variations as discussed below. We therefore conclude that neither ARM/χlf nor ARM/SIRM represent reliable magnetic grain size proxies at Site U1518 because of a high paramagnetic contribution and a magnetic remanence dominated by ferrimagnetic greigite as discussed further below (in Composition of the Magnetic Mineral Assemblage).
S−0.3T indicates the relative contribution of higher coercivity (antiferromagnetic) magnetic minerals (e.g., hematite) with respect to generally lower coercivity (ferrimagnetic) magnetic minerals (e.g., magnetite). S−0.3T is close to 1, except for the very top part (below 20 mbsf), the fault zone (Zone C), and in between ∼460 and 470 mbsf (Supplementary Figure S1). This suggests that antiferromagnetic minerals have a minor contribution to the global magnetic mineral assemblage.
More interestingly are the downhole variations of the hysteresis parameters (Figure 3). Mr/Ms, Bc, Bcr and DJH (DJH=(Mr/Ms)/(Bcr/Bc); Housen and Musgrave, 1996) mimic each other. Zones A to E are defined from downhole coercivity variations. Their depths are based on sample depths.
1. Zone A (from top to ∼104 mbsf): this zone has alternating low (generally Bc < 25 mT, Bcr < 50 mT) and high coercivity (generally Bc > 40 mT, Bcr > 60 mT) intervals;
2. Zone B (from ∼104 to ∼304 mbsf): this is a high coercivity zone with rather constant coercivity Bc and Bcr values averaging 51.9 ± 4.4 and 69.6 ± 3.3 mT, respectively;
3. Zone C (from ∼304 to ∼352 mbsf): this zone has alternating higher and lower coercivity values with the lower coercivity intervals in the main and subsidiary fault zones (see Greve et al., in press);
4. Zone D (from ∼352 to ∼463 mbsf): this is a zone of constant high coercivity values in the same range as in Zone B (Bc∼51.6 ± 3.9 mT and Bcr∼69.3 ± 2.5 mT);
5. Zone E (from ∼466 to ∼492 mbsf): this is an interval of low coercivity values with Bc and Bcr averaging 23.8 ± 6.4 and 51.2 ± 5.2 mT, respectively.
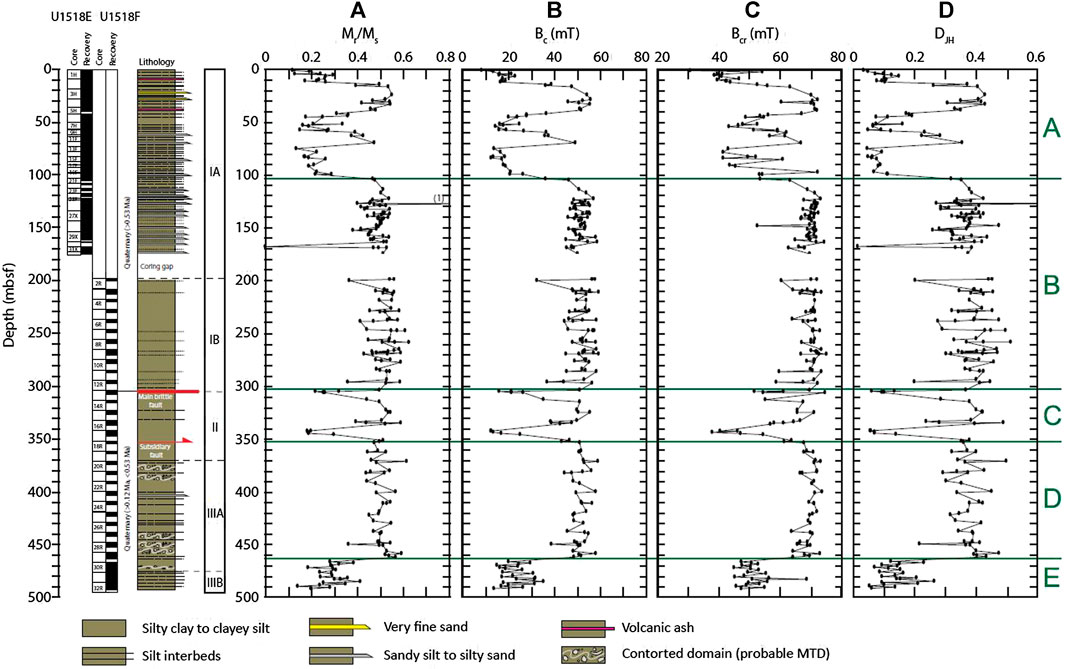
FIGURE 3. Downhole magnetic hysteresis properties at Site U1518 (A) Mr/Ms ratio (B) coercivity Bc(C) remanent coercivity Bcr(D) DJH index. Zones A to E are defined from coercivity variations. Core recovery, age and lithologic description are from Wallace et al. (2019).
DJH increases as the proportion of single domain (SD) ferrimagnetic minerals increases and is generally higher when greigite contributes a significant proportion of the ferrimagnetic population. In the lower coercivity intervals, DJH is usually <0.2 and it is higher (>0.3) in the higher coercivity intervals (Figure 3D).
Saffer et al. (2019) noticed acquisition of gyroremanent magnetization (GRM) upon static alternating field (AF) demagnetization treatment of shipboard samples. GRM usually indicates the presence of greigite (e.g., Snowball, 1997). We conducted static AF demagnetization on the samples collected from the gas hydrate-bearing footwall sections (namely in the intervals ∼399.5–400, ∼401.7–402.2, and ∼419.5–419.8 mbsf). Except for two samples, all studied samples grow a GRM during static AF demagnetization (Supplementary Table S2). The parameter ΔGRM/ΔNRM (= [(NRM80mT–NRMmin)/(NRMinitial–NRMmin)], where NRMmin is the minimum remanence measured (Fu et al., 2008) displays values above 0.5 (Supplementary Table S2). Such high values are generally encountered in greigite-rich layers (e.g., Fu et al., 2008). For all these samples, Bcr is higher than 55 mT and DJH averages ∼0.35 (Supplementary Figure S3; Supplementary Table S2), which is similar to other samples from Zone D.
FORC diagrams (Figure 4A), thermomagnetic curves (Figure 4B) and low temperature magnetic measurements (Figures 4C,D) aim to characterize the magnetic mineral assemblages in low(er) and high(er) coercivity intervals, respectively. Rock magnetic measurements carried out on samples from the fault zone (i.e., Zone C) are presented and discussed in Greve et al. (2021) and are not further detailed in this manuscript.
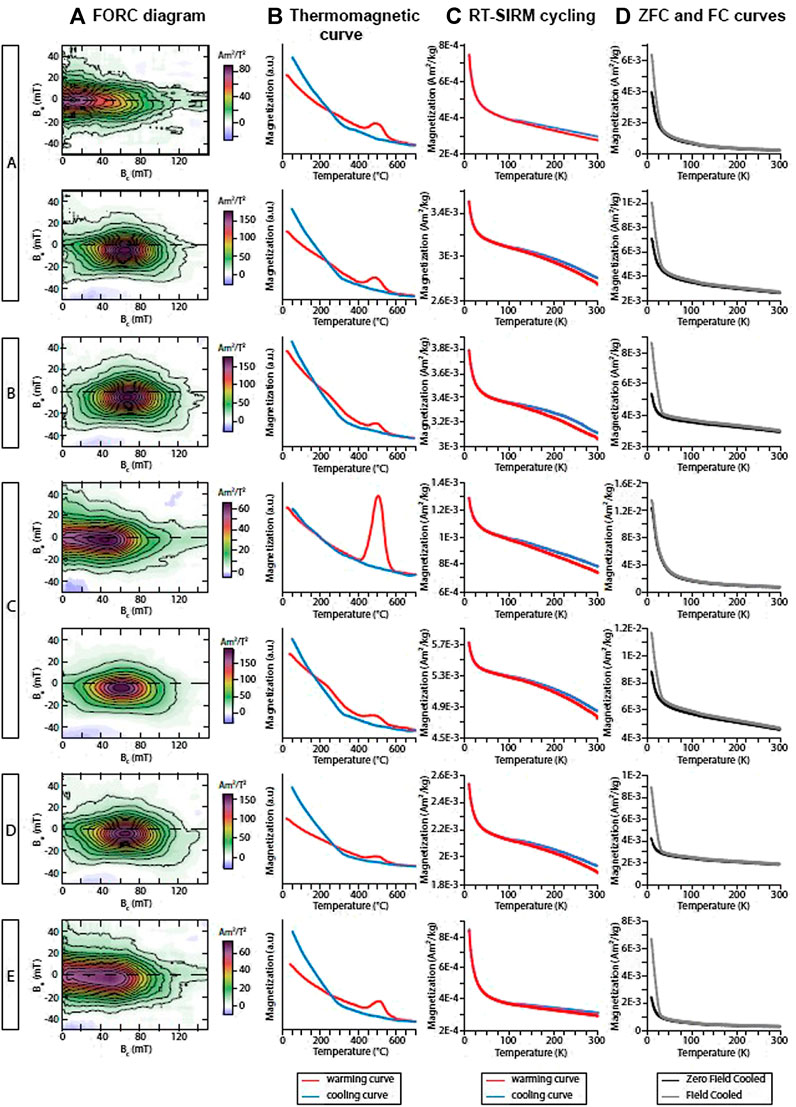
FIGURE 4. Representative rock magnetic measurements for samples of the different coercivity zones (shown on the left) (A) FORC diagram (B) Thermomagnetic curve (C) RT-SIRM cycling and (D) Zero Field Cooled (ZFC) and Field Cooled (FC) curves. Selected samples are from top to bottom: U1518E-7H-5W, 13–15 cm (depth = 52.54 mbsf), U1518E-12F-2W, 22–24 cm (depth = 68.75 mbsf), U1518F-2R-1W, 44–46 cm (depth = 198.14 mbsf), U1518F-13R-2W, 99–101 cm (depth = 305.52 mbsf), U1518F-15R-2W, 67–69 cm (depth = 324.29 mbsf), U1518F-29R-3W, 6–8 cm (depth = 459.48 mbsf) and U1518F-32R-6W, 2–4 cm (depth = 490.57 mbsf). Samples from Coercivity Zone C are discussed in Greve et al. (2021).
Site U1518 samples can be divided into two groups based on their FORC diagrams. The first group represents most of the samples and the FORC diagrams display closed concentric contours with a mean coercivity Bc generally above 50 mT and interaction between grains (for instance, samples from Zones B and D, Figure 4A). The FORC diagrams for three gas hydrate-bearing footwall sections (Supplementary Figure S3) have smoother contours with a better defined shape than the FORC diagrams on Figure 4. This is due to a stronger magnetization and remanence of the samples. This FORC signature has been previously reported in Greve et al. (2020) and Greve et al. (2021) at Site U1518, and was attributed to SD greigite (e.g., Roberts et al., 2006). Although this FORC diagram signature is not unique to SD greigite, similar FORC diagrams were reported in other gas hydrate-bearing environments whose signature corresponds to greigite (e.g., Kars and Kodama, 2015a; Kars and Kodama, 2015b; Shi et al., 2017; Larrasoaña et al., 2007). The second group of samples shows a mixture of SD greigite with a lower coercivity magnetic phase (generally with a coercivity Bc below 20 mT). For this group, contours are open on the Bu axis indicating a coarser phase, likely in the vortex state (for instance, samples from Zones A (upper panel) and E, Figure 4A) (e.g., Roberts et al., 2000; Muxworthy and Dunlop, 2002). This additional phase is likely (titano)-magnetite, as indicated by thermomagnetic and low temperature magnetic measurements presented below.
Thermomagnetic curves on selected samples from the different magnetic zones are similar (Figure 4B). Magnetization upon warming decreases up to a peak temperature of ∼420°C, from where it starts to increase until reaching a maximum at ∼490°C and then decreases up to a temperature of 700°C. This magnetic behavior at temperatures higher than 400°C has been attributed to the oxidation of paramagnetic pyrite (FeS2) into ferrimagnetic magnetite during heating (e.g., Passier et al., 2001). Some samples additionally display a change-in-slope at ∼320°C, typically for the presence of greigite (see for example, samples from Zones B and C (lower panel), Figure 4B). Cooling and warming curves are not reversible, indicating modifications of the magnetic mineral assemblage during heating. This feature is common at Site U1518 (Greve et al., 2021).
Low temperature magnetic measurements do not significantly differ between samples from the different zones (Figures 4C,D). RT-SIRM curve on cooling (Figure 4C) shows a slight decrease of magnetization at ∼110–120 K, which is comparable to the temperature TV of the Verwey transition of magnetite (TV∼120 K) (e.g., Muxworthy and McClelland, 2000; Özdemir et al., 2002). Cooling and warming curves are not reversible through TV, suggesting coarse-grained (Ti)-magnetite (e.g., Özdemir et al., 2002). The Verwey transition is barely seen on the ZFC and FC curves (Figure 4D). Their first derivatives do not display evidence for any additional magnetic phase. Greigite does not have any low temperature magnetic transition (Chang et al., 2009; Roberts et al., 2011). Nevertheless, some key observations can be made. Samples from intervals for which the FORC signature indicates absence of greigite (i.e., Zones A and E, Figure 4A) display a significantly more marked decrease in SIRM intensity between 10 and 30 K than those from greigite-bearing intervals (Figure 4D). The decrease (Supplementary Figure S2A) is generally more than 50% for no greigite-bearing samples. Such a decrease suggests the presence of superparamagnetic (SP) grains (e.g., Passier and Dekkers, 2002) whose nature cannot be determined from the rock magnetic dataset presented in this manuscript.
The ratio of the remanence measured at 10 K between FC and ZFC, MFC/MZFC (Supplementary Figure S2B), is generally higher than 1.4, suggesting the presence of SD-sized grains (Smirnov, 2009). High values of MFC/MZFC generally occur in samples for which FORC diagrams indicate the presence of greigite. The loss in magnetization M for ZFC and FC curves during warming through the magnetite Verwey transition is calculated by using the parameter δ of Moskowitz et al. (1993) (δ = (M80K-M150K)/M80K). The ratio δFC:δZFC is close to 1:1 for samples from all zones (Supplementary Figure S2C). Higher δFC and δZFC (>0.2) are found in Zones A, C and E, whereas lower δFC and δZFC (<0.2) are found in Zones B and D, with a few exceptions. This distribution could reflect a difference in concentration and/or grain size distribution of (titano)-magnetite particles (Moskowitz et al., 1993) with higher values reflecting higher concentration and/or the presence of coarser (titano)-magnetite grains in Zones A, C, and E. Low values of δFC and δZFC (<0.2) in samples containing ferrimagnetic iron sulfides have been previously reported in gas hydrate-bearing sediments of the Nankai Trough (Kars and Kodama, 2015a; Kars and Kodama, 2015b).
Site U1518 in the Hikurangi Margin is another example where low temperature magnetic measurement indirectly infer the presence of greigite. However, in this study, FORC diagrams are the best discriminatory technique to identify greigite in the samples.
The rock magnetic results presented above show a widespread occurrence of SD greigite in the studied sediments of Site U1518. This mineral is identified in the high coercivity intervals (Bcr > 50 mT) (Figure 3), whereas (titano)-magnetite is the main magnetic phase in the intervals with lower coercivity. Greigite forms via biogeochemical processes in the sedimentary column and is highly sensitive to changes in redox state. Especially, higher reactive iron contents and lower dissolved sulfide favor the formation and preservation of greigite (Kao et al., 2004). In the following sections we discuss how the distribution of greigite within the sequence of a young, active accretionary system provides insights into the interplay between fluid flow, gas hydrate accumulation and dissipation, and microbial activity.
A high value of SIRM/χlf has frequently been used as proxy for greigite-bearing intervals in marine sediments (e.g., Snowball, 1991). Larrasoaña et al. (2007) suggested that samples which contain iron sulfides typically display SIRM/χlf values higher than 15 kA/m. Based on SIRM/χlf (Figure 2D), Bcr (Figure 3C), and FORC diagrams (Figure 4A and Supplementary Figure S3), we define intervals that have concomitant rock magnetic properties characteristic of greigite-bearing sediment. Figure 5 displays both greigite-bearing intervals and gas hydrate occurrence (Wallace et al., 2019; Cook et al., 2020). Greigite is quasi-ubiquitous at Site U1518 and present in sediments with discrete (disseminated) occurrence of gas hydrate. Similar findings were previously reported, for instance, in gas hydrate-bearing sediments of the Cascadia Margin (e.g., Housen and Musgrave, 1996; Larrasoaña et al., 2006) and of the Nankai Trough (Kars and Kodama, 2015a; Kars and Kodama, 2015b; Shi et al., 2017).
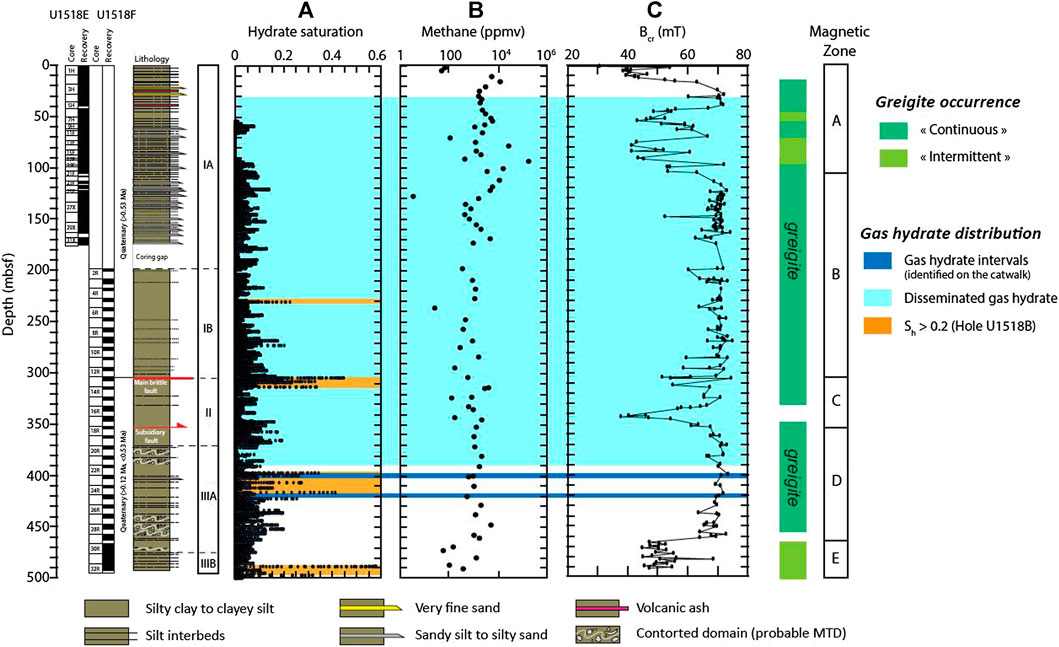
FIGURE 5. Distribution of gas hydrate at Site U1518 based on shipboard observations (Wallace et al., 2019) (A) Hydrate saturation calculated from LWD resistivity data (Cook et al., 2020). Here a value of n = 2.5 for hydrate saturation calculation with Archie’s equation has been used (Cook and Waite, 2018) (B) Shipboard methane contents (C) Remanent coercivity Bcr. Occurrence of greigite (dark green: continuous, light green: intermittent) from rock magnetic measurements is reported on the right with the coercivity zones defined in this study. The light blue shaded zone corresponds to disseminated gas hydrate and the dark blue shaded zones correspond to three gas hydrate-bearing sections identified aboard on the catwalk. The orange shaded zones correspond to intervals in Hole U1518B where hydrate saturation Sh calculated from LWD resistivity data exceeds 0.2 (Cook et al., 2020). Core recovery, age and lithologic description are from Wallace et al. (2019).
In Zone E and in some intervals of Zones A and C, lower values of SIRM (Figure 2C) and coercivity suggest lower contents or absence of greigite. We distinguish between “continuous” and “intermittent” occurrence of greigite. “Continuous” refers to depths with consecutive samples spanning a long interval where greigite is identified. “Intermittent” refers to intervals which contain some samples that do not have evidence for greigite. Continuous greigite occurrence is observed in Zones B and D, whereas intermittence is observed in Zones A and E. Zone C, corresponding to the Pāpaku fault zone, encompasses two narrow intervals in which greigite does not seem to be present (see Greve et al., 2021).
If we assume that SIRM is mostly carried by SD greigite, then this parameter reflects variations in the greigite concentration with depth. Higher values of SIRM suggest higher greigite contents. Quantification of greigite contents based on rock magnetic proxies is notoriously difficult because the remanence intensity is affected by magnetic grain size. Moreover, the saturation remanence (Ms) of greigite is still as of today undefined (Chang et al., 2008). Values range from as low as 3 Am2/kg (Dekkers and Schoonen, 1996) to ∼70 Am2/kg (Li et al., 2014). Consequently, in the following discussion variations in greigite contents are expressed relatively to adjacent intervals and to the downhole trend.
Greve et al. (2021) conducted secondary and backscattered electron imaging on samples from low coercivity zones of the Pāpaku fault zone (Zone C). They identified an increase in the number of, size of framboids and signs of secondary pyritization. Different generations of pyrite (Greve et al., 2021) indicate that pyrite formation occurred during later diagenetic stages, perhaps related to further pyritization of authigenic greigite. By extrapolating this observation to other lower coercivity intervals, and by looking at similarities in rock magnetic parameters (for instance, DJH, χlf, SIRM), we tentatively assume that pyrite is more abundant in the lower coercivity intervals in Zones A (in the hanging wall) and E (in the footwall) and that several generations of pyrite (with possible later reduction of greigite) exist. This assumption is supported by lower values of the remanence (e.g., SIRM) and χlf (Figure 2) that indicate lower contents of ferrimagnetic minerals (including iron oxides).
There are two major possible explanations for the absence of greigite: (i) it was never preserved because biogeochemical conditions favored complete pyritization at the sulfate-methane transition zone (SMTZ) during burial (e.g., Schoonen, 2004), or (ii) greigite was formed during early/syn-sedimentary diagenesis and later reduced to pyrite when environmental conditions changed. Secondary diagenesis to pyrite may for example be caused by advective or diffusive transport of fluids and methane through the sediment (e.g., Musgrave et al., 2019). The high sedimentation rate at this active margin probably resulted in a rapid burial beneath the SMTZ during initial deposition which would have prevented complete pyritization and enabled the preservation of greigite. This would invalidate the first explanation.
A striking observation is that greigite is intermittent or absent in sediment with lower resistivity and hydrate saturation, such as in the ∼460–485 mbsf depth interval (Cook et al., 2020; Figure 5). Exceptional is the low hydrate saturation interval (Sh < 0.1) between 235 and 263 mbsf identified by Cook et al. (2020) which does not correspond to a depth interval with no greigite (Figure 5), instead it corresponds to a high coercivity interval with SD greigite in Hole U1518F. This discrepancy is likely explained by the fact that hydrate saturation calculated from LWD resistivity data is from Hole U1518B (Cook et al., 2020) located ∼50 m to the north of Holes U1518E and U1518F (this study, Figure 1B). If we assume that greigite indicates presence of gas hydrate and methane diffusion, this discrepancy suggests discontinuous and patchy gas hydrate distribution in the frontal accretionary wedge of the Hikurangi Margin. In the following, we discuss how greigite is possibly linked to methane hydrate saturation.
Dissociation of methane hydrate may be one process responsible for later pyritization of authigenic greigite (e.g., Kars and Kodama, 2015a). When hydrate dissociates, released methane diffuses mostly upward. Subsequently, when conditions in pressure, temperature, methane concentration and solubility are met, it forms new hydrate. Methane diffusion is widespread at Site U1518 (Cook et al., 2020) and new hydrate formation is controlled by the hydraulic permeability, which is a function of sediment grain size and sorting. At Site U1518, methane hydrate is mostly found in coarse-grained lithology, i.e., sand and silt, in cm to 10s of cm-thick layers (Cook et al., 2020). While methane hydrate preferentially forms in coarse-grained lithology (silt- or sandstone), the slow diffusion of methane through surrounding and clay-rich layers may be used by microorganisms for in situ formation of iron sulfides. When hydrates dissociate, the sudden release and accumulation of methane in porous intervals (below a less porous interval acting as a seal) would result in the secondary diagenesis of existing greigite to pyrite (e.g., Kars et al., 2018; Musgrave et al., 2019). The higher coercivity intervals in Zones A, B and D (Figure 3), which are also characterized by higher SIRM/χlf values (Figure 2D) indicate the preservation of diagenetic greigite, which formed at the SMTZ during sediment deposition and possibly at a later diagenetic stage due to enhanced microbial activity (see Greigite as Indicator for Enhanced Microbial Activity).
Wallace et al. (2019) have identified an age inversion at ∼304.5 mbsf that coincides with the top of the Pāpaku fault zone. The diagenetic sequence of the hanging wall (>0.53 Ma) based on lithostratigraphy, structural geology and pore water analysis is repeated below the Pāpaku fault zone in the footwall (<0.53 Ma). This has led Morgan et al. (personal communication) to suggest recent underthrusting and active displacement along the thrust fault.
In Figures 2,3 concentration and composition of magnetic minerals above the Pāpaku fault zone in Zone B (∼104–304 mbsf, i.e., lower half of Lithostratigraphic Unit IA, and Unit IB) are similar to those of below the fault zone in Zone D (∼352–463 mbsf, i.e., Lithostratigraphic Unit IIA). Likewise, rock magnetic properties between ∼466 and 492 mbsf (Zone E, i.e., very bottom of Lithostratigraphic Subunit IIIA, and Subunit IIIB), display lower values of the concentration-dependent parameters, and a lower coercivity. This signal resembles the weaker signal in the top part of the sediments in Zone A (i.e., upper half of Subunit IA). Comparable FORC diagram signature has been measured between Zones A and E, and B and D, respectively (Figure 4). These observations are in agreement with a repetition of the diagenetic sequence observed by Wallace et al. (2019) based on pore water analyses.
Low coercivity intervals in Zone A where greigite is not identified may be the result of completed pyritization at the SMTZ. By contrast, higher coercivity intervals would have been quickly buried below the SMTZ, favoring the preservation of greigite. At the drill site, sedimentation rate is varying through time with turbidite deposits increasing the sedimentation rate in a limited period (Wallace et al., 2019). A less prolonged time at, and a quick burial below the SMTZ would therefore favor the preservation of intermediary greigite. Consequently (early diagenetic) greigite formation predated any thrusting, because greigite occurs in the hanging wall (older) and the footwall (younger).
Zone D is a remaining interval currently in the footwall of shallower rocks (which are now eroded in the hanging wall). In Zone D, greigite, formed at much shallower depth at the SMTZ, has been preserved until present, likely at the favor of limited and transient fluid flow in the footwall (Cook et al., 2020; Fagereng et al., 2019; Greve et al., 2021). The magnetic mineral assemblage of Zone D which contains greigite would therefore correspond to the early diagenetic sequence, formerly present in the hanging wall, in the footwall. The absence of greigite in Zone E might be explained by either complete pyritization at the SMTZ or further reduction of greigite into pyrite, likely because of hydrate dissociation due to the proximity of this interval to the base of methane hydrate stability (at ∼585 mbsf; Cook et al., 2020).
Many formation pathways have been proposed for greigite. These pathways include early formation from pyrite precursors (e.g., Schoonen, 2004) and later diagenetic processes such as greigite growth on surface of pre-existing mineral phases (e.g., Roberts and Weaver, 2005). The reader is referred to Roberts (2015) for a review of these processes. In anoxic, sulfidic marine sediment, dissolved sulfide necessary for iron sulfide formation is produced by organo-clastic sulfate reduction (degradation of organic matter; Berner, 1981) and by anaerobic oxidation of methane (AOM) (e.g., Knittel and Boetius, 2009) performed by sulfate reducing bacteria (SRB) and a consortium of SRB and methanotrophic archaea (e.g., Knittel et al., 2003), respectively. This happens at the sulfate-methane transition zone (SMTZ). Dissolved sulfide further reacts with dissolved iron to form iron sulfides (e.g., Schoonen, 2004). Under specific anoxic and sulfidic conditions (e.g., Neretin et al., 2004), greigite can be preserved below the SMTZ. Changes in organic carbon input and sedimentation rate are amongst the most common factors controlling the formation of iron sulfides (e.g., Kasten et al., 1998).
At Site U1518, the SMTZ is located at ∼8 mbsf where sulfate concentration drops to 0 mM and remains at this value to the bottom of the hole (Saffer et al., 2019). Elevated methane flux responsible for the shallow occurrence of methane hydrate and SMTZ infers low dissolved sulfide contents at the SMTZ (Wallace et al., 2019). Lower dissolved sulfide contents, thus, might arrest the pyritization process and favor the preservation of greigite (e.g., Kao et al., 2004).
Authigenic greigite is the main magnetic carrier in our samples, except for weakly magnetized intervals where pyrite and iron oxides are present in Zones A, C and E (Figure 5). As greigite is mainly formed as a by-product of microbial processes, it is assumed that microbial activity is playing an important role on greigite formation and preservation at Site U1518.
Microbiological studies, conducted in marine sediments of the Cascadia Margin (e.g., Cragg et al., 1996) and of the Nankai Trough (e.g., Reed et al., 2002; Inagaki et al., 2006), have shown that the total number of microorganisms increases in hydrate zones, compared to adjacent sediments. Moreover, Inagaki et al. (2006) have found that the microbial community composition is different in hydrate-bearing sediments relative to hydrate-free intervals. A strong interplay thus exists between hydrate and microbial activity (e.g., Cragg et al., 1996; Katayama et al., 2016). Microbial processes and community distributions, influenced by gas hydrate and gas and fluid venting, are thus key factors for understanding biogeochemical processes related to the occurrence of biogenic gas hydrate. Microbial communities identified at cold seeps in the Hikurangi Margin are similar to those identified in cold seeps worldwide, with dominant anaerobic methanotrophic archaea (ANME) and proteobacteria (Ruff et al., 2013). ANME are the principal microorganisms involved in the AOM reaction (e.g., Knittel and Boetius, 2009) with production of dissolved sulfide in the pore water needed for iron sulfide formation.
Findings on the interplay between hydrate and microbial activity in the Cascadia Margin and the Nankai Trough suggest that a similar relationship exists in the Hikurangi Margin. Cook et al. (2020) posit that unconnected low to moderate hydrate saturation at Site U1518 implies that the source of methane in the hydrate is by local diffusion of microbially generated methane within the hydrate stability zone. At our knowledge, there is currently no microbiology study conducted at Site U1518 to characterize the microbial communities present in the sediment.
In intervals with higher DJH (Figure 3D), SIRM/χlf (Figure 2D) and a stronger FORC signature indicating the prevalence of SD greigite (Figure 4A, Supplementary Figure S3), the production of greigite may be increased compared to other intervals with lower values where greigite is identified. Localized and limited dissolved sulfide, likely produced in situ by AOM, favors in situ formation and preservation of greigite by microbial activity. Higher values of concentration-dependent magnetic parameters (e.g., DJH) might therefore indicate enhanced microbial activity (perhaps with an increased number of microorganisms) in gas hydrate intervals at Site U1518. The vertical distribution of authigenic greigite may be a good indicator of methane hydrate within sediment, and of microbial communities at the origin of biogenic hydrate formation.
Gas hydrate has been widely identified in accretionary prisms around the world (e.g., Kvenvolden, 1993). The Cascadia Margin, offshore Oregon, and the Nankai Trough, offshore Japan, have been widely studied for decades by ocean scientific drilling and several rock magnetic studies have been conducted to elucidate any relationship between gas hydrate and magnetic mineralogy.
Larrasoaña et al. (2007) proposed the use of a bivariate plot, χlf as a function of SIRM/χlf, to identify, at first approximation, the magnetic mineral assemblage composing marine sediments. Given ranges of SIRM/χlf values would indicate the relative dominance of ferrimagnetic iron sulfides in the mineral assemblage. Supplementary Figure S4 is a comparison of our dataset with data from the Cascadia Margin (Housen and Musgrave, 1996; Larrasoaña et al., 2006) and Nankai Trough (Kars and Kodama, 2015a; Kars and Kodama, 2015b, unpublished). Site U1518 samples have relatively low magnetic susceptibility, similar to values obtained in the Nankai Trough. SIRM/χlf for Site U1518 varies between ∼1.34 and 102.73 kA/m. Most samples have SIRM/χlf > 15 kA/m, which suggests, according to Larrasoaña et al. (2007), a magnetic mineral assemblage dominated by authigenic iron sulfides, as shown in our study.
The FORC diagrams measured in our study (Figure 4A; Supplementary Figure S3) are typical of FORC diagrams measured in the Cascadia Margin (Larrasoaña et al., 2007) and in the Nankai Trough (Kars and Kodama, 2015a; Kars and Kodama, 2015b; Shi et al., 2017), indicating occurrence of SD greigite in hydrate-bearing sediments. The Hikurangi Margin is, thus, an additional example of accretionary prism with co-occurrence of authigenic iron sulfides (mostly greigite) and gas hydrate. From this observation, one can expect that SD greigite would be more commonly identified in accretionary prisms and continental margins where gas hydrate occurs.
Marine sediments of Site U1518 can be divided into five consecutive intervals showing variations in magnetic properties, especially coercivity. Most of the samples have a high remanent coercivity Bcr, above 50 mT, and a FORC diagram signature typical of single domain greigite. Authigenic greigite is observed throughout the entire stratigraphic sequence, which was cored entirely in the gas hydrate stability zone. Lower coercivity zones are found at the top of the hanging wall and in the footwall below the Pāpaku fault zone, likely because of the repetition of the early diagenetic sequence in the footwall. Coercivity variations within the Pāpaku fault zone are discussed in Greve et al. (2021). This study is the first systematic study in the Hikurangi Margin establishing a close relationship between authigenic greigite and gas hydrate. Low hydrate saturation level seems to correspond to depth intervals where greigite is in lower concentration or absent. Greigite is found in sediments where hydrate saturation is higher. A higher greigite concentration may suggest an enhanced microbial activity in methane hydrate-bearing sediments. Further studies in gas hydrate environment combining rock magnetism and microbiology are necessary to elucidate greigite formation in this environment.
The original contributions presented in this study are available at https://www.pangaea.de. Shipboard data are available from the IODP database here: http://web.iodp.tamu.edu/LORE/.
MK conceived the study and performed rock magnetic measurements. AG collected the samples and performed paleomagnetic measurements. LZ assisted with early magnetic analyses during tenure of an undergraduate scholarship. MK and AG contributed to the interpretation and discussion of the data. All authors contributed to and approved the final manuscript.
AG acknowledges funding through NWO Deep NL grant 2018.040, the Korea Institute of Energy Technology Evaluation and Planning (KETEP) and the Ministry of Trade, Industry & Energy (MOTIE) of the Republic of Korea (No. 20168510030830). LZ assisted with early magnetic analyses during tenure of an undergraduate scholarship under the framework of the RISE worldwide program of the German Academic Exchange Service (DAAD).
The authors declare that the research was conducted in the absence of any commercial or financial relationships that could be construed as a potential conflict of interest.
This study used samples and data provided by the International Ocean Discovery Program (IODP). We thank the science party and technical staff that assisted with the acquisition of samples, data and contributed to scientific discussions, and crew of IODP Expedition 375. Shipboard data are available from the IODP database (http://web.iodp.tamu.edu/LORE/) and the Expedition 375 Proceedings are available at http://publications.iodp.org/proceedings/372B_375/372B375title.html. We are grateful to Ann Cook for sharing with us her hydrate saturation calculation. Rock magnetic data presented in the paper are available at https://www.pangaea.de. AG acknowledges funding through NWO Deep NL grant 2018.040, the Korea Institute of Energy Technology Evaluation and Planning (KETEP) and the Ministry of Trade, Industry & Energy (MOTIE) of the Republic of Korea (No. 20168510030830). LZ assisted with early magnetic analyses during tenure of an undergraduate scholarship under the framework of the RISE worldwide program of the German Academic Exchange Service (DAAD).
The Supplementary Material for this article can be found online at: https://www.frontiersin.org/articles/10.3389/feart.2021.603363/full#supplementary-material.
1Morgan, J. K., Solomon, E. A., Fagereng, A., Savage, H., Wang, M., Meneghini, F., et al. (personal communication). Seafloor overthrusting at the Hikurangi margin: ductile fault deformation, fluid pressures, and implications for plate boundary processes. Abstracts, IODP expeditions 372 & 375 science meeting: creeping gas hydrate slides and Hikurangi subduction margin. Napier, New Zealand.
Badesab, F., Dewangan, P., Gaikwad, V., Kars, M., Kocherla, M., Krishna, K. S., et al. (2019). Magnetic mineralogical approach for the exploration of gas hydrates in the Bay of Bengal. J. Geophys. Res. Solid Earth 124, 4428–4451. doi:10.1029/2019JB017466
Barker, D. H. N., Henrys, S., Caratori Tontini, F., Barnes, P. M., Bassett, D., Todd, E., et al. (2018). Geophysical constraints on the relationship between seamount subduction, slow slip, and tremor at the North Hikurangi Subduction Zone, New Zealand. Geophys. Res. Lett. 45 (23), 12804–12813. doi:10.1029/2018gl080259
Bazylinski, D. A., and Williams, T. J. (2006). “Ecophysiology of magnetotactic bacteria,” in Magnetoreception and magnetosomes in bacteria, Microbiology Monographs, Editor D. Schüler 3, 37–75. doi:10.1007/7171_038
Berner, R. A. (1981). A new geochemical classification of sedimentary environments. J. Sediment. Petrology 51, 359–365. 10.1306/212F7C7F-2B24-11D7-8648000102C1865D
Bloemendal, J., King, J. W., Hall, F. R., and Doh, S.-J. (1992). Rock magnetism of Late Neogene and Pleistocene deep-sea sediments: relationship to sediment sources, diagenetic processes and sediment lithology. J. Geophys. Res. 97 (B4), 4361–4375. doi:10.1029/91JB03068
Buffet, B., and Archer, D. (2004). Global inventory of methane clathrate: sensitivity to changes in the deep ocean. Earth and Planet. Sci. Lett. 227, 185–199. doi:10.1016/j.epsl.2004.09.005
Chang, L., Roberts, A. P., Rowan, C. J., Tang, Y., Pruner, P., Chen, Q., et al. (2009). Low-temperature magnetic properties of greigite (Fe3S4). Geochem. Geophys. Geosystems 10, Q01Y04. doi:10.1029/2008GC002276
Chang, L., Roberts, A. P., Tang, Y., Rainford, B. D., Muxworthy, A. R., and Chen, Q. (2008). Fundamental magnetic parameters from pure synthetic greigite (Fe3S4). J. Geophys. Res. 113, B06104. doi:10.1029/2007JB005502
Collett, T. S. (2001). “A review of well-log analysis techniques used to assess gas-hydrate bearing reservoirs,” in Natural gas hydrates: occurrence, distribution and detection, Geophysical Monograph Series, Editors C. K. Paull, and W. P. Dillon 124, 189–210. doi:10.1029/GM124p0189
Cook, A. E., Paganoni, M., Clennell, M. B., McNamara, D. D., Nole, M., Wang, X., et al. (2020). Physical properties and gas hydrate at a near-seafloor thrust fault, Hikurangi Margin, New Zealand. Geophys. Res. Lett. 47, e2020GL088474. doi:10.1029/2020GL088474
Cook, A. E., and Waite, W. F. (2018). Archie’s saturation exponent for natural gas hydrate in coarse-grained reservoirs. J. Geophys. Res. – Solid Earth 123, 2069–2089. doi:10.1002/2017JB015138
Cragg, B. A., Parkes, R. J., Fry, J. C., Weightman, A. J., Rochelle, P. A., and Maxwell, J. R. (1996). Bacterial populations and processes in sediments containing gas hydrates (ODP leg 146: Cascadia Margin). Earth and Planet. Sci. Lett. 139, 497–507. doi:10.1016/0012-821X(95)00246-9
Dekkers, M. J., and Schoonen, M. A. A. (1996). Magnetic properties of hydrothermally synthesized greigite (Fe3S4) – I. Rock magnetic parameters at room temperature. Geophys. J. Int. 126, 360–368. doi:10.1111/j.1365-246X.1996.tb05296.x
Egli, R. (2013). VARIFORC: an optimized protocol for calculating non-regular first-order reversal curve (FORC) diagrams. Glob. and Planet. Change 110, 302–320. doi:10.1016/j.gloplacha.2013.08.003
Fagereng, Å., Savage, H. M., Morgan, J. K., Wang, M., Meneghini, F., Barnes, P. M., et al. (2019). Mixed deformation styles observed on a shallow subduction thrust, Hikurangi margin, New Zealand. Geology 47, 872–876. doi:10.1130/G46367.1
Fu, Y., von Dobeneck, T., Franke, C., Heslop, D., and Kasten, S. (2008). Rock magnetic identification and geochemical process models of greigite formation in Quaternary marine sediments from the Gulf of Mexico (IODP Hole U1319A). Earth and Planet. Sci. Lett. 275, 233–245. doi:10.1016/j.epsl.2008.07.034
Greve, A., Kars, M., and Dekkers, M. J. (2021). Fluid accumulation, migration and anaerobic oxidation of methane along a major splay fault at the Hikurangi subduction margin (New Zealand): A magnetic approach. J. Geophy. Res. Solid Earth 126, e2020JB020671. doi:10.1029/2020JB020671
Greve, A., Kars, M., Zerbst, L., Stipp, M., and Hashimoto, Y. (2020). Strain partitioning across a subduction thrust fault near the deformation front of the Hikurangi subduction margin, New Zealand: a magnetic fabric study on IODP Expedition 375 Site U1518. Earth and Planet. Sci. Lett. 542, 116322. doi:10.1016/j.epsl.2020.116322
Harrison, R. J., and Feinberg, J. (2008). FORCInel: an improved algorithm for calculating first order reversal curve distributions using locally weighted regression smoothing. Geochem. Geophys. Geosystems 9, Q05016. doi:10.1029/2008GC001987
Hesse, R. (2003). Pore water anomalies of submarine gas-hydrate zones as tool to assess hydrate abundance and distribution in the subsurface what have we learned in the past decade?. Earth-Science Rev. 61, 149–179. doi:10.1016/S0012-8252(02)00117-4
Horng, C.-S. (2018). Unusual magnetic properties of sedimentary pyrrhotite in methane seepage sediments: comparison with metamorphic pyrrhotite and sedimentary greigite. J. Geophys. Res. Solid Earth 123, 15262. doi:10.1002/2017JB015262
Housen, B. A., and Musgrave, R. J. (1996). Rock-magnetic signature of gas hydrates in accretionary prism sediments. Earth and Planet. Sci. Lett. 139 (3–4), 509–519. doi:10.1016/0012-821X(95)00245-8
Inagaki, F., Nunoura, T., Nakagawa, S., Teske, A., Lever, M., Lauer, A., et al. (2006). Biogeographical distribution and diversity of microbes in methane hydrate-bearing deep marine sediments on the Pacific Ocean Margin. Proc. Natl. Acad. Sci. USA 103 (8), 2815–2820. doi:10.1073/pnas.0511033103
Kao, S.-J., Horng, C.-S., Roberts, A. P., and Liu, K.-K. (2004). Carbon-sulfur-iron relationships in sedimentary rocks from southwestern Taiwan: influence of geochemical environment on greigite and pyrrhotite formation. Chem. Geology. 203 (1–2), 153–168. doi:10.1016/j.chemgeo.2003.09.007
Kars, M., and Kodama, K. (2015a). Authigenesis of magnetic minerals in gas hydrate-bearing sediments in the Nankai Trough, offshore Japan. Geochemisty, Geophys. Geosystems 16, 947–961. doi:10.1002/2014GC005614
Kars, M., and Kodama, K. (2015b). Rock magnetic characterization of ferrimagnetic iron sulfides in gas hydrate-bearing marine sediments at Site C0008, Nankai Trough, Pacific Ocean, off-coast Japan. Earth, Planets and Space 67, 18. doi:10.1186/s40623-015-0287-y
Kars, M., Musgrave, R. J., Hoshino, T., Jonas, A-S., Bauersachs, T., Inagaki, F., et al. (2018). Magnetic mineral diagenesis in a high temperature and deep methanic zone in izu rear arc marine sediments, northwest pacific ocean. J. Geophys. Res. Solid Earth, 123 (10), 8331–8348. doi:10.1029/2018JB015861
Kasten, S., Freudenthal, T., Gingele, F. X., and Schulz, H. D. (1998). Simultaneous formation of iron-rich layers at different redox boundaries in sediments of the Amazon deep-sea fan. Geochimica et Cosmochimica Acta 62, 2253–2264. doi:10.1016/S0016-7037(98)00093-3
Katayama, T., Yoshioka, H., Takahashi, H. A., Amo, M., Fujii, T., and Sakata, S. (2016). Changes in microbial communities associated with gas hydrates in subseafloor sediments from the Nankai Trough. FEMS Microbiol. Ecol. 92, fiw093. doi:10.1093/femsec/fiw093
Kinoshita, M., Fukase, H., Goto, S., and Toki, T. (2015). In situ thermal excursions detected in the Nankai Trough forearc slope sediment at IODP NanTroSEIZE Site C0008. Earth, Planets and Space 67, 16. doi:10.1186/s40623-014-0171-1
Knittel, K., and Boetius, A. (2009). Anaerobic oxidation of methane: progress with an unknown process. Annu. Rev. Microbiol. 63 (1), 311–334. doi:10.1146/annurev.micro.61.080706.093130
Knittel, K., Boetius, A., Lemke, A., Eilers, H., Pfannkuche, O., and Linke, P. (2003). Activity, distribution, and diversity of sulfate reducers and other bacteria in sediments above gas hydrate (Cascadia Margin, Oregon). Geomicrobiology J. 20, 269–294. doi:10.1080/01490450390241008
Kvenvolden, K. A. (1993). Gas hydrates – geological perspective and global change. Rev. Geophys. 31 (2), 173–187. doi:10.1029/93RG00268
Larrasoaña, J. C., Gràcia, E., Garcés, M., Musgrave, R. J., Piñero, E., Martínez-Ruiz, F., et al. (2006). Rock magnetic identification of magnetic iron sulfides and its bearing on the occurrence of gas hydrates, ODP Leg 204 (Hydrate Ridge) in Proceedings of the ocean drilling program, scientific results Editors A. M. Tréhu, G. Bohrmann, M. E. Torres, and F. S. Colwell, 204. doi:10.2973/odp.proc.sr.204.111.2006
Larrasoaña, J. C., Roberts, A. P., Musgrave, R. J., Gràcia, E., Piñero, E., Vega, M., et al. (2007). Diagenetic formation of greigite and pyrrhotite in marine sedimentary systems containing gas hydrates. Earth and Planet. Sci. Lett. 261 (3–4), 350–366. doi:10.1016/j.epsl.2007.06.032
Li, G., Zhang, B., Yu, F., Novakova, A. A., Krivenkov, M. S., Kiseleva, T. Y., et al. (2014). High-purity Fe3S4 greigite microcrystals for magnetic and electrochemical performance. Chem. Mater. 26, 5821–5829. doi:10.1021/cm501493m
Lu, R., and Banerjee, S. K. (1994). Magnetite dissolution in deep sediments and its hydrologic implication: a detailed study of sediments from site 808, leg 131. J. Geophys. Res. 99 (B5), 9051–9059. doi:10.1029/93JB03204
Mann, S., Sparks, N. H. C., Frankel, R. B., Bazylinski, D. A., and Jannasch, H. W. (1990). Biomineralization of ferrimagnetic greigite (Fe3S4) and iron pyrite (FeS2) in a magnetotactic bacterium. Nature 343, 258–261. doi:10.1038/343258a0
Moskowitz, B., Frenkel, R. B., and Bazylinski, D. A. (1993). Rock magnetic criteria for the detection of biogenic magnetite. Earth and Planet. Sci. Lett. 120, 283–300. doi:10.1016/0012-821X(93)90245-5
Mountjoy, J. J., Pecher, I., Henrys, S., Crutchley, G., Barnes, P. M., and Plaza-Faverola, A. (2014). Shallow methane hydrate system controls on going downslope sediment transport in a low-velocity active submarine landslide complex, Hikurangi Margin, New Zealand. Geochem. Geophys. Geosystem 15, 4137–4156. doi:10.1002/2014GC005379
Musgrave, R. J., Bangs, N. L., Larrasoaña, J. C., Gràcia, E., Hollamby, J. A., and Vega, M. E. (2006). Rise of the base of the gas hydrate zone since the last glacial recorded by rock magnetism. Geology 34 (2), 117–120. doi:10.1130/G22008.1
Musgrave, R. J., Kars, M., and Vega, M. E. (2019). Progressive and punctuated magnetic mineral diagenesis: the rock magnetic record of multiple fluid inputs and progressive pyritization in a volcano-bounded basin, IODP Site U1437, Izu Rear Arc. J. Geophys. Res. Solid Earth 124 (6), 5357–5378. doi:10.1029/2018jb017277
Muxworthy, A. R., and Dunlop, D. J. (2002). First-order reversal curve (FORC) diagrams for pseudosingle-domain magnetites at high temperature. Earth and Planet. Sci. Lett. 203, 369–382. doi:10.1016/S0012-821X(02)00880-4
Muxworthy, A. R., and McClelland, E. (2000). Review of the low-temperature magnetic properties of magnetite from a rock magnetic perspective. Geophys. J. Int. 140 (1), 101–114. doi:10.1046/j.1365-246x.2000.00999.x
Neretin, L. N., Böttcher, M. E., Jørgensen, B. B., Volkov, I. I., Lüschen, H., and Hilgenfeldt, K. (2004). Pyritization processes and greigite formation in the advancing sulfidization front in the Upper Pleistocene sediments of the Black Sea. Geochimica et Cosmochimica Acta 68, 2081–2093. doi:10.1016/S0016-7037(03)00450-2
Özdemir, Ö., Dunlop, D. J., and Moskowitz, B. M. (2002). Changes in remanence, coercivity and domain state at low temperature in magnetite. Earth and Planet. Sci. Lett. 194, 343–358. doi:10.1016/S0012-821X(01)00562-3
Passier, H. F., de Lange, G. J., and Dekkers, M. J. (2001). Magnetic properties and geochemistry of the active oxidation front and the youngest sapropel in the eastern Mediterranean Sea. Geophys. J. Int. 145 (3), 604–614. doi:10.1046/j.0956-540x.2001.01394.x
Passier, H. F., and Dekkers, M. J. (2002). Iron oxide formation in the active oxidation front above sapropel S1 in the eastern Mediterranean Sea as derived from low-temperature magnetism. Geophys. J. Int. 150, 230–240. doi:10.1046/j.1365-246X.2002.01704.x
Pecher, I. A., Barnes, P. M., and LeVay, L. J. and the Expedition 372A Scientists, (2019). “Creeping gas hydrate slides,” in Proceedings of the International Ocean Discovery Program, 372A: College Station, TX:International Ocean Discovery Program. doi:10.14379/iodp.proc.372A.2019
Pike, C. R., Roberts, A. P., and Verosub, K. L. (1999). Characterizing interactions in fine magnetic particle systems using first order reversal curves. J. Appl. Phys. 85(9), 6660–6667. doi:10.1063/1.370176
Reed, D. W., Fujita, Y., Delwiche, M. E., Blackwelder, D. B., Sheridan, P. P., Uchida, T., et al. (2002). Microbial communities from methane hydrate-bearing deep marine sediments in a forearc basin. Appl. Environ. Microbiol. 68 (8), 3759–3770. doi:10.1128/AEM.68.8.3759–3770.2002
Roberts, A. P., Chang, L., Rowan, C. J., Horng, C.-S., and Florindo, F. (2011). Magnetic properties of sedimentary greigite (Fe3S4): an update. Rev. Geophys. 49, RG1002. doi:10.1029/2010rg000336.1
Roberts, A. P., Heslop, D., Zhao, X., and Pike, C. R. (2014). Understanding fine magnetic particle systems through use of first-order reversal curve diagrams. Rev. Geophys. 52, 557–602. doi:10.1002/2014RG000462
Roberts, A. P., Liu, Q., Rowan, C. J., Chang, L., Carvallo, C., Torrent, J., et al. (2006). Characterization of hematite (a-Fe2O3), goethite (a-FeOOH), greigite (Fe3S4), and pyrrhotite (Fe7S8) using first-order reversal curve diagrams. J. Geophys. Res. 111, B12S35, doi:10.1029/2006JB004715
Roberts, A. P. (2015). Magnetic mineral diagenesis. Earth-Science Rev. 151, 1–47. doi:10.1016/j.earscirev.2015.09.010
Roberts, A. P., Pike, C. R., and Verosub, K. L. (2000). First-order reversal curve diagrams: a new tool for characterizing the magnetic properties of natural samples. J. Geophys. Res., 105 (B12), 28461–28475. doi:10.1029/2000JB900326
Roberts, A. P., Tauxe, L., Heslop, D., Zhao, X., and Jiang, Z. (2018). A critical appraisal of the “Day” diagram. J. Geophys. Res. – Solid Earth, 123, 2618–2644. doi:10.1002/2017JB015247
Roberts, A. P., and Turner, G. M. (1993). Diagenetic formation of ferrimagnetic iron sulphide minerals in rapidly deposited marine sediments, South Island, New Zealand. Earth and Planet. Sci. Lett. 115, 257–273. doi:10.1016/0012-821X(93)90226-Y
Roberts, A. P., and Weaver, R. (2005). Multiple mechanisms of remagnetization involving sedimentary greigite (Fe3S4). Earth and Planet. Sci. Lett. 231, 263–277. doi:10.1016/j.epsl.2004.11.024
Rowan, C. J., and Roberts, A. P. (2006). Magnetite dissolution, diachronous greigite formation, and secondary magnetizations from pyrite oxidation: unravelling complex magnetizations in Neogene marine sediments from New Zealand. Earth and Planet. Sci. Lett., 241, 119–137. doi:10.1016/j.epsl.2005.10.017
Rowan, C. J., and Roberts, A. P. (2005). Tectonic and geochronological implications of variably timed magnetizations carried by authigenic greigite in marine sediments from New Zealand. Geology 33, 553–556. doi:10.1130/G21382.1
Ruff, S. E., Arnds, J., Knittel, K., Amann, R., Wegener, G., Ramette, A., et al. (2013). Microbial communities of deep-sea methane seeps at Hikurangi continental margin (New Zealand). PLoS One 8 (9), e72627. doi:10.1371/journal.pone.0072627
Ruppel, C. D., and Kessler, J. D. (2017). The interaction of climate change and methane hydrates, Rev. Geophys. 55, 126–168. doi:10.1002/2016RG000534
Saffer, D. M., Wallace, L. M., Barnes, P. M., Pecher, I. A., Petronotis, K. E., LeVay, L. J., et al. and the Expedition 372/375 Scientists. (2019). Site U1518. In Wallace, L.M., Saffer, D.M., Barnes, P.M., Pecher, I.A., Petronotis, K.E., LeVay, L.J., and the Expedition 372/375 Scientists, Hikurangi Subduction Margin Coring, Logging, and Observatories. Proceedings of the International Ocean Discovery Program, 372B/375: College Station, TX (International Ocean Discovery Program), https://doi.org/10.14379/iodp.proc.372B375.103.2019
Schoonen, M. A. A. (2004). Mechanisms of sedimentary pyrite formation, in ulfur biogeochemistry—past and present. Editors J. P. Amend, K. J. Edwards, and T. W. Lyons Boulder, Colorado: Geological Society of America Special Paper 379, 117–134. doi:10.1130/0-8137-2379-5.117
Screaton, E. J., Torres, M. E., Dugan, B., Heeschen, K. U., Mountjoy, J. J., Ayres, C., et al. (2019). Sedimentation controls on methane‐hydrate dynamics across glacial/interglacial stages: an example from International Ocean Discovery Program Site U1517, Hikurangi Margin. Geochem. Geophys. Geosystems 20, 4906–4921. doi:10.1029/2019GC008603
Shi, M., Wu, H., Roberts, A. P., Zhang, S., Zhao, X., Li, H., et al. (2017). Tectonic, climatic, and diagenetic control of magnetic properties of sediments from Kumano Basin, Nankai margin, southwestern Japan. Mar. Geology. 391, 1–12. doi:10.1016/j.margeo.2017.07.006
Smirnov, A. V. (2009). Grain size dependence of low-temperature remanent magnetization in natural and synthetic magnetite: experimental study. Earth Planets Space 61, 119–124. doi:10.1186/BF03352891
Snowball, I. F. (1997). Gyroremanent magnetization and the magnetic properties of greigite-bearing clays in southern Sweden. Geophys. J. Int. 129, 624–636. doi:10.1111/j.1365-246X.1997.tb04498.x
Snowball, I. F. (1991). Magnetic hysteresis properties of greigite (Fe3S4) and a new occurrence in Holocene sediments from Swedish Lappland. Phys. the Earth and Planet. Interiors, 68 (1–2), 32–40. doi:10.1016/0031‐9201(91)90004‐2
Wallace, L. M., Beavan, J., McCaffrey, R., and Darby, D. (2004). Subduction zone coupling and tectonic block rotations in the North Island, New Zealand. J. Geophys. Res. Solid Earth, 109 (12), 3241. doi:10.1029/2004JB003241
Wallace, L. M., Saffer, D. M., Barnes, P. M., Pecher, I. A., Petronotis, K. E., and LeVay, L. J., and the Expedition 372/375 Scientists. (2019). Hikurangi subduction margin coring, logging, and observatories. Proceedings of the International Ocean Discovery Program, College Station, TX, (International Ocean Discovery Program). 372B/375. doi:10.14379/iodp.proc.372B375.2019
Watson, J. H. P., Cressey, B. A., Roberts, A. P., Ellwood, D. C., Charnock, J. M., and Soper, A. K. (2000). Structural and magnetic studies on heavy-metal-adsorbing iron sulphide nanoparticles produced by sulphate-reducing bacteria. J. Magnetism and Magn. Mater. 214, 13–30. doi:10.1016/S0304-8853(00)00025-1
Keywords: Hikurangi Margin, Site U1518, greigite, methane hydrate, IODP Expedition 375
Citation: Kars M, Greve A and Zerbst L (2021) Authigenic Greigite as an Indicator of Methane Diffusion in Gas Hydrate-Bearing Sediments of the Hikurangi Margin, New Zealand. Front. Earth Sci. 9:603363. doi: 10.3389/feart.2021.603363
Received: 06 September 2020; Accepted: 01 February 2021;
Published: 11 March 2021.
Edited by:
Anne-Christine Da Silva, University of Liège, BelgiumReviewed by:
Saulwood Lin, National Taiwan University, TaiwanCopyright © 2021 Kars, Greve and Zerbst. This is an open-access article distributed under the terms of the Creative Commons Attribution License (CC BY). The use, distribution or reproduction in other forums is permitted, provided the original author(s) and the copyright owner(s) are credited and that the original publication in this journal is cited, in accordance with accepted academic practice. No use, distribution or reproduction is permitted which does not comply with these terms.
*Correspondence: Myriam Kars, bWthcnNAa29jaGktdS5hYy5qcA==
Disclaimer: All claims expressed in this article are solely those of the authors and do not necessarily represent those of their affiliated organizations, or those of the publisher, the editors and the reviewers. Any product that may be evaluated in this article or claim that may be made by its manufacturer is not guaranteed or endorsed by the publisher.
Research integrity at Frontiers
Learn more about the work of our research integrity team to safeguard the quality of each article we publish.