
95% of researchers rate our articles as excellent or good
Learn more about the work of our research integrity team to safeguard the quality of each article we publish.
Find out more
ORIGINAL RESEARCH article
Front. Earth Sci. , 05 March 2021
Sec. Biogeoscience
Volume 9 - 2021 | https://doi.org/10.3389/feart.2021.557634
This article is part of the Research Topic Recent Advances in Natural Methane Seep and Gas Hydrate Systems View all 14 articles
 Ang Li1,2*
 Feng Cai1,2Nengyou Wu1,2
 Qing Li1,2Guijing Yan1,2Yunbao Sun1,2Gang Dong1,2Di Luo1,2
 Xingxing Wang1,2
Gas emissions from the seabed are favored by tectonically active settings and their distribution is often linked to the nearby faults. Here we use the multi-beam echo-sounder (MBES) and the multi-channel seismic (MCS) data and a sediment core to show multiple gas emissions near the fault complex out of the shelf of the Mid-Okinawa Trough. The features indicating the gas emissions include 1) a set of the conical positive reliefs at the seabed, 2) the bundle-shaped clusters of the high-backscattering intensities in the water column, and 3) the sub-circular medium-to high-backscattering patches at the level of the seabed. These features together show that the free gases can escape from the marine sediments then rise in the water column at present, while some other gases trapped in the sub-seafloor sediment might contribute to the precipitation of the authigenic carbonates in the past. The spatial relationship between the gas emissions and the faults suggests that the faulting driven by the back-arc extension should provide the permeable migration pathways for the gas emissions to operate, and thus determines where most of them could potentially occur. The area surrounding the restraining bend concentrates part of the gas emissions rather than along the fault lines, due to the lateral compression and the structural complexity. This is demonstrated by the results of the numerical model of finite element method (FEM), which shows two gas emissions are within the compressed zone of the modeled restraining step-over. This study provides new evidence of the role of the tectonic stresses in determining the sites of degassing of marine sediments.
Gas emission in the marine environment has attracted significan research attention over the past few decades. The abundance of gas emissions could indicate the potential accumulation of hydrocarbons and, if ambient conditions were proper, the gas hydrates (Riedel et al., 2018). Gases leaked from the seabed constitute an important part of methane transported into the ocean (Judd et al., 2002; Feng et al., 2018). As a member of the potent greenhouse gases, methane can sometimes reach the shallow seawater by forming ascending streams of gas bubbles and possibly enter the atmosphere (McGinnis et al., 2006; Westbrook et al., 2009). This fate of methane has been questioned by the study in the Arctic Ocean, in which enhanced methane concentration was detected close to the gas emissions near the seabed but not in the seawater near the sea level (Myhre et al., 2016). Therefore, whether methane escaping from marine sediments can contribute to climatic warming is controversial. If dissolving into the seawater is the fate for most of this methane, the oceans would likely experience deoxygenation and acidification (Biastoch et al., 2011; Yamamoto et al., 2014).
Gas emissions emerge intermittently surrounding the continental shelves and slopes, and are sometimes coated by hydrates in the deep-water settings (Somoza et al., 2003; Sauter et al., 2006; Römer et al., 2012; Smith et al., 2014; Rümer et al., 2017). Free gases can bypass the less permeable sediments alone or be expulsed together with pore fluids and mud-rich sediments (Gennari et al., 2013; Cartwright and Santamarina, 2015). The geological records of such processes include a spectrum of surface expressions such as pockmark (Hustoft et al., 2009; Wang et al., 2018), mud cone (Roberts, 2001), mud volcano (Huguen et al., 2004) and carbonate mound (Schmidt et al., 2005). Gas emissions through these morphological features sometimes have the geophysical signature of the acoustic flares in the water column (i.e., gas plume, Heeschen et al., 2003; Dupre et al., 2015), which can be detected by multi-beam echo-sounder, and gas chimneys imaged by seismic data in the subsurface (Cartwright and Santamarina, 2015; Li et al., 2017).
Ongoing research probes into how geological processes control gas emissions and the one that has been studied most on global scale is the tectono-structural process (Ciotoli et al., 2020). Gas emissions have been detected in the extensional (Plaza-Faverola and Keiding, 2019), the compressive (Reed et al., 1990; Watson et al., 2019), the sheared (Huguen et al., 2004; Geli et al., 2008) and the mixed deformation regimes (Plaza-Faverola et al., 2014). The faults formed in these settings can indicate the stress regime surrounding gas emissions, and sometimes served as the escaping conduits for them (Ciotoli et al., 2020). The gas emissions in the Mid-Okinawa Trough have been inferred only by geochemical analysis (Xu et al., 2018) and what geological process controlled their distribution is not fully understood.
In this study, we use multi-beam echo-sounder (MBES) and multi-channel seismic (MCS) data to show multiple gas emissions out of the shelf of the Mid-Okinawa Trough and consider how faulting determines their potential locations. Here the nearby fault complex is formed in the transtensile regime, accompanied by local compressions surrounding the restraining bend. The finite element method (FEM) is used to simulate the stress regime surrounding two of these emissions in a restraining step-over. The consistency of the modeling result with the geophysical observation supports the role of local lateral compression in promoting gas emissions.
The Okinawa Trough is an incipient back-arc basin in the East China Sea and displays as an arcuate geometry in plan view (Figure 1). It formed after the middle Miocene due to the crustal stretching (Lee et al., 1980), driven by the subduction of the Philippine Sea Plate under the Eurasian Plate (Kimura, 1985; Gungor et al., 2012). This tectonic activity accounts for the multiple periods of rifting and the latest one is still active at present (Kimura, 1985; Letouzey and Kimura, 1985; Yamaji, 2003). The en-echelon grabens bounded by the faults and the stepped, sometimes unclear rifting centers in the Mid-Okinawa Trough have been revealed before by some sparse seismic profiles (Kimura, 1985; Letouzey and Kimura, 1985; Sibuet et al., 1987). Such shallow structures and basaltic ridges have also been seen in the area of volcanic arc-rift migration phenomenon (VAMP, shown in Figure 1) (Sibuet et al., 1987). To the north, the faults formed by transtension have been mapped in detail by combining the multi-beam echo-sounder and the multi-channel seismic data in an area of ∼5300 km2 (Figures 2A, 3). Their strikes change from ∼N60°E in the shelf-slope setting (marked by n1) to ∼ N70°E in the deep-water basin (marked by n2, Figure 2). The faults in the deep-water basin are mostly normal, while those in the slope often have scarps that are subparallel with each other (Figures 2, 3). There are some small-scale faults affected by strike-slip in the fault blocks, leaving minor positive relief at the seabed (Figures 3F,G). The observations of the fault pattern are consistent with the previous interpretation of the basin-scale tectonic regime that is characterized by extension near the rifting center and strike slip in outer shelf-slope setting (Figure 2B) (Xu et al., 2014; Liu et al., 2016).
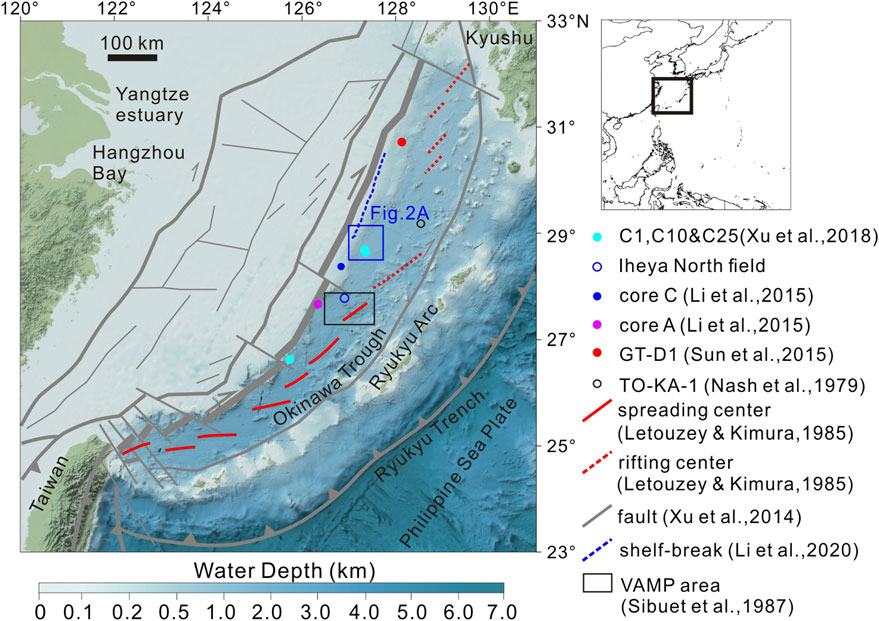
FIGURE 1. Bathymetric map showing the study area in the Okinawa Trough. The bathymetric data are downloaded from https://maps.ngdc.noaa.gov/viewers/bathymetry (color bar—GEBCO2014 Bathymetry Color Scale). The methane seepages have been recorded at the sites of Cores A and C, C01, C10 and GT-D1 (Li et al., 2015; Sun et al., 2015; Xu et al., 2018).
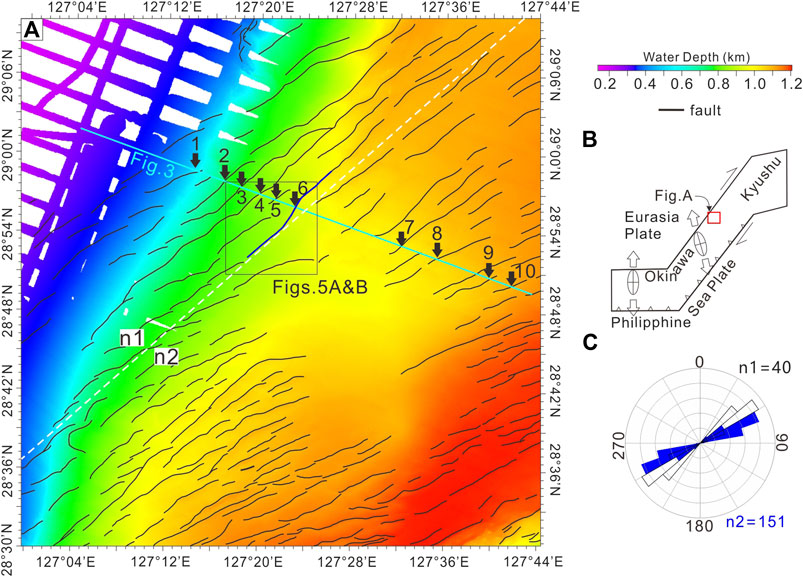
FIGURE 2. (A) The bathymetric map showing the distribution of the fault scarps. It is mapped based on the MBES data. The blue line is the fault incorporated into the model. (B) The schematic figure showing the regional tectonic setting and the direction of extension (hollow arrows) in the Okinawa Trough (from Fabbri et al., 2004). (C) Rose diagram showing the orientations of the fault groups (n1 and n2, bounded by the white dashed line in Fig. A).
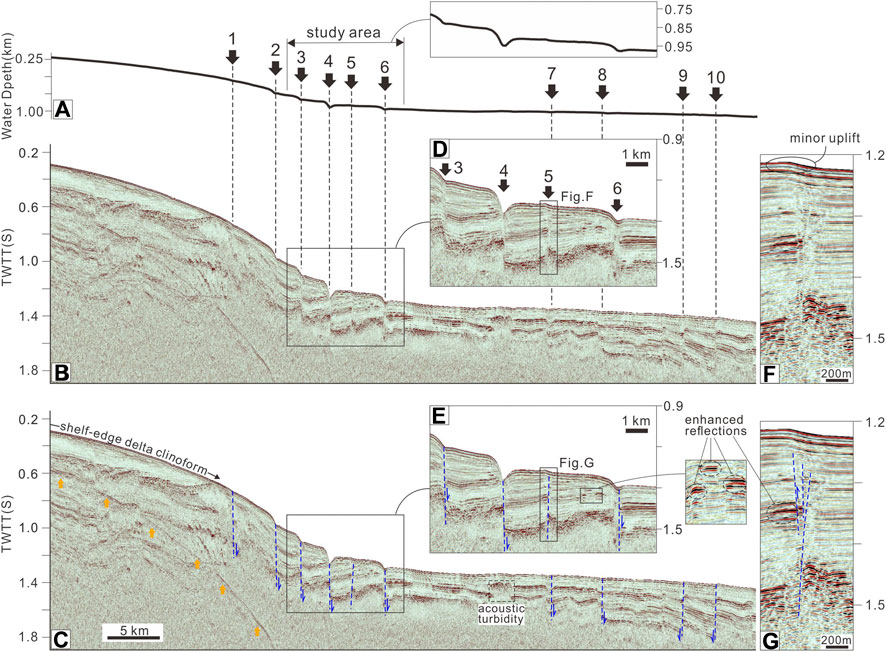
FIGURE 3. (A,B) A representative seismic cross section and its bathymetric profile. Its location is marked in Figure 2A. The presence of the faults marked by numbers 1–10 can be identified both on the bathymetric profile and the seismic cross section (B,C). (D–G) Zoomed-in figures showing the faults and their interpretations. Orange arrows mark the seabed multiples.
The sedimentary study in the Mid-Okinawa Trough focuses on the sediment provenance and its variation during late Quaternary (Dou et al., 2010a, Dou et al., 2010b; Li et al., 2019). The largest contribution to the sediment deposits there is from the Yellow River since the last deglaciation, while other limited sources include Yangtze River-derived and Taiwan-derived sediments (Dou et al., 2010b; Li et al., 2019). In the Middle to Late Holocene, the sediments delivered into the basin was hindered by the barrier effect of the strengthened Kuroshio Current (Dou et al., 2010b; Li et al., 2019). The geophysical observation associated with sedimentary features in the Mid-Okinawa Trough is the shelf-margin delta clinoforms straddling around the shelf edge formed during sea-level lowstands in the shelf-slope setting (Berné et al., 2002; Li et al., 2014; Li et al., 2020). No considerable canyons and basin-floor fan have been detected yet in the area between 28°30′N and 29°10′N (Li et al., 2020). The near-seafloor sediments are mostly mud and the clay mineral is dominated by illite and smectite (core Oki02, Zheng et al., 2014; core M063–05, Li et al., 2019). An area of ∼1.2 × ∼0.3 km crust of the authigenic carbonate at the water depth of ∼600 m has been found near seabed methane seepage by the visual data recorded by a remotely operated vehicle (ROV) ∼200 km to the north of the study area. These outcropping carbonates consist of aragonite, pyrite and gypsum, and the isotopic measurements show that the methane feeding their growth is mostly biogenic (Cao et al., 2020).
The Okinawa Tough is known for the seafloor methane seepages and multiple ones along its western slope have been revealed by the record of the geochemical data from the pore water of the gravity cores (C01, C10, cores A and C, and GT-D1, marked in Figure 1) (Li et al., 2015; Sun et al., 2015; Xu et al., 2018). The relatively thin Sulfate-Methane Transition Zone at some sites (e.g., C25 in Figure 1) suggests rapid transport of dissolved methane toward the surface (Xu et al., 2018). Escaping of free methane gas has been inferred before to occur near the suspected mud volcano, while the geophysical evidence is recorded in the seismic cross section (Figure 3). The features associated with free gases include the ∼2.2 km-wide acoustic turbidity out of the study area and some local enhanced reflections at different horizons within it (Figure 3).
We installed a Kongsberg EM122 multi-beam echo-sounder (MBES) system for the acquisition of the acoustic data of the seawater and the seabed. The system mounted by R/V Haidahao has a swath angle of 130° and can transmit and receive up to 288 simultaneous beams with a beamwidth of 1°. It has a sounding frequency of 12 kHz and up to 864 soundings per ping in the dual-swath mode. The positioning and the monitoring systems are NAVCOMSF-3050 and Kongsberg SIS, respectively. The parameters of roll, pitch and heading have been corrected during a Sea Acceptance Test before data acquisition. The distances between the dip-oriented and the strike-oriented track lines are 4 and 8 km, respectively. The recorded data, vessel information, and sound velocity profile (SVP) have been integrated and processed by using the QPS Qimera software (including sound velocity correction, creating dynamic surface, etc.). The velocity of the seawater was measured by using the system of the Sea-Bird 911 plus CTD and the X-CTD. QPS Qimera and Fledermaus softwares were used for visualization of the gas plumes in fan view and space, respectively. The swath width increases from 0.94 km on the shelf (water depth of 200 m) to 5.9 km in the deep-water basin (water depth of 1090 m). The recorded backscatter values of the seafloor mosaic images were normalized in Fledermaus software. The cell size of the backscattering images is 11.83 m.
A SIG pulse L5 sparker (20–1000 Hz) was employed at the 1–2 m below the sea level for acquiring the two-dimensional (2-D) high-resolution seismic data. The ship towed the 48-channel streamer (294 m long). The data were sampled at an interval of 0.5 ms and then processed on board by using the ProMAX system (including pre-filtering, NMO, de-noising, etc.). The 2-D multichannel seismic (MCS) data can show the clear image of ∼550 ms in TWTT below the seabed with a vertical resolution of ∼2 m. Positive polarity is defined by a peak on the seismic trace and displayed as a black-red loop on the cross section.
The acquisition of the in-situ sediment cores at D5 was carried out by the seabed drilling rig Seabull. It was deployed from R/V Haidahao to recover sediments as deep as 55.1 m below the seafloor. The lithology of the sediment cores is not fully recorded.
The FEM has been widely used in the tectonic analysis by considering stress transferring across the interface of the neighboring elements and solving the matrix equation. In this study, we use the FEM to show the role of the shear stress in causing the local compression surrounding the restraining bend between two faults. The 2-D square plane is used to model the marine sediments in plan view, through which the gas-rich focused fluid flow passed. The dimension of the model is 0.1% of the real one observed in the geophysical data (shown in Figure 4; Table 1) and the side length is 22.58 m. The peripheral 3.5 m-wide area is modeled to eliminate the effect of the boundary conditions (Figure 4). The sediments are assumed to be isotropic. The square plane was discretized into 18620 triangular elements (9508 nodes), most of which are equilateral ones (the discretization of the code distmesh2d can be downloaded from http://persson.berkeley.edu/distmesh/) and the side length is 0.25 m (Figure 4). The stiffness matrix of each triangular element
where
where
and,
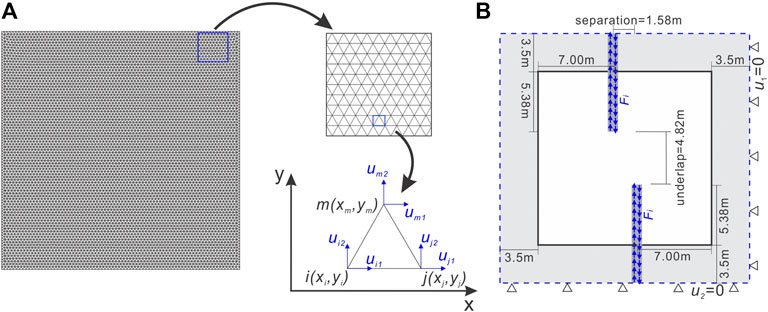
FIGURE 4. (A) The discretization results of the numerical model. The finite elements are the equilateral triangles except those near the boundaries. Each node has two dimensions of displacements (u1 and u2). (B) The model is set up with two fault segments. The results bounded by the black box are shown in Figure 9. The area marked in grey color is set to eliminate the boundary effect.
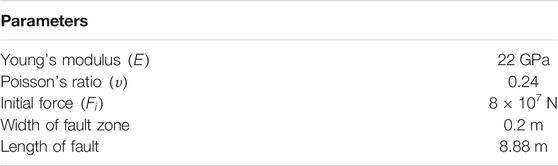
TABLE 1. Parameters used in this model (after Nabavi et al., 2017).
Based on the principle of minimum potential energy, the global balance equation for the entire planar sediments is:
where
where
The seabed in the study area dips southeastwards and the dipping angle decreases seawards, ranging from ∼1.5° at the water depth of ∼700 m to ∼0.5° at >950 m. It is marked by a set of the aligned breaks in the relief along the fault scarps (Figure 5). The linear-curvilinear scarps have a NE-SW trend and their separation distance in plan view is ∼2.5 km. The vertical displacements of the scarps are 15–90 m and the offsets along each fault plane can be clearly observed on the seismic profiles (Figure 3). Some positive reliefs (named with Db) are located close to two of these faults (Figures 5, 6, 7). Only one positive relief (Db29) is observed to the east of the nearby fault scarp (Figures 5, 6). The water depth, the length of the long axis and the elevation of the positive reliefs are shown in Table 2. Most of them have conical geometries (Figures 5C,D). There is a ∼1 km long ridge-like positive relief elongated along the fault (Figures 5, 6). In the northeastern part of the study area (white box in Figure 5A), part of the NE-SW oriented fault scarp bends landwards. Db21 and Db29 are located at either side of the bending zone and have a similar distance away from it, forming a sub-symmetric feature in plan view (Figure 7).
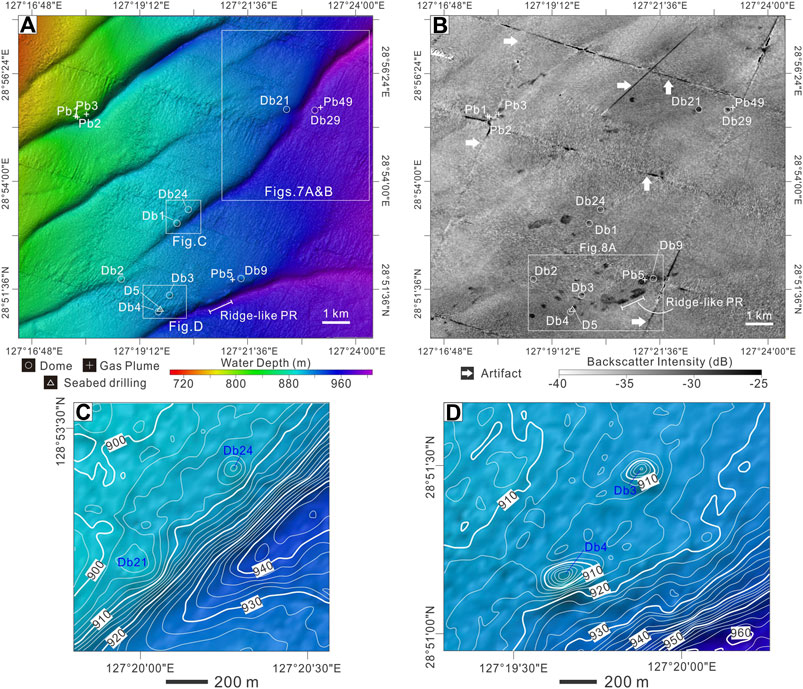
FIGURE 5. (A) Bathymetric map showing the locations of the features associated with gas emission. All of the curvilinear features at the seabed have been confirmed to be the fault scarps (Li et al., 2021). PR–positive relief in this and the subsequent figures. (B) The map of the backscattering intensity at the level of the seabed. Please note the anomalous backscattering intensities occur not only surrounding the domed seabed but also at the relatively flat places. The white arrows mark the artifacts along the nadir lines. (C,D) The bathymetric maps near some examples of the positive reliefs (Db24, 21, 3 and 4). The contour interval is 2 m.
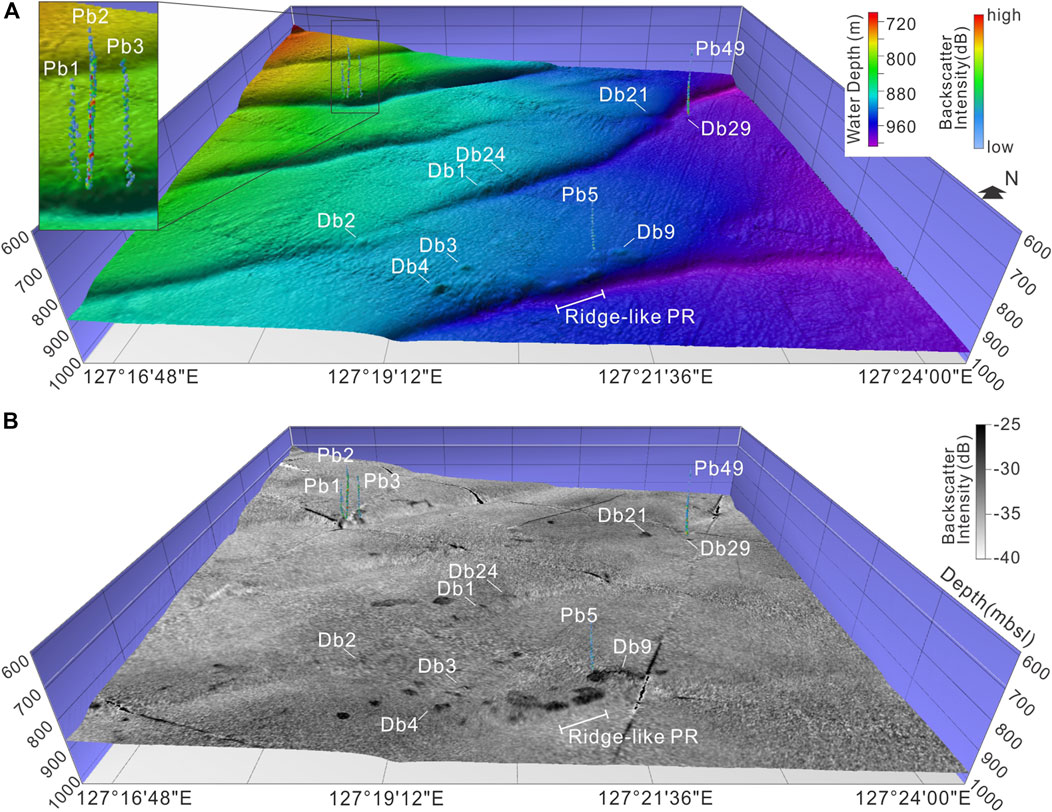
FIGURE 6. (A) 3-D view of the bathymetry showing the geometries of the positive reliefs and the gas plumes. (B) 3-D view of the map of the backscattering intensities superimposed on the bathymetric one.
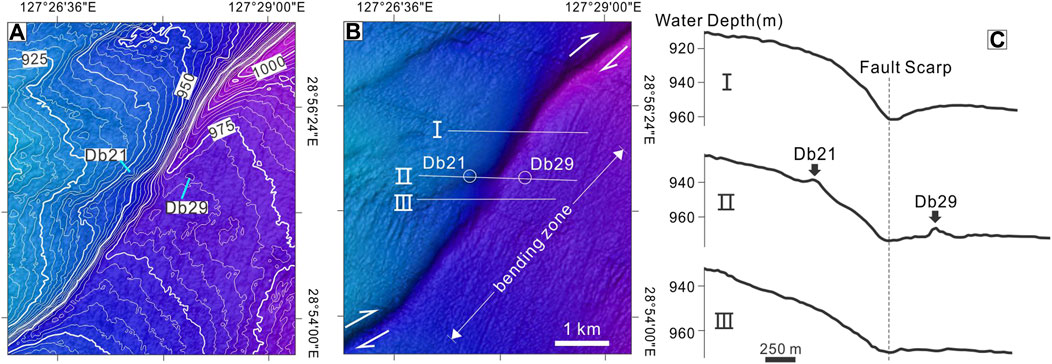
FIGURE 7. Zoomed-in figure showing the bathymetry (A) and the spatial relationship between the fault, the restraining bend and two emission sites (B). The contour interval is 2.5 m. (C) Three bathymetric profiles transecting the fault scarp and the positive reliefs of Db21 and 29.
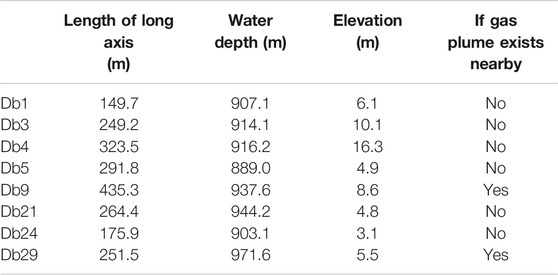
TABLE 2. Geometries of positive reliefs.
Five bundle-like clusters of the acoustic anomalies have been identified in the study area (Figure 6). The gas plumes (named with Pb and numbers) have a higher backscattering intensity than the seawater of the background (Figure 6). The relatively high-backscatter intensities occur in the lower and the middle parts of each gas plume (Figure 6). The gas plumes have a height of 163–355 m. Two of the gas plumes (Pb5 and Pb49) emanated from the surrounding areas of the positive reliefs, while the other three ones (Pb1-3) cluster around the arcuate part of one fault (Figures 5, 6).
There are some medium-to high-backscatter areas at the level of the seabed (shown as the bright black patches in Figures 5B, 6B). Their intensities are 5–10 dB higher than the mean of those of the background marine sediments. The bright patches are sub-circular, sub-elliptical or irregular in plan view (Figure 5B). Most of them cover an area of <0.1 km2 and the largest one occurs near the ridge-like positive relief (∼0.3 km2, Figure 5B). Part of the bright areas are located close to the fault scarps, while the rest occur at the places where there is no topographic anomaly (Figures 5B, 6B). Not all of the positive reliefs are superimposed by the areas of the enhanced backscattering intensities.
D5 is located within a medium-to high-backscatter area of the seabed (Figure 8). The upper 6 m-long sediment cores at D5 mainly consist of greyish clay and a strong H2S odor was smelt during processing the samples prior to the on-board test. Angular shells occur at the depth of ∼0.45 m (Figure 8). Neither gas hydrates nor soupy structures were found. Carbonates occur at the depth ranges of 1.33–1.85 m and 2.50–3.05 m deep and hollows and shells are common within them (Figure 8).
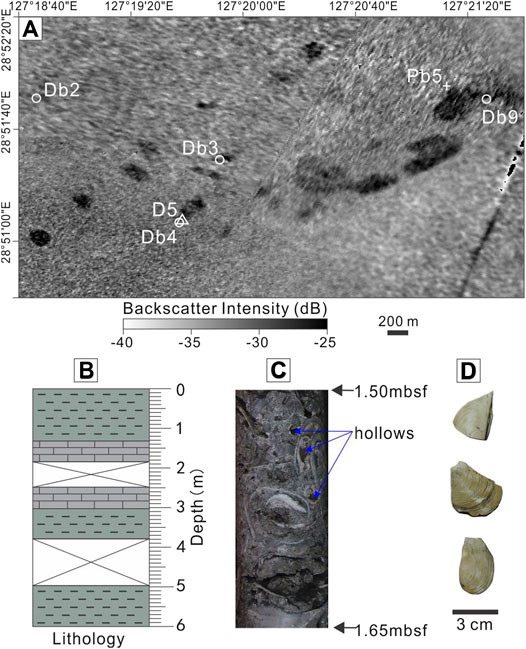
FIGURE 8. (A) Zoom-in map of the backscattering intensity. Please note that D5 is located within the medium-to high-backscatter areas. (B) The recorded lithology of the sediment cores in the upper 6 m. The photos of the carbonate core (C) and the angular shells (D) are shown here.
The variations of the displacements along x- and y-directions (u1, u2) display different symmetric patterns (Figure 9). The u1 values are near zero in the middle zone, increasing and decreasing along the positive and the negative y-directions toward the upper and the lower boundaries. There are some anomalous values near the fault tips (Figure 9). The variations of the u2 values are symmetric about the faults and their linkage zone. Positive and negative values occur to the left and the right side of the symmetric line (Figure 9). The normal stresses along x- and y-direction (σx, σy) show the opposite variation pattern (Figure 9). The lobe-like zones of the positive and negative σx values are located inside and outside the linkage zone, respectively. This pattern is converse for the σy values (Figure 9). The zones of high values of maximum principal stresses (high-σ1 zone) and low values of minimum principal stresses (low-σ3 zone) are both near the fault tips. For σ1 and σ3, two zones extending from the fault tips coalesce within the linkage zone to form a sigmoidal geometry (Figure 9). The extending directions are slightly different between σ1 and σ3. The σ1 directions between the faults are almost perpendicular to that of the segment between them (red dashed line in Figure 9). The arrays sharing such direction together form a lozenge-like zone (blue dashed line in Figure 9). The zone of similar geometry also occurred in the modeling results of a transpression zone in the strike-slip setting by Nabavi et al., 2017. The directions of the maximal principal stresses within it will rotate more parallel with the trend of the fault as the underlap distance decreases (Nabavi et al., 2017). The lobes of enhanced Von Mises stresses (σVM) do not deflect near the fault tips and the coalesced zone shows a symmetric pattern about the segment linking the fault tips.
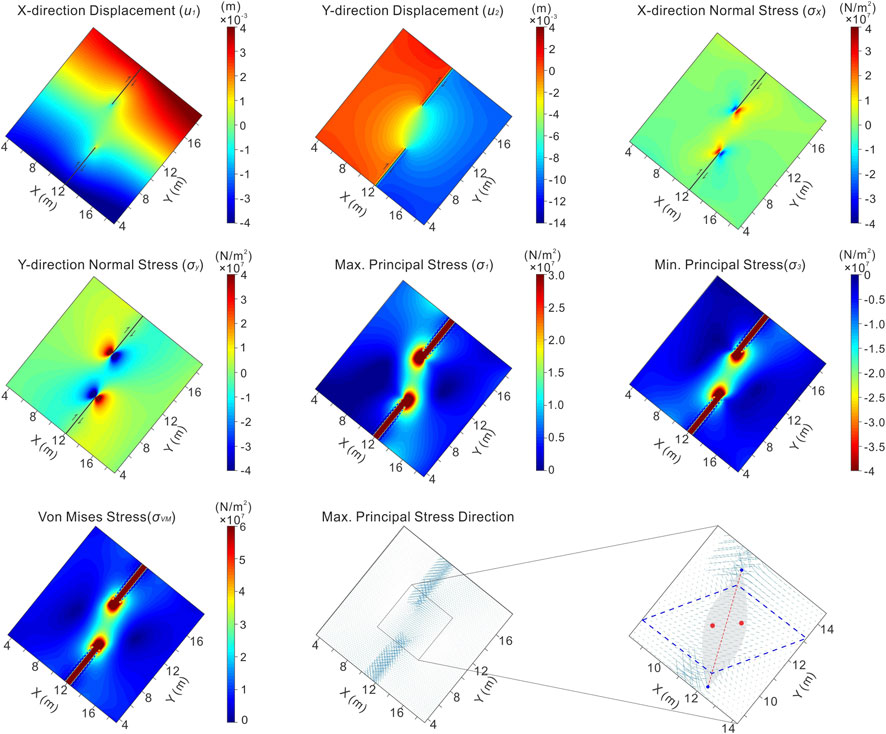
FIGURE 9. Numerical modeling results of the distribution of displacements, normal stresses, maximal and minimal principal stresses and Von Mises stress in the hypothetical strike-slip setting. Red and blue dots mark the locations of the gas emissions (Db21 and 29) and the fault tips, respectively. Their locations in plan view are plotted based on the MBES data shown in Figures 5 and 7. The red dashed line represents the segment between the fault tips and the gray zone suggests the conceptual area of the restraining bend. The area bounded by the dashed blue line marks the lozenge-like zone sharing the same direction of the maximal principal stress and has been seen in the modeling result by Nabavi et al., 2017.
The gas plumes are compelling evidence of the present-day emission of the gas bubbles from the seabed. Their presence indicates that the free gas bubbles can rise through the water column by hundreds of meters before breaking up. It has to be stated that the frequency of 12 kHz used in this study for data acquisition is not high enough to reveal all of the emissions of gas bubbles, particularly for those consisting of dispersed gas bubbles (i.e., no considerable bubble stream). The gas plumes observed here should represent high gas flux and the rapid discharge of free gases.
The maps of the backscattering intensity show that some bright patches scatter around the seabed (Figures 5, 6). The enhancement of the intensity should be attributed to the presence of authigenic carbonates accompanied by the free methane gases in the sub-seafloor sediments (Fonseca, 2001; Naudts et al., 2008). The cores of the authigenic carbonates associated with methane seepage have been got near Db4 (D5 in Figure 5), and anomalous backscattering intensity has also been observed there. The bicarbonate required for the formation of these carbonates is from the anaerobic oxidation of methane (AOM, Dale et al., 2008), which suggests high-flux methane had passed through the areas of these carbonates for years. Therefore, the bright patches of the backscattering intensity indicate the places of gas escaping that were active in the recent past.
The locations of the positive reliefs have a good match with those of the patches of the medium-to high-backscattering intensity (Figures 5, 6). Some hypotheses have been proposed how the sub-conical cones formed. They could result from the vertical displacement of sediments during the expulsion of pore fluids, the buoyancy of vertically continuous gas accumulation (Koch et al., 2015), or volume expansion during the formation of gas hydrate pingoes (Serié et al., 2012). These mechanisms point toward the occurrence of free gases bypassing the shallow underconsolidated sediments, though which one works here is not clear. The positive reliefs and the authigenic carbonates can both be taken as the geological expressions of the intermittent methane-rich gas emissions. These expressions can sometimes coalesce at the level of the seabed to form a larger one (e.g., ridge-like positive relief, Figures 5, 6).
The close spatial relationship between the faults and the acoustic features suggests the role of the faulting in determining the potential locations of gas emission. Consistent with the interpretations in the previous studies (e.g., Kimura, 1985; Gungor et al., 2012), the NE-SW oriented faults here are interpreted to form during the episodic back-arc rifting of the Okinawa Trough. It has to be stated that their trends are slightly different from those observed at the seabed in the deep-water setting ∼45 km to the east of the study area (Figure 2). The difference of the fault trend between the deep-water setting and the slope here could be explained by the oblique rifting in the northern and the middle part of the Okinawa Trough (Fabbri et al., 2004). Its physical modeling results confirm this difference between the rift axis zone and the slope (Autin et al., 2013). It is very likely that part of the free gases in the subsurface escaped along the vertically permeable sediments of the damage zone of the faults that formed by back-arc rifting. The resultant extension would affect gas emissions more in the area closer to the rifting center (Figure 1; Li et al., 2021), in which the strike-slip component is few. Therefore, the faulting driven by back-arc extension provided the migration pathways and the preferential exits for the free gases, and thus determines the potential locations of gas emissions at the seabed.
Apart from the tensile stress, the shear one also has a contribution to the gas emissions (Figure 10). The start of the gas emission requires lasting building up of the pore pressure and this can be primed by the local compression in the transtensive settings. The excess pore pressures are expected to occur in the restraining bend (Figure 10). This is supported by the numerical modeling results showing that the relatively high σ1 within the bend (Figure 9). These modeled stresses are almost perpendicular to that of the segment between the fault tips (red dashed line in Figure 9) and cause local compression toward it. This compression has also been evidenced by sediment thickening close to the restraining bend in a sand-box model (McClay and Bonora, 2001). Overall, the shallow sediments near these reliefs are most likely to be compressed as the tectonic activity continued and the resultant increasing pore pressure primed the formation of the gas emissions (Figure 10). How these gas emissions formed is different from that in the Lusi mud volcano in Indonesia. The gas emissions there are located very close to a planar strike-slip fault and its activity is interpreted to significantly reduce the critical fluid pressure required to induce sediment fluidization (Mazzini et al., 2009). It is concluded that the restraining bend, other than the strike-slip fault planes, could be the potential place for the gas emissions bypassing the shallow marine sediments.
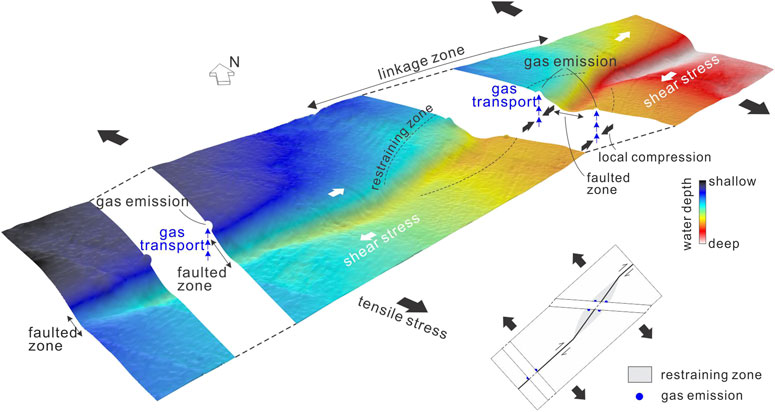
FIGURE 10. Conceptual model showing the gas emissions in the transtensile regime. Inset shows the locations of the restraining zone and the gas emissions in plan view.
Multiple gas emissions are distributed unevenly along the faults at the seabed in the western slope of the Mid-Okinawa Trough. Part of the gas bubbles formed the gas plumes after escaping from the seabed, but did not reach the shallow seawater. Some other gases were trapped immediately below the domed seabed and at the places where there are no local morphological features. As a result of the ongoing back-arc rifting, the faulting allowed the free gases in the subsurface to pass through the shallow sediments. The components of the shear stresses caused local compression within the bending zone of the fault and the resultant increased pore pressure primed the formation of the gas emissions.
The original contributions presented in the study are included in the article/Supplementary Material, further inquiries can be directed to the corresponding author.
AL offered the key idea, designed and ran the FEM modelling, and drafted the manuscript. FC, NW and QL managed the project of the geophysical survey, provided the available data and the context of the methane seeps, vents and emissions in the Okinawa Trough. GY, GD and DL did the work of data processing and visualization. YS and XW checked the validity of the FEM model and made comments about the manuscript text.
This research is supported by the projects of the National Key R&D Program of China (2018YFC0310001), the National Natural Science Foundation of China (91858208 and 42006066) and Shandong Provincial Natural Science Foundation, China (ZR201807100270).
The authors declare that the research was conducted in the absence of any commercial or financial relationships that could be construed as a potential conflict of interest.
We are grateful for the efforts made by the crew members in acquiring the geophysical data. We thank Tingting Wu from Guangzhou Marine Geological Survey for making suggestions concerning improving the imaging quality of the gas plumes. We thank three anonymous reviewers for their constructive comments.
Autin, J., Bellahsen, S., Husson, L., Beslier, M. O., and d’Acremont, E. (2013). The role of structural inheritance in oblique rifting: Insights from analogue models and application to the Gulf of Aden. Tectonophysics, 607, 51–54.
Berné, S., Vagner, P., Guichard, F., Lericolais, G., Liu, Z., Trentesaux, A., et al. (2002). Pleistocene forced regressions and tidal sand ridges in the East China Sea. Mar. Geol. 188 (3-4), 293–315. doi:10.1016/s0025-3227(02)00446-2
Biastoch, A., Treude, T., Rüpke, L. H., Riebesell, U., Roth, C., Burwicz, E. B., et al. (2011). Rising Arctic Ocean temperatures cause gas hydrate destabilization and ocean acidification. Geophys. Res. Lett. 38 (8), 1–5. doi:10.1029/2011GL047222
Cao, H., Sun, Z., Wu, N., Liu, W., Liu, C., Jiang, Z., et al. (2020). Mineralogical and geochemical records of seafloor cold seepage history in the northern Okinawa Trough, East China Sea. Deep Sea Res. Oceanogr. Res. Pap. 155, 103165. doi:10.1016/j.dsr.2019.103165
Cartwright, J., and Santamarina, C. (2015). Seismic characteristics of fluid escape pipes in sedimentary basins: implications for pipe genesis. Mar. Petrol. Geol. 65, 126–140. doi:10.1016/j.marpetgeo.2015.03.023
Ciotoli, G., Procesi, M., Etiope, G., Fracassi, U., and Ventura, G. (2020). Influence of tectonics on global scale distribution of geological methane emissions. Nat. Commun. 11 (1), 2305–2308. doi:10.1038/s41467-020-16229-1
Dale, A. W., Regnier, P., Knab, N. J., Jørgensen, B. B., and Van Cappellen, P. (2008). Anaerobic oxidation of methane (AOM) in marine sediments from the Skagerrak (Denmark): II. Reaction-transport modeling. Geochem. Cosmochim. Acta 72 (12), 2880–2894. doi:10.1016/j.gca.2007.11.039
Dou, Y., Yang, S., Liu, Z., Clift, P. D., Shi, X., Yu, H., et al. (2010a). Provenance discrimination of siliciclastic sediments in the middle Okinawa Trough since 30 ka: constraints from rare earth element compositions. Mar. Geol. 275 (1–4), 212–220. doi:10.1016/j.margeo.2010.06.002
Dou, Y., Yang, S., Liu, Z., Clift, P. D., Yu, H., Berne, S., et al. (2010b). Clay mineral evolution in the central Okinawa Trough since 28 ka: implications for sediment provenance and paleoenvironmental change. Palaeogeogr. Palaeoclimatol. Palaeoecol. 288 (1–4), 108–117. doi:10.1016/j.palaeo.2010.01.040
Dupre, S., Scalabrin, C., Grall, C., Augustin, J., Henry, P., Şengor, A. M. C., et al. (2015). Tectonic and sedimentary controls on widespread gas emissions in the sea of Marmara: results from systematic, shipborne multibeam echo sounder water column imaging. J. Geophys. Res. Solid Earth 120 (5), 2891–2912. doi:10.1002/2014jb011617
Fabbri, O., Monie, P., and Fournier, M. (2004). Transtensional deformation at the junction between the Okinawa trough back-arc basin and the SW Japan Island arc. Geol. Soc. London Spec. Publ. 227 (1), 297–312. doi:10.1144/gsl.sp.2004.227.01.15
Feng, D., Qiu, J., Hu, Y., Peckmann, J., Guan, H., Tong, H., et al. (2018). Cold seep systems in the South China Sea: an overview. J. Asian Earth Sci. 168, 3–16. doi:10.1016/j.jseaes.2018.09.021
Fonseca, L. (2001). A model for backscattering angular response of gassy sediments: applications to petroleum exploration and development programs. Ph.D. thesis. Durham, NH: University of New Hampshire. 36, 56–103.
Geli, L., Henry, P., Zitter, T., Dupre, S., Tryon, M., Cagatay, M. N., et al. (2008). Gas emissions and active tectonics within the submerged section of the North Anatolian Fault zone in the Sea of Marmara. Earth Planet Sci. Lett. 274 (1–2), 34–39. doi:10.1016/j.epsl.2008.06.047
Gennari, G., Spezzaferri, S., Comas, M. C., Ruggeberg, A., Lopezrodriguez, C., and Pinheiro, L. M. (2013). Sedimentary sources of the mud-breccia and mud volcanic activity in the Western Alboran Basin. Mar. Geol. 339, 83–95. doi:10.1016/j.margeo.2013.04.002
Gungor, A., Lee, G. H., Kim, H. J., Han, H. C., Kang, M. H., Kim, J., et al. (2012). Structural characteristics of the northern Okinawa Trough and adjacent areas from regional seismic reflection data: geologic and tectonic implications. Tectonophysics 522–523, 198–207. doi:10.1016/j.tecto.2011.11.027
Heeschen, K. U., Tréhu, A. M., Collier, R. W., Suess, E., and Rehder, G. (2003). Distribution and height of methane bubble plumes on the Cascadia Margin characterized by acoustic imaging. Geophys. Res. Lett. 30 (12). doi:10.1029/2003gl016974
Huguen, C., Mascle, J., Chaumillon, E., Kopf, A., Woodside, J., and Zitter, T. (2004). Structural setting and tectonic control of mud volcanoes from the central mediterranean ridge (eastern mediterranean). Mar. Geol. 209 (1-4), 245–263. doi:10.1016/j.margeo.2004.05.002
Hustoft, S., Dugan, B., and Mienert, J. (2009). Effects of rapid sedimentation on developing the Nyegga pockmark field: constraints from hydrological modeling and 3‐D seismic data, offshore mid‐Norway. Geochem. Geophys. Geosyst. 10 (6). doi:10.1029/2009gc002409
Judd, A. G., Hovland, M., Dimitrov, L. I., Gil, S. G., and Jukes, V. (2002). The geological methane budget at Continental Margins and its influence on climate change. Geofluids 2 (2), 109–126. doi:10.1046/j.1468-8123.2002.00027.x
Kimura, M. (1985). back-arc rifting in the Okinawa trough. Mar. Petrol. Geol. 2 (3), 222–240. doi:10.1016/0264-8172(85)90012-1
Koch, S., Berndt, C., Bialas, J., Haeckel, M., Crutchley, G., Papenberg, C., Haeckel, M., and Greinert, J. (2015). Gas-controlled seafloor doming. Geology, 43 (7), 571–574. doi:10.1016/0025-3227(80)90032-8
Lee, C., Shor, G. G., Bibee, L. D., Lu, R. S., and Hilde, T. W. (1980). Okinawa Trough: origin of a back-arc basin. Mar. Geol. 35 (1–3), 219–241. doi:10.1016/0025-3227(80)90032-8
Letouzey, J., and Kimura, M. (1985). Okinawa Trough genesis: structure and evolution of a backarc basin developed in a continent. Mar. Petrol. Geol. 2 (2), 111–130. doi:10.1016/0264-8172(85)90002-9
Li, A., Cai, F., Wu, N., Li, Q., Yan, G., Sun, Y., et al. (2020). Late Pleistocene shelf-edge delta clinoforms along the rift margin of the northern Okinawa Trough. Geol. J. 55, 6450–6461.
Li, A., Cai, F., Wu, N., Li, Q., Yan, G., Sun, Y., et al. (2021). Structural controls on widespread methane seeps in the back-arc basin of the Mid-Okinawa trough. Ore Geol. Rev. 129, 103950, 1–12. doi:10.1016/j.oregeorev.2020.103950
Li, A., Davies, R. J., and Mathias, S. (2017). Methane hydrate recycling offshore of Mauritania probably after the last glacial maximum. Mar. Petrol. Geol. 84, 323–331. doi:10.1016/j.marpetgeo.2017.04.007
Li, G., Li, P., Liu, Y., Qiao, L., Ma, Y., Xu, J., et al. (2014). Sedimentary system response to the global sea level change in the East China Seas since the last glacial maximum. Earth Sci. Rev. 139, 390–405. doi:10.1016/j.earscirev.2014.09.007
Li, Q., Cai, F., Liang, J., Shao, H., Dong, G., Wang, F., et al. (2015). Geochemical constraints on the methane seep activity in western slope of the middle Okinawa Trough, the East China Sea. Sci. China Earth Sci. 58 (6), 986–995. doi:10.1007/s11430-014-5034-x
Li, Q., Zhang, Q., Li, G., Liu, Q., Chen, M. T., Xu, J., et al. (2019). A new perspective for the sediment provenance evolution of the middle Okinawa Trough since the last deglaciation based on integrated methods. Earth Planet Sci. Lett. 528, 115839. doi:10.1016/j.epsl.2019.115839
Liu, B., Li, S. Z., Suo, Y. H., Li, G. X., Dai, L. M., Somerville, I. D., et al. (2016). The geological nature and geodynamics of the Okinawa Trough, western pacific. Geol. J. 51, 416–428. doi:10.1002/gj.2774
Liu, M., Wang, H., and Li, Q. (2010). Inception of the eastern California shear zone and evolution of the Pacific‐North American plate boundary: from kinematics to geodynamics. J. Geophys. Res. Solid Earth 115 (B7), 1–12. doi:10.1029/2009JB007055
Mazzini, A., Nermoen, A., Krotkiewski, M., Podladchikov, Y. Y., Planke, S., and Svensen, H. (2009). Strike-slip faulting as a trigger mechanism for overpressure release through piercement structures. Implications for the Lusi mud volcano, Indonesia. Mar. Petrol. Geol. 26 (9), 1751–1765. doi:10.1016/j.marpetgeo.2009.03.001
McClay, K., and Bonora, M. (2001). Analog models of restraining stepovers in strike-slip fault systems. Am. Assoc. Pet. Geol. Bull. 85 (2), 233–260. doi:10.1306/8626c7ad-173b-11d7-8645000102c1865d
McGinnis, D. F., Greinert, J., Artemov, Y., Beaubien, S. E., and Wuest, A. (2006). Fate of rising methane bubbles in stratified waters: how much methane reaches the atmosphere? J. Geophys. Res.: Oceans 111 (C9). doi:10.1029/2005jc003183
Myhre, C. L., Ferré, B., Platt, S., Silyakova, A., Hermansen, O., Allen, G., et al. (2016). Extensive release of methane from Arctic seabed west of Svalbard during summer 2014 does not influence the atmosphere. Geophys. Res. Lett. 43 (9), 4624–4631. doi:10.1002/2016gl068999
Nabavi, S. T., Alavi, S. A., Mohammadi, S., Ghassemi, M. R., and Frehner, M. (2017). Analysis of transpression within contractional fault steps using finite-element method. J. Struct. Geol. 96, 1–20. doi:10.1016/j.jsg.2017.01.004
Naudts, L., Greinert, J., Artemov, Y. G., Beaubien, S. E., Borowski, C., and De Batist, M. (2008). Anomalous sea-floor backscatter patterns in methane venting areas, Dnepr paleo-delta, NW Black Sea. Mar. Geol. 251 (3-4), 253–267. doi:10.1016/j.margeo.2008.03.002
Plaza-Faverola, A., and Keiding, M. (2019). Correlation between tectonic stress regimes and methane seepage on the western Svalbard margin. Solid Earth 10 (1), 79–94. doi:10.5194/se-10-79-2019
Plaza-Faverola, A., Pecher, I., Crutchley, G., Barnes, P. M., Bünz, S., Golding, T., et al. (2014). Submarine gas seepage in a mixed contractional and shear deformation regime: cases from the Hikurangi oblique‐subduction margin. Geochem., Geophys., Geosyst. 15 (2), 416–433. doi:10.1002/2013gc005082
Reed, D. L., Silver, E. A., Tagudin, J. E., Shipley, T. H., and Vrolijk, P. (1990). Relations between mud volcanoes, thrust deformation, slope sedimentation, and gas hydrate, offshore North Panama. Mar. Petrol. Geol. 7 (1), 44–54. doi:10.1016/0264-8172(90)90055-l
Riedel, M., Scherwath, M., Römer, M., Veloso, M., Heesemann, M., and Spence, G. D. (2018). Distributed natural gas venting offshore along the Cascadia margin. Nat. Commun. 9, 3264. doi:10.1038/s41467-018-05736-x
Roberts, H. H. (2001). Fluid and gas expulsion on the northern gulf of Mexico continental slope: mud-prone to mineral-prone responses. Nat. Gas Hydrates Geophys. Monogr. ser 124, 145–161. doi:10.1029/gm124p0145
Römer, M., Sahling, H., Pape, T., Bahr, A., Feseker, T., Wintersteller, P., et al. (2012). Geological control and magnitude of methane ebullition from a high-flux seep area in the Black Sea—the Kerch seep area. Mar. Geol. 319-322, 57–74. doi:10.1016/j.margeo.2012.07.005
Römer, M., Wenau, S., Mau, S., Veloso, M., and Bohrmann, G. (2017). Assessing marine gas emission activity and contribution to the atmospheric methane inventory: a multidisciplinary approach from the Dutch Dogger bank seep area (North Sea). Geochem., Geophys., Geosyst. 18 (7), 2617–2633. doi:10.1002/2017gc006995
Sauter, E. J., Muyakshin, S. I., Charlou, J. L., Schlüter, M., Boetius, A., Jerosch, K., et al. (2006). Methane discharge from a deep-sea submarine mud volcano into the upper water column by gas hydrate-coated methane bubbles. Earth Planet Sci. Lett. 243 (3–4), 354–365. doi:10.1016/j.epsl.2006.01.041
Schmidt, M., Hensen, C., Mörz, T., Müller, C., Grevemeyer, I., Wallmann, K., et al. (2005). Methane hydrate accumulation in “Mound 11” mud volcano, Costa Rica forearc. Mar. Geol. 216 (1–2), 83–100. doi:10.1016/j.margeo.2005.01.001
Serié, C., Huuse, M., and Schødt, N. H. (2012). Gas hydrate pingoes: deep seafloor evidence of focused fluid flow on continental margins. Geology 40 (3), 207–210. doi:10.1130/g32690.1
Sibuet, J. C., Deffontaines, B., Hsu, S. K., Thareau, N., Formal, L., and Liu, C. S. (1998). Okinawa trough backarc basin: early tectonic and magmatic evolution. J. Geophys. Res. Solid Earth 103 (B12), 30245–30267. doi:10.1029/98jb01823
Sibuet, J. C., Letouzey, J., Barbier, F., Charvet, J., Foucher, J. P., Hilde, T. W., et al. (1987). Back arc extension in the Okinawa trough. J. Geophys. Res.: Solid Earth 92 (B13), 14041–14063. doi:10.1029/JB092iB13p14041
Smith, A. J., Mienert, J., Bünz, S., and Greinert, J. (2014). Thermogenic methane injection via bubble transport into the upper Arctic Ocean from the hydrate‐charged Vestnesa ridge, Svalbard. Geochem. Geophys. Geosyst. 15 (5), 1945–1959. doi:10.1002/2013gc005179
Somoza, L., Leon, R., Ivanov, M., Fernández-Puga, M., Gardner, J., Hernández-Molina, F., et al. (2003). Seabed morphology and hydrocarbon seepage in the Gulf of Cadiz mud volcano area: acoustic imagery, multibeam and ultra-high resolution seismic data. Mar. Geol. 195 (1–4), 153–176. doi:10.1016/s0025-3227(02)00686-2
Sun, Z., Wei, H., Zhang, X., Shang, L., Yin, X., Sun, Y., et al. (2015). A unique Fe-rich carbonate chimney associated with cold seeps in the Northern Okinawa Trough, East China Sea. Deep-Sea Res. Part I. Oceanogr. Res. Pap. 95, 37–53. doi:10.1016/j.dsr.2014.10.005
Timoshenko, S. P., and Goodier, J. N. (1982). Theory of elasticity. 3rd Edn. Singapore: McGraw-Hill International Editions.
Wang, J., Wu, S., Kong, X., Ma, B., Li, W., Wang, D., et al. (2018). Subsurface fluid flow at an active cold seep area in the Qiongdongnan Basin, northern South China Sea. J. Asian Earth Sci. 168, 17–26. doi:10.1016/j.jseaes.2018.06.001
Watson, S. J., Mountjoy, J. J., Barnes, P. M., Crutchley, G. J., Lamarche, G., Higgs, B., et al. (2019). Focused fluid seepage related to variations in accretionary wedge structure, Hikurangi margin, New Zealand. Geology 48 (1), 56–61. doi:10.1130/g46666.1
Westbrook, G. K., Thatcher, K. E., Rohling, E. J., Piotrowski, A. M., Pälike, H., Osborne, A. H., et al. (2009). Escape of methane gas from the seabed along the West Spitsbergen continental margin. Geophys. Res. Lett. 36 (15). doi:10.1029/2009gl039191
Xu, C., Wu, N., Sun, Z., Zhang, X., Geng, W., Cao, H., et al. (2018). Methane seepage inferred from pore water geochemistry in shallow sediments in the western slope of the Mid-Okinawa trough. Mar. Petrol. Geol. 98, 306–315. doi:10.1016/j.marpetgeo.2018.08.021
Xu, J., Ben-Avraham, Z., Kelty, T., and Yu, H. S. (2014). Origin of marginal basins of the NW Pacific and their plate tectonic reconstructions. Earth Sci. Rev. 130, 154–196. doi:10.1016/j.earscirev.2013.10.002
Yamaji, A. (2003). Slab rollback suggested by latest Miocene to Pliocene forearc stress and migration of volcanic front in southern Kyushu, northern Ryukyu Arc. Tectonophysics, 364 (1‐2), 9–24. doi:10.1002/2014gl060483
Yamamoto, A., Yamanaka, Y., Oka, A., and Abe‐Ouchi, A. (2014). Ocean oxygen depletion due to decomposition of submarine methane hydrate. Geophys. Res. Lett. 41 (14), 5075–5083. doi:10.1002/2014gl060483
Keywords: gas emission, gas plume, multi-beam echo-sounder, Okinawa trough, transtension
Citation: Li A, Cai F, Wu N, Li Q, Yan G, Sun Y, Dong G, Luo D and Wang X (2021) Gas Emissions in a Transtensile Regime Along the Western Slope of the Mid-Okinawa Trough. Front. Earth Sci. 9:557634. doi: 10.3389/feart.2021.557634
Received: 01 May 2020; Accepted: 14 January 2021;
Published: 05 March 2021.
Edited by:
Tamara Baumberger, Oregon State University, United StatesReviewed by:
Moab Praxedes Gomes, Federal University of Rio Grande do Norte, BrazilCopyright © 2021 Li, Cai, Wu, Li, Yan, Sun, Dong, Luo and Wang. This is an open-access article distributed under the terms of the Creative Commons Attribution License (CC BY). The use, distribution or reproduction in other forums is permitted, provided the original author(s) and the copyright owner(s) are credited and that the original publication in this journal is cited, in accordance with accepted academic practice. No use, distribution or reproduction is permitted which does not comply with these terms.
*Correspondence: Ang Li, YW5nLmxpX2NuQG91dGxvb2suY29t
Disclaimer: All claims expressed in this article are solely those of the authors and do not necessarily represent those of their affiliated organizations, or those of the publisher, the editors and the reviewers. Any product that may be evaluated in this article or claim that may be made by its manufacturer is not guaranteed or endorsed by the publisher.
Research integrity at Frontiers
Learn more about the work of our research integrity team to safeguard the quality of each article we publish.