 Derrick R. Vaughn
 Thomas S. Bianchi
 Michael R. Shields1,3
 Todd Z. Osborne
95% of researchers rate our articles as excellent or good
Learn more about the work of our research integrity team to safeguard the quality of each article we publish.
Find out more
ORIGINAL RESEARCH article
Front. Earth Sci. , 08 February 2021
Sec. Biogeoscience
Volume 9 - 2021 | https://doi.org/10.3389/feart.2021.552721
This article is part of the Research Topic The Marine Carbon Cycle: From Ancient Storage to Future Challenges View all 5 articles
Blue carbon habitats, such as mangroves and salt marshes, have been recognized as carbon burial hotspots; however, methods on measuring blue carbon stocks have varied and thus leave uncertainty in global blue carbon stock estimates. This study analyzes blue carbon stocks in northern Florida wetlands along the Atlantic and Gulf coasts. Carbon measurements within 1–3m length vibracores yield total core stocks of 9.9–21.5 kgC·m−2 and 7.7–10.9 kgC·m−2 for the Atlantic and Gulf coast cores, respectively. Following recent IPCC guidelines, blue carbon stock estimates in the top meter are 7.0 kgC·m−2–8.0 kgC·m−2 and 6.1 kgC·m−2–8.6 kgC·m−2 for the Atlantic and Gulf cores, respectively. Changes in stable isotopic (δ13C, C/N) and lignin biomarker (C/V) indices suggest both coastlines experienced salt marsh and mangrove transgressions into non-blue carbon habitats during the mid- to late-Holocene following relative sea-level rise. These transgressions impact carbon storage within the cores as the presence of carbon-poor soils, characteristic of non-blue carbon habitats, result in lower 1m carbon stocks in north Florida Gulf wetlands, and a deeper extent of carbon-rich soils, characteristic of blue carbon habitats, drive higher 1m and total carbon stocks in north Florida Atlantic wetlands. Future blue carbon research should assess carbon stocks down to bedrock when possible, as land-cover and/or climate change can impact different depths across localities. Ignoring carbon-rich soil below the top meter of soil may underestimate potential carbon emissions based on these changes.
Blue carbon describes organic carbon (OC) sequestered and buried within vegetated coastal ecosystems such as salt marshes, mangroves, and seagrass meadows (McLeod et al., 2011; Hopkinson et al., 2012). While the terms blue carbon sequestration and burial refer to the uptake of CO2 within a wetland and the accumulation of carbon belowground, respectively, the total carbon stored in the soil and within living and non-living biomass of blue carbon ecosystems is the blue carbon stock (Windham-Meyers et al., 2019). Belowground blue carbon stocks have been measured to various depths in coastal ecosystems around the world, making it harder to compare habitat types and areas to each other, (e.g. Thorhaug et al., 2019). Estimating global blue carbon stock is thus still an active research area (Pendleton et al., 2012) with increasing necessity as anthropogenic activity and relative sea-level rise (RSLR) potentially re-introduce these stocks into the modern carbon cycle, (e.g. Ward et al., 2019).
The Intergovernmental Panel on Climate Change (IPCC) recently standardized the estimation of belowground blue carbon as that within the upper meter of soil using the assumption that carbon within this interval is the most vulnerable to land-use or land-cover change (Hiraishi et al., 2014). Blue carbon stocks along the Gulf of Mexico (GoM), using this top meter reference, are estimated to be as much as three times higher than blue carbon stocks along the Atlantic shoreline (Kennedy et al., 2013), with ∼82Tg OC stored within Florida GoM salt marshes (Thorhaug et al., 2019). Despite these stock estimates, restricting carbon stocks to the top meter of soil may grossly underestimate carbon deposited by blue carbon ecosystems, which may potentially extend several meters in depth (Adame et al., 2018; Thorhaug et al., 2019; Kauffman et al., 2020). Additionally, the depth at which carbon becomes susceptible to remobilization varies between locations (Murray et al., 2011) with GoM coastal wetlands potentially eroded deeper than the top meter, (e.g. Sapkota and White, 2019). Thus, while restricting blue carbon to the top meter may improve global blue carbon comparisons, soil carbon stocks should ideally be measured down to the bedrock or coral sands that underlay the entire blue carbon stock (Kauffman and Donato, 2012).
Soil cores can be used to estimate carbon stocks and track historical environmental and climate changes through stratigraphic sequences. Stratigraphic sequences within northern Florida soil cores could reflect wetland migration over the mid-to late-Holocene related to relative sea-level (RSL) height and in the rates of RSLR, (e.g. Reinson, 1992; Parkinson and White, 1994; Yao and Liu, 2017). Many previous studies have used isotopes (e.g., Chmura and Aharon, 1995; Choi et al., 2001; Wilson et al., 2005; Kemp et al., 2012) and biomarkers (e.g., Tareq et al., 2004; Hutchings et al., 2019) to examine millennial-scale ecosystem changes based on separating different vegetation types, and their corresponding ecosystems, by their isotopic and biomarker composition, (e.g. C3vs. C4 vegetation separated with carbon isotopes and woody vs. nonwoody vegetation separated using lignin biomarker indices). The primary goal of this study is to assess belowground blue carbon stocks within vibracores from northern Florida wetlands and analyze these stratigraphic sequences for bulk isotopes and biomarkers. This would allow us to track environmental changes, (e.g. blue carbon vs. non-blue carbon) contributing to the soil carbon and will provide a better estimate of carbon stocks for Florida GoM and Atlantic wetlands.
The northeastern Florida/Atlantic coast study site is in St. Augustine, Florida at Anastasia Island (Figure 1). Anastasia Island is a barrier island, running parallel from the mainland in a north-south direction and separated by a narrow brackish estuary known as the Matanzas River (Gallivan and Davis, 1981). Anastasia Island has an extensive tidal salt marsh habitat, with patches of mangrove vegetation that advance and retreat with changing winter air temperatures (Rodriguez et al., 2016). Mangrove vegetation in St. Augustine is dominated by Avicennia germinans L. with some scattered Rhizophora mangle, whereas low salt marshes are dominated by Sporobolus alterniflorus and Batis maritima and high salt marshes dominated by Juncus romerianus.
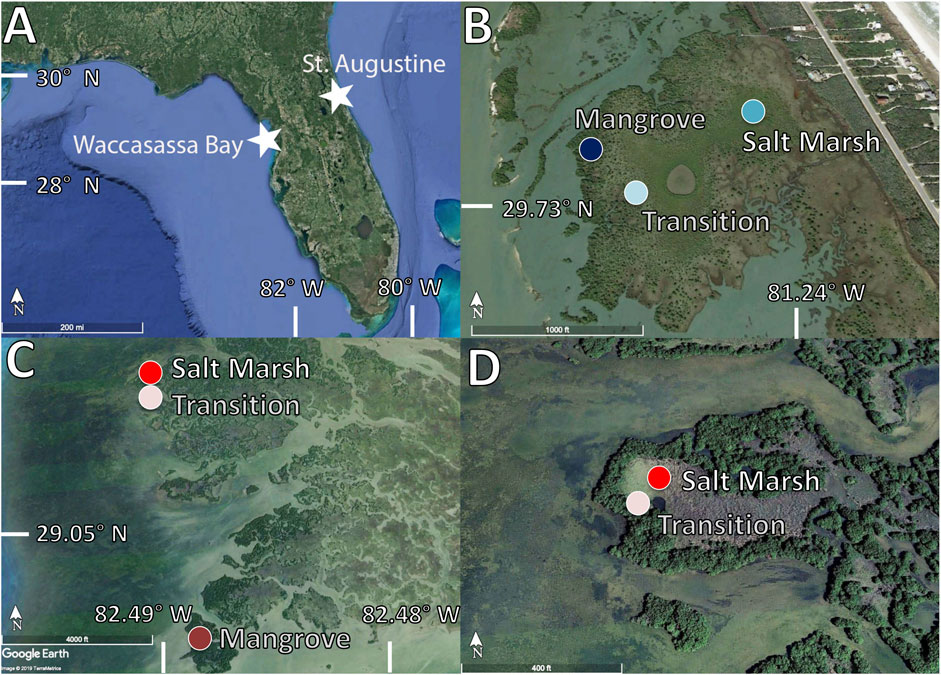
FIGURE 1. (A) Map of Florida (Google Earth, 2019) showing the two northern coastal wetland sites (B) Vibracore locations in St. Augustine (Google Earth, 2019) in a mangrove vegetation zone (dark blue), a salt marsh vegetation zone (medium blue) and a transition zone (light blue)(C) Vibracore locations in Waccasassa Bay (Google Earth, 2019) in a mangrove vegetation zone (dark red), a salt marsh vegetation zone (medium red) and a transition zone (light red)(D) A zoom in on the saltmarsh (medium red) and transition (light red) locations in Waccasassa Bay (Google Earth, 2019).
Barrier islands along the northern Florida Atlantic coast, such as Anastasia Island, emerged ∼7,000 to 9,000yrs. B.P., when RSLR decelerated significantly and have retreated towards land since their initial development in response to rising RSL and subsequent erosion of the shoreface surface by waves (Parkinson and White, 1994). As the islands transgress inland, environments surrounding them should also migrate laterally with RSLR and be reflected as changes in sedimentary sequences, (e.g. Reinson, 1992; Parkinson and White, 1994). RSLR reconstruction around the northern Florida Atlantic coast suggests there was a ∼5.7m rise in RSL over the last 8,000years B.P. related to the collapsing forebulge of the former Laurentide Ice Sheet (Hawkes et al., 2016), though the RSLR rates were not constant through time. RSLR rates decreased between 7,800–5,000yrs. B.P., plateaued from 5,000 to 3,000yrs. B.P., increased between 3,000–2,300yrs. B.P., and continuously decreased to the present. The slowdown and plateau from 5,000 to 3,000yrs. B.P. may have resulted from local processes and thus may not be a regional signal (Hawkes et al., 2016).
The coring site along the northwestern/GoM coast of Florida is in Waccasassa Bay Preserve State Park (Figure 1), located in part of the Gulf referred to as the Big Bend. The Big Bend is relatively undeveloped and known for vast expanses of tidal salt marshes and coastal forests (Abbott and Judd, 2000) with increasing mangrove coverage as temperatures increase (Osland et al., 2012; Doughty et al., 2016). This region of Florida sits upon a flat and broad carbonate platform (known as the Florida Platform; Chen, 1965; Brooks, 1982), which forms a low gradient along the coastline (1:5,000) (Hine et al., 1988). Much of the Big Bend coastline extending 3–10km inland falls below the 1m elevation contour (Geselbrach et al., 2011). When combined with weak characteristics of winter extratropical storms and relatively small fetch of the GoM, this low gradient helps create the low-energy coastline of the Big Bend (Hine et al., 1988). The dominant salt marsh vegetation in this area includes the C3 grass J. roemerianus, commonly present in the high marsh, and the C4 grasses S. alterniflorus, Distichlis spicata, and Spartina Patens, which are all more common in the low marsh. The low marsh adjacent to the Gulf is also occupied by mangroves, dominated by A. germinans, with Rhizophora mangle intermixed.
The current Big Bend coastline has very little siliciclastic sediment as much of the sediment carried through rivers gets entrained in estuaries before reaching the coast (Hine and Belknap, 1986; Hine et al., 1988; Davis, 1997). Instead, most sediment in modern-day coastal features comes from the reworking of older siliciclastic sediment by waves scouring older sediments along the shallow inner shelf and the production of carbonate skeletal sediments by marine organisms. Slow rates of RSLR over the past ∼3,000 years have allowed for the development of a nearly constant shoreline position (Wright et al., 2005; Gerlach et al., 2017). Prior to this, RSL during the early to mid-Holocene was lower and likely influenced the positioning of the ground water table in this carbonate-dominated region given its location near the coast, (e.g. Goodbred et al., 1998; Gully et al., 2016). As RSL rose, the groundwater table near the coast would have also risen, changing the environmental conditions from a dry environment to a wetter environment that allowed marsh vegetation to develop (e.g. Goodbred et al., 1998).
Vibracores 1–3m in length (0.07m interior diameter) were collected from both coasts of Florida at three sites characterized by differing dominant vegetation: salt marsh, mangrove, and a transition (juvenile mangroves currently invading the salt marsh). The aim for each core was to collect soil to a depth in which bedrock or coral sands was sampled. If bedrock or coral sands was not reached, as was the case for the St. Augustine cores, the depth of the cores was based on the length of the core tubes (∼3m). In St. Augustine, the mangrove core was collected at 29°43′41″N, 81°14′43″W; the low salt marsh site was collected at 29°43′43″N, 81°14′28″W, and the transition core was collected at 29°43′44″N, 81°14′36″W. In Waccasassa Bay, the mangrove core was collected at 29°04′39″N, 82°48′57″W; the high salt marsh site was collected at 29°05′49″N, 82°49′15″W, and the transition core was collected at 29°05′47″N, 82°49′15″W. The mangrove site in Waccasassa Bay had an additional core collected only a few meters away from the first mangrove core (termed primary mangrove core from hereon) to test for spatial variability; however, this second core (termed from hereon as secondary mangrove core) was only tested for organic carbon analyses (total organic carbon, TOC, and carbon isotopes, δ13C).
The cores were transported to the University of Florida, where they were split, described, and passed through a Geotek multi-sensor core logger (MSCL) to photograph and measure bulk densities. Bulk density is also calculated from differences in weights before and after freeze-drying. Subsamples of cores were taken in 2cm intervals, only collecting from the middle of each core to avoid draw-down effects of plants or topsoils. Belowground biomass was not separated or removed from soils assuming root biomass turnover would contribute to sediment formation (Twilley et al., 1992; Chmura et al., 2003; Castañeda-Moya et al., 2011; Smoak et al., 2012; Breithaupt et al., 2012). Following subsample collection, samples were freeze-dried, weighed, and transferred into pre-combusted (450°C for 4h) 60ml glass bottles to be homogenized with stainless steel rods on a roller mill (Arnold and Schepers, 2004). Volume for bulk density came from multiplying the square of the vibracore’s interior radius (0.035m) by pi and the height of each subsample (0.02m).
Samples from each core were measured for bulk isotopes (TOC, δ13C, and C/N) every 2cm up to 40cm and then every 6cm starting from 46cm to the bottom of each core. The secondary mangrove core was only tested for bulk carbon isotopes every ∼6cm down to 140cm (core length extended down to 166cm) where there was peaty material observed. Biomarkers (lignin and amino acids) were also measured on these cores (excluding the secondary mangrove core) every 4cm from 2cm to 38cm and then every 6cm starting at 46cm to the bottom of the cores.
Charcoal and woody plant fragments from the base of each St. Augustine core, as well as the lowest layers containing charcoal and woody plant fragments from each Waccasassa Bay core, were picked prior to homogenization of the soils and subjected to acid-base-acid (ABA) treatment to remove exogenous carbon in or on the picked material (Santos and Ormsby, 2013). Picked charcoal and woody plant fragments were also taken from various points along the St. Augustine cores where there appeared to be changes in lithology. Pre-treated picked samples were submitted to the National Ocean Sciences Accelerator Mass Spectrometry (NOSAMS) facility. Radiocarbon ages generated from the St. Augustine picked samples are used to generate an age-depth model, with dates for each subsample obtained by the age-depth R package BACON (Bayesian Accumulation Histories; Blaauw and Christen, 2011; see Supplementary Figures S3–S5 for age-depth models generated by BACON). Conversely, picked samples from the Waccasassa Bay cores almost all came back modern (Fm > 1.0) and are thus not used to generate an age-depth model (Section Dating Challenges). Two other sample sets were submitted for radiocarbon analysis in the Waccasassa Bay cores, one included untreated bulk, unground sediments collected from the same intervals as the samples that were previously picked. The other set included untreated bulk carbonates from the base of each Waccasassa Bay core. Both sets, however, are also not used to create an age-depth model; thus, Waccasassa Bay data is plotted against depth. St. Augustine data is plotted against age in the main text but plots against depth are available as supplemental figures (Supplementary Figures S7–S8, S10–S11, and S12).
Soil samples were analyzed for TOC, total nitrogen, and for the stable isotopes of carbon and nitrogen using a Carlo Erba 1500 CN elemental analyzer coupled to a Thermo Electron DeltaV Advantage isotope ratio mass spectrometer in the Stable Isotope Mass Spectrometry Laboratory in the University of Florida’s Department of Geological Sciences. Samples for TOC and the stable isotopes of carbon were treated with acid fumigation (8h) in silver capsules using 12M HCl to remove inorganic carbon (Harris et al., 2001) and immediately dried at 60°C. Nitrogen and OC concentrations are recorded as percentages of dry sediment, while carbon stable isotope data are reported in δ13C (‰) notation relative to the Vienna Pee Dee Belemnite (VPDB) standard. The ratio C/N is based on the molar ratio of total carbon to nitrogen.
Total carbon stock for each sediment core is calculated using:
Samples are identified by n and sampling interval is the length of the sample (2 or 6cm). Carbon burial rates are calculated by dividing core stocks by the age of the interval studied. A mean relative standard deviation (RSD) of 5% is applied to core stocks based on subsampling errors where a 1mm error in sampling a 2cm section of core leads to 5% error in bulk density (Shields et al., 2017).
Lignin-phenols were extracted and analyzed along with other cupric oxide (CuO) oxidation products from freeze-dried soil using the cupric oxide method of Hedges and Ertel (1982), modified by Louchouarn et al. (2010), and reported in detail in Shields et al. (2016). Total lignin is quantified as the summation of vanillyl (V), syringyl (S), and cinnamyl (C) phenols and is normalized to 100mg of OC (Λ-8). Similarly, Λ-6 represents the summation of V and S phenols normalized to 100mg of OC. Since lignin is considered a biopolymer found almost exclusively in terrestrial plants (Hedges and Mann, 1979; Ertel et al., 1984; Ertel and Hedges, 1984, 1985; Hedges and Oades, 1997), total lignin represents relative vascular plant inputs to soil organic matter. Ratios of C/V and S/V are often used to indicate lignin sources (Hedges et al., 1988), where V phenols are ubiquitous among plant tissues and types, C phenols are found primarily from soft tissues (needles, grasses, and leaves), and S phenols are found primarily from angiosperms. Thus, C/V is used to estimate nonwoody vs. woody contributions and S/V is used to separate angiosperm and gymnosperm contributions (Ertel and Hedges, 1984). Oxidative degradation and leaching of lignin can alter these ratios (Hedges et al., 1988; Opsahl and Benner, 1995; Hernes et al., 2007; Jex et al., 2014), thus caution should be applied when interpreting changes in these ratios. To better understand degradation state of lignin, acid-to-aldehyde ratios of V and S phenols ((Ad:Al)v and (Ad:Al)s, respectively) have been used as indicators of lignin oxidation by fungi and other microbes (Hedges et al., 1988; Opsahl and Benner, 1995; Otto and Simpson, 2006). For (Ad:Al)v, fresh tissues are typically <0.3 and highly degraded material (via oxidative degradation) have ratios >0.6 (Hedges et al., 1998) (Ad:Al)s in fresh tissues and highly degraded tissues have ratios <0.14 and >0.16, respectively (Hedges et al., 1998).
Nineteen amino acids were analyzed using methods in Hutchings et al. (2018): hydroxyproline (Hyp), serine (Ser), glycine (Gly), aspartic acid (Asp), threonine (Thr), glutamic acid (Glu), alanine (Ala), proline (Pro), gamma-aminobutyric acid (GABA), muramic acid (MurA), valine (Val), diaminopimelic acid (DAPA), tyrosine (Tyr), histidine (His), lysine (Lys), isoleucine (Ile), leucine (Leu), arginine (Arg), and phenylalanine (Phe). The average instrumental relatively standard deviation for compounds was 10%, ranging from 7% (Pro) to 14% (Gly).
Amino acids form the building blocks of proteins and are more ubiquitous than lignin, making them more representative of total soil organic matter. Total hydrolysable amino acids (THAA) sums the nineteen amino acids normalized to OC. The percentage of which amino acids made of the total nitrogen pool (AA N%) is calculated using (Philben et al., 2014):
YieldAA/N is the N-normalized concentration of an amino acid in mg AA (100mg·N)−1 and Wt% (N)AA is the weight %N in the amino acid.
The mole percent of each amino acid is used in a principal component analysis (PCA; Supplementary Figure S13) to generate an amino acid degradation index (DI) (Dauwe et al., 1999; Philben et al., 2016):
Vari is the mole percent of each amino acid, Avgi is the mean of the amino acids in the data set, SDi is the standard deviation of the amino acids, and PC1i represents the score of the amino acids on the first principal component axis. Lower DI values indicate more degraded or altered soils.
Carbon-normalized concentration of individual amino acids can also be used to indicate OC sources to the soil. Hyp is found in plant structural proteins and in some algae (Gotelli and Cleland, 1968; Kieliszewski and Lamport, 1994; Philben and Benner, 2013) and tends to increase with decomposition (Philben and Benner, 2013). Amino acids MurA and DAPA have been used as bacterial OC indicators, while GABA is often used as an OC diagenetic state indicator (e.g. Philben et al., 2016; Hutchings et al., 2019).
Statistical testing is used to determine whether measured parameters are significantly different between single cores collected from three different vegetation sites along the two coastlines. Significance is tested using a balanced bootstrap approach with 10,000 iterations using the statistical computing software R (R Core Team, 2019). This gives 95% confidence intervals (CI) of the bootstrapped means for each core. Cores are considered significantly different if their 95% CI do not overlap, equivalent to having a p-value < 0.05.
Core lithologies differ between coastlines with the base of the Waccasassa Bay cores consisting of dark and light gray sands with shell fragments (termed Unit WB1, WB = Waccasassa Bay and SA = St. Augustine, see Table 1 for unit depths; Supplementary Figure S1) and the base of the Atlantic coast cores consisting of medium-to dark-brown sands (Unit SA1; Supplementary Figure S2). WB1 progrades up-core into black- to grey-mud lithofacies (Unit WB2), which then progrades to brown muds and peat-like soils (Unit WB3; Supplementary Figure S1). The secondary mangrove core from the Gulf coast displays similar unit depths to the primary mangrove core with respect to the three lithological units; however, part the secondary mangrove core between 118–128cm is missing, likely due to separation from being stored vertically. The top meter of the secondary mangrove core is undisturbed. The St. Augustine cores prograde from SA1 to SA2, which consisted of gray, muddy sands. SA2 then progrades into more brown and peat-like lithofacies near the surface of each core (Unit SA3; Supplementary Figure S2).
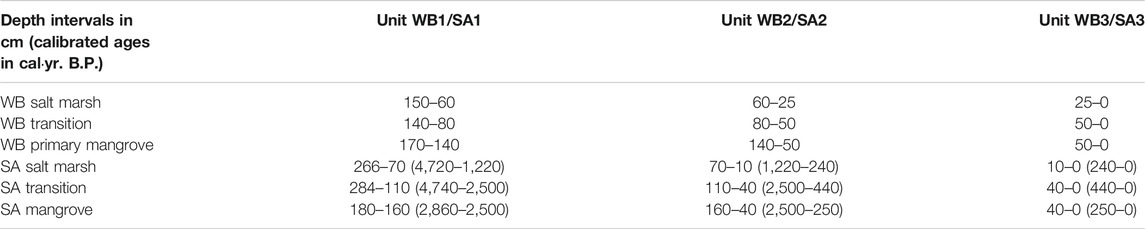
TABLE 1. Depth Intervals (cm) and calibrated radiocarbon ages (cal. yr. B.P.; only for the St. Augustine cores) for the three lithological units of the Waccasassa Bay (WB) and St. Augustine (SA) salt marsh, mangrove, and transition cores.
Picked, pre-treated charcoal and plant fragments were used to generate dates from the bottom of each St. Augustine core (176, 266, and 284cm for mangrove, marsh, and transition, respectively) and for the lowest depths in the Waccasassa Bay cores containing sufficient amounts of charcoal and/or plant fragments (88cm in the saltmarsh and transition cores, 152cm in the primary mangrove core, and 136cm in the secondary mangrove core). Picked samples from Waccasassa Bay yielded modern ages and were not used to generate an age-depth model. The St. Augustine cores had additional picked, pre-treated samples collected from the 50cm depth in all three cores and at 110cm in the St. Augustine transition core.
The bottom of the St. Augustine mangrove, salt marsh, and transition cores give calibrated ages of 2,860cal·yr. B.P., 4,720cal·yr. B.P., and 4,740cal·yr. B.P., respectively. Apparent sedimentation rates based on these ages for the St. Augustine mangrove, salt marsh, and transition cores are all 0.6mm·yr−1. The calibrated ages for the St. Augustine mangrove, salt marsh, and transition cores at 50cm are 310cal·yr. B.P., 860cal·yr. B.P., and 530cal·yr. B.P., respectively. Apparent sedimentation rates based on these ages for the mangrove, salt marsh, and transition cores are 1.6mm·yr−1, 0.6mm·yr−1, and 0.9mm·yr−1, respectively. The St. Augustine transition core at 110cm has a calibrated age of 2,530cal·yr. B.P., which gives an apparent sedimentation rate of 0.4mm·yr−1. Using these dated intervals for the St. Augustine cores, the lithological units have been assigned calibrated ages (Table 1).
Since picked samples from Waccasassa Bay are modern, bulk sediment, which represents the integration of a mixture of components with different ages, and carbonate samples were submitted to look for non-modern sediment ages. The primary mangrove bulk sample at 152cm yields a modern age, whereas the transition and salt marsh bulk samples at 88cm yield uncalibrated ages of 840 (SD ± 20) 14C-yrs B.P. and 1,530 (SD ± 25) 14C-yrs B.P., respectively. Apparent sedimentation rates for the salt marsh and transition cores at 88cm are 1.05 (SD ± <0.002) mm·yr−1 and 0.6 (SD ± <0.0009) mm·yr−1, respectively.
Bulk carbonate samples from the Waccasassa Bay salt marsh, primary mangrove, and transition cores yield uncalibrated radiocarbon ages of 39,400 (SD ± 730) 14C-yrs B.P. at 150cm, 49,200 (SD ± 2,500) 14C-yrs B.P. at 174cm, and 48,400 (SD ± 3,300) 14C-yrs B.P. at 142cm, respectively. These dates are near the limit for reliable radiocarbon dates and the carbonates, which do not take up carbon directly from the atmosphere but from marine DIC, may need a reservoir age effect applied to establish a more accurate age (Mc Connaughey and Gillikin, 2008). Only a few carbonate reservoir effects have been established in the GoM. An average GOM reservoir age was determined to be 238 ± 10 14C yr (Wagner et al., 2009). However, this was based on marine coral and given the proximity of these carbonates to the coastline, these samples may have been influenced by 14C-depleted DIC coming from limestone deposits, (e.g. Pearson and Hanshaw, 1970; Wigley et al., 1978; Hadden and Cherkinsky, 2015). Another reservoir-age correction is based on shell material collected from the panhandle of Florida (further northwest of Waccasassa Bay) in locations affected by high freshwater discharge and depleted 14C signals (Hadden and Cherkinsky, 2015); however, there is a large amount of variability in the age estimates between shells (−3 ± 30 to 659 ± 30 14C yr.). Despite these issues, the reported uncalibrated dates are similar to dates reported in salt marsh soils from similar depths near the Waccasassa River in Waccasassa Bay Preserve State Park (Goodbred et al., 1998). Apparent sedimentation rates throughout the entire mangrove, salt marsh, and transition cores based on these ages are 0.04mm·yr−1, 0.04mm·yr−1, and 0.03mm·yr−1, respectively. Given the modern ages for picked samples, the modern age for bulk sediments in the primary mangrove core, and the much older carbonate ages, an age-depth model is not created for the Waccasassa Bay cores. Instead, isotope and biomarker data for Waccasassa Bay are plotted against depth.
TOC for each core is split into the three lithological units (SA1– SA3 and WB1–WB3; Figure 2). Out of all units, TOC is significantly highest in the Waccasassa Bay transition WB3 (Supplementary Table S1). Within St. Augustine cores, the transition SA3 is significantly higher in TOC compared to all other St. Augustine units. Individual SA3 units are all significantly higher in TOC compared to their respective SA2 and SA1 units. SA2 TOC is significantly higher than SA1 in the St. Augustine mangrove and salt marsh cores. Waccasassa Bay TOC displayed similar patterns, with WB3 being significantly higher in TOC than the respective WB2 and WB1 units. WB2 is also significantly higher in TOC than WB1 in all three Waccasassa Bay cores. There are no significant differences between the two Waccasassa Bay mangrove cores for TOC and δ13C (Supplementary Figure S6), suggesting the primary mangrove core can be considered representative of the mangrove coring location.
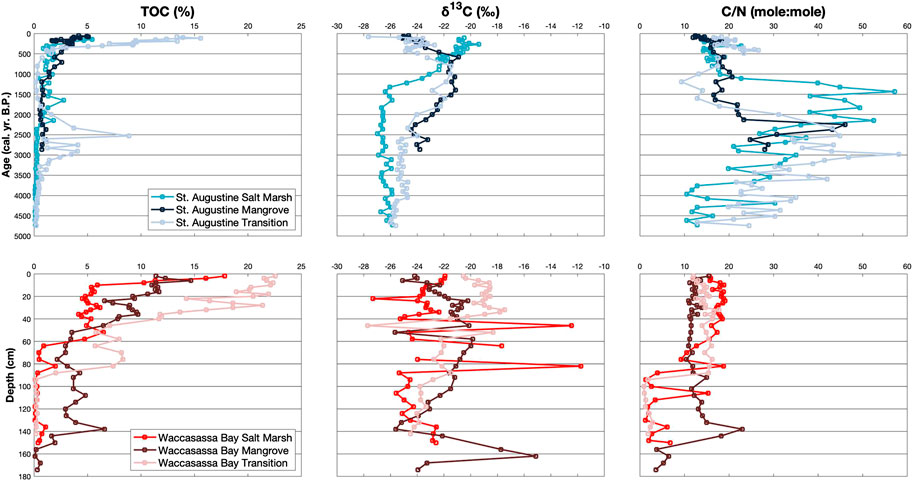
FIGURE 2. Down-core measurements of TOC (%), δ13C (‰), and C/N for cores in St. Augustine (top blue plots) and Waccasassa Bay (bottom red plots). St. Augustine cores are plotted against calibrated ages (cal. yr. B.P.) and Waccasassa Bay cores are plotted against depth (cm).
Carbon stocks (mean ± SD) in the St. Augustine mangrove, salt marsh, and transition cores are 9.9 (±0.5) kg·C·m−2, 10.2 (±0.05) kg·C·m−2, and 21.5 (±0.1) kg·C·m−2, respectively. Carbon stocks for the Waccasassa Bay primary mangrove, salt marsh, and transition cores are 10.9 (±0.5) kg·C·m−2, 7.7 (±0.4) kg·C·m−2, and 9.4 (±0.5) kg·C·m−2, respectively. Carbon burial rates (mean ± SD) are calculated for the St. Augustine cores utilizing the calibrated ages and their respective soil depths. The St. Augustine salt marsh core at 860cal·yr. B.P. has a carbon burial rate of 3.7 (±0.2) gC·m2 yr−1, whereas a burial rate of 2.2 (±0.1) gC·m2 yr−1 is recorded in that core at 4,700cal·yr. B.P. The St. Augustine mangrove core at 305cal·yr. B.P. recorded a burial rate of 12.7 (±0.6) gC·m2 yr−1, while 2,860cal·yr. B.P. in the mangrove core recorded 3.5 (±0.2) gC·m2 yr−1. The St. Augustine transition core has three depths dated, recording burial rates of 9.3 (±0.5) gC·m2 yr−1at 530cal·yr. B.P., 4.4 (±0.2) gC·m2 yr−1at 2,530cal·yr. B.P., and 4.5 (±0.2) gC·m2 yr−1 at 4,740cal·yr. B.P.
δ13C in the St. Augustine cores is significantly more enriched in the middle unit (SA2) of the transition and mangrove cores compared to the upper-most (SA3) and lower-most (SA1) units (Figure 2; Supplementary Table S1). The St. Augustine transition is also significantly more enriched in SA3 compared to SA1. The St. Augustine salt marsh has significantly more enriched δ13C in SA3 compared to SA2 and SA1. The salt marsh SA2 is also significantly more enriched than SA1. Within Waccasassa Bay, there is no significant differences in δ13C values between units of the mangrove and salt marsh cores, though some depletion in the bootstrap mean is recorded from the lower-most units (WB1) to the upper-most units (WB3). The Waccasasssa Bay transition is significantly more δ13C enriched in WB3 and middle (WB2) units compared to WB1.
C/N in St. Augustine is significantly higher in SA1 compared to SA2 and SA3 units for all three cores (Figure 2; Supplementary Table S1). The St. Augustine mangrove and salt marsh cores additionally have significantly higher C/N in their SA2 compared to their SA3. In contrast, the Waccasassa Bay transition and salt marsh cores have significantly higher C/N in their WB2 and WB3 units compared to their respective WB1 units. There are no significant differences between units for the Waccasassa Bay mangrove core.
Not all samples could be analyzed for lignin as the recoveries, based on internal recovery standards (EVAL and MCAD), were low despite replication. These low recoveries occurr near the base of cores with low TOC, (e.g. Atlantic salt marsh ∼4,700–4,100cal·yr. B.P.) and thus may have been the result of sorption of phenols onto soil minerals (Hernes et al., 2007; Hernes et al., 2013).
Total lignin normalized to OC (Λ-8) is not higher in one coast compared to the other (Figure 3; Supplementary Table S2). Within St. Augustine, Λ-8 is significantly higher in SA3 for all cores compared to their respective SA1, with SA3 in the transition core also being significantly higher than the transition’s SA2. For Waccasassa Bay, all cores show significantly higher Λ-8 in WB2 and WB3 compared to WB1. The summation of V and S phenols normalized to 100mg of OC (Λ-6) show similar results, with Λ-6 in Waccasassa Bay being significantly higher in WB2 and WB3 of all cores compared to WB1 (Supplementary Figure S9; Supplementary Table S2). For St. Augustine, two cores (mangrove and transition) have significantly higher Λ-6 in the SA3 compared to SA1.
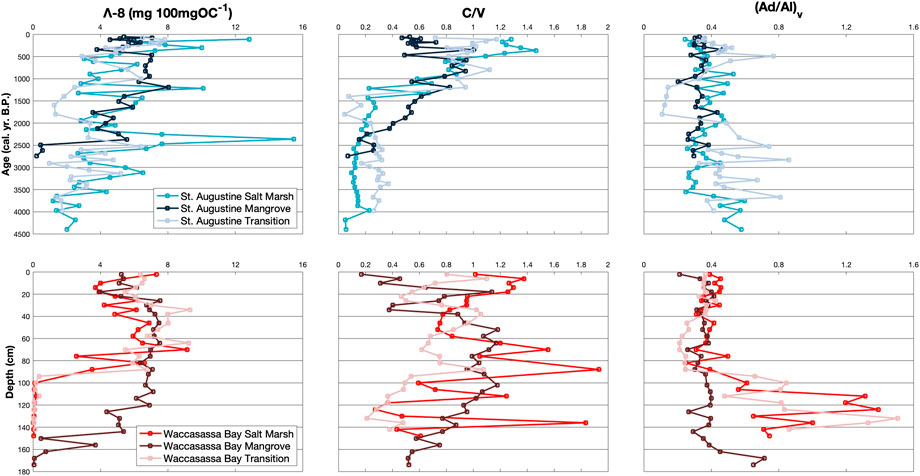
FIGURE 3. Down-core measurements of Λ-8 (mg 100mgOC−1), C/V, and (Ad/Al)v for cores in St. Augustine (top) and Waccasassa Bay (bottom). St. Augustine cores are plotted against calibrated ages (cal. yr. B.P.) and Waccasassa Bay cores are plotted against depth (cm).
Lignin source parameters, C/V (Figure 3; Supplementary Table S2) and S/V (Supplementary Figure S9; Supplementary Table S2), have significant differences between units. For St. Augustine, C/V is significantly higher in SA2 and SA3 for all cores compared to SA1. In contrast, S/V in St. Augustine is significantly higher in SA1 compared to SA2 for all cores and compared to SA3 for the salt marsh and mangrove cores. In Waccasassa Bay, C/V is significantly higher in WB3 compared to WB2 for the salt marsh core and to WB1 for the transition. WB2 for the Waccasassa Bay mangrove core is significantly higher in C/V compared to WB3 and WB1. S/V in Waccasassa Bay is significantly higher in WB2 for all cores compared to WB1, whereas only the salt marsh and transition cores have significantly higher S/V in WB3 compared to the WB1.
Lignin degradation parameters (Ad/Al)v (Figure 3; Supplementary Table S2) and (Ad/Al)s (Supplementary Figure S9; Supplementary Table S2) display different relationships between cores and between coasts. In St. Augustine (Ad/Al)v and (Ad/Al)s are not significantly different between units in the mangrove and transition cores. (Ad/Al)v is, however, significantly higher in SA1 and SA2 in the St. Augustine salt marsh compared to SA3. In contrast (Ad/Al)s is significantly higher in SA2 and SA3 of the St. Augustine salt marsh compared to SA1. Similar to St. Augustine (Ad/Al)v in Waccasassa Bay salt marsh and transition cores is significantly higher in WB1 compared to WB2 and WB3. Unlike St. Augustine (Ad/Al)s in Waccasassa Bay is significantly higher in WB1 compared to WB2 for the mangrove, transition, and salt marsh cores with the salt marsh also having significantly lower (Ad/Al)s in WB3 compared to WB1.
Total amount of hydrolyzable amino acids (THAA) increases up-core for all cores (Figure 4; Supplementary Table S3). THAA is significantly higher in the top two units of the cores (SA2, SA3, WB2, WB3) compared to their bottom unit (SA1, WB1); however, only the St. Augustine mangrove and the Waccasassa Bay salt marsh and primary mangrove cores have significantly higher THAA in the upper-most unit (SA3 and WB3) compared to their middle unit (SA2 and WB2). Waccasassa Bay cores have significantly higher THAA in WB3 compared to SA3 in St. Augustine cores. The St. Augustine mangrove SA3 is significantly higher than the St. Augustine transition SA3. Similarly, the Waccasassa Bay mangrove WB3 is significantly higher than WB3 in the Waccasassa Bay salt marsh and transition cores. Unit WB2 is significantly higher in the Waccasassa Bay transition compared to the Waccasassa Bay salt marsh and mangrove cores.
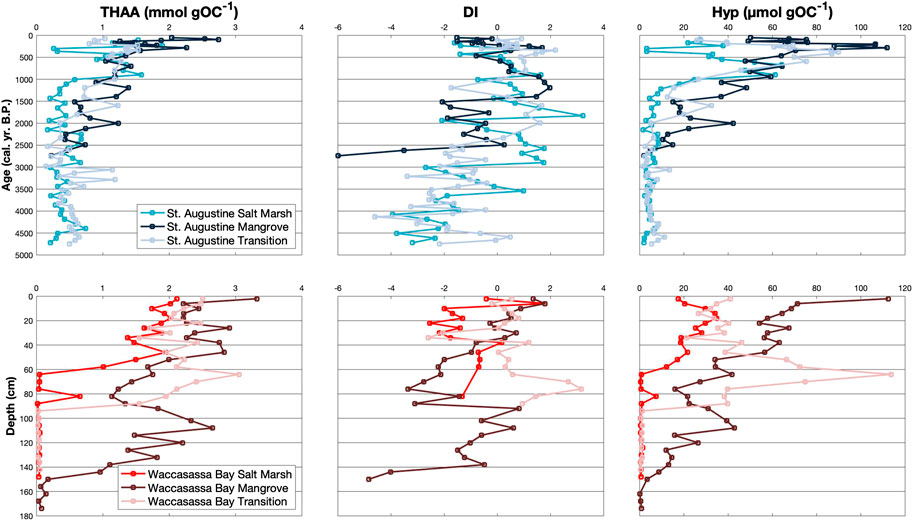
FIGURE 4. Down-core measurements of THAA (mmol gOC−1), DI, and Hyp (μmol gOC−1) for cores in St. Augustine (top) and Waccasassa Bay (bottom). St. Augustine cores are plotted against calibrated ages (cal. yr. B.P.) and Waccasassa Bay cores are plotted against depth (cm).
Similar to THAA, AA N% also increases up-core for all cores (one exception being an insignificant decrease from the Waccasassa Bay transition WB2 to WB3; Supplementary Figure S12; Supplementary Table S3). All cores have significantly higher AA N% in the upper-most units (SA3, WB3) compared to their lower-most units (SA1, WB1). For Waccasassa Bay, WB2 for all cores is significantly higher in AA N% compared to WB1 and WB3. In St. Augustine, SA3 within the mangrove core has significantly higher AA N% compared to the salt marsh and transition cores. Comparing between coasts, the Waccasassa Bay WB3 is significantly higher than the St. Augustine SA3 for all cores. In contrast, the Waccasassa Bay WB1 is significantly lower than the St. Augustine SA1 for the salt marsh and transition cores.
Significant differences in the degradation index, DI, are not as consistent as the other amino acid parameters (Figure 4; Supplementary Table S3). DI in the St. Augustine mangrove and the Waccasassa Bay salt marsh cores is not significantly different between units, whereas some cores have significantly higher DI values in the upper-most units compared to their lower-most units (St. Augustine transition and Waccasassa Bay mangrove cores). Others have higher DI values in their lower units compared to their upper-most unit (SA2 is significantly higher than SA3 in the St. Augustine salt marsh and WB1 is significantly higher than WB3 in the Waccasassa Bay transition).
The amino acid DAPA (Supplementary Figure S12; Supplementary Table S3) displays opposing trends between coasts, with significant increases from the WB1 to WB3 occurring in all Waccasassa Bay cores and significant decreases from SA1 to SA2 and/or SA3 occurring in the St. Augustine salt marsh and transition. In contrast, GABA (Supplementary Figure S12; Supplementary Table S3) is consistently the highest in the middle units (SA2, WB2) for all cores, some of which are significantly higher than their respective lower-most or upper-most units. The Waccasassa Bay salt marsh and Waccasassa Bay mangrove WB1 do not have enough data points with detectable GABA concentrations to test for significance. The lack of detection also occurs within these same two cores with the MurA analysis (Supplementary Figure S12; Supplementary Table S3) and may be due to ion suppression caused by the calcium carbonate-rich sediments. MurA is not significantly different between units for both salt marsh cores but is significantly higher in the upper-most units (SA3, WB3) of the mangrove cores compared to the middle units (SA2, WB2). The transition cores show opposing trends in MurA, with SA1 being significantly higher than SA3 and SA2 contrasting with WB3 and WB2 being significantly higher than WB1. Lastly, Hyp (Figure 4; Supplementary Table S3) is significantly higher in the middle and upper-most units (SA2, SA3, WB2, WB3) of all cores compared to their respective lower-most units (SA1, WB1). Both mangrove cores show significantly higher Hyp within SA3/WB3 compared to SA2/WB2. In contrast, the Waccasassa Bay transition has significantly higher Hyp in WB2 compared to WB3.
All cores from both coastlines demonstrate changes in lithology, bulk geochemistry, and biomarkers with depth that could indicate these wetlands have migrated inland throughout the Holocene. The bottom lithology of the Waccasassa Bay cores (WB1), consisting of gray sands and shell material, and the uncalibrated ages of 39,400 to 49,200 14C-yrs B.P., suggest these sites were likely part of a carbonate platform deposited from a pre-Holocene RSL highstand (e.g. Goodbred et al., 1998). Black muds within WB2 and increases in TOC (Figure 2), lignin (Figure 3), and amino acid (Figure 4) concentrations likely indicate organic matter input increases from the possible development of a freshwater marsh. Black muds can be associated with marine systems due to Fe-S development, (e.g. Krairapanond et al., 1992). However, they are also seen in freshwater to brackish marshes in Florida, (e.g. Goodbred et al., 1998) and in the northeastern United States, (e.g. McCormick, 1968; Rampino and Sanders, 1980), with broad-leaf freshwater plant remains within the muds. The development of a freshwater marsh in Waccasassa Bay likely occurred when RSL rose and the associated rise in water table flooded the carbonate platform (dated to ∼4,400 14C-yrs B.P. near the Waccasassa River; Goodbred et al., 1998). Woody fragments from Waccasassa River soils have been dated to 1815 14C-yrs B.P., which is closer to the date for our bulk salt marsh sample at 1,530 ± 25 14C-yrs B.P. compared to our bulk transition site sample at 840 ± 20 14C-yrs B.P. Both dates are younger than the Waccasassa River dates, which could indicate a difference in timing for the development of a freshwater marsh environment.
High C/V ratios (Figure 3) in WB2 for all Waccasassa Bay cores suggest grass-dominant vegetation, while depleted δ13C (Figure 2) in the mangrove and transition cores suggests C3 dominance and enriched δ13C in the salt marsh core suggests C4 dominance. This is similar to modern freshwater marshes in the Everglades, consisting of C3 (e.g. Cladium jamaicense) and C4, (e.g. Muhlenbergia capillaris) grasses. C. jamaicense dominates freshwater marshes with 5–9 months of annual flooding (Wade et al., 1980; Doren et al., 1997; Olmsted and Armentano, 1997), while M. capillaris dominates in marshes flooded 2–4 months (Olmsted et al., 1980; Werner and Woolfenden, 1983). Thus, it may be expected that the modern salt marsh site, which is comparatively higher in elevation than the other two sites, would have been higher in elevation in the past and would have thus been flooded less frequently, leading to more C4 dominance.
WB3 within Waccasassa Bay likely represents the development of modern mangrove and salt marsh systems based on the presence of brown, peat-like soils. The shift into WB3 also has changes in δ13C, with the high salt marsh core becoming more depleted and the transition becoming more enriched (Figure 2). The depletion in the salt marsh core may relate to the migration and establishment of J. roemerianus, whereas the enrichment in the transition may relate to the migration of modern low-marsh vegetation (S. alterniflorus). This transition was previously suggested to have occurred ∼1700 ± 160 14C-years B.P. near the Waccasassa River in response to a transgressional event that led to a shoreline retreat of 10–20m·yr−1. Similar to the development of a freshwater marsh, the development of the salt marsh at our sites compared to Waccasassa River may have occurred at a different time. The lack of change in lithofacies and other geochemical parameters following the transition into a salt marsh environment suggest this marsh has been stable since the last transgressional event ∼1700 14C-years B.P., perhaps related to a slow-down in RSLR and the marshes ability to accrete vertically, (e.g. Morris et al., 2002).
The medium-to dark-brown sands characterizing the bottom lithological unit of the St. Augustine cores (SA1) is consistent with a freshwater and/or brackish wetland. The progression into gray muddy-sands in SA2 is characteristic of a developing intertidal to subtidal environment, (e.g. Long et al., 1998; Goodbred et al., 1998; Wright et al., 2005). Prior to this change, unit SA1 for all cores is characterized by depleted δ13C (Figure 2), low C/V (Figure 3) and high C/N (Figure 2) that increases throughout SA1. All three characteristics could describe C3 terrestrial woody vegetation present within maritime hammocks, the terminal stage of succession in coastal areas (Frazel, 2009). Vegetation in maritime hammocks includes a woody over-story of Quercus virginiana (live oak), Q. laurifolia (laurel oak), and Carya glabra (pignut hickory) along with an understory of sedges and saw palmetto. Low C/N initially at the base of the cores could suggest high freshwater algal presence.
The transition into SA2 enriches δ13C, increases C/V, and decreases C/N, which could describe an increase in C4 terrestrial non-woody vegetation common in modern low salt-marsh environments (dominated by C4 salt marsh grass S. alterniflorus). Although diagenetic alteration can alter δ13C (up to 4‰; Meyers, 1994), shifts towards more enriched δ13C are greater than 4‰ (Figure 2). Similarly, low C/V in SA1 could relate to the preferential decomposition of C phenols over V phenols (Hedges et al., 1988; Opsahl and Benner, 1995), which would alter woody/non-woody interpretations. C/N decreases into SA2 could also indicate diagenetic alteration as nitrogen-rich compounds are preferentially removed over nitrogen-poor compounds; however, lower C/N could also reflect greater algal contributions. Possible algal contribution is supported by an increase in p-hydroxybenzaldehyde (PAL, not shown) up-core, which is derived from lignin and non-lignin sources, (e.g. phytoplankton and algae; e.g. Hedges and Ertel, 1982; Requejo et al., 1991; Onofrejová et al., 2010), and by an increase in Hyp (Figure 4), which has been found in green algae (Gotelli and Cleland, 1968; Voigt et al., 1994). Hyp could alternatively indicate better amino acid preservation, (e.g. Philben and Benner, 2013; Philben et al., 2016) within SA2 given its shallower position in the cores.
The transition in environments, from a possible upland environment to a salt marsh, occurred ∼2,500cal·yr. B.P. in the transition and mangrove cores, which was around the same time RSLR increased in northeastern Florida (Hawkes et al., 2016). However, this increase in RSL rise may be related to local processes for that site and may not reflect regional RSL. Prior to this RSLR increase, RSL had been relatively stable between 5,000–3,000cal·yr. B.P. (Hawkes et al., 2016), which may have allowed for the persistence of a woody, C3-dominant upland environment. If RSL rose in St. Augustine like it did in northeastern Florida, then coastlines may have flooded and forced salt marsh vegetation to transgress inland, replacing less salt-tolerant upland vegetation. Additionally, there may have been shifts to a wetter climate around 2,500cal·yr. B.P. based on the expansion of broadleaf marsh and diatom taxa consistent with long hydroperiods in central Florida (Lammertsma et al., 2015). This agrees with the pollen record in central Florida lake deposits ∼2,700cal·yr. B.P. and in ostracod and stalagmite records from the eastern Gulf Coast ∼2,500cal·yr. B.P. (Alvarez Zarikian et al., 2005; Van Beynen et al., 2008).
The salt marsh core did not shift from SA1 to SA2 until ∼1,250cal·yr. B.P., which occurred when RSLR rates started to slow and plateau (Hawkes et al., 2016). Differences in timing between the salt marsh site and the other two sites may relate to the salt marsh site being further inland from the coastline despite minimal elevation differences in the modern wetland. Prior to ∼1,250cal·yr. B.P., salt marsh vegetation may have been limited to the shoreline, similar to modern-day mangrove positioning. This may have resulted from continued high rates of RSLR. Once RSLR slowed, salt marsh vegetation could have expanded and established itself into the modern day salt marsh site. This is similar to wetlands in the Everglades where the rise in RSL and the Florida aquifer led to the development of freshwater and brackish marshes ∼3,800cal·yr. B.P. and then to modern day salt marshes ∼1,100cal·yr. B.P. (Yao and Liu, 2017).
SA3 likely represents deposition within the modern-day salt marsh with changes in isotopic and lignin parameters reflecting the persistence of salt marsh vegetation or the expansion of mangroves. Following salt marsh development at the salt marsh site, mangroves may have started to develop in the mangrove and transition sites ∼750cal·yr. B.P., as indicated by the depletions in δ13C (Figure 2) and the eventual decreases in C/V (Figure 3). In contrast, the salt marsh core within SA3 has increased δ13C enrichment and C/V values, suggesting more non-woody C4 salt marsh dominance. Further work examining other microfossils such as pollen assemblages, (e.g. Willard et al., 2001; Souza Filho, 2006; Yao and Liu, 2017) would be useful to identify dominant terrestrial and aquatic taxa at different points in the wetland’s development. Additionally, the use of X-ray fluorescence, (XRF; e.g. van Soelen et al., 2012; Yao and Liu, 2017) would be helpful in identifying chemical elements derived from marine, (e.g. Ca, Sr, and Zr) and terrestrial, (e.g. Fe, Ti, and K) environments, which would allow for the interpretation of marine influence on the wetland vegetation.
St. Augustine (9.9–21.5kgC·m−2) has higher total carbon stocks compared to Waccasassa Bay (7.7–10.9kgC·m−2). Analyzing the top meter of soil for a blue carbon stock, as suggested by the IPCC (Hiraishi et al., 2014), the 1-m blue carbon stocks are 7.3 ± 0.4kgC·m−2, 7.0 ± 0.4kgC·m−2, and 8.0 ± 0.4kgC·m−2 for the St. Augustine salt marsh, mangrove, and transition cores, respectively. The 1-m blue carbon stocks for Waccasassa Bay salt marsh, mangrove and transition cores are 6.3 ± 0.3kgC·m−2, 6.1 ± 0.3kgC·m−2, and 8.6 ± 0.4kgC·m−2. Based on these stocks, St. Augustine stores more blue carbon in top meter of the mangrove and salt marsh cores compared to the same cores in Waccasassa Bay. In contrast, Waccasassa Bay site has the highest 1m carbon stock in its transition core while the St. Augustine transition has the highest overall stock.
Higher blue carbon stocks within the top meter in the St. Augustine mangrove and salt marsh cores is opposite from what would be expected based on a recent study that found higher blue carbon stocks within the top meter of Gulf coast carbon stocks compared to Atlantic coast carbon stocks (Thorhaug et al., 2019). This difference is due to scaling, where the previous study is regional, involving several states and another country, while this study is local and likely more representative of a single state (Florida). Waccasassa Bay cores have lower 1m blue carbon stocks because they likely contain non-blue carbon deposits with low concentrations of carbon (represented by Unit WB1) within the top meter of soil. In contrast, the St. Augustine cores have blue carbon-like deposits (represented by Unit SA3), which is more carbon-rich, well below the top meter. Thus, while blue carbon stocks have been standardized to the top meter of tidal wetland soils, there is potentially greater carbon stocks below this benchmark for the St. Augustine wetlands that could improve total geological carbon estimates (Kauffman and Donato, 2012; Gallagher, 2017; Adame et al., 2018; Thorhaug et al., 2019; Kauffman et al., 2020).
Comparing our 1m blue carbon stocks to other blue carbon stocks in the conterminous U.S., our stocks are much lower than the average (27kgC·m−2) but are not out of the range of stocks observed for the U.S. (Holmquist et al., 2018). European tidal marshes report a mean of 26.1kgC·m−2 (van Broek et al., 2016) and southeastern Australian mangroves and marshes report a mean of 25.3kgC·m−2 (Kelleway et al., 2016). The lower stocks here compared to the conterminous U.S. and to European and Australian wetlands may relate to latitude, where subtropical climate wetlands in the conterminous US have lower carbon densities compared to wetlands in temperate and Mediterranean climates (Holmquist et al., 2018). This may relate to temperature, where greater temperatures in subtropical climates could increase soil carbon degradation, (e.g. Kirschbaum, 1995; Davidson and Janssens, 2006). Differences in carbon stocks with latitude could also relate to differences in tidal amplitude and RSLR where greater RSLR throughout the Holocene for more northern states (Engelhart and Horton, 2012; Hawkes et al., 2016) could have created more accommodation space for carbon to accumulate (Rogers et al., 2019) compared to more southern states. The process by which RSLR influences carbon accumulation is described further below when comparing carbon accumulation between northern Florida coastlines.
When comparing intraspecific differences within coasts, the transition cores contain the highest OC stocks for both sites (includes total and 1m stocks) while the mangrove cores have the lowest, suggesting site location may influence the amount of carbon buried and stored. This is similar to carbon burial results for these cores over the recent ∼120 years with higher carbon burial in the transition core associated with high biomass production and the location of the transition site being further inland than the mangrove site (Vaughn et al., 2020). The mangroves location along the shorelines meant there is likely more organic matter being exported with tidal and wave action, (e.g. Saenger and Snedaker, 1993; Adame and Lovelock, 2011) as well as higher mineral sediment inputs as coarse grained sediments carried by waves and tides tend to settle closer to the shoreline (Stumpf, 1983). Having more inorganic sediment deposition at the mangrove sites means that as RSL rises, there is less available accommodation space for organic matter to accumulate (Morris et al., 2002; Rogers et al., 2019). The concept of location controlling accommodation space availability for organic and mineral sediment could be applied to these long cores, where the further the location is from the shoreline, the more space there is available for organic matter to accumulate (as opposed to mineral sediment accumulation). However, the ability of organic matter to accumulate also depends on its production, thus explaining lower OC burial at the salt marsh sites.
Our ability to explore the influence of RSLR on carbon burial at these sites is improved by utilizing longer records with distinct histories in tidal wetland development. Since tidal wetlands may have formed around similar times in St. Augustine (dated to ∼2,500–1,250cal·yr. B.P., this study) and in Waccasassa Bay (dated ∼2000–1700cal·yr. B.P., Goodbred et al., 1998), a shallower extent of carbon-rich, blue carbon deposits in Waccasassa Bay compared to St. Augustine could result from differences in RSLR over the late Holocene, (e.g. Rogers et al., 2019). High RSLR rates increase tidal inundation frequency, which creates accommodation space for the wetland to grow vertically through the accumulation of organic and mineral sediment. As sediment accumulates with continued RSLR, previously deposited sediments become submerged and create more anoxic conditions, inhibiting aerobic OC breakdown (Rogers et al., 2019). In contrast, regions with slower RSLR do not accrete as much material and thus do not provide the same extent of anaerobic conditions that slow OC breakdown. Based on RSL reconstructions from northeast Florida and the Gulf, the northeastern coast had a gradual decrease in RSLR rates from 1.0mm·yr−1 toward 0mm·yr−1 over the last ∼2,500 years (Hawkes et al., 2016), whereas the Gulf RSLR rates decreased from 1.0mmyr−1 to ∼0mmyr−1 between ∼2,500cal yr. B.P. and ∼2000cal yr. B.P. (Gerlach et al., 2017). This was followed by relatively slow RSLR between ∼2000cal yr. B.P. and ∼750cal yr. B.P. (Wright et al., 2005; Gerlach et al., 2017). The period of slower RSLR in the Gulf could have decreased potential accommodation space and OC accumulation, which subsequently increased potential aerobic OC decomposition.
Almost all of the six cores show decreases in OC with depth (Figure 2), typical of continuous in-situ OC decomposition, (e.g. Dittmar and Lara, 2001; Bianchi et al., 2013), the only exception being the increase in TOC ∼2,500cal·yr. B.P. in the St. Augustine transition core. The spike in TOC ∼2,500cal yr. B.P. also corresponds to slight increases in total lignin (Λ-6 and Λ-8), similar to that seen in the transition core over the last ∼120 years with the recent mangrove expansion (Vaughn et al., 2020). This suggests the spike in TOC and lignin follows another shift in vegetation ∼2,500cal·yr. B.P. (e.g. from upland environment to salt marsh). The driver for possible greater vegetation fluctuations at the St. Augustine transition coring location and not at the other St. Augustine or Waccasassa Bay sites is unknown but may relate to the timing of the vegetation changes at the other sites as well as environmental factors, such as elevation, distance from the shorelines, soil structure, and soil nutrient content.
Other than the lignin increase with the St. Augustine transition TOC increase, all St. Augustine and Waccasassa Bay cores experience overall decreases in total lignin (Λ-6 and Λ-8) down-core (Figure 3; Supplementary Figure S9) and most cores experience increases in lignin degradation indices ((Ad/Al)v and (Ad/Al)s) down-core to values characteristic of moderately to highly degraded lignin (Figure 3; Supplementary Figure S9; Hedges et al., 1998). Combined, both would suggest the lignin decrease down-core is related to its degradation (Hedges et al., 1988; Opsahl and Benner, 1995; Otto and Simpson, 2006). Total amino acids (THAA) also decrease down-core for all St. Augustine and Waccasassa Bay cores (Figure 4); however, it is not matched by decreases in the degradation index (DI, Figure 4; lower values indicate higher degradation) nor by increases in the amino acids DAPA, GABA, or MurA that indicate higher bacterial and/or diagenetic alteration (Supplementary Figures S12; Philben et al., 2016; Hutchings et al., 2019). The decrease in amino acids down-core thus may not strictly be due to degradation but could relate to increased amino acid inputs up-core, possibly related to salt marsh expansion.
Degradation of carbon down-core may have also contributed to the general decrease in sedimentation rates observed down-core using 14C data (e.g. for St. Augustine cores, go from 0.6 to 1.6mm·yr−1 at 50cm to 0.6mm·yr−1 for the entire core lengths). These 14C derived rates are additionally lower compared to 210Pb data at the surface of these cores, which revealed sedimentation rates of 0.4–3.8mm·yr−1 (Vaughn et al., 2020); however, they are in range for millennial-scale sedimentation rates in other salt marsh and mangrove environments (0.3–2.5mm·yr−1; Carter et al., 1993; Parkinson and White, 1994; Nydick et al., 1995; Saintilan and Wilton, 2001; Serandrei-Barbero et al., 2006). Besides an increase in degradation down-core, decreases in sedimentation rates, derived from 210Pb data at the surface to 14C data at the bottom of the cores, may suggest an increase in soil material added over time (or a combination of soil material increase up-core with degradation down-core). An increase in soil material over time, (i.e. an increase in sedimentation) may have occurred as these wetlands experienced ecological transitions whereby, environments higher in elevation, (e.g. high marsh) and further from the coastline, (e.g. coastal forests) tend to have lower sedimentation rates compared to environments lower in elevation and closer to the coastline, (e.g. low marsh; Breithaupt et al., 2018). Additionally, increases in RSLR over time may enhance sedimentation in these coastal environments as they maintain their position relative to the tidal frame (Morris et al., 2002; Rogers et al., 2019).
Wood and charcoal fragments from Waccasassa Bay yielded modern radiocarbon ages, indicating modern material has been incorporated into soils at 88–152cm in depth. As a result, we are unable to construct an age-depth model for Waccasassa Bay. The modern ages for the mangrove and transition cores likely resulted from deep mangrove root penetration, giving younger ages for soils at depths to which the roots can penetrate, (e.g. 62 cm in a south Florida wetland; Zhang et al., 2019). Having deeper mangrove root penetration for Waccasassa Bay compared to St. Augustine would not be surprising as mangrove heights were much higher compared for Waccassassa Bay and belowground biomass tends to have positive correlations with mangrove tree height (Yando et al., 2018). Alternatively, there may have been disruptions to the soil profile, such as bioturbators transporting modern woody material from the surface to depth (McCraith et al., 2003) or a re-depositional event where younger wood fragments get deposited before older, eroded soils (e.g. Colhoun, 1986). This could explain the modern ages in the salt marsh core from Waccasassa Bay; however, as noted by the 210Pb data for the surface soils of Waccasassa Bay (Vaughn et al., 2020), soil mixing in these wetlands is minimal. It thus seems unlikely bioturbation or re-depositional events contributed to the younger carbon at depth.
It is also unknown why we encountered modern ages for the Waccasassa Bay salt marsh core but not for St. Augustine, but there may be a connection with elevation given the Waccasassa Bay salt marsh core was collected in a high marsh environment and the St. Augustine salt marsh core was collected in a low marsh environment. Neither environment type though, would be expected to produce differences in root depth (i.e. root depth for S. alterniflorus or J. roemericanus) down to ∼88–152cm. Other research from coastal wetlands and other depositional environments have found modern 14C dates at depth but many do not report these modern ages and instead attribute the modern ages to error (personal communication with others). Thus, in order to better understand what is driving modern carbon ages at depth, future studies that obtain modern values should report them when possible and detail the environmental conditions that may have led to these modern values.
Blue carbon and total carbon stocks in Northern Florida wetlands are assessed in sites of varying vegetation types (mangrove and salt marsh) with differing histories of wetland development. North Florida Gulf coast cores were shorter in length compared to north Florida Atlantic coast cores due to the presence of carbon-poor shell material, representing carbonate platform deposits (Goodbred et al., 1998), below the soil. Tidal wetlands likely formed around similar times for both coastlines (∼2.5ka); however, faster RSLR along the Atlantic coast (Hawkes et al., 2016) likely promoted more soil accumulation through the creation of accommodation space (Rogers et al., 2019). Thus, despite the Gulf cores having higher organic carbon concentrations at the surface, the Atlantic cores having a deeper extent of carbon-rich soils led to higher total organic carbon stocks in northern Florida Atlantic coast wetlands (9.9–21.5kgC·m−2) compared to the northern Gulf coast wetlands (7.7–10.9kgC·m−2).
Restricting these carbon estimates to just the top meter within the cores, as suggested by recent IPCC guidelines for estimating blue carbon stocks (Hiraishi et al., 2014), also gave mostly higher stocks for the Atlantic coast sites (7.3kgC·m−2, 7.0kgC·m−2, and 8.0kgC·m−2 for the salt marsh, mangrove, and transition sites, respectively) compared to the Gulf coast sites (6.3kgC·m−2 and 6.1kgC·m−2 for the salt marsh and mangrove sites, respectively), though the highest overall stock is found in the Gulf coast transition site (8.6kgC·m−2). These blue carbon stocks may be low compared to other conterminous U.S. wetlands (Holmquist et al., 2018); however, there is potential for higher stocks in the Atlantic cores if soils deeper than a meter are considered.
The top meter is assumed to represent soils most vulnerable to disturbance globally through the construction of aquaculture and salt production ponds (Hiraishi et al., 2014), but types of disturbance and the depth of sediment in which the disturbances influence varies between regions and localities. The Atlantic coast wetlands are located in some of the most rapidly growing counties in Northern Florida, thus it likely that carbon below the top meter will be exposed as erosive anthropogenic activities, such as dredging for navigation and land-use development increase (Frazel, 2009). Increased boat usage adjacent to these wetlands may also increase the depth of soil exposure as boat wakes reduce salt marshes to intertidal sand flats, which face significantly larger erosion rates compared to undisturbed vegetated salt marshes, (e.g. Kim, 2003; Sheehan and Ellison, 2015). Thus, while the 1m blue carbon stock may be useful for comparisons of wetlands globally, the potential amount of carbon released from these and other wetlands with disturbances may be unaccounted for in carbon financing schemes (Gallagher, 2017) and should be measured when possible.
The datasets presented in this study can be found in online repositories. The names of the repository/repositories and accession number(s) can be found below: Coastal Carbon Research Coordination Network https://doi.org/10.25573/serc.10552004.
DV collected and analyzed samples and wrote manuscript. TB supported and contributed data analysis to this research. MS and WK provided additional sample analysis and TO contributed to the collection of the samples.
This work was supported by the Jon and Beverly L. Thompson Endowed Chair of Geological Sciences.
The authors declare that the research was conducted in the absence of any commercial or financial relationships that could be construed as a potential conflict of interest.
DV acknowledges support from the Gulf Coast Association of Geological Societies and the Southeastern Geological Society. Thanks to A. Coican, O. Cordero, and J. Piasecki for assistance with laboratory analyses.
The Supplementary Material for this article can be found online at: https://www.frontiersin.org/articles/10.3389/feart.2021.552721/full#supplementary-material.
Abbott, J. R., and Judd, W. S. (2000). Floristic inventory of the Waccasassa bay state Preserve, levy county, Florida. Rhodora. 102, 439–513.
Adame, F. C., Brown, C. J., Bejarano, M., Herrera-Silveira, J. A., Ezcurra, P., Kauffman, J. B., et al. (2018). The undervalue contribution of mangrove protection in Mexico to carbon emission targets. Conserv. Lett. 11 (1), e12445. doi:10.1111/conl.12445
Adame, M. F., and Lovelock, C. E. (2011). Carbon and nutrient exchange of mangrove forests with the coastal ocean. Hydrobiologia. 663, 23–50. doi:10.1007/s10750-010-0554-7
Alvarez Zarikian, C. A., Swart, P. K., Gifford, J. A., and Blackwelder, P. L. (2005). Holocene paleohydrology of Little Salt Spring, Florida, based on ostracod assemblages and stable isotopes. Palaeogeogr. Palaeoclimatol. Palaeoecol. 225, 134–156. doi:10.1016/j.palaeo.2004.01.023
Arnold, S. L., and Schepers, J. S. (2004). A simple roller-mill grinding procedure for plant and soil samples. Commun. Soil Sci. Plant Anal. 35 (3), 537–545. doi:10.1081/CSS-120029730
Bianchi, T. S., Allison, M. A., Zhao, J., Li, X., Comeaux, R. S., Feagin, R. A., et al. (2013). Historical reconstruction of mangrove expansion in the Gulf of Mexico: linking climate change with carbon sequestration in coastal wetlands. Estuar. Coast Shelf Sci. 119, 7–16. doi:10.1016/j.ecss.2012.12.007
Blaauw, M., and Christen, J. A. (2011). Flexible paleoclimate age-depth models using an autoregressive gamma processes. Bayesian Anal. 6, 457–474. doi:10.1214/11-BA618
Breithaupt, J. L., Smoak, J. M., Byrne, R. H., Waters, M. N., Moyer, R. P., and Sanders, C. J. (2018). Avoiding timescale bias in assessments of coastal wetland vertical change. Limnol. Oceanogr. 63 (S1), S477–S495. doi:10.1002/lno.10783
Breithaupt, J. L., Smoak, J. M., Smith, T. J., Sanders, C. J., and Hoare, A. (2012). Organic carbon burial rates in mangrove sediments: strengthening the global budget. Global Biogeochem. Cycles. 26, GB3011. doi:10.1029/2012GB004375
Brooks, H. K. (1982). Geologic Map of Florida. Florida, FL: Center for Environmental and Natural Resources.
Carter, R. M., Johnson, D. P., and Hooper, K. G. (1993). Episodic post-glacial sea-level rise and the sedimentary evolution of a tropical continental embayment (Cleveland Bay, Great Barrier Reef shelf, Australia). Aust. J. Earth Sci. 40, 229–255. doi:10.1080/08120099308728077
Castañeda-Moya, E., Twilley, R. R., Rivera-Monroy, V. H., Marx, B. D., Coronado-Molina, C., and Ewe, S. M. L. (2011). Patterns of root dynamics in mangrove forests along environmental gradients in the Florida Coastal Everglades. Ecosystems. doi:10.1007/s10021-011-9473-3
Chen, C. S. (1965). The regional lithostraphic analysis of Paleocene and Eocene rocks of Florida. Florida, FL: Florida Geological Survey Bulletin.
Chmura, G. L., and Aharon, P. (1995). Stable carbon isotope signatures of sedimentary carbon in coastal wetlands as indicators of salinity regime. J. Coast Res. 11, 124–135.
Chmura, G. L., Anisfeld, S. C., Cahoon, D. R., and Lynch, J. C. (2003). Global carbon sequestration in tidal, saline wetland sediments. Global Biogeochem. Cycles. 17 (4), 1111. doi:10.1029/2002GB001917
Choi, Y. H., Wang, Y., Hsieh, Y. P., and Robinson, L. (2001). Vegetation succession and carbon sequestration in a coastal wetland in northwest Florida: evidence from carbon isotopes. Global Biogeochem. Cycles. 15 (2), 311–319. doi:10.1029/2000GB001308
Colhoun, E. A. (1986). Field problems of radiocarbon dating in Tasmania. Royal Soc. of Tasmania. 120. 1–6. doi:10.26749/rstpp.120.1
Dauwe, B., Middelburg, J. J., Herman, P. M. J., and Heip, C. H. R. (1999). Linking diagenetic alteration of amino acids and bulk organic matter reactivity. Limnol. Oceanogr. 44, 1809–1814. doi:10.4319/lo.1999.44.7.1809
Davidson, E. A., and Janssens, I. A. (2006). Temperature sensitivity of soil carbon decomposition and feedbacks to climate change. Nature Rev. 440, 165–173. doi:10.1038/nature04514
Davis, R. A. (1997). “Geology of the Florida coast,” in The geology of Florida. Editors A. F. Randazzo, and D. S. Jones (Florida, FL: University Press of Florida).
Dittmar, T., and Lara, R. J. (2001). Molecular evidence for lignin degradation to sulfate-reducing mangrove sediments (Amazônia, Brazil). Geochem. Cosmochim. Acta. 65 (9), 1417–1428. doi:10.1016/S0016-7037(00)00619-0
Doren, R. B., Armentano, T. V., Whiteaker, L. D., and Jones, R. D. (1997). Marsh vegetation patterns and soil phosphorous gradients in the Everglades ecosystem. Aquat. Bot. 56, 145–163. doi:10.1016/S0304-3770(96)01079-0
Doughty, C. L., Langley, J. A., Walker, W. S., Feller, I. C., Schaub, R., and Chapman, S. K. (2016). Mangrove range expansion rapidly increases coastal wetland carbon storage. Estuar. Coast. 39 (2), 385–396. doi:10.1007/s12237-015-9993-8
Engelhart, S. E., and Horton, B. P. (2012). Holocene sea level database for the Atlantic coast of the United States. Quat. Sci. Rev. 54, 12–25. doi:10.1016/j.quascirev.2011.09.013
Ertel, J. R., Hedges, J. I., and Perdue, E. M. (1984). Lignin signatures of aquatic humic substances. Science. 223, 485–487. doi:10.1126/science.223.4635.485
Ertel, J. R., and Hedges, J. I. (1985). Sources of sedimentary humic substances: vascular plant debris. Geochem. Cosmochim. Acta. 49, 2097–2107. doi:10.1016/0016-7037(85)90067-5
Ertel, J. R., and Hedges, J. I. (1984). The lignin component of humic substances: distribution among soil and sedimentary humic, fulvic, and base-insoluble fractions. Geochem. Cosmochim. Acta. 48, 2065–2074. doi:10.1016/0016-7037(84)90387-9
Frazel, D. (2009). Site profile of the guana tolomato Matanzas national estuarine research reserve. Florida, FL: Florida Research Reserve.
Gallagher, J. B. (2017). Taking stock of mangrove and seagrass blue carbon ecosystems: a perspective for future carbon trading. BJoMSA. 01, 71–74.
Gallivan, L. B., and Davis, R. A. (1981). Sediment transport in a microtidal estuary: Matanzas River, Florida (UnitedStates). Mar. Geol. 40, 69–83. doi:10.1016/0025-3227(81)90043-8
Gerlach, M. J., Engelhart, S. E., Kemp, A. C., Moyer, R. P., Smoak, J. M., Bernhardt, C. E., et al. (2017). Reconstructing common era relative sea-level change on the Gulf Coast of Florida. Mar. Geol. 390, 254–269. doi:10.1016/j.margeo.2017.07.001
Geselbracht, L., Freeman, K., Kelly, E., Gordon, D. R., and Putz, F. E. (2011). Retrospective and prospective model simulations of sea level rise impacts on Gulf of Mexico coastal marshes and forests in Waccasassa Bay, Florida. Climatic Change. 107, 35–57. doi:10.1007/s10584-011-0084-y
Goodbred, S. L., Wright, E. E., and Hine, A. C. (1998). Sea-level change and storm-surge deposition in a late Holocene Florida salt marsh. J. Sediment. Res. 68 (2), 240–252. doi:10.2110/jsr.68.240
Google Earth (2019). Maps of Florida, St. Augustine, and Waccasassa Bay. Available at: https://google.com/earth/ (Accessed January 3, 2019).
Gotelli, I. B., and Cleland, R. (1968). Differences in the occurrence and distribution of hydroxyproline- proteins among the algae. Am. J. Bot. 55, 907–914. doi:10.1002/j.1537-2197.1968.tb07449.x
Gully, J. D., Martin, J. B., and Brown, A. (2016). Organic carbon inputs, common ions and degassing: rethinking mixing dissolution in coastal eogenetic carbonate aquifers. Earth Surf. Process. Landforms. 41 (14), 2098–2110. doi:10.1002/esp.3975
Hadden, C. S., and Cherkinsky, A. (2015). 14C variations in pre-bomb nearshore habitats of the Florida Panhandle, United States. Radiocarbon. 57 (3), 1–9. doi:10.2458/azu_rc.57.18353
Harris, D., Horwáth, W. R., and Van Kessel, C. (2001). Acid fumigation of soils to remove carbonates prior to total organic carbon or carbon-13 isotopic analysis. Soil Sci. Soc. Am. J. 65, 1853–1856. doi:10.2136/sssaj2001.1853
Hawkes, A. D., Kemp, A. C., Donnelly, J. P., Horton, B. P., Peltier, W. R., Cahill, N., et al. (2016). Relative sea-level change in northeastern Florida (UnitedStates) during the last ∼8.0 ka. Quat. Sci. Rev. 142, 90–101. doi:10.1016/j.quascirev.2016.04.016
Hedges, J. I., Blanchette, R. A., Weliky, K., and Devol, A. H. (1998). Effects of fungal degradation on the CuO oxidation products of lignin: a controlled laboratory study. Geochem. Cosmochim. Acta. 52, 2717–2726. doi:10.1016/0016-7037(88)90040-3
Hedges, J. I., Clark, W. A., and Cowie, G. L. (1988). Organic matter sources to the water column and surficial sediments of a marine bay. Limnol. Oceanogr. 33 (5), 1116–1136. doi:10.4319/lo.1988.33.5.1116
Hedges, J. I., and Ertel, J. R. (1982). Characterization of lignin by gas capillary chromatography of cupric oxide oxidation products. Anal. Chem. 54, 174–178. doi:10.1021/ac00239a007
Hedges, J. I., and Mann, D. C. (1979). Characterization of plant-tissues by their lignin oxidation-products. Geochem. Cosmochim. Acta. 43 (11), 1803–1807. doi:10.1016/0016-7037(79)90028-0
Hedges, J. I., and Oades, J. M. (1997). Comparative organic geochemistries of soils and marine sediments. Org. Geochem. 27, 319–361. doi:10.1016/S0146-6380(97)00056-9
Hernes, P. J., Kaiser, K., Dyda, R. Y., and Cerli, C. (2013). Molecular trickery in soil organic matter: Hidden lignin. Environ. Sci. Technol. 47, 9077–9085. doi:10.1021/es401019n
Hernes, P. J., Robinson, A. C., and Aufdenkampe, A. K. (2007). Fractionation of lignin during leaching and sorption and implications for organic matter “freshness”. Geophys. Res. Lett. 34, L17401. doi:10.1029/2007GL031017
Hine, A. C., and Belknap, D. F. (1986). Recent geological history of modern sedimentary processes of the Pasco, Hernando, and Citrus County coastline: west-central Florida. Florida, FL: Gainesville, University of Florida, Florida Sea Grant College Publication.
Hine, A. C., Belknap, D. F., Hutton, J. G., Osking, E. B., and Evans, M. W. (1988). Recent geological history and modern sedimentary processes along an incipient, low-energy, epicontinental-sea coastline: northwest Florida. J. Sediment. Petrol. 58, 567–579. doi:10.1306/212F8DF5-2B24-11D7-8648000102C1865D
Hiraishi, T., Krug, T., Tanabe, K., Srivastava, N., Jamsranjav, B., Fukuda, M., et al. (2014). 2013 supplement to the 2006 IPCC Guidelines for national greenhouse gas inventories: wetlands. Geneva, Switzerland: Intergovernmental Panel on Climate Change.
Holmquist, J. R., Windham-Myers, L., Bliss, N., Crooks, S., Morris, J. T., Megonigal, J. P., et al. (2018). Accuracy and precision of tidal wetland soil carbon mapping in the conterminous United States. Sci. Rep. 8, 9478. doi:10.1038/s41598-018-26948-7
Hopkinson, C. S., Cai, W.-J., and Hu, X. (2012). Carbon sequestration in wetland dominated coastal systems – a global sink of rapidly diminishing magnitude. Curr. Opin. Env. Sust. 4, 1–9. doi:10.1016/j.cosust.2012.03.005
Hutchings, J. A., Bianchi, T. S., Kaufman, D. S., Kholodov, A. L., Vaughn, D. R., and Schuur, E. A. G. (2019). Millennial-scale carbon accumulation and molecular transformation in a permafrost core from Interior Alaska. Geochem. Cosmochim. Acta. 253, 231–248. doi:10.1016/j.gca.2019.03.028
Hutchings, J. A., Shields, M. R., Bianchi, T. S., and Schuur, E. A. G. (2018). A rapid and precise method for the analysis of underivatized amino acids in natural samples using volatile-ion-pairing reverse-phase liquid chromatography-electrospray ionization tandem mass spectrometry. Org. Geochem. 115, 46–56. doi:10.1016/j.orggeochem.2017.10.007
Jex, C. N., Pate, G. H., Blyth, A. J., Spencer, R. G. M., Hernes, P. J., Khan, S. J., et al. (2014). Lignin biogeochemistry: from modern processes to Quaternary archives. Quat. Sci. Rev. 87, 46–59. doi:10.1016/j.quascirev.2013.12.028
Kauffman, J. B., and Donato, D. C. (2012). Protocols for the measurement, monitoring, and reporting of structure, biomass, and carbon stocks in mangrove forests. Bogor, Indonesia: Center for International Forest Research.
Kauffman, J. B., Giovanonni, L., Kelly, J., Dunstan, N., Borde, A., Diefenderfer, H., et al. (2020). Total ecosystem carbon stocks at the marine- terrestrial interface: Blue carbon of the Pacific Northwest Coast, United States. Global Change Biol. 26, 5679–5692. doi:10.1111/gch.15248
Kelleway, J. J., Saintilan, N., Macreadie, P. I., and Ralph, P. J. (2016). Sedimentary factors are key predictors of carbon storage in SE Australian saltmarshes. Ecosystems. 19, 865–880. doi:10.1007/s10021-016-9972-3
Kemp, A. C., Vane, C. H., Horton, B. P., Engelhart, S. E., and Nikitina, D. (2012). Application of stable carbon isotopes for reconstructing salt-marsh floral zones and relative sea level, New Jersey, United States. J. Quat. Sci. 27, 404–414. doi:10.1002/jqs.1561
Kennedy, H. A., Fourqqurean, J., Johnson, B., Kauffman, J. B., Lovelock, C., Saintilan, N., et al. (2013). “Field sampling of vegetated carbon pools in coastal ecosystem,” in In coastal blue carbon: Methods for assessing carbon Stocks and emissions Factors in mangroves, tidal salt marshes, and seagrasses. Editors J. Howard, S. Hoyt, K. Isensee, M. Telszewski, and S. Pidgeon 2013 (Arlington: IUCN), 67–108.
Kieliszewski, M. J., and Lamport, D. T. A. (1994). Extension: repetitive motifs, functional sites, posttranslational codes, and phylogeny. Plant J. 5, 157–172. doi:10.1046/j.1365-313X.1994.05020157.x
Kim, B. O. (2003). Tidal modulation of storm waves on a macrotidal flat in the Yellow Sea. Estuar. Coast Shelf Sci. 57, 411–420. doi:10.1016/S0272-7714(02)00369-4
Kirschbaum, M. U. F. (1995). The temperature dependence of soil organic matter decomposition and the effect of global warming on soil organic storage. Soil Biol. Biochem. 27 (6), 753–760. doi:10.1016/0038-0717(94)00242-S
Krairapanond, N., DeLaune, R. D., and Patrick, W. H. (1992). Distribution of organic and reduced sulfur forms in marsh soils of coastal Louisiana. Org. Geochem. 18 (4), 489–500. doi:10.1016/0146-6380(92)90112-B
Lammertsma, E. I., Donders, T. H., Pearce, C., Cremer, H., Gaiser, E. E., and Wagner-Cremer, F. (2015). Sensitivity of wetland hydrology to external climate forcing in central Florida. Quat. Res. 84 (3), 287–300. doi:10.1016/j.yqres.2015.09.003
Long, D., Waller, M., and McCarthy, P. (1998). “The Vegetation History of the Lower Rother Valley: Stratigraphy and Pollen Data for the Shirley Moor Region,” in In romney marsh: enviornmental Change and human Occupation in a coastal lowland, OUCA monograph 46. Editors J. Eddison, M. Gardiner, and A. Long (Oxford, England: Oxford University Committee for Archaeology), 31–44.
Louchouarn, P., Amon, R. M. W., Duan, S., Pondell, C., Seward, S. M., and White, N. (2010). Analysis of lignin-derived phenols in standard reference materials and ocean dissolved organic matter by gas chromatography/tandem mass spectrometry. Mar. Chem. 118, 85–97. doi:10.1016/j.marchem.2009.11.003
Mc Connaughey, T. A., and Gillikin, D. P. (2008). Carbon isotopes in mollusk shell carbonates. Geo Mar. Lett. 28, 287–299. doi:10.1007/s00367-008-0116-4
McCormick, C. L. (1968). Holocene stratigraphy of the marshes at plum island, Massachusetts. PhD thesis. Massachusetts (UnitedStates): University of Massachusetts.
McCraith, B. J., Gardner, L. R., Wethey, D. S., and Moore, W. S. (2003). The effect of fiddler crab burrowing on sediment mixing and radionuclide profiles along a topographic gradient in a southeastern salt marsh. J. Mar. Res. 61, 359–390. doi:10.1357/002224003322201232
Mcleod, E., Chmura, G. L., Bouillon, S., Salm, R., Bjork, M., Duarte, C. M., et al. (2011). A blueprint for blue carbon: toward an improve understanding of the role of vegetated coastal habitats in sequestering CO2. Front. Ecol. Environ. 9, 552–560. doi:10.1890/110004
Meyers, P. A. (1994). Preservation of elemental and isotopic source identification of sedimentary organic matter. Chem. Geol. 114 (3-4), 289–302. doi:10.1016/0009-2541(94)90059-0
Morris, J. T., Sundareshwar, P. V., Nietch, C. T., Kjerfve, B., and Cahoon, D. R. (2002). Responses of coastal wetlands to rising sea level. Ecology. 83 (10), 2869–2877. doi:10.1890/0012-9658(2002)083[2869:ROCWTR]2.0.CO;2
Murray, B. C., Pendleton, L., Jenkins, W. A., and Sifleet, S. (2011). Green payments for blue carbon economic incentives for protecting threatened coastal habitats. Durham, North Carolina: Nicholas Institute for Environmental Policy Solutions Report.
Nydick, K. R., Bidwell, A. B., Thomas, E., and Varekamp, J. C. (1995). A sea-level rise curve from Guilford. Mar. Geol. 124, 137–159. doi:10.1016/0025-3227(95)00037-Y
Olmsted, I. C., and Armentano, T. V. (1997). Vegetation of shark slough, Everglades national Park, technical report #SFNRC 97-001, south Florida natural resource center. Florida, FL: Everglades National Park.
Olmsted, I. C., Loope, L. L., and Rintz, R. E. (1980). A Survey and baseline analysis of aspects of the vegetation of taylor slough. Florida, FL: South Florida Research Center, Everglades National Park.
Onofrejová, L., Vašíčová, J., Klejdus, B., Stratil, P., Mišurcová, L., Kráčmar, S., et al. (2010). Bioactive phenols in algae: The application of pressurized-liquid and solid-phase extraction techniques. J. Pharmaceut. Biomed. 41, 464–470. doi:10.1016/j.jpba.2009.03.027
Opsahl, S., and Benner, R. (1995). Early diagenesis of vascular plant tissues: lignin and cutin decomposition and biogeochemical implications. Geochem. Cosmochim. Acta. 59, 4889–4904. doi:10.1016/0016-7037(95)00348-7
Osland, M. J., Spivak, A. C., Nestlerode, J. A., Lessmann, J. M., Almario, A. E., Heitmuller, P. T., et al. (2012). Ecosystem development after mangrove wetland creation: Plant-soil change across a 20-year chronosequence. Ecosystems. 15, 848–866. doi:10.1007/s10021-012-9551-1
Otto, A., and Simpson, M. (2006). Evaluation of CuO oxidation parameters for determining the source and stage of lignin degradation in soil. Biogeochemistry. 80, 121–142. doi:10.1111/gcb.12126
Parkinson, R. W., and White, J. R. (1994). Late Holocene erosional shoreface retreat within a siliciclastic-to-carbonate transition zone, East Central Florida, United States. J. Sediment. Res. 64, 408–415. doi:10.1306/D4267FD7-2B26-11D7-8648000102C1865D
Pearson, F. J., and Hanshaw, B. B. (1970). Sources of dissolved carbonate species in groundwater and their effects in carbon-14 dating,” in Proceedings of a Symposium on Use of Isotopes in hydrology. Washington, DC, September, 1970 (Vienna, Austria International Atomic Energy Agency), 271–286.
Pendleton, L., Donato, D. C., Murray, B. C., Crooks, S., Jenkins, A. W., Sifleet, S., et al. (2012). Estimating global "blue carbon" emissions from conversion and degradation of vegetated coastal ecosystems. PLoS One 7 (9), e43542. doi:10.1371/journal.pone.0043542
Philben, M., and Benner, R. (2013). Reactivity of hydroxyproline-rich glycoproteins and their potential as biochemical tracers of plant-derived nitrogen. Org. Geochem. 57, 11–22. doi:10.1016/j.orggeochem.2013.01.003
Philben, M., Kaiser, K., and Benner, R. (2014). Does oxygen exposure time control the extent of organic matter decomposition in peatlands? J. Geophys. Res.-Biogeo. 119, 897–909. doi:10.1002/2013JG002573
Philben, M., Ziegler, S. E., Edwards, K. A., Kahler, R., and Benner, R. (2016). Soil organic nitrogen cycling increases with temperature and precipitation along a boreal forest latitudinal transect. Biogeochemistry. 127, 397–410. doi:10.1007/s10533-016-0187-7
Rampino, M. R., and Sanders, J. E. (1980). Holocene transgression in south-central Long Island, New York. J. Sediment. Petrol. 50 (4), 1063–1080. doi:10.1306/212F7B7-2B24-11D7-8648000102C1865D
R Core Team (2019). R: a language and environment for statistical computing. Vienna, Austria: R Foundation for Statistical ComputingAvailable at: https://www.R-project.org/
Reinson, G. E. (1992). “Transgressive Barrier-island and estuarine systems,” in In facies models. Geoscience Canada reprint. Editors R. G. Walker, and N. P. James (Dublin, Ireland: OCLC), 119–140.
Requejo, A. G., Brown, J. S., Boehm, P. D., and Sauer, T. C. (1991). Lignin geochemistry of North American coastal and continental shelf sediments. Org. Geochem. 17, 649–662. doi:10.1016/0146-6380(91)90007-7
Rodriguez, W., Feller, I. C., and Cavanaugh, K. C. (2016). Spatio-temporal changes of a mangrove- saltmarsh ecotone in the northeastern coast of Florida, United States. Glob. Ecol. Conserv. 7, 245–261. doi:10.1016/j.gecco.2016.07.005
Rogers, K., Kelleway, J. J., Saintilan, N., Megonigal, J. P., Adams, J. B., Holmquist, J. R., et al. (2019). Wetland carbon storage controlled by millennial-scale variation in relative sea-level rise. Nature. 567, 91–95. doi:10.1038/s41586-019-0951-7
Saenger, P., and Snedaker, S. C. (1993). Pantropical trends in mangrove above-ground biomass and annual literfall. Oecologia. 96, 293–299. doi:10.1007/BF00317496
Saintilan, N., and Wilton, K. (2001). Changes in the distribution of mangroves and saltmarshes in Jervis Bay, Australia. Wetl. Ecol. Manag. 9, 409–420. doi:10.1023/A:1012073018996
Santos, G. M., and Ormsby, K. (2013). Behavioral variability in ABA chemical pretreatment close to the 14C age limit. Radiocarbon. 55 (Nr 2-3), 534–544. doi:10.1017/S0033822200057660
Sapkota, Y., and White, J. R. (2019). Marsh edge erosion and associated carbon dynamics in coastal Louisiana: A proxy for future wetland-dominated coastlines world-wide. Estuar. Coast Shelf Sci. 226, 106238. doi:10.1016/j.ecss.2019.106289
Serandrei-Barbero, R., Albani, A., Donnici, S., and Rizzetto, F. (2006). Past and recent sedimentation rates in the Lagoon of Venice (Northern Italy). Estuar. Coast Shelf Sci. 69, 255–269. doi:10.1016/j.ecss.2006.04.018
Sheehan, M. R., and Ellison, J. C. (2015). Tidal marsh erosion and accretion trends following invasive species removal, Tamar Estuary, Tasmania. Estuar. Coast Shelf Sci. 164, 46–55. doi:10.1016/j.ecss.2015.06.013
Shields, M. R., Bianchi, T. S., Gelinas, Y., Allison, M. A., and Twilley, R. R. (2016). Enhanced terrestrial carbon preservation promoted by reactive iron in deltaic sediments. Geophys. Res. Lett. 43 (3), 1149–1157. doi:10.1002/2015GL067388
Shields, M. R., Bianchi, T. S., Mohrig, D., Hutchings, J. A., Kenney, W. F., Kolker, A. S., et al. (2017). Carbon storage in the Mississippi River delta enhanced by environmental engineering. Nat. Geosci. 10, 846–851. doi:10.1038/ngeo3044
Smoak, J. M., Breithaupt, J. L., Smith, T. J., and Sanders, C. J. (2012). Sediment accretion and organic carbon burial relative to sea-level rise and storm events in two mangrove forests in Everglades National Park. Cantena. 104, 58–66. doi:10.1016/j.catena.2012.10.009
Souza-Filho, P. W. M., Cohen, M. C. L., Lara, R. J., Lessa, G. C., Koch, B., and Behling, H. (2006). Holocene coastal evolution and facies model of the Braganca Macrotidal Flat on the Amazon Mangrove Coast, Northern Brazil. J. Coast Res. 39, 306–310.
Stumpf, R. P. (1983). The process of sedimentation on the surface of a salt marsh. Estuar. Coast Shelf Sci. 17, 495–508. doi:10.1016/0272-7714(83)90002-1
Tareq, S. M., Tanaka, N., and Ohta, K. (2004). Biomarker signature in tropical wetland: lignin phenol vegetation index (LPVI) and its implications for reconstructing the paleoenvironment. Sci. Total Environ. 324, 91–103. doi:10.1016/j.scitotenv.2003.2010.020
Thorhaug, A. L., Poulos, H. M., López-Portillo, J., Barr, J., Lara-Domínguez, A. L., Ku, T. C., et al. (2019). Gulf of Mexico estuarine blue carbon stock, extent and flux: Mangroves, marshes, and seagrasses: A North American hotspot. Sci. Total Environ. 651, 1253–1261. doi:10.1016/j.scitotenv.2018.10.011
Twilley, R., Chen, R., and Hargis, T. (1992). Carbon sinks in mangroves and their implications to carbon budget of tropical coastal ecosystems. Water, Air, Soil Pollut. 64 (1), 265–288. doi:10.1007/BF00477106
Van Beynen, P. E., Asmerom, Y., Polyak, V., Soto, L., and Polk, J. S. (2008). Variable intensity of teleconnections during the Late Holocene in subtropical North America from an isotopic study of speleothem from Florida. Geophys. Res. Lett. 34, L18703. doi:10.1029/2007GL031046
van de Broek, M., Temmerman, S., Merckx, R., and Govers, G. (2016). The importance of an estuarine salinity gradient on soil organic carbon stocks of tidal marshes. Biogeosci. Discuss. 13, 6611–6624. doi:10.5194/bg-2016-285
van Soelen, E. E., Brooks, G. R., Larson, R. A., Sinninghe-Damsté, J. S., and Reichart, G. J. (2012). Mid- to late-Holocene coastal environmental changes in southwest Florida, United States. Holocene. 22 (8), 929–938. doi:10.1177/0959683611434226
Vaughn, D. R., Bianchi, T. S., Shields, M. R., Kenney, W. F., and Osborne, T. Z. (2020). Increased organic carbon burial in northern Florida mangrove-salt marsh transition zones. Global Biogeochem. Cycles. 34, e2019GB006334. doi:10.1029/2019GB006334
Voigt, J., Wrann, D., Vogeler, H. P., Kõnig, W. A., and Mix, M. (1994). Hydroxyproline-containing and glycine-rich cell wall polypeptides are widespread in the green algae. Microbiol. Res. 149, 223–229. doi:10.1016/S0944-5013(11)80062-5
Wade, D., Ewel, J., and Hofstetter, R. (1980). Fire in south Florida ecosystems. North Carolina, NC: Southeastern Forest Service Station, U.S. Department of Agriculture.
Wagner, A. J., Guilderson, T. P., Slowey, N. C., and Cole, J. E. (2009). Pre-bomb surface water radiocarbon of the Gulf of Mexico and Caribbean as recorded in hermatypic corals. Radiocarbon. 41, 947–954. doi:10.1017/S0033822200034020
Ward, N. D., Morrison, E. S., Liu, Y., Rivas-Ubach, A., Osborne, T. Z., Ogram, A. V., et al. (2019). Marine microbial community responses related to wetland carbon mobilization in the coastal zone. Limnol. Oceanogr. Lett. 4, 25–33. doi:10.1002/lol2.10101
Werner, H., and Woolfenden, G. (1983). “The Cape Sable Sparrow: Its Habitat, Habits and History,,” in The seaside sparrow: its biology and management. Robbins (biological surve and North Carolina state museum. Editors T. L. Wuay, J. B. Fundersburg, D. S. Lee, E. F. Porter, and C. S. (North Carolina, NC), 55–75.
Wigley, T. M. L., Plummer, L. N., and Pearson, F. J. (1978). Mass transfer and carbon isotope evolution in natural water systems. Geochem. Cosmochim. Acta. 42 (8), 1117–1139. doi:10.1016/0016-7037(78)90108-4
Willard, D. A., Weimer, L. M., and Riegel, W. L. (2001). Pollen assemblages as paleoenvironmental proxies in the Florida Everglades. Rev. Palaeobot. Palynol. 113 (4), 213–235. doi:10.1016/S0034-6667(00)00042-7
Wilson, G. P., Lamb, A. L., Leng, M. J., Gonzalez, S., and Huddart, D. (2005). Variability of organic δ13C and C/N in the Mersey Estuary, UK and its implications for sea-level reconstruction studies. Estuar. Coast Shelf Sci. 64, 685–698. doi:10.1016/j.ecss.2005.04.003
Windham-Meyers, L., Crooks, S., and Troxler, T. (2019). Blue carbon primer: the state of coastal wetland carbon science practice and policy. Florida,FL: CRC Press.
Wright, E. E., Hine, A. C., Goodbred, S. L., and Locker, S. D. (2005). The effect of sea-level and climate change on the development of a mixed siliclastic-carbonate, deltaic coastline: Suwannee River, Florida, USA. J. Sediment. Res. 75 (4), 621–635. doi:10.2110/jsr.2005.051
Yando, E. S., Osland, M. J., and Hester, M. W. (2018). Microspatial ecotone dynamics at a shifting range limit: Plant-soil variation cross salt marsh-mangrove interfaces. Oecologia. 187 (1), 319–331. doi:10.1007/s00442-018-4098-2
Yao, Q., and Liu, K.-B. (2017). Dynamics of marsh-mangrove ecotone since the mid-Holocene: A palynological study of mangrove encroachment and sea level rise in the Shark River Estuary, Florida. PloS One. 12 (3), e0173670. doi:10.1371/journal.prone.0173670
Zhang, X., Bianchi, T. S., Coehn, M. J., Martin, J. B., Quintero, C. J., Brown, A. L., et al. (2019). Initiation and development of wetlands in southern Florida karst landscape association with accumulation of organic matter and vegetation evolution. J.Geophys. Res-Biogeo. 124 (6), 1604–1617. doi:10.1029/2018JG004921
Keywords: blue carbon, carbon stock, lignin, amino acids, holocene, wetland migration, radiocabon dating
Citation: Vaughn DR, Bianchi TS, Shields MR, Kenney WF and Osborne TZ (2021) Blue Carbon Soil Stock Development and Estimates Within Northern Florida Wetlands. Front. Earth Sci. 9:552721. doi: 10.3389/feart.2021.552721
Received: 16 April 2020; Accepted: 06 January 2021;
Published: 08 February 2021.
Edited by:
Gareth Daniel Oliver Carter, British Geological Survey, United KingdomReviewed by:
Lisamarie Windham-Myers, United States Geological Survey (USGS), United StatesCopyright © 2021 Vaughn, Bianchi, Shields, Kenney and Osborne. This is an open-access article distributed under the terms of the Creative Commons Attribution License (CC BY). The use, distribution or reproduction in other forums is permitted, provided the original author(s) and the copyright owner(s) are credited and that the original publication in this journal is cited, in accordance with accepted academic practice. No use, distribution or reproduction is permitted which does not comply with these terms.
*Correspondence: Derrick R. Vaughn, ZHZhdWdobjJAZnN1LmVkdQ==
Disclaimer: All claims expressed in this article are solely those of the authors and do not necessarily represent those of their affiliated organizations, or those of the publisher, the editors and the reviewers. Any product that may be evaluated in this article or claim that may be made by its manufacturer is not guaranteed or endorsed by the publisher.
Research integrity at Frontiers
Learn more about the work of our research integrity team to safeguard the quality of each article we publish.