 Mei Xu
 Yonghui Yao2*
- 1Research Center on Flood & Drought Disaster Reduction of the Ministry of Water Resources, China Institute of Water Resources and Hydropower Research, Beijing, China
- 2State Key Laboratory of Resources and Environment Information System, Institute of Geographic Sciences and Natural Resources Research, Chinese Academy of Sciences, Beijing, China
- 3Beijing Water Authority, Beijing, China
With the aim of achieving high precision and high efficiency, recent research on hydraulic flood models has tended to focus on the algorithms for solving the shallow water equations of Saint-Venant. While development of the algorithms will help to improve the simulation precision and the solving of specific problems, the other influential factor in flood risk modeling is the precision and reasonable generalization of the data. This is even more important for increasing the model’s computational accuracy and efficiency but is frequently undervalued. Frequent rainstorm waterlogging is having a serious impact on China’s large cities. Early warning of waterlogging risk following a rainstorm forecast is an effective method for preventing or reducing potential losses. Concrete waterlogging information including locations, depth, and process is essential for early warnings. This paper focuses on the influence of data precision and reasonable generalization on an urban flooding model. A detailed hydraulic urban flooding model characterized by detailed data processing and component coupling can help to provide advance information. In Beijing city, road networks, overpasses, and buildings are so highly concentrated that rainstorms easily result in waterlogging in low-lying locations. Therefore, partial microrelief is the determinate factor in waterlogging simulation. This paper shows that multi-mode surface data generalization and detailed model coupling support a perfect simulation of a Beijing urban flooding model. The influence of buildings, roads, and overpasses on surface water flow was carefully considered based on the innovative aspect of a fine generalization of partial microrelief. One novelty is the simulation of the whole overland flow from the beginning of rainfall to mesh, not only from manhole overflow, because the waterlogging is caused mainly by initial surface water runoff rather than by manhole overflow. A second novelty is the use of a new kind of coupling mode based on physical mechanisms between surface and pipe models. Here, rain perforated strainers instead of manholes play a role as flow exchange points between pipe and surface. This coupling mode is much closer to the real world. Based on a detailed Beijing urban flooding model, a scenarios library of typical rainfall events and corresponding waterlogging results was constructed. Several years of practice have demonstrated that a rich library of scenarios can be used effectively for the quick identification and early warning of waterlogging risk for a forecast rainfall. Test results show that multi-mode surface generalization is effective in improving outcomes and useful for scientific decision making in controlling urban waterlogging.
Introduction
Increasing urbanization and frequent occurrences of rainstorms with aging storm networks increase flood risk. Hydroinformatic tools such as flood models are valuable assets for integrated water management in cities, as within the digital city concept proposed by Price and Vojinovic (2008).
Recent research has tended to focus on two aspects of hydraulic flood models. One is the algorithm for solving the shallow water equations of Saint-Venant and its application to solving specific problems, and the other aspect is the acceleration of the algorithm (Huxley, 2017). Funke et al. (2011) and Tsakiris and Bellos (2014) conducted research on the treatment of wetting and drying. Research has also been carried out on the trade-offs between accuracy and computational efficiency (Fewtrell et al., 2008; Gallegos et al., 2009; Wang et al., 2010). Gallegos et al. (2009) used an unstructured grid, Godunov-type, finite volume model to simulate a dam-break flooding event in an urban residential area and validated their model with high-resolution data. Yu (2015) attempted to apply an implicit dual time-stepping method to improve run-time efficiency and stability in dealing with urban floods. Liang et al. (2008) applied an adaptive quadtree grid-based shallow water equations solver which dynamically adapted the grid to represent the critical flow features such as steep water surface gradients and wetting–drying fronts. This method has a proven ability to improve the computational efficiency of two-dimensional numerical models for large-scale flood simulation Chen et al. (2012) and Zang (2019) proposed a surface multilayer modeling technology and Zang (2019) applied it to the calculation of waterlogging at overpass locations. Other researchers have suggested that hydraulic modeling needs to reduce complexity to achieve rapid solutions (Song et al., 2014). The general objective is high precision and high efficiency in flood simulation.
A further question is the influence of data input to the model. This has also been the subject of close attention from many engineers and researchers in recent years. It has been widely recognized that the resolution and quality of the topographical data may have a significant influence on the simulation results (Zoppou and Roberts, 1999; Gourbesville and Savioli, 2002). Hénonin et al. (2015) concluded that low-resolution simulations could not properly represent the complex urban geometrics and topographical features to provide reliable flood predictions. Two-dimensional models are well adapted to represent urban pluvial flooding. However, urban infrastructures such as buildings and streets have a significant influence on surface flows (Beretta et al., 2018). Higher resolution is needed to represent features at city scale (Hénonin et al., 2013) and to ensure a proper representation of such floods (Hénonin et al., 2015). Generally, researchers have concluded that high-resolution simulation is necessary to interpret accurately urban geometrics and topography and subsequently provide reliable urban flood predictions (Xing et al., 2018). With the availability of high-quality topographical data and an increase in computational power, there is now an increased emphasis on developing highly accurate modeling techniques for flood inundation (Bradbrook et al., 2004; Werner et al., 2005; Hunter et al., 2008; Krebs et al., 2014).
Flood modeling methods for surface flow can give the dynamics of the floodwater (Bulti and Abebe, 2020). For urban models, the accuracy of a simulation depends mainly on both topographical data resolution and model grid size. Urban applications usually require a fine 2-D grid so that the main urban features such as buildings and streets can be represented (Hénonin et al., 2013). The 2D model grid scale influences the resolution of the flood computation, but a high resolution is also needed for the topographical data input to a 2D model (Gourbesville, 2009). High-resolution topographical data, such as data from Light Detection and Ranging (LIDAR) systems, are now in common use and can have a very fine scale of the order of 20 cm or even less (Fewtrell et al., 2008). Traditional terrain analysis procedures need to be modified to account for human-made low-relief features such as streets which can intercept and redirect surface flows apart from the dominant topographic gradient as described by Djokic and Maidment (1991). Fewtrell et al. (2008) evaluated the effectiveness of coarse grids to represent flooding in urban environments by applying a 2D storage cell model, LISFLOOD-FP, and pointed out that critical length scales related to building dimensions and building separation distances determine the coarsest useful grid resolutions. Hunter et al. (2008) pointed out that terrain data available from modern LIDAR systems are sufficiently accurate and resolved for simulating urban flows, but such data need to be fused with digital map data of building topology and land use to gain maximum benefit from the information contained therein. Hunter et al. (2008) study also compared the relative impact of uncertainty over terrain data and model parameters on hydraulic model output. While the conclusions partly depend on the parameter and terrain error ranges fed into the analysis, it is clear that once fine spatial resolution, high-accuracy terrain data are available, uncertainty over model parameters becomes the more dominant of these factors (Dottori et al., 2013).
The precision of digital elevation models (DEMs) in traditional topographic products is insufficient for a detailed flooding model, especially in urban areas. It is frequently necessary to supplement topographic products with either photogrammetric mapping or LIDAR-generated data and detailed ground surveys in areas of interest. Vehicle-mounted LIDAR is suitable for generating DEM for a lower concave type of overpass because the lowest layer is easily waterlogged, but the high-precision elevation cannot be gained through other means. When airborne LIDAR systems or photogrammetric mapping is applied to collect digital elevation data, post-processing for the removal of vegetation that covers the land, rooftops, and roads is crucial for obtaining the actual land surface instead of the reflective surface (Cobby et al., 2001). Generally, defined data are required for a detailed surface description and subsequently for a detailed flood simulation (Yuan and Li, 2019). How to prepare ideal data for improving the model’s simulation results is an important research topic and the main theme of this paper.
In urban flood modeling, flow through the drainage networks has a strong influence on the simulation results (Hu et al., 2010). For large cities, however, complete and detailed information on drainage networks is normally unavailable or inaccurate. Drainage collection points (assumed to be manholes) are distributed along roads and streets at certain intervals according to design regulations (Xing et al., 2018). Flood modeling needs an adequate understanding of important processes that occur in the drainage system from the input (rainfall) to the output (outflow) (Josef, 2012; Jaafar et al., 2015). The sewer–surface coupling approach enables representation of the urban dual-drainage system, as it considers the flow exchange between major and minor systems and provides accurate descriptions of flood conditions (Leandro et al., 2009). The flow exchange between the two systems takes place at gully inlets, manholes, and river outfalls (Leandro et al., 2009; Hénonin et al., 2015). The belowground and aboveground flows must be strongly coupled because the interaction between sewer and surface models cannot be split into distinct processes (Sui and Maggio, 1999; WeiFeng et al., 2009). Leandro and Martins (2016) pointed out that tight coupling enables the implementation of real-time interactions between the two models. Tightly-coupled models can be operated as a single unit (single simulation package). There are several commercial and open-source simulation packages that provide such access (e.g., XPSWMM and MIKE FLOOD). Leandro and Martins (2016) proposed a methodology for linking 2D overland flow models with the sewer network model SWMM 5.1 based on dynamic link libraries. The China Institute of Water Resources and Hydropower Research (IWHR) Urban Flooding Model applied to Beijing also provides such access, enabling two novelties in the simulation of the Beijing urban flooding model described in this paper. One is the simulation of the whole overland flow from rainfall to mesh, instead of from manhole overflow only. The second is a new coupling mode based on rain perforated strainers (instead of manholes) between surface and pipe model.
Building a comprehensive and detailed urban flood model in a city as large as Beijing is a huge challenge. In this paper, many information of methods and techniques about building the model will be documented.
Case Study
The city of Beijing covers more than a thousand square kilometers. It includes the seven districts of Dongchen, Xicheng, Chaoyang, Haidian, Fengtai, and Shijingshan. The two main rivers that flow around the city are the Yongdinghe River on the west and the Beiyunhe River on the east. Inside the urban area of the city, there are four main rivers. From north to south, they are the Qinghe River, Bahe River, Tonghuihe River, and the Liangshuihe River. Almost all of them flow roughly from the west to the east and finally into the Beiyunhe River.
Beijing faces flood risk from three sources: the Yongdinghe River flood, the west mountain flood, and waterlogging in the urban interior caused by rainstorms. The threats from the Yongdinghe River flood and the west mountain flood have been controlled through several years of engineering renovation. The flood control standard for the protection dike on the Yongdinghe River located in Beijing city is so high that almost no flood risk exists. The flood from the west mountain can be stored in the west suburb gravel pit before flowing into the main city. However, the problem of waterlogging in the city interior still exists and is becoming increasingly serious. The waterlogging risk is decided by the drainage system (Xiang et al., 2018).
Beijing’s rivers present a natural drainage system. It is composed of four basins in the main city (Figure 1). The Qinghe River is the main river in the north of Beijing and carries the drainage of the northern region of the city. The Bahe River and the Tonghuihe River run through the center of Beijing and carry the drainage of the central region. The Liangshuihe River is the main river in the south of Beijing and carries the drainage of the southern region. Finally, the Beiyunhe River carries almost all of the floodwaters from the four drainage rivers.
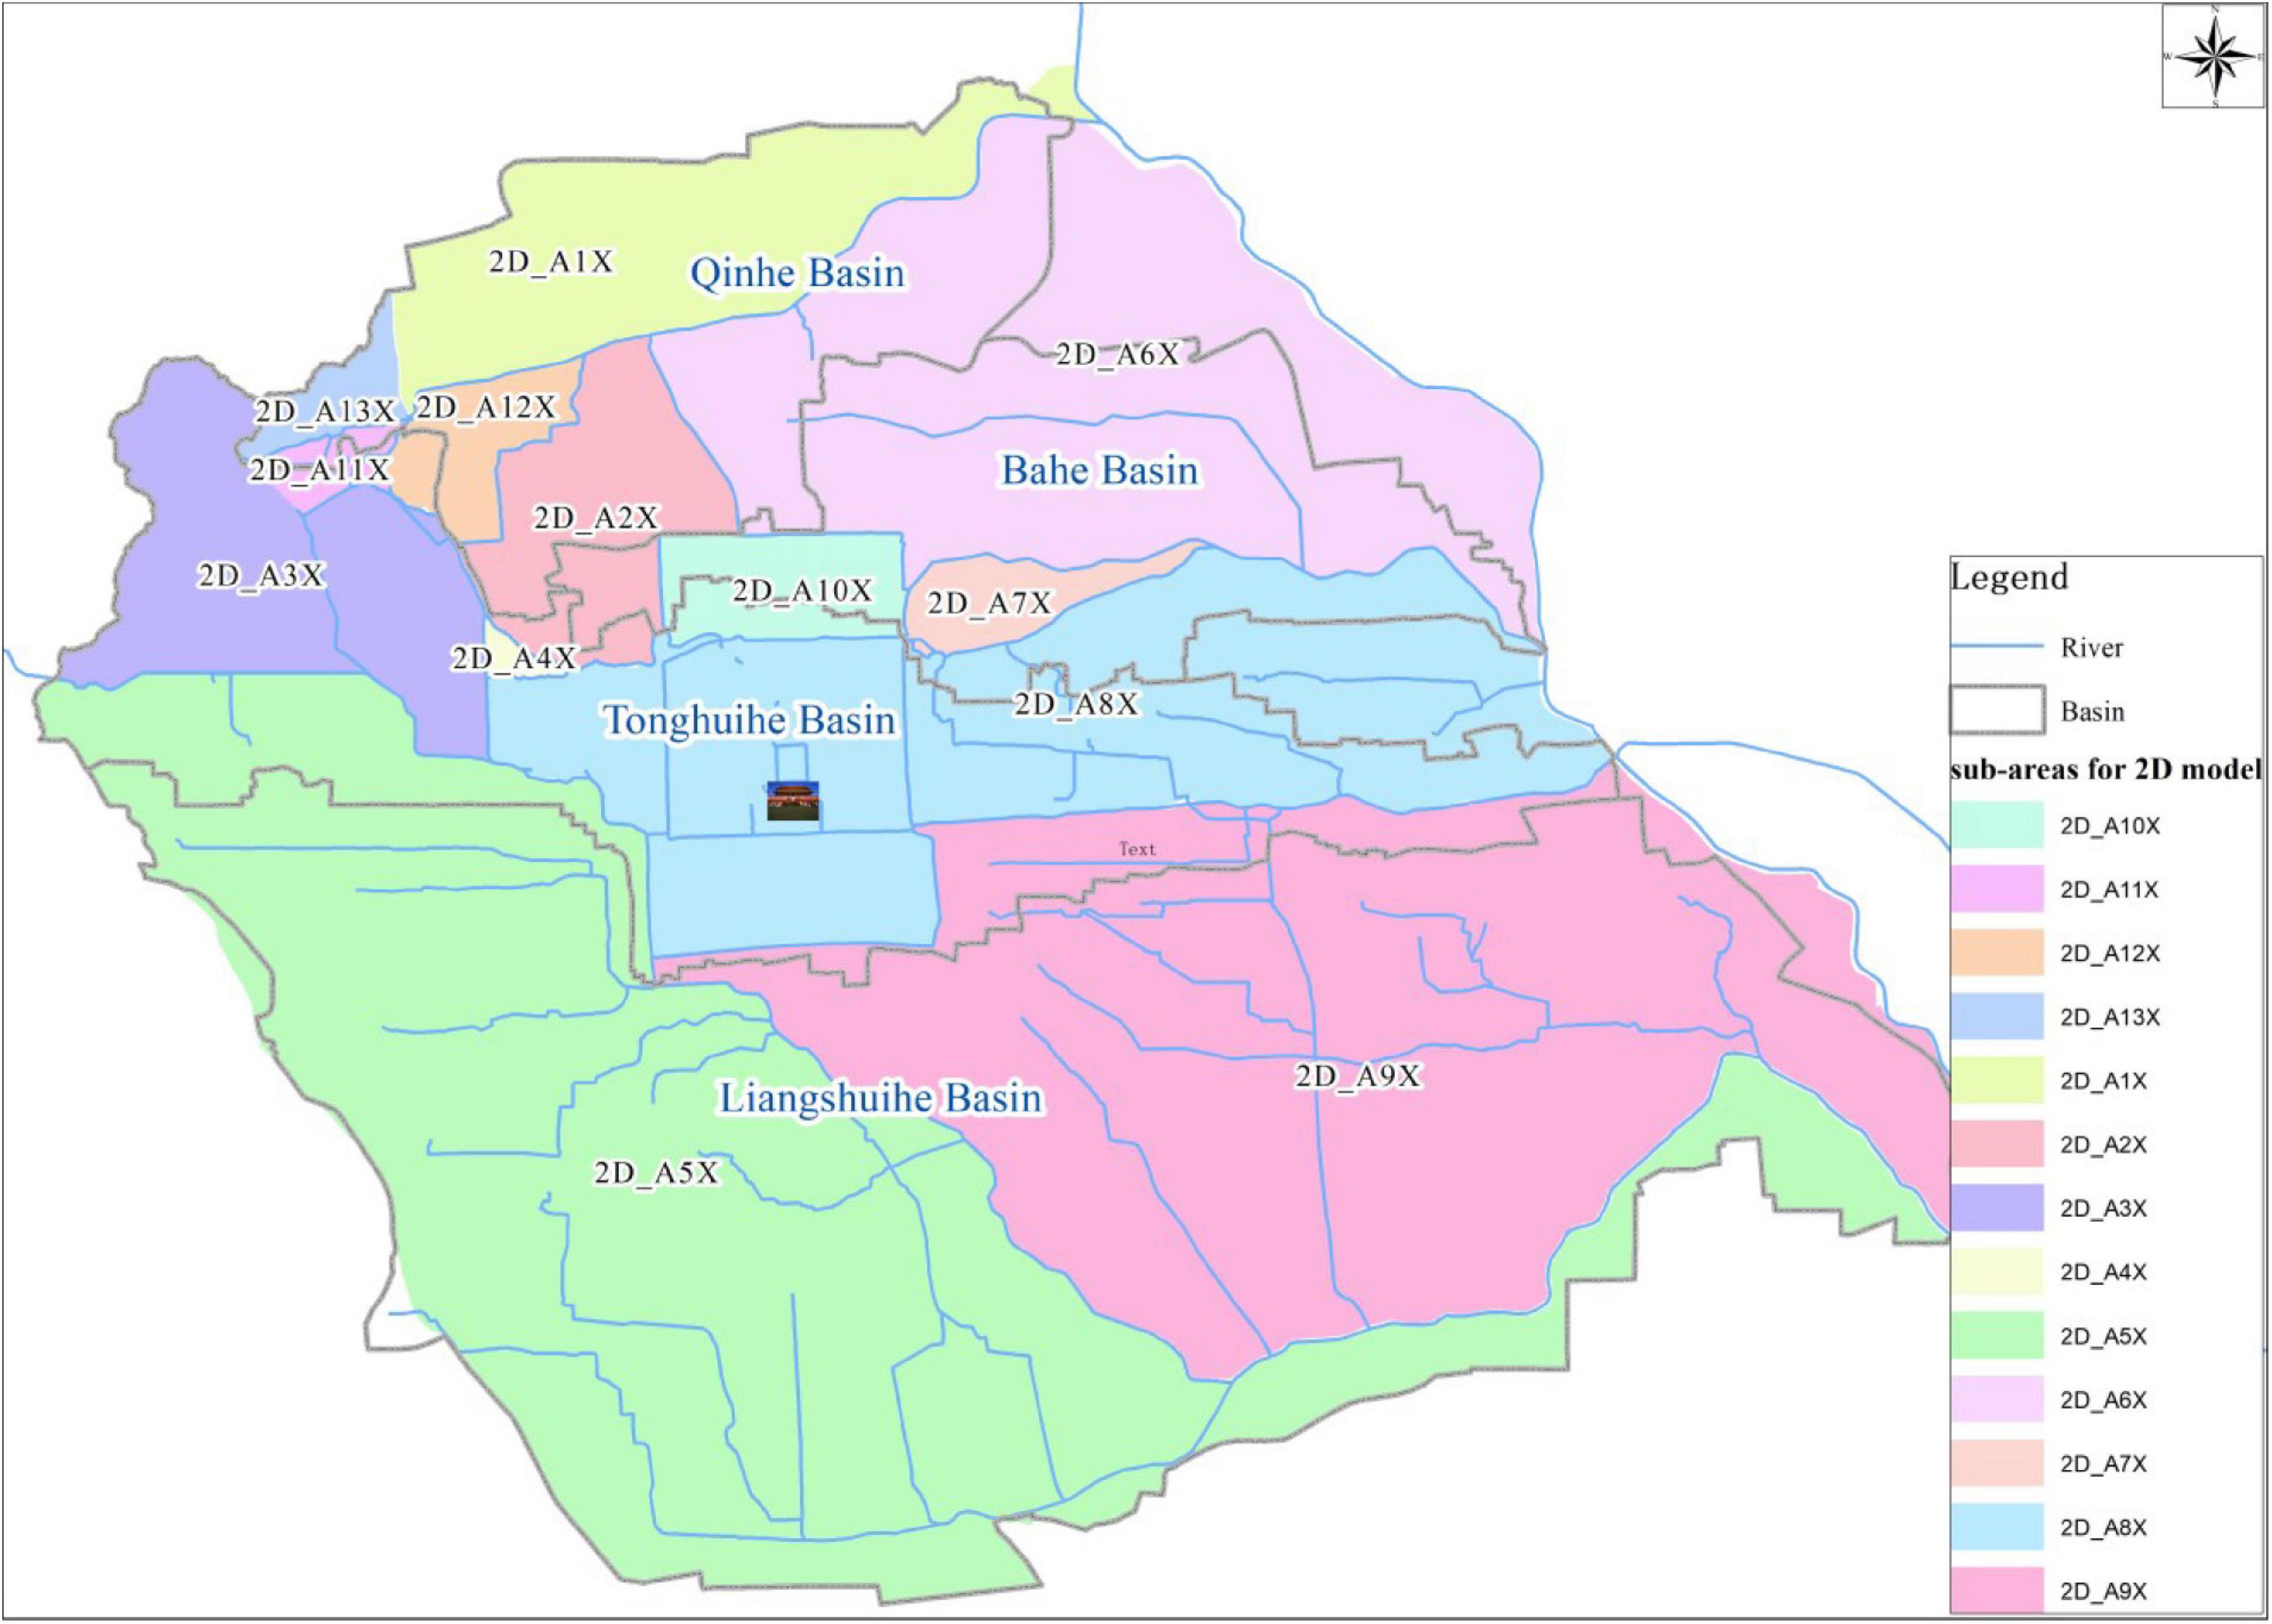
Figure 1. The four river basins of Beijing city.
Under normal rainfall conditions, the four main rivers take on the drainage burden for the whole of Beijing city. Under heavy rainfall conditions, the northern Qinghe River will divide floodwaters from the Anhe gate on the upstream to the northern region outside of the main city, and the middle Tonghuihe River will divide floodwaters from the Fenghongdao gate to the Liangshuihe River in order to lessen the drainage burden of the main city.
Flood risk management in downtown Beijing has become increasingly urgent in recent years under the current conditions of frequent flooding and waterlogging caused by extreme weather and rapid urbanization (Cheng and Li, 2015). Advance waterlogging alarms based on rainstorm forecasts is an effective method for the prevention or reduction of potential losses caused by flooding. In the past, an urban flood risk alarm was issued immediately only after a rainstorm alarm and as a direct response to the rainfall forecast. It means that the range of flood risk is consistent with the spatial range of the rainfall. This relationship is one-sided which can easily lead to unreasonable and unreliable flood risk information. In urban areas, flood risk depends not only on the total rainfall and intensity, but also on drainage capacity. The relationship between rainfall and waterlogging is very complex in urban areas. A comprehensive urban flooding model is currently a more effective method for simulating frequent waterlogging events (Ren, 2004; Xue, 2016).
The Beijing urban flooding model was built gradually over several years and has been put into use during the flooding season from the year 2018 (Xu et al., 2020b). The simulation results have served not only for waterlogging alerts but also for scheduling a water conservancy project dealing with Beijing’s urban rivers and for analyzing the floodwater capacity of river and pipe. In making improvements to the flood simulation results for urban areas, the methods of obtaining accurate data and of generalizing from special objects are highly significant. In developing the Beijing urban flooding model, multi-mode surface terrain data acquisition and generalization methods supported the model’s construction and fine simulation effectively. Buildings, roadways, and overpasses were described carefully and in detail for simulating the depth of waterlogging more accurately. The partial microrelief of lower concave overpasses and many barricades, including even notable curbs, were obtained using several techniques such as local traditional measurement, vehicle-borne LIDAR scanning, remote sensing interpretation (Neelz et al., 2006), and extrapolations from street views of a publicly accessible online map.
In this study, GIS play an important role in preparing and processing multifarious data for the detailed urban flooding model. GIS tools serve not only for preprocessing the input data also for demonstrating the input–output data of the model intuitively.
Data and Methods
Range
The Beijing urban flooding model covers a much wider area than the main city. To maintain the integrity of the river basins, the range of the model is extended from Beijing city outward to the Qinghe basin boundary in the north and to the Liangshuihe basin boundary in the south. It covers an area of 1486 square kilometers. It is therefore a significant challenge to construct, maintain, update, and run such a large and detailed hydraulic urban flooding model.
Overall Structure
The Beijing urban flooding model is based on the China IWHR Urban Flooding Model. The IWHR holds the independent intellectual property rights of the IWHR Urban Flooding Model. The IWHR model includes its own program and modeling platform which is integrated with GIS tools. It includes four components as follows: a 1D river model based on an explicit-scheme finite-difference formulation of the kinematic wave approach; a 2D surface model based on the Godunov-type finite-volume method for 2D shallow water flows on an unstructured grid; an underground rainstorm pipe model based on an explicit-scheme finite-difference formulation combined with the Preissmann virtual narrow seam method; and a coupling module. The rainfall runoff procedure based on the Xin’anjing model is embedded in the 2D surface model.
The IWHR Urban Flooding Model operates as follows. First, the net rainfall is calculated after inputting rainfall data and is loaded directly on the 2D meshes according to the spatial position. The procedure of net rainfall calculation is reduced to two steps. The first accounts for water loss at an earlier stage which includes evaporation, vegetation interception, and land depression storage; the second accounts for land infiltration. After subtracting earlier water loss and land infiltration from the total rainfall, the remainder is net rainfall. The computation of surface convergence is performed on each mesh of the surface model. It differs from many commercial flooding models in which the rainfall–runoff procedure is always performed on each sub-catchment. This method leads to a computational burden but is essential for simulating the process of waterlogging caused by initial surface flow. The experience of flooding in Beijing city shows that most waterlogging is caused by initial surface water runoff because of insufficient capacity in the pipe system rather than by pipe node overflow. The surface runoff of each mesh is equal to the net rainfall, the computation of which is performed on each mesh.
Second, the runoff convergence procedure is composed of three steps as follows: surface convergence; underground rainstorm pipe convergence; and river convergence. After the rainfall–runoff based on each mesh, the surface runoff begins to participate in surface convergence based on the surface model. In the process of surface convergence, the surface runoff may flow into the underground rainstorm pipe when meeting entrance points (manhole or rain perforated strainer) and begins to participate in the pipe network convergence based on the underground pipe model. The pipe runoff will flow into the river at the outlet and begins to participate in river convergence based on the river model. It is also obvious that surface runoff may flow into the river directly when meeting the river and will then begin to participate in river convergence likewise. The exchange and transmission of hydraulic parameters between different models are performed via the coupling module.
Based on the above structure of the IWHR urban flooding model, the Beijing urban flooding model is composed of one river model, several surface models, several underground pipe models, and one coupling module.
The Beijing urban flooding model can simulate the whole procedure of rainfall–runoff–convergence while taking into account water dispatching via all reservoirs, water gates, dams, pumping stations, and other flood prevention and drainage projects. Thanks to the support of the exterior hydrological model, it can simulate the procedure of flooding caused by exterior river flood and waterlogging caused by rainstorm and interior river flood at the same time. Flooding and waterlogging cannot be separated clearly because they interact with each other. Some urban flooding models may be more suited for the simulation of river flooding; some more suited for the simulation of waterlogging. In actuality, however, many cities face the risk of river flooding and waterlogging simultaneously. The city of Beijing is an example of this.
Surface Model
Surface Division
The area covered by the main city of Beijing is so large (in excess of 1000 square kilometers) that a surface model of the whole area would be expensive in terms of computational resources and computing time. GIS tools face a considerable challenge in constructing and maintaining the spatial topology relations for a surface mesh layer and it is almost impossible to update topology and coupling relations manually because of the huge amounts of mesh. To avoid this problem, the whole study area is divided into several subareas with the main river as a cut-off line. The surface model is built individually for each subarea (Figure 1). But the river system is built as a whole model for the main city. Each surface model exchanges water through the river system and pipe drainage system. There is no water exchange directly between the different surface models. They are dynamically and indirectly lined with each other through the river model. The river model supplies the boundary condition dynamically for each surface model in the simulation.
The advantages of this approach are obvious. First, it is less difficult to maintain and update each middle-sized surface model individually. Second, the resolution and scale of the surface model of each subarea can be varied according to the attention level, the data condition, and the terrain complexity. A further advantage is an obvious improvement in computing speed by making use of multicore processing.
The surface of the whole Beijing city is divided into 15 subareas based on the four main interior rivers and their branches. The average area of each surface model is about 100 square kilometers, but their areas are uneven, with the largest about 200 square kilometers.
Mesh Generation
As the basic simulated unit of the surface model, the mesh should be generated on the basis of thorough planning, especially for a detailed flooding model. In constructing the Beijing urban flooding model, the main problems in planning mesh generation include mesh size, combining subareas with different mesh sizes, control lines, and mesh shape.
When constructing a hydraulic flooding model for a large city such as Beijing, one challenge is to find a suitable balance between efficiency and precision. The mesh size determines the balance. If the mesh is coarse for an overview of the whole city, then the topographical detail of the urban area cannot be expressed adequately. It may lead to a wrong surface convergence and reduced precision if a thin water-blocking object is ignored because of the coarse mesh. If the mesh is refined for high precision of the surface information, then a large number of meshes will lead to a reduction in computational efficiency. The mesh should be as fine as possible within the limits of computing power.
Taking into account both precision and efficiency in flood simulation, two kinds of surface models were established for the main city of Beijing. The difference between them is the description precision of the land surface and other modeling objects. The most obvious difference is mesh size. The coarse-mesh model is called a generalized model in which the mesh size is about 100 m. The refined-mesh model is called a detailed model in which the mesh size is about 5–10 m. The generalized model is quick to run but the result is less accurate, whereas the detailed model needs more computing time but the result is more accurate. There are 15 subareas in the main city, and each subarea includes these two types of surface models with different precision levels. They can be combined together according to practical requirements. The advantage is that a high precision model of a region can be realized with due consideration given to the basin integrity of the whole city.
Control lines and methods of extracting them are another important factor when generating a mesh. DEMs are usually displayed as uniformly spaced grids. Because of the uniform point spacing, DEMs can “jump over” break lines without identifying ditches, stream centerlines, steep banks, roads, and other similar features. Here, it means that the width of these features is insufficient to be treated as a 2D mesh. However, these linear features generally influence the overland flow because of special elevation such as narrow walls or roads. They may constitute a passageway for water or a water-blocking object. Not taking them into account will lead to incorrect analysis and poorer results. These linear features affect the water flow and need special consideration. Identifying the linear features from high-resolution remote sensing imagery and matching them with mesh edges automatically using a spatial analyzing function based on GIS is effective in solving the problem of setting special edge types of a 2D model artificially. These edges are set to a special elevation in the 2D model for simulating their influence on overland flow (Duke et al., 2003). Another factor is the outlines of wide roads and buildings which are also considered as control lines for the mesh. The purpose is to ensure that the mesh of road and building is “pure.” The outstanding curb and the isolation belt of a road may also hold back surface water and therefore should also be set as control lines and assigned an especial elevation in the 2D model. Main roads and auxiliary roads are divided into different meshes to describe differences in elevation. The pure building mesh benefits not only from the expression of more reasonable waterlogging but also from the calculation of the surface water flux between the roof of a building and the ground using the Weir formula. The outlines of buildings and wide roads can also be extracted from remote sensing imagery based on GIS tools.
Given that too many irregular control lines present limitations to mesh generation, the ideal mesh should be properly boundary-fitted. To describe irregular control lines in the Beijing urban flooding model, an unstructured quadrilateral mesh mixed with a small triangular mesh is a good choice when taking into account both a boundary-fitted mesh and small quantities. In Figure 2, the red line is a special mesh line which is generated using a control line. Using a control line in mesh generation can reflect the true surface in more detail.
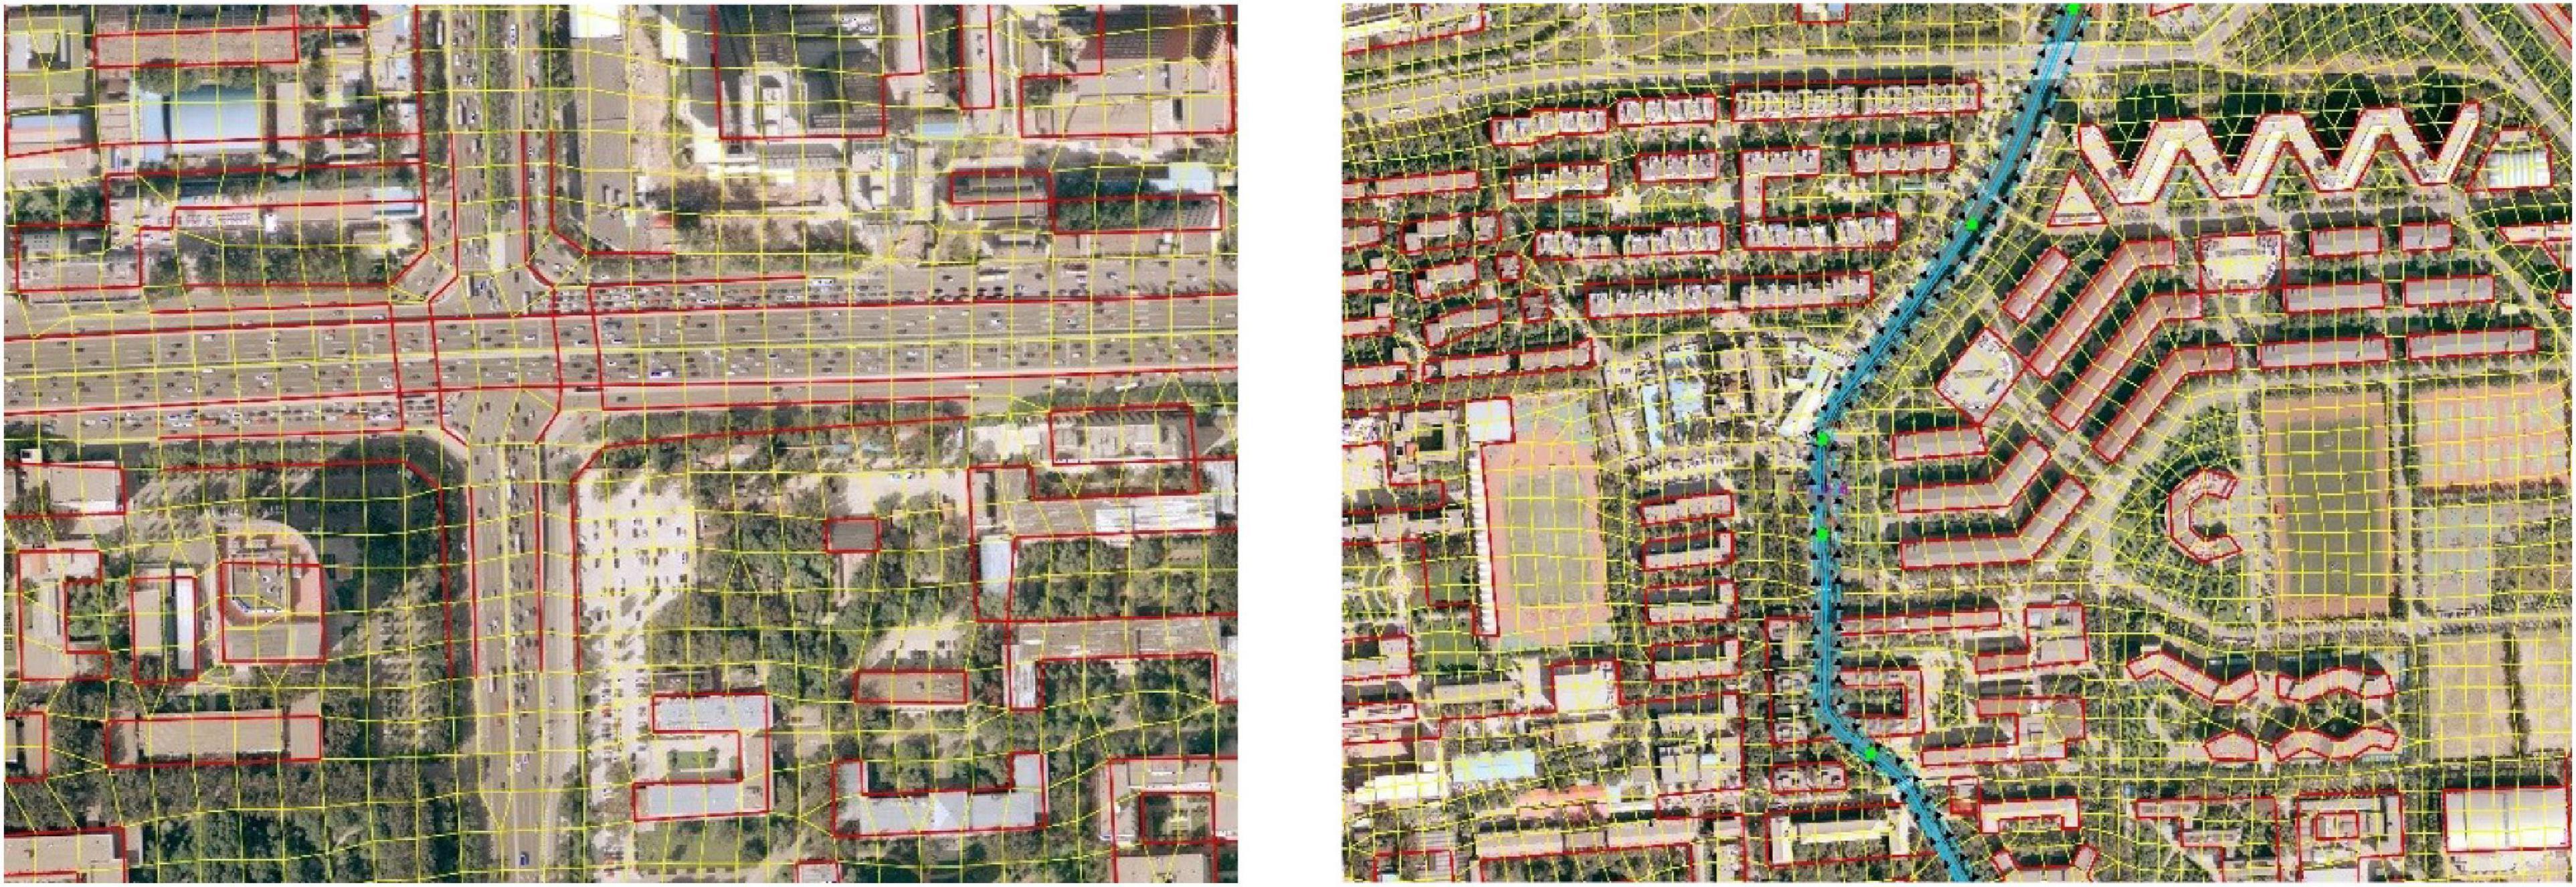
Figure 2. Control line for mesh generation (the red line).
Elevation Assignment and Amendment
Surface flow paths are easily modified by human-made features; hence, the flow diversion effects of buildings should be fully recognized. In urban areas, a detailed description of the ground surface is most crucial for a detailed model. However, the terrain data currently available from conventional cartographic surveys do not provide sufficient detail or timeliness to satisfy the need for a detailed hydraulic model, especially in urban areas where change is constant.
The elevation for each mesh in the Beijing urban flooding model is initially assigned using DEM data at a scale of 1:2000; the data are sourced from surveying and mapping departments and describe the dominant terrain gradients. This may be adequate for rural areas, mountainous areas, and heavy flood simulation. In Beijing city, however, the natural terrain is quite flat as a whole except for small local areas. Dense buildings and road networks lead to complex artificial terrain areas where many partially low-lying places appear and are easily waterlogged. In an artificial low-lying area, the partial microrelief plays a decisive role in the process of runoff flow concentration during a rainstorm. For those special meshes, the elevation was amended, respectively. They include roads, bridges, and buildings. For many roads, the more detailed and believable elevation data were gathered from the transportation departments and overlaid on the initial elevation data.
There are hundreds of overpasses in the main urban area of Beijing, and the majority are the lower concave type. In the bottom floor of a lower concave overpass, waterlogging occurs frequently in the flooding season and has a serious impact on traffic, even posing a danger to life. For better simulation, the partial microrelief of the lower concave overpasses and many barricades, even notable curbs, was obtained and amended separately using numerous techniques and generalization, such as local measurement, vehicle-borne LIDAR scanning, aerial imagery, and extrapolation according to the street view of online maps such as Baidu maps. Generating the surface model by detailed processing and reasonable data is an innovative aspect of the Beijing model and has been effective in improving the simulation results.
Figure 3 shows the obvious change in mesh terrain after elevation amendment.
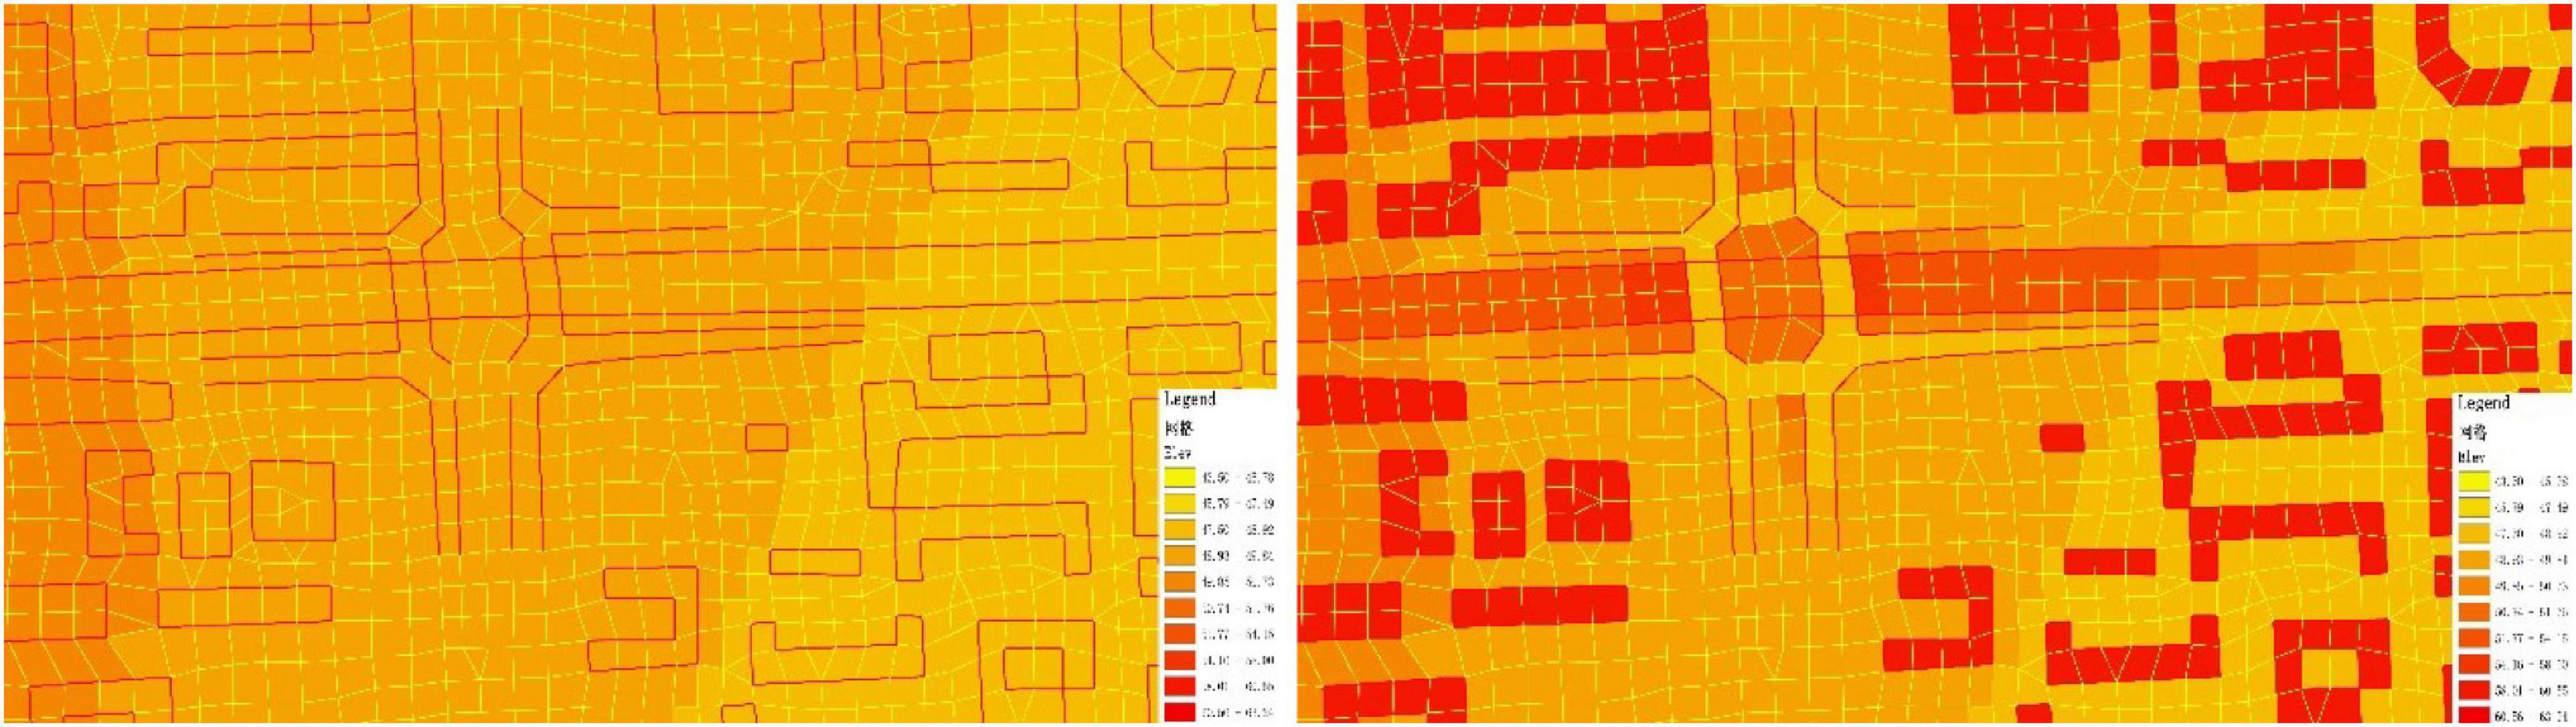
Figure 3. Elevation map before and after amendment.
In the Beijing urban flooding model, the elevation amendment of those special meshes is a labor-intensive manual procedure.
Rainfall Runoff
Another novel aspect of the Beijing urban flooding model is that the simulation of rainfall runoff and surface convergence is processed on each mesh of the surface model. It leads to a computational burden but is essential for simulating both the waterlogging caused by initial surface runoff and by pipe node overflow.
In simulating urban flooding, the hydrological process is separated conceptually from the hydraulic process. The computation of the surface runoff from rainfall can be carried out by a surface runoff model. In the Beijing urban flooding model, the rainfall–runoff process of the main city and that of the exterior were treated separately.
For the rainfall–runoff process of the exterior range, a surface runoff hydrograph is computed for each sub-catchment. Runoff hydrographs from each sub-catchment are then used as input to the hydraulic model. The processes of several river inflows to the main city which result from the exterior hydrological model were considered as 1D boundary conditions of the Beijing urban flooding model.
However, it is a different challenge when dealing with the rainfall–runoff process in the range of the 2D surface model. Rainfall was applied as a direct boundary condition over the 2D surface. Net rainfall is obtained after subtracting earlier water loss and land infiltration from the total rainfall. The earlier water loss includes evaporation, vegetation interception, and land depression storage at an earlier stage. The surface runoff of each mesh is equal to the net rainfall, and the computation of net rainfall is performed on each mesh. When simulating rainfall that has already occurred, a Thiessen polygons approach is applied to create 2D rain input files for distributing rainfall using records from several dozen rainfall stations. When simulating rainfall that is about to occur, a rainfall data product at kilometer level can be used directly to create 2D rain input files. After the rainfall–runoff process on each mesh, surface runoff begins to participate in surface convergence based on the surface model.
In some generalized flooding models, both infiltration and evaporation are neglected given the high density of impervious areas in a large city. However, in the urban area of Beijing, many areas of vegetation have been planted and many waterbodies have been impounded in recent years. According to recent data, the proportion of the vegetation area is about 33% in the range of the flooding model. Additionally, much of the rainfall in Beijing is not heavy. This means that infiltration and evaporation consume a rather higher proportion of the rainfall. In a detailed flooding model, infiltration and evaporation should not be neglected.
Earlier water loss in this model is set to a constant which is related to the land-cover type. The infiltration is calculated using Houghton’s infiltration formula. The infiltration parameters, such as initial infiltration and stable infiltration after saturation, are also set for each mesh according to the mesh’s land-cover type. However, many meshes are not pure. Three steps were taken to solve this problem. First, the basic infiltration parameters which are related to the land-cover type were measured for each type. In Beijing city, the land-cover types include buildings, vegetation (including green areas around buildings), bare land, waterbodies, blacktop, gravel or cement roads, and semi-hard pavements (such as pathways within the green belt). The measurements of earlier water loss and basic infiltration parameters for Beijing city are listed in Table 1. Second, high-resolution remote sensing data for the year 2018 were interpreted to produce a detailed land-cover type map of Beijing city. Third, the infiltration parameters for each mesh were calculated based on the basic infiltration parameters and the weighted averages of each land-type area in the mesh. Surface roughness for each mesh was calculated using the same method.
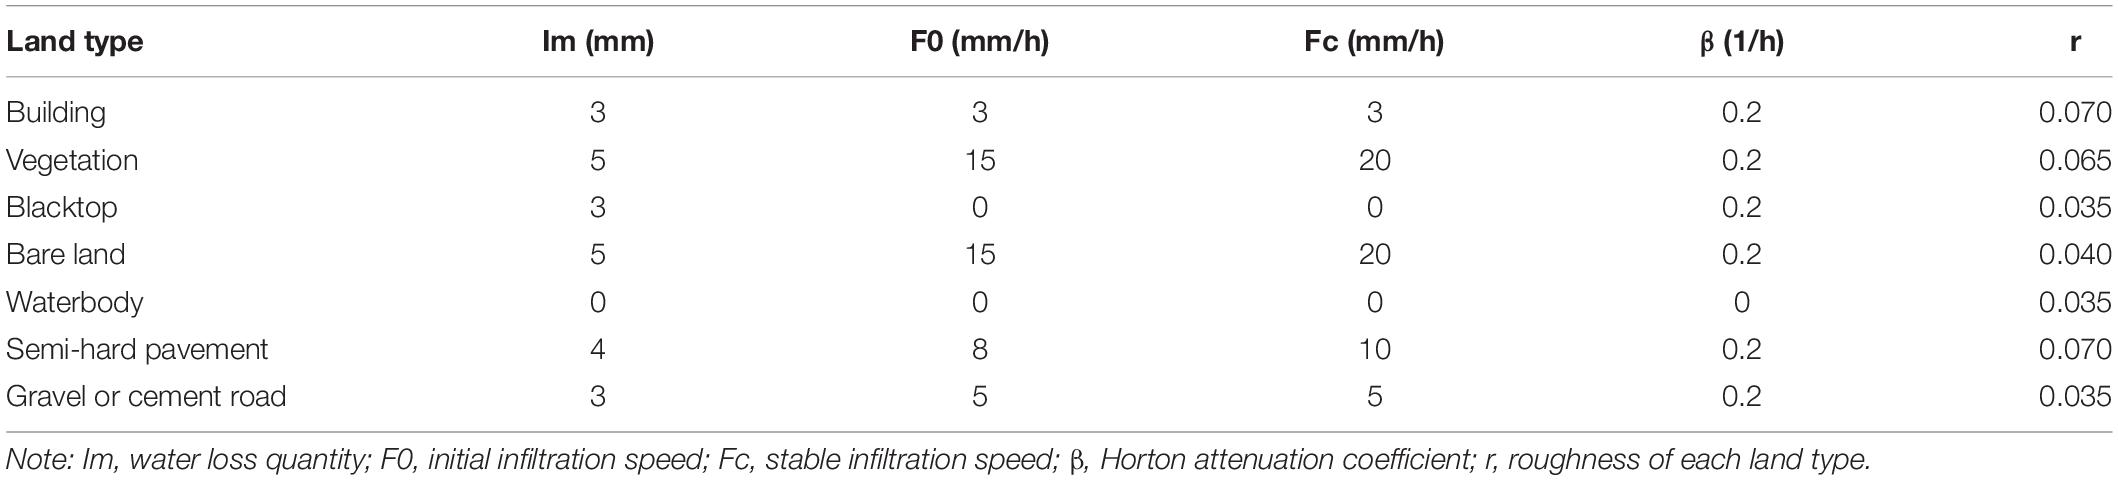
Table 1. The basic infiltration parameters for runoff in Beijing city.
The impact of land cover and the underlying surface on flooding is reflected in two aspects. One is the quantity of runoff, which depends on the strength of rain and the type of land cover. A surface with high vegetation coverage will produce less runoff than a surface with low vegetation coverage. Normally, the parameters for runoff production, such as initial hypotonic and stable hypotonic after saturation, will have been set or changed according to the mesh’s land-cover type. The second aspect is the roughness of the land surface, which affects the water flow velocity. The smoother the surface, the smaller the roughness, and the faster the water flow. In a similar way, the parameters for surface roughness of a mesh in the 2D model and of a cross-section in the 1D model can be set according to the land-cover type.
Underground Pipe Model
In the underground pipe model, the pipeline, rain perforated strainer, manhole, and pumping station are four kinds of important objects. There are two modes of drainage from surface to pipe system. One is through a rain perforated strainer, and the other is through a manhole. Rain perforated strainers and manholes need different treatments when modeling. A manhole receives water from many meshes that are located in the manhole’s catchment range. There is a virtual reservoir on top of each manhole for the temporary storage of a quantity of water equal to the catchment area’s drainage capacity. Extra water will be overland flow. The discharge from the virtual reservoir into the pipe system is calculated using the Weir formula based on the water level difference of two nodes. The overflow from the pipe system will spray out from the manhole if the pipe is full and the water head of the manhole is much higher than that of the surface. On the whole, this is a generalized mode of drainage. The most significant problem is making a reasonable catchment division and assigning each one a reasonable maximum drainage capacity. However, it is very difficult in those areas with a great complex of pipes which intersect each other.
The other mode of drainage through rain perforated strainers instead of manholes is purely physical. This mode of drainage is a novelty of the Beijing flood model. A rain perforated strainer receives water only from the surface mesh where it is located. For those other meshes with no rain perforated strainers in the locality, the surface runoff will not enter the pipe system until it meets a rain perforated strainer. This mode of drainage is much closer to reality, but the need for a perfect pipe system is a vital necessity to obtain an ideal simulation result. Additionally, the coverage of the rain perforated strainers is so dense in urban areas that it is not easy to obtain perfect data. The problem of deciding on the kind of drainage mode should be determined by the quality of the rain perforated strainer data. In many cases, these two drainage modes can be used simultaneously.
The other object that the model supports is the pumping station, which is considered as a kind of operating condition in the pipe system. In Beijing city, many lower concave overpasses mainly depend on a pumping station for drainage during a heavy rainstorm because the inherent routine facility based on gravity cannot fulfill the need for fast drainage. After the heavy rainstorm of 2012-07-21, many rainwater traps were built under the main bridges. When simulating a heavy rainstorm, neglecting the function of the pumping stations and rainwater traps will lead to “false” serious surface waterlogging in the lower concave overpasses.
River Model
In constructing the river model, there are two points worth mentioning. One is that there are many flood control engineering facilities located at the river in Beijing city. Their control of waterflow should be simulated in the 1D river model. Another point concerns river cross-sections.
Flood control based on engineering facilities through the urban river system is an important measure to reduce flood risk in Beijing city. In recent years, a number of small lakes were landscaped in city parks, except for the big gravel-pit parks in wet suburbs. The rivers joining these new lakes and several of the existing large lakes, such as the Kunminghu lake, Yuyuantan lake, and Longtanhu lake, form a dense water system with a considerable flood capacity. It is necessary to set down a series of reasonable control rules and pre-arranged planning for the water system to play a constructive role in flood control. There are more than a hundred water gates in the river system of Beijing city. Several are always used for flood control, while others are used only during heavy rainstorms. However, rainfall is often light in Beijing, and more water gates are partially opened according to the upstream water level and the forecast rainfall in order to maintain a landscaped water level in the lower reaches, because water resources are so valuable in Beijing. Each water gate has its own operating water level which is preset based on experience. The gate will be completely closed if the current water level at the gate is lower than its operating water level. The gate will be partially open if the current water level is a little higher than its operating water level, and completely open if the current water level is about half a meter higher than the operating level and heavy rainfall is forecast. Such careful consideration of the gates in the river model improves the simulation result and is especially significant for simulating a medium level of rainfall. An initial water level for each reach is set according to the routine river level before rainfall in the flooding season, instead of simulating from a dry riverbed. This is a better method for simulating short-term rainfall. Setting actual initial water levels and refining the flood control rules in the 1D river model ensures that the simulation result is more reasonable both for heavy rainfall and regular rainfall. Another problem concerns river cross-sections. It is very costly in terms of human and material resources to survey river cross-sections (including underwater elevations) and the cross-sections are always changeable. Generally, a relatively small number of cross-sections, especially where a significant change in conveyance occurs, are selected as representative of average conditions in those reaches without permitting excessive conveyance change between cross-sections. However, this does not satisfy the requirements for a refined hydraulic river model, especially for natural rivers. Automated procedures normally use high-density elevation points that are sourced from stereo-photogrammetric models or LIDAR datasets. Computer generation of a potentially large number of cross-sections can supplement those from surveys as long as there is no significant change in the stream channel geometry below the water level.
Model Coupling
In the process of surface convergence, surface runoff will flow into the underground pipe network when meeting rain perforated strainers and will begin to participate in pipe convergence. Pipe runoff will flow into the river at the outlet and begin to participate in river convergence. Obviously, surface runoff may also flow into a river directly. Exchanging and transmitting hydraulic parameters between different models are performed via a coupling module. The Beijing urban flooding model includes a 1D river model, several 2D surface models, an underground pipe model, and a coupling module. The purpose of coupling different models is to transmit real-time parameters such as water levels or the discharge of junction objects which connect the models. The duty of the coupling module is to search and find the correspondence relations between junction objects.
The Coupling of the 2D Surface Model With the Underground Pipe Model
Runoff generally starts as overland flow on the ground surface before entering the underground pipe system. Surface water can enter the pipe system by flowing through rain perforated strainers. In many commercial hydraulic models, manholes are normally generalized as the water entrance of many surrounding meshes from surface to underground pipe. In the Beijing urban flooding model, the junction object of the 2D surface model with the pipe model is meshes and rain perforated strainers or manholes. Manholes are generalized as the drainage entrances of many surrounding meshes in areas except for main roads. In main road areas, the mesh runoff will continue as surface convergence until it meets a rain perforated strainer and flows into the pipe system. Of course, overflows from manholes will turn into overland flow with existing runoff. The processing is much closer to reality. The coupling mode between surface and pipe was the first to be established.
The Coupling of the 2D Surface Model With the 1D River Model
Water exchange will happen between river and surface when the water level of river or mesh is higher than dike elevation. The junction objects of the 2D surface model with the 1D river model are river cross-sections and nearby edges of the surface mesh.
The Coupling of the Underground Pipe Model With the 1D River Model
In normal conditions, pipe drainage will flow into a river at an outlet if the pipe water level is higher than that of the nearest river cross-section. Otherwise, if the water level of the river is much higher, pipe drainage will be restrained because of river flood prevention. At this point, the drainage function of the pipe network is no longer in force and may result in waterlogging. The junction objects of the 1D river model with the underground pipe model are river cross-sections and pipe outlets.
The main content of the coupling module includes the junction object’s corresponding relations between different models and the methods of calculating the discharge transmitted. Building the junction object’s corresponding relations for different models is a heavy duty for the coupling module. However, it would cost much more time and energy and be difficult to update using artificial matching methods. It can be realized effectively, accurately, and automatically based on GIS spatial analyzing functions and the modeling tools of the IWHR urban flooding model.
Results
Here, we describe some of the simulation results based on the Beijing urban flooding model, built as above, and their application to Beijing city’s flood control system.
Analysis of Model Rationality
After constructing the Beijing urban flooding model, three historic rainstorm events were selected to simulate the flood process within the study area and to analyze the model’s rationality. These were the rainstorm events of 2012-07-21, 2016-07-20, and 2017-06-21. Three of Beijing city’s key hydrological observation stations on the main rivers were selected as the validation points of the 1D river model. Their locations are the Shenjiafeng gate on the Qinghe River, the Lejiahuayuan gate on the Tonghuihe River, and the Fenhongdao gate on the Lianghsuihe River. For the surface model, about 30 lower concave bridge areas and sections were selected, and some monitoring data of water accumulation and statistically reported data were collected for verification. For the pipe network, two monitoring points were selected for rationality analysis.
The rainstorm of 2012-07-21 lasted a short period. The rainfall was mainly concentrated in 10 h with an average rainfall of 215 mm in urban areas. However, the heavy rainfall lasted for rather longer and the maximum hourly rain was up to 101 mm. The rainstorm of 2016-07-20 lasted a long period and was concentrated in 43 h with an average rainfall of 291 mm in urban areas, but the rainfall intensity was smaller than that of the famous 2012-07-21. The maximum hourly rain intensity was 56.8 mm. The rainstorm of 2017-06-21 was wide-ranging and uniform. The cumulative rainfall was large with the heavy rainfall appearing in the later period and lasting about 50 h.
Figure 4 demonstrates the simulated and the measured discharge of the rivers for the rainstorm of 2012-07-21 at the three selected cross-sections. The measured peak discharge at Shenjiafen was 629 m3/s, and the simulated discharge was 641 m3/s. The difference in peak discharge was +12 m3/s (+1.9%). At Lejiahuayuan, the measured peak discharge was 440 m3/s and the simulation was 386 m3/s. The difference in peak discharge was −54 m3/s (−12%). At Dahongmen, the measured peak discharge was 515.9 m3/s and the simulation was 513.2 m3/s. The difference in peak discharge was −2.62 m3/s (−0.51%). For the rainstorm of 2016-07-20, the measured peak discharge at Shenjiafen was 389 m3/s and the simulation was 355 m3/s. The difference in peak discharge was −34 m3/s (−8.8%). At Lejiahuayuan, the measured peak discharge was 224 m3/s and the simulation was 260.67 m3/s. The difference in peak discharge was +36.67 m3/s (+16.4%). At Dahongmen, the measured peak discharge was 513 m3/s and the simulation was 429 m3/s. The difference in peak discharge was −84 m3/s (−16.4%). The results show that the simulated flood process was not in high accordance with the actual measures, but the difference in the total flood volume of the three cross-sections was less than 8.8%. For the rainstorm of 2017-06-21, the measured peak discharge at Dahongmen was 124 m3/s and the simulation was 115 m3/s. The difference in peak discharge was −9 m3/s (−7.24%). The difference in the total flood volume was −8.47%. The main river discharge calculated by the model was similar to the measured volume, and the simulation result of the 1D model was therefore considered to be reasonable.
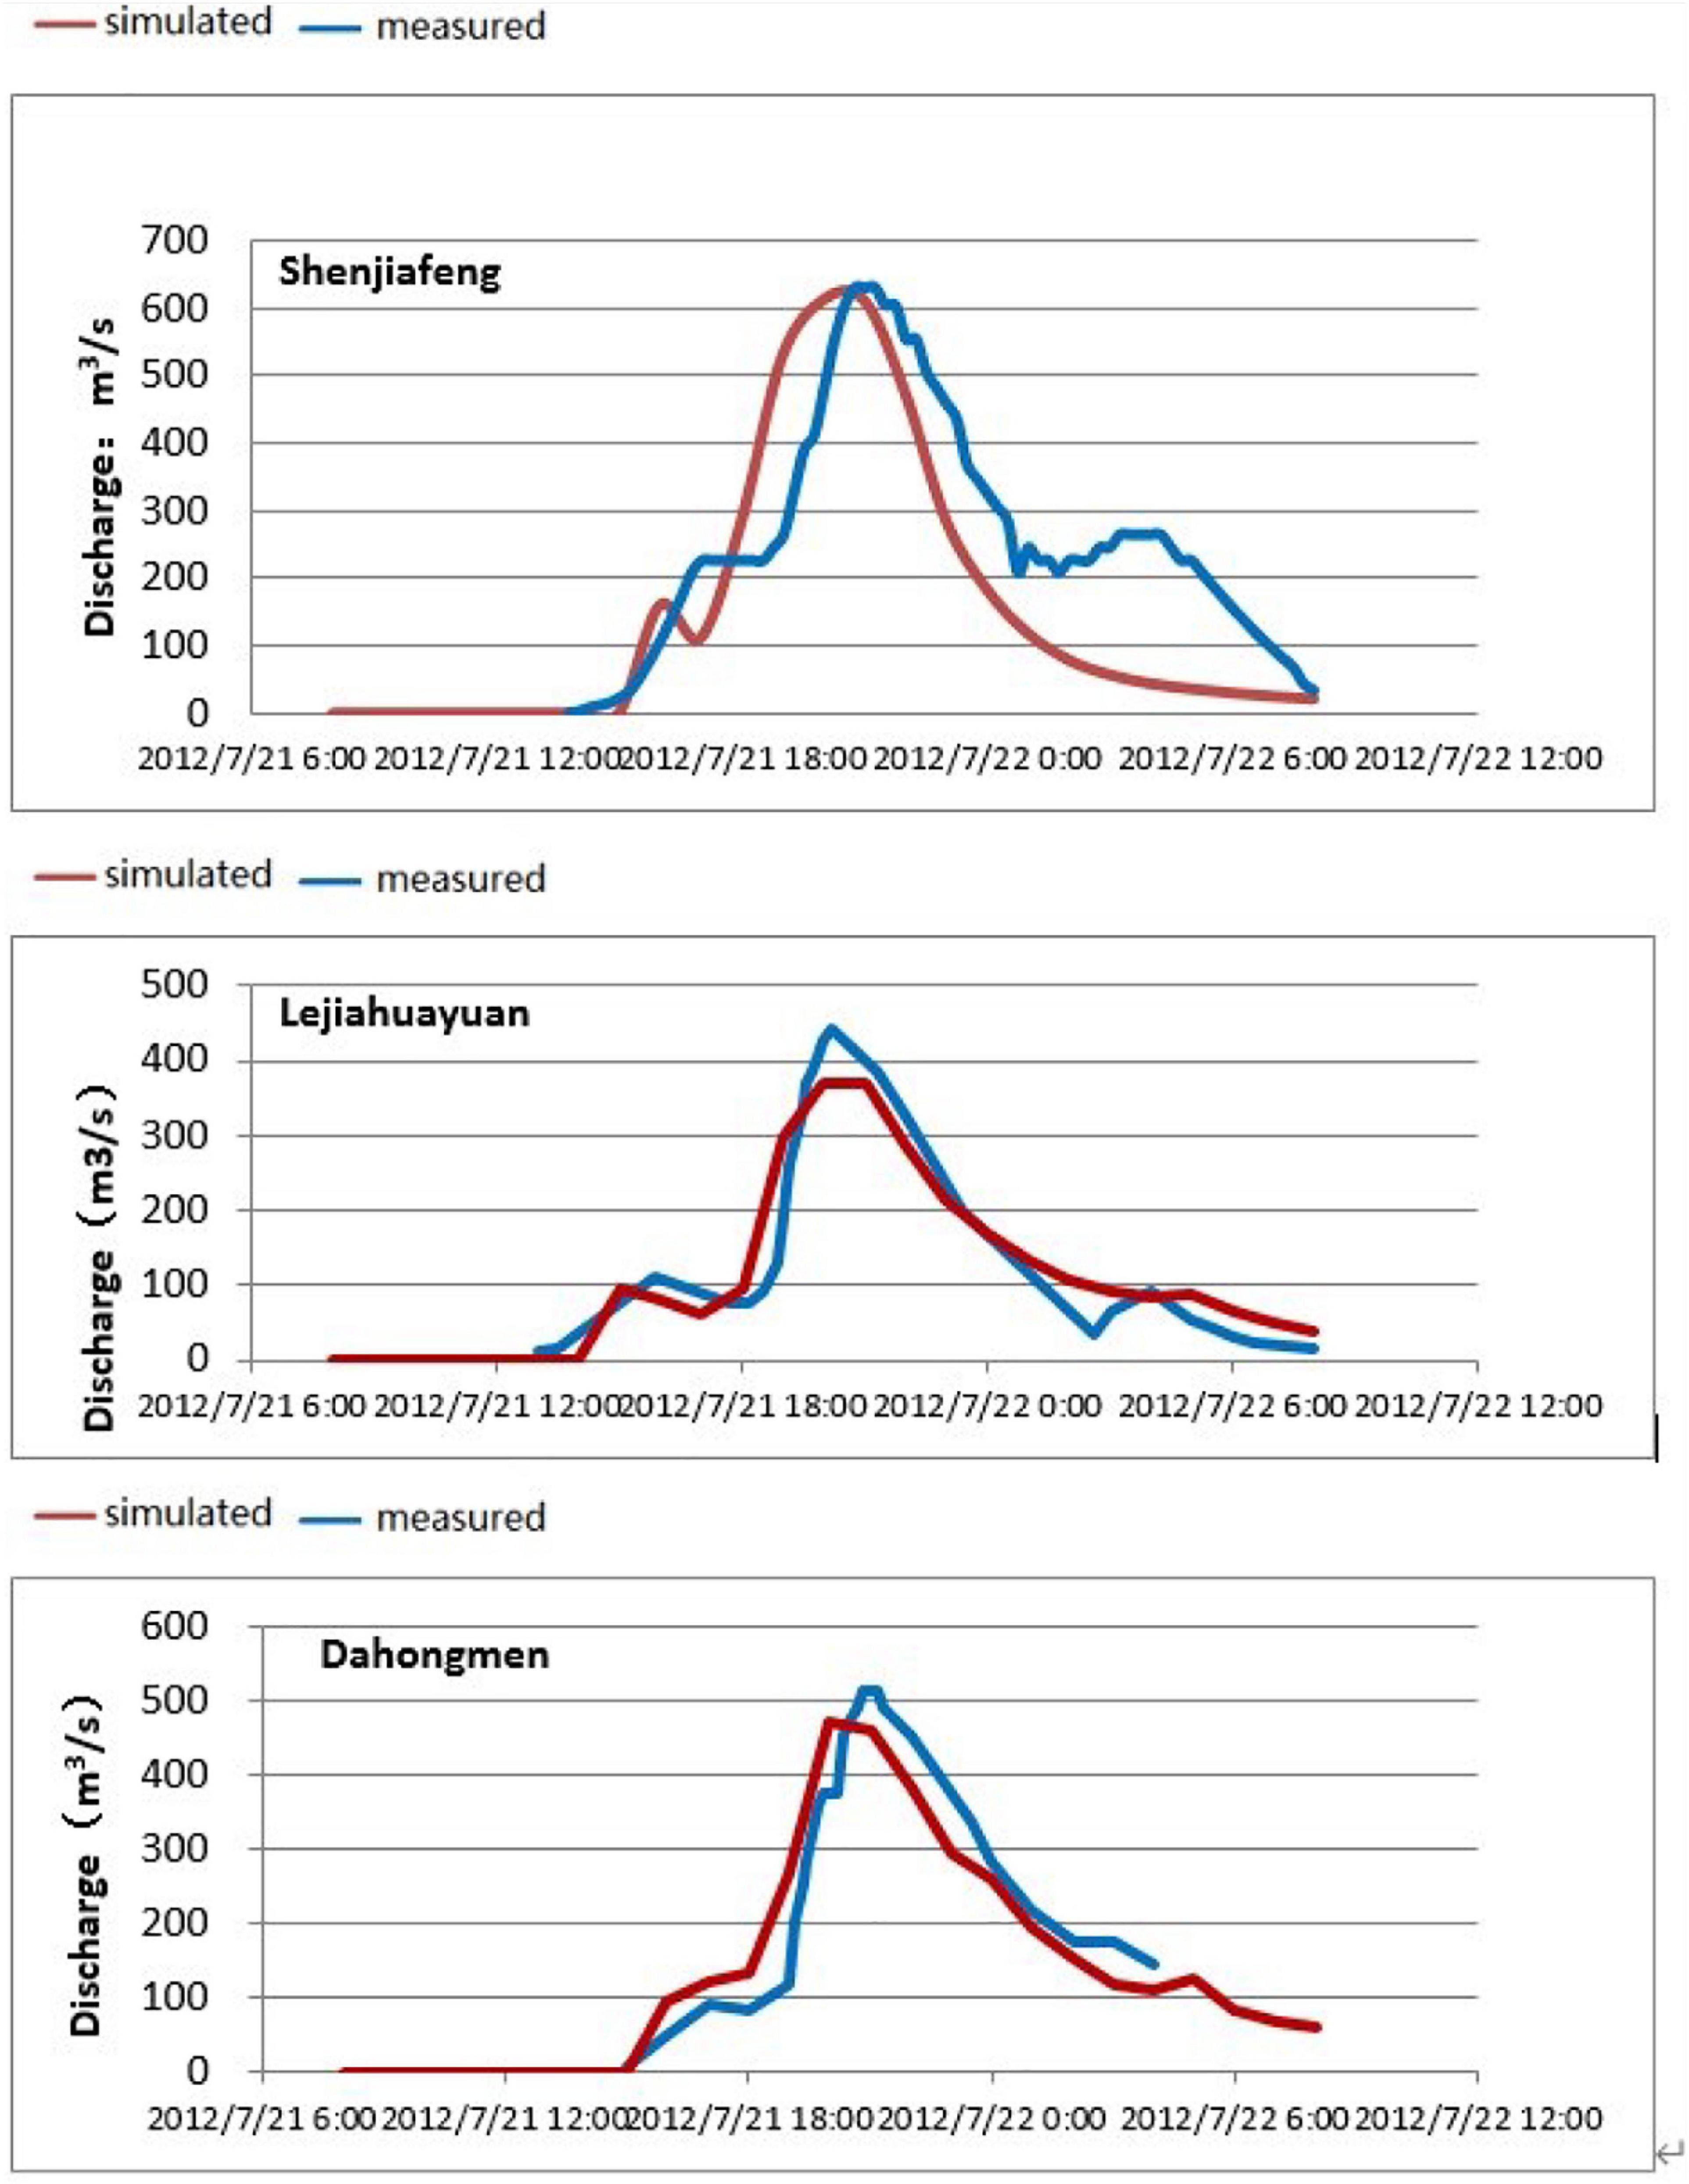
Figure 4. The simulated and the measured river discharge of the 2012-07-21 rainstorm.
A number of waterlogging sites with risk levels were selected as the factor for the verification of surface simulation results. The risk level was graded according to the maximum waterlogging depth. In the Outdoor Drainage Design Code, it is generally considered that rainwater amounts that are less than 15 cm will not affect traffic or other hazards (Zhang et al., 2012). Ordinarily, water depth greater than 27 cm will affect traffic, while a depth greater than 40 cm will affect pedestrian safety. According to this standard, levels between 15 and 27 cm water depth were considered low level, levels between 27 and 40cm water depth medium level, and levels greater than 40 cm water depth high level.
Since 2019, about 100 waterlogging monitoring stations have been built in Beijing. The rainstorm of 2020-08-12 was the strongest and the most wide-ranging in the last 2 years. It lasted about 24 h, and the total rainfall was about 158 mm. The time and space distribution of this rainfall was very uneven. The strongest point of the rainfall was about 40 mm in 10 min, causing much waterlogging. The model results showed that 142 sites were waterlogged, and about 40 of them were seriously waterlogged. After the rainstorm, the waterlogging data collected from 16 monitoring stations were considered valid. Table 2 compares the waterlogging depth and risk level results of the simulated data (via the model) with those of the measured data (via the monitoring stations).
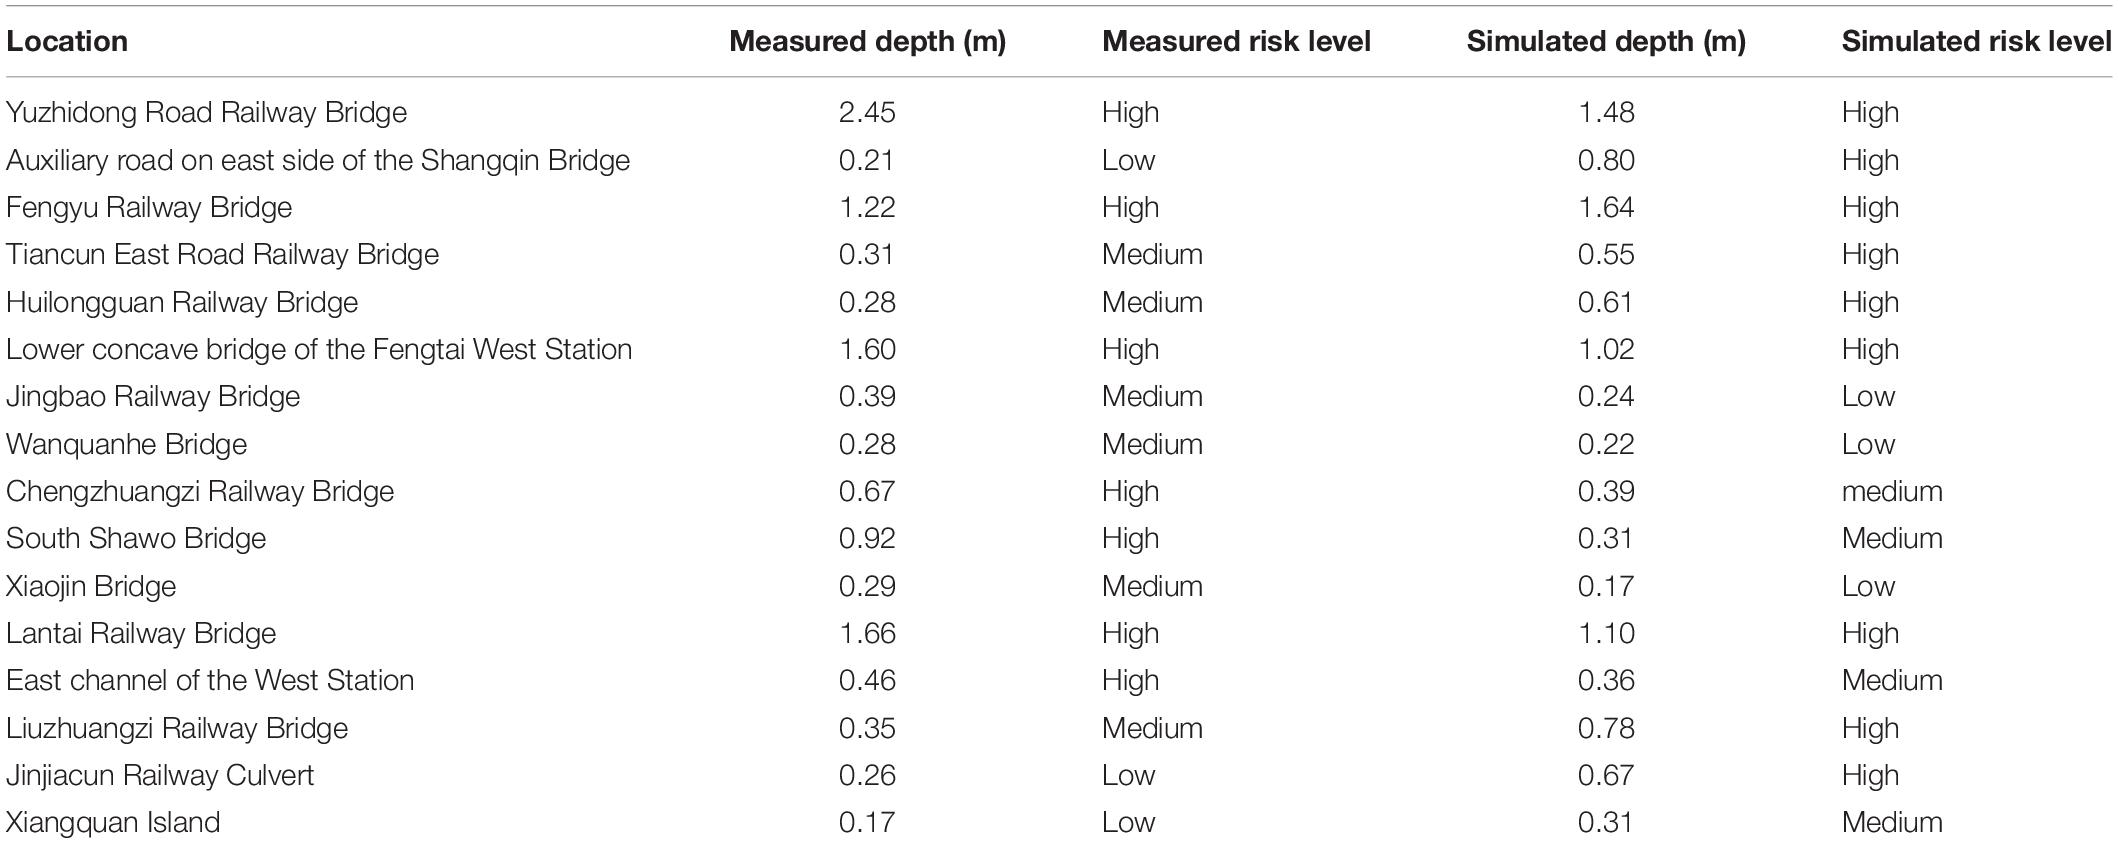
Table 2. The simulated and the measured depth of waterlogging of the 2020-08-12 rainstorm.
Simulation of Typical Rainstorm Scenarios
The original intention in constructing the Beijing urban flooding model was to produce a quick simulation of a forecast rainstorm. The aim is to provide concrete data about the coming waterlogging for flood control. The simulation results of a forecast rainstorm can help people to identify flood risk at an early stage and provide early warnings about waterlogging locations and processes. However, the problem at present is that the model is so large that it is difficult to obtain a real-time simulation result quickly. A simulation using a detailed model of the whole city will need so much time that it cannot satisfy the requirement for real-time reporting. The combination of a generalized model of most subareas with a detailed model of some areas of the most concern is a good method for obtaining a result as quickly as possible.
Another method is to identify possible waterlogged locations quickly according to the results of a similar rainfall which has been simulated in advance and saved in a scenarios library. Based on the rainfall characteristics of Beijing city, many kinds of typical rainfall scenarios were designed and simulated in advance. A scenarios library of rainfall–waterlogging in Beijing city was then constructed, based on the design of different rainfall scenarios and their simulation results.
The rainfall scenarios include the recurring intervals of 1, 2, 5, 10, 20, 50, 100, and 200 years with short durations (1 and 3 h) and long durations (12 and 24 h). The scenarios of different frequencies were calculated according to the Beijing Hydrological Manual and Rainstorm Atlas. The amount of rainfall for a 1 h rainstorm of the above recurrences is 16, 27, 50, 68, 78, 96, 108, and 120 mm, respectively. The amount for a 24 h rainstorm of the above recurrences is 45, 72, 140, 200, 255, 340, 400, and 460 mm, respectively. Many scholars have proposed a variety of methods to establish a rainfall type of short duration. Among them, the Chicago rainfall pattern is generally applied to the design of a short duration rain distribution. It is based on the rain intensity formula and the rain coefficient of the non-constant rainfall synthesis method (Zhang et al., 2002). However, research on the rainfall features of Beijing city, based on 50 historic rainfall events spanning a 20-year period, showed that the rainfall pattern of Beijing was different from the Chicago rainfall pattern. The process of designing typical rainfall scenarios of long and short durations was based on the Beijing urban rainfall pattern instead of the generally used Chicago rainfall pattern, combined with actual measures. Figure 5 shows the simulation results for road and Lianhuaqiao bridge waterlogging using typical scenarios for a 24 h rainstorm with recurrence intervals of 10, 20, 50, and 100 years. It is obvious that Beijing city will suffer serious waterlogging if the rainfall is much heavier than the 20 year recurrence interval.
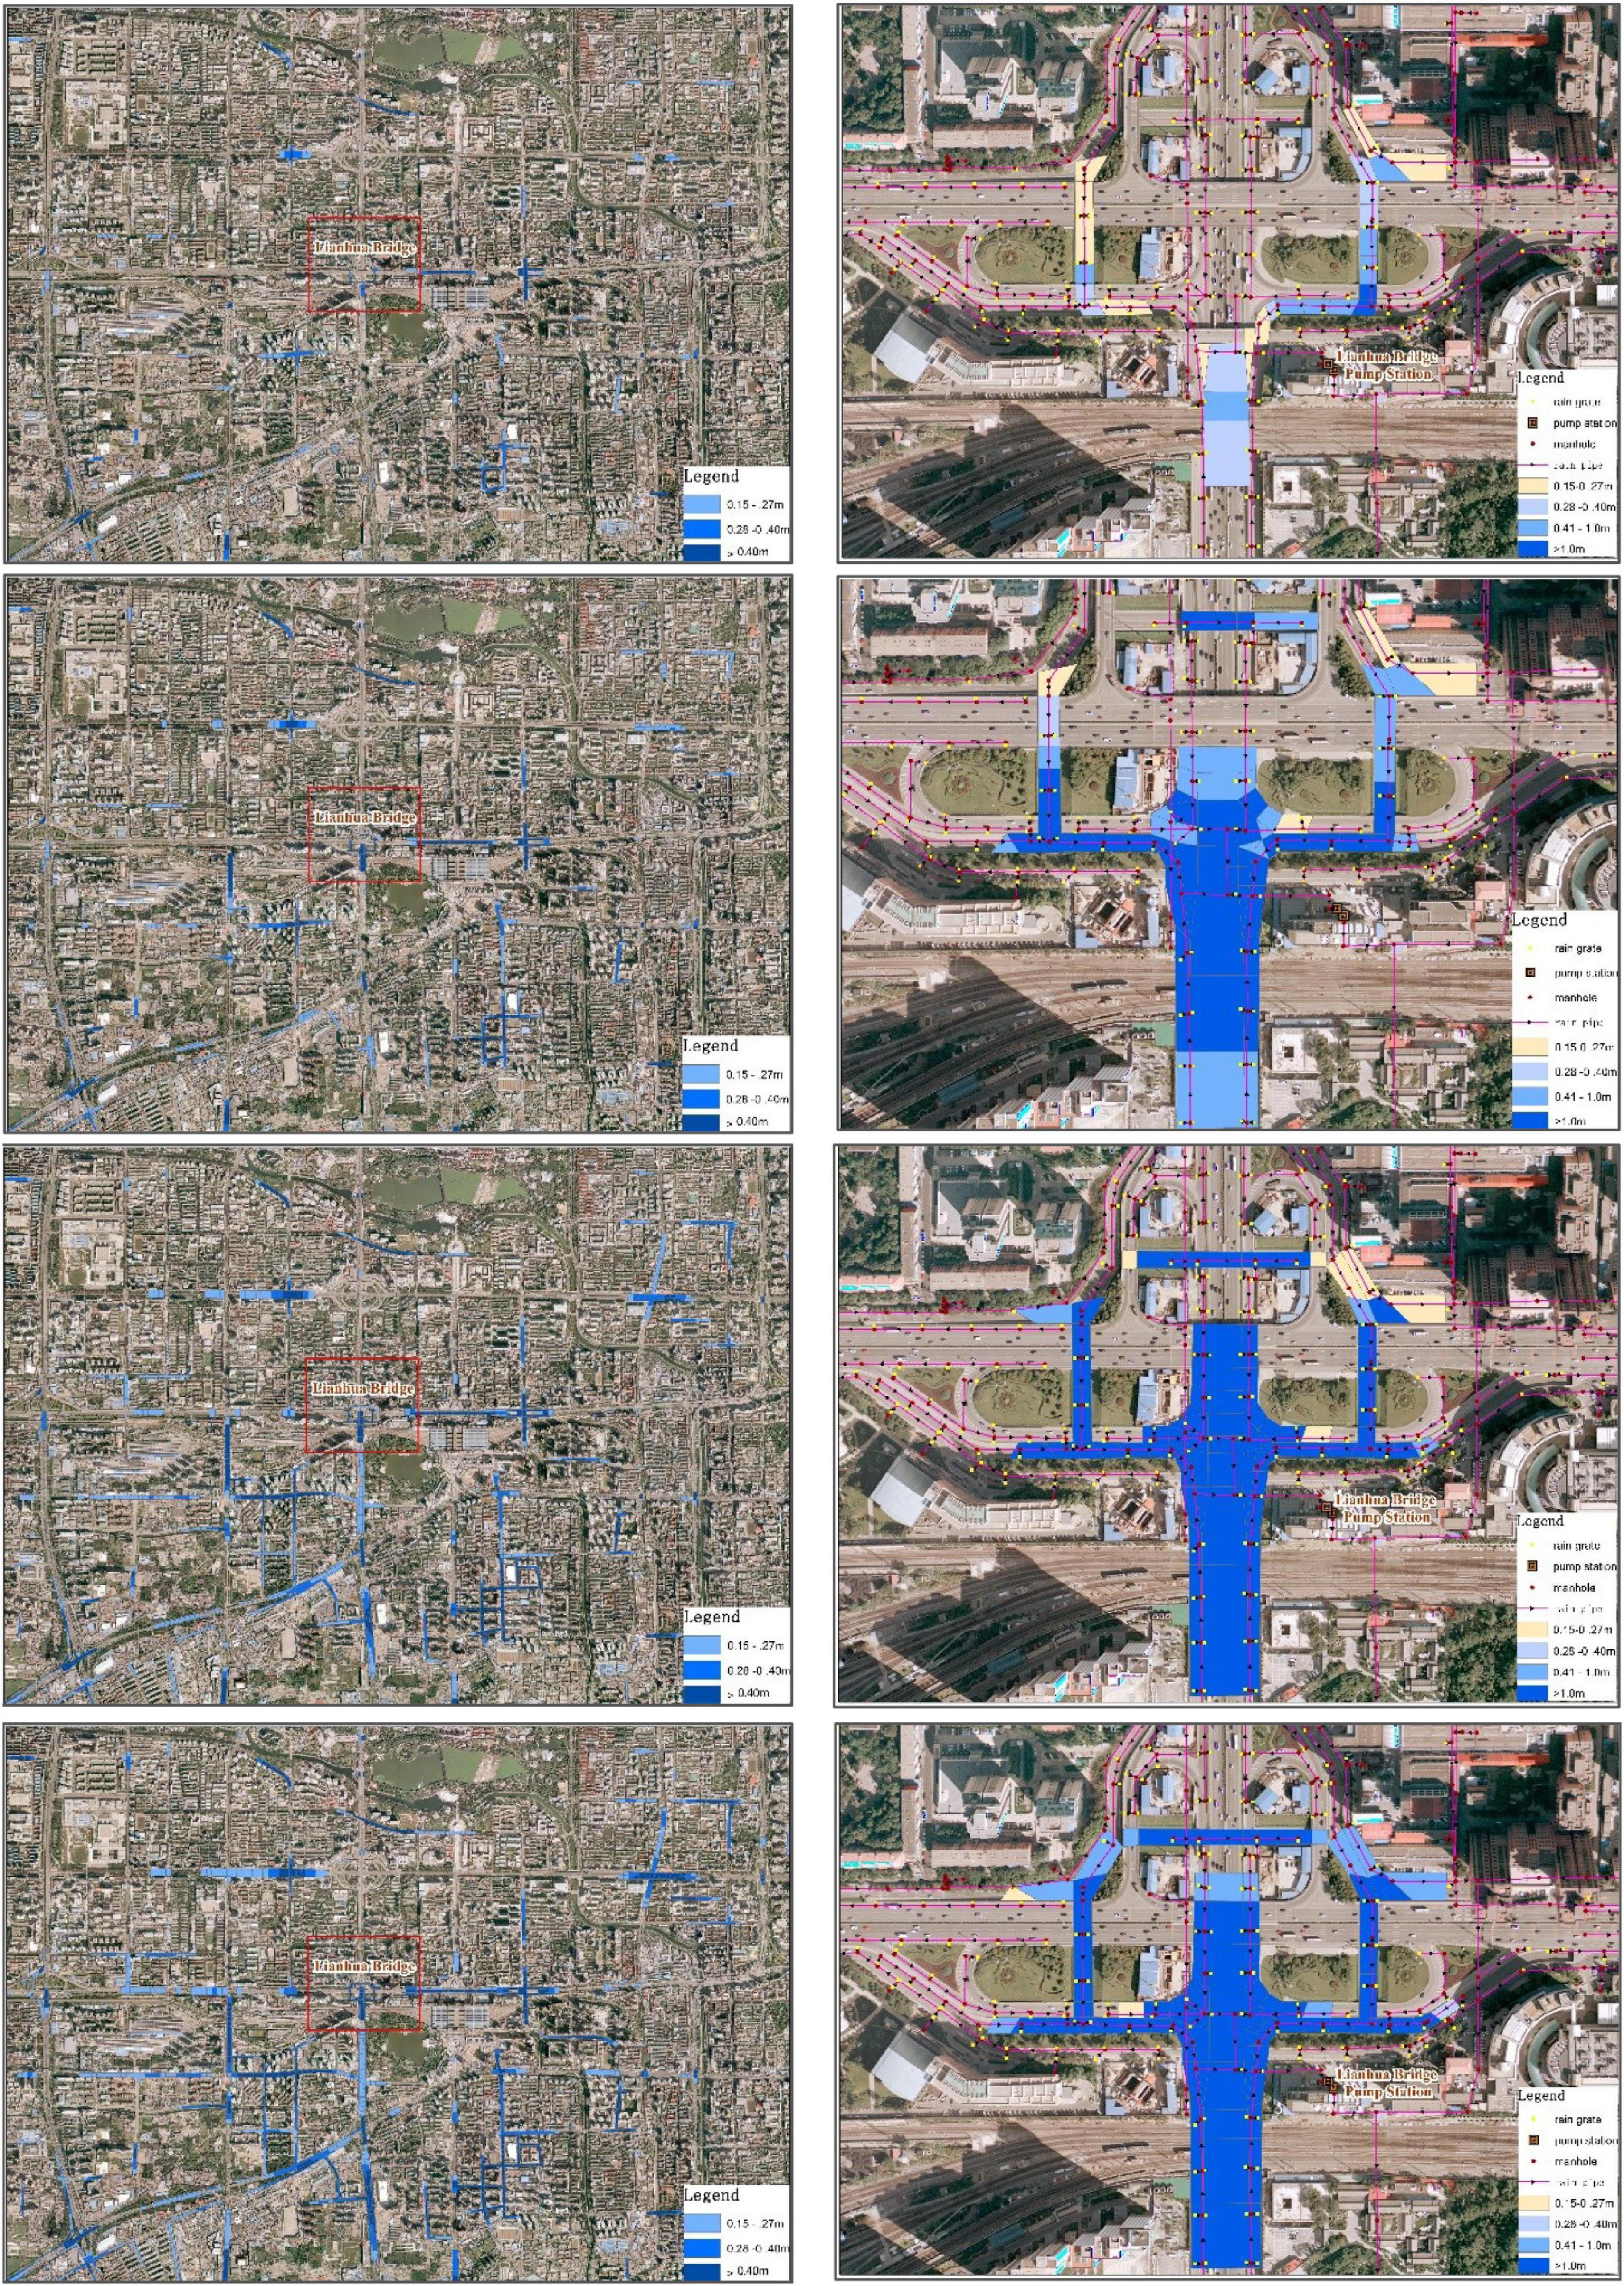
Figure 5. Waterloggin risk map of a forecast rainfall in Beijing city.
There are already more than 500 scenarios and corresponding simulation results in the scenarios library. They can and have been applied to many fields such as early warnings of waterlogging, analysis of the urban river flood discharge capacity, urban river and lake control, evaluation of the pipe network drainage capacity, perfecting drainage facilities deployment, drainage planning, and so on. Waterlogging in the urban area of Beijing occurs mostly in the lower concave bridge areas and the lower roads or residential areas. Through a detailed flood simulation, the reasons for water accumulation can be analyzed one by one according to the load state of the drainage facilities. This provides the basis for later engineering measures such as pipeline, rain grate, pumping station, and underground reservoir construction in the affected areas.
Early-Warning of Waterlogging Risk
At present, quickly simulating a forecast rainstorm and identifying the locations where waterlogging risk is high are the most important duties of the Beijing urban flooding model. Currently, however, with an approaching short duration rainfall of 1 h, the model can barely finish a simulation in 3 h to obtain peak flow at the downstream in 1 h. Most simulations of a forecast rainfall event need more than 1 h to finish the process and cannot satisfy those urgent demands because time is so expensive in a large city. In such a situation, the scenarios library of rainfall–waterlogging in Beijing city can play an important role (Xu et al., 2020a). According to the weather forecast, one or several rainfall scenarios can be designed quickly and the main parameters such as amount, intensity, spatial distribution, and approximate time duration of the forecast rainfall can be quantified. The next step is to find the most similar rainfall scenario through matching of rainfall parameters and to extract the corresponding simulation results from the scenarios library directly. Based on the possible water depth data, the waterlogging risk will be identified quickly. Early warning of waterlogging risk will provide a better basis for scientific decisions on flood control. Figure 6 shows the waterlogging risk level map of a forecast rainfall.
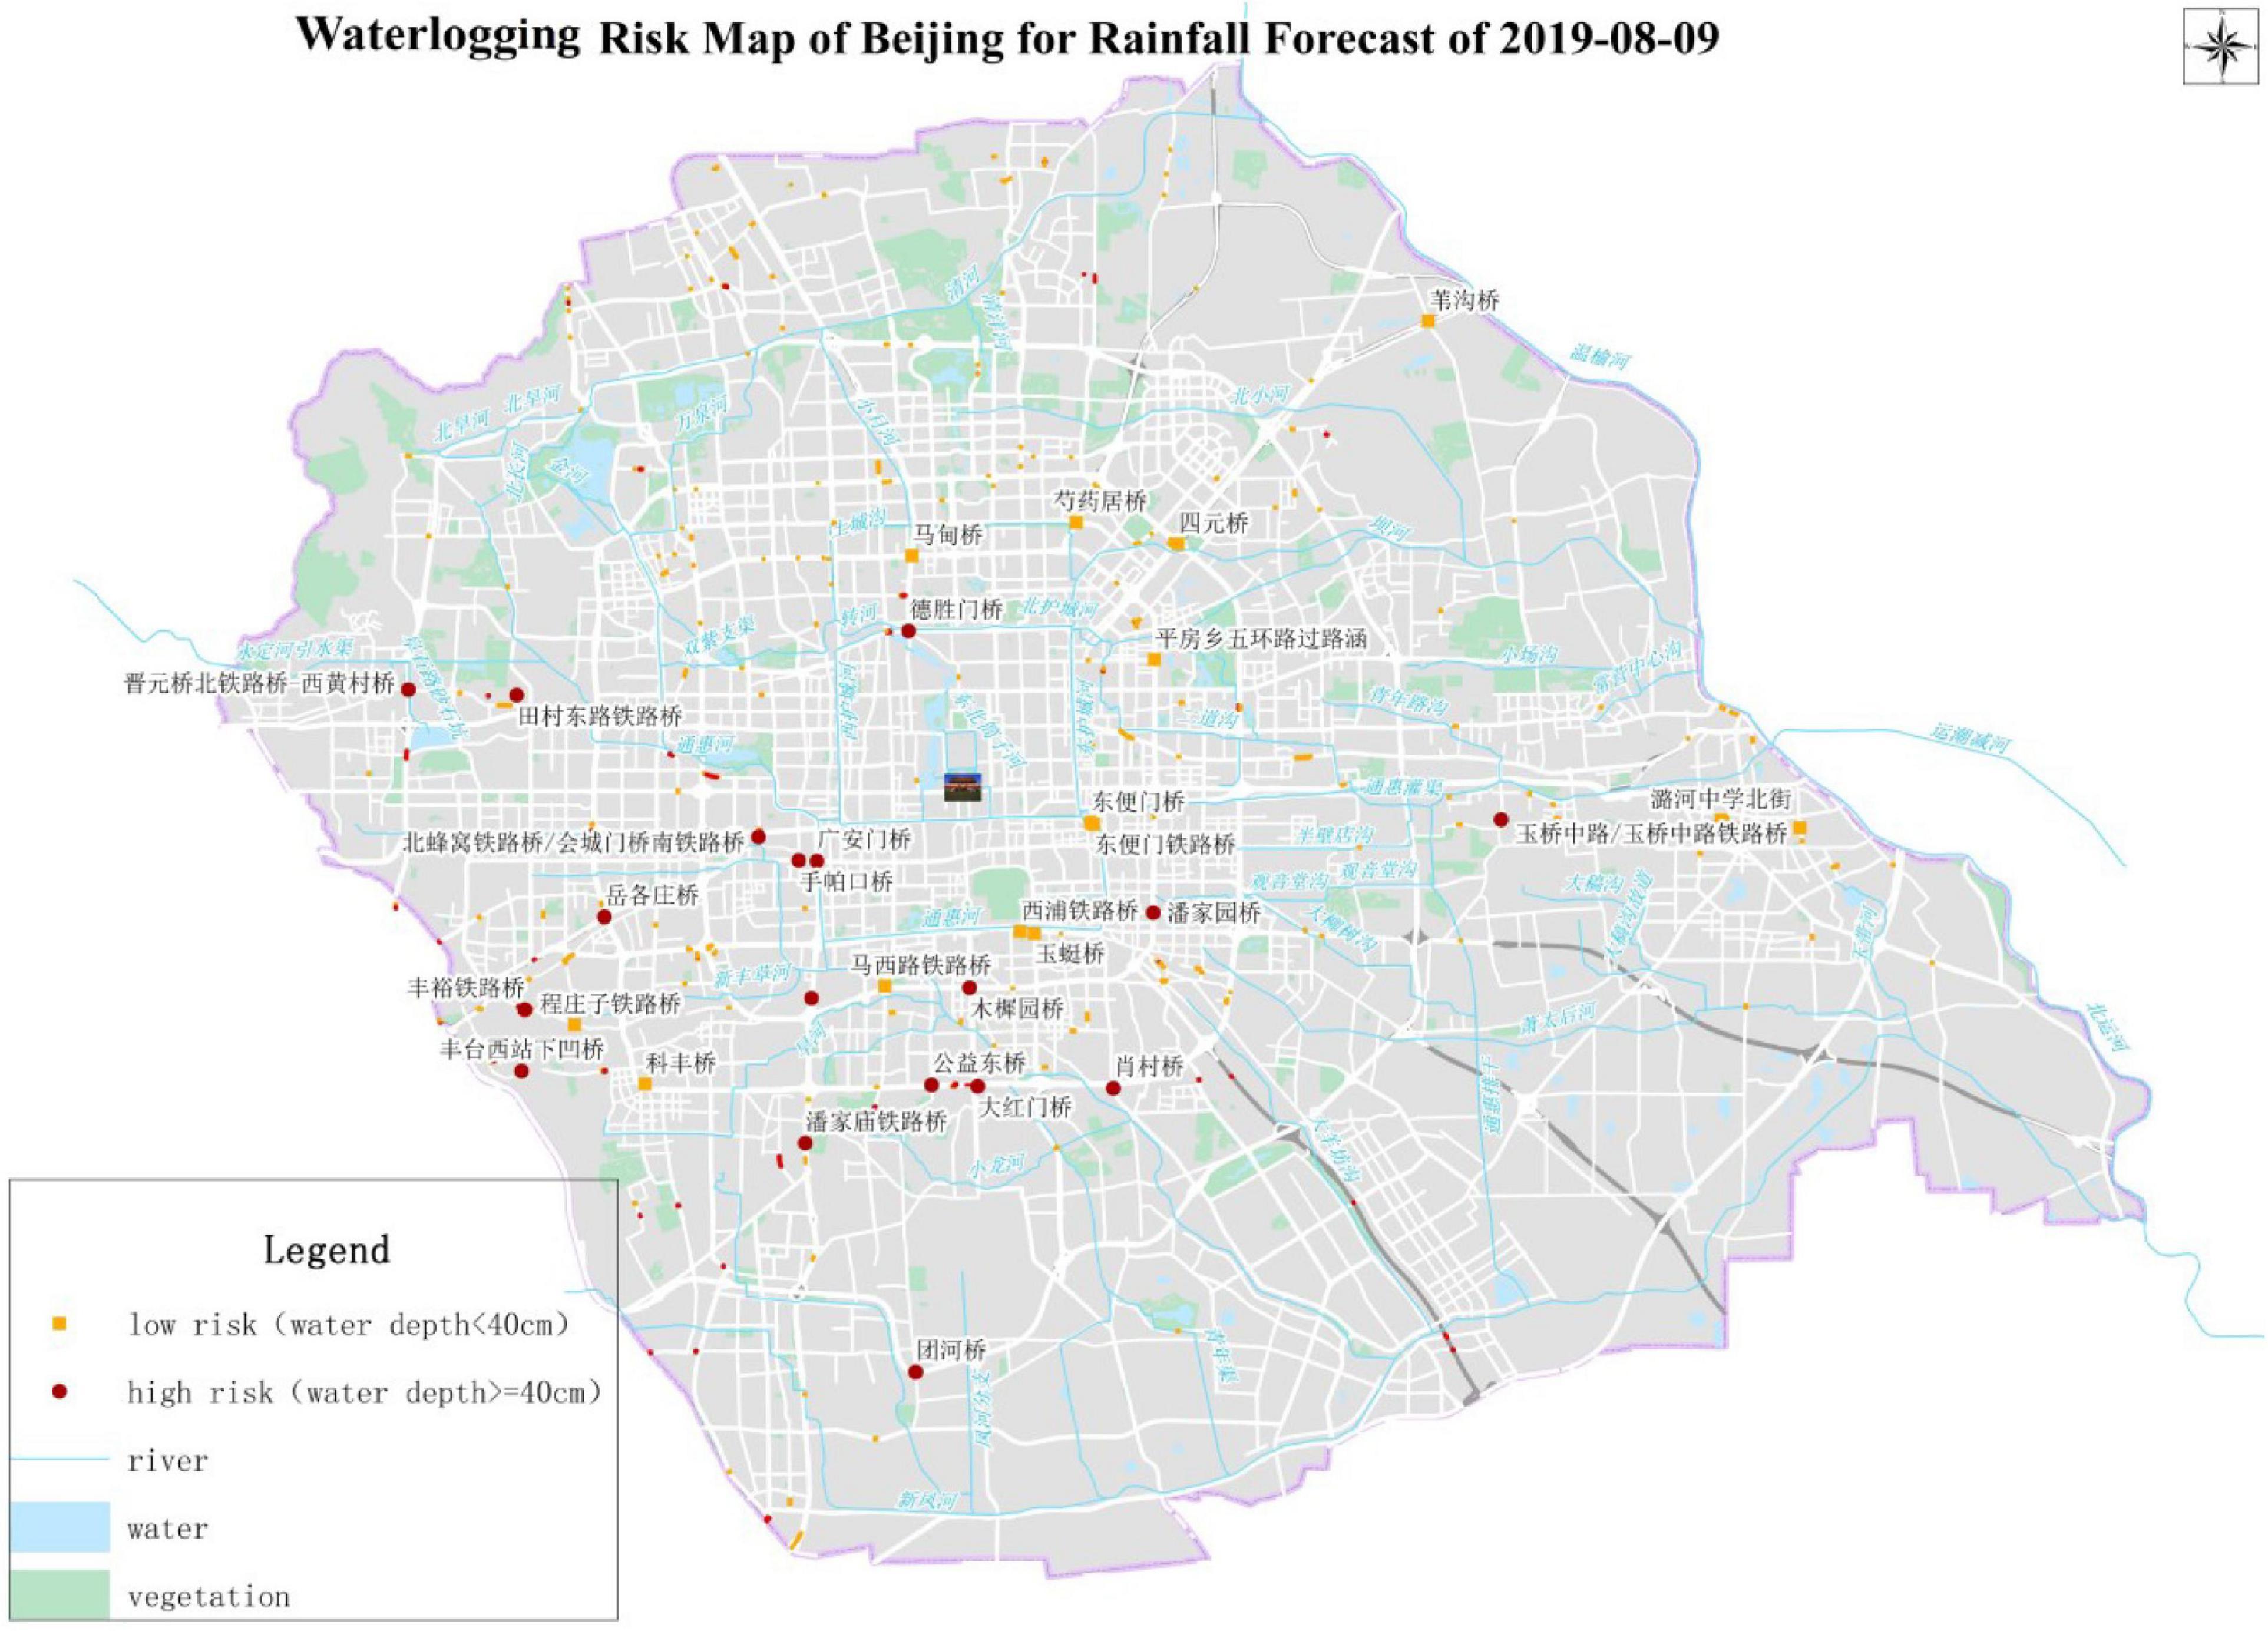
Figure 6. Waterlogging simulationg result of 10, 20, 50, and 100 year recurrence intervals.
Conclusion and Discussion
Conclusion
(1) The simulation result of a flooding model depends not only on the flow algorithm, but also on the accuracy of the surface characterization of urban areas. The accuracy of the data input determines the reasonability of the simulation results. Local microtopography is the decisive factor in water flow, especially for urban areas because of the influence of buildings and roads. When constructing the detailed urban flooding model of Beijing, much work was spent on a fine-grained description of the complex surface of the urban area so that the simulated waterlogging information is defined accordingly. The results indicate that the multi-mode generalization method described in this paper is effective and worth the time and effort invested in the process.
(2) The Beijing flooding model described in this paper can simulate the whole process of rainfall–runoff convergence. The rainfall is loaded directly on each mesh of the 2D model. Although a large amount of computation when calculating surface flow convergence reduces the efficiency of the model, a fine-grained simulation must satisfy the demand for precision first and for efficiency second. In addition, the procedure of this model provides a closer approximation to the real world and can simulate the whole waterlogging process. Of course, improving the model’s efficiency is the next most urgent goal.
(3) This model adopts a variety of coupling methods for the surface model and drainage pipe network according to the different data status of the pipe network. It is helpful in solving practical problems. In particular, the unique pure physical coupling mode in which rainwater enters the pipe system through rain perforated strainers is much closer to reality.
(4) Besides the goal of flood control, floodwater redistribution between water systems should also focus on maintaining the river landscape in terms of water levels. It means that the open extent of the water gates depends on the water level of the upstream and the coming rainfall strength. The model can optimize and improve the fine-grained regulation of river water resources, which is especially important in a city such as Beijing where water resources are scarce.
(5) This detailed urban flooding model is suitable for the integrated simulation of internal and external flooding and waterlogging. Internal flooding means the flood comes from the river through the city. External flooding means the flood comes from the surrounding rivers. In addition to supporting early warnings of waterlogging, it can also support the analysis of urban river flood discharge capacity, redistribution of floodwater between urban rivers and lakes, evaluation of the pipe network drainage capacity, perfecting drainage facilities deployment, drainage planning, and so on.
(6) GIS tools have become the most popular method for constructing, updating, and maintaining a complex hydraulic model. It makes the flooding model easy to understand and easy to construct. Visual expression by GIS tools makes the simulation results, which are always output in text format, intuitive, dynamic, and in real-time.
Discussion
(1) The high density of buildings and roads in urban areas creates a complex microtopography in flood risk modeling. Most of these areas may suffer waterlogging easily during rainstorms if the drainage capacity and efficiency are not strong enough. The detailed flooding model depends mainly on a refined surface microtopography. To realize a detailed flooding model of Beijing city, the microtopography of the road network and bridge areas was amended one by one through a variety of methods and was expensive in terms of time and effort. Hopefully, improvements in the technology and methods of spatial data acquisition and processing will make it easier in the future to construct a detailed urban flooding model.
(2) To achieve a more realistic modeling result, mesh generation needs considerable thought. In particular, the fineness of the mesh and the efficiency of the model produce contradictory demands. Additionally, using too many control lines aimed at achieving a pure mesh creates difficulties for mesh dividing tools, such as low efficiency and instability.
(3) Calibration is the only way to reduce uncertainty over model parameters, but there are little data available for urban areas. Despite the frequent occurrence of urban floods, effective field observations of surface water and pipe water during urban flooding are insufficient.
(4) The quality of the weather forecast has a major influence on the quality of a flood simulation result. Because of the great uncertainty of a weather forecast, the result of flood modeling using forecast rainfall may differ from the actual situation. Fast updating and timely rainfall forecast products will be available with improvements in meteorological forecasting technology. The products could be input into the model directly and perform waterlogging analysis quickly to facilitate the early deployment of flood prevention measures. A detailed flooding model and a high-precision rainfall forecast can greatly improve the accuracy of the waterlogging analysis, thus realizing the integration of rainfall with early warnings of waterlogging. Ultimately, disaster prevention is more important than disaster relief.
Data Availability Statement
The raw data supporting the conclusions of this manuscript will be made available by the authors, without undue reservation, to any qualified researcher.
Author Contributions
SL supplied model program. YS and YXY supplied much data for the research. YHY helped draw figures for this manuscript and edited several chapters. All authors contributed to the article and approved the submitted version.
Funding
This research was funded by the Strategic Priority Research Program of the Chinese Academy of Sciences (Grant No. XDA 20030302) and the National Key Research and Development Plan of China (No. 2016YFC0803107).
Conflict of Interest
The authors declare that the research was conducted in the absence of any commercial or financial relationships that could be construed as a potential conflict of interest.
References
Beretta, R., Ravazzani, G., Maiorano, C., and Mancini, M. (2018). Simulating the influence of buildings on flood inundation in urban areas. Geoscience 8:77.
Bradbrook, K., Lane, S., Waller, S., and Bates, P. (2004). Two dimensional diffusion wave modelling of flood inundation using a simplified channel representation. Int. J. River Basin Manag. 2, 211–223. doi: 10.1080/15715124.2004.9635233
Bulti, D. T., and Abebe, B. G. (2020). A review of flood modeling methods for urban pluvial flood application. Modeling Earth Syst. Environ. 6, 1293–1302. doi: 10.1007/s40808-020-00803-z
Chen, A. S., Evans, B., Djordjevic, S., and Savic, D. A. (2012). Multi-layered coarse grid modelling in 2D urban flood simulations. J. Hydrol. 47, 1–11. doi: 10.1016/j.jhydrol.2012.06.022
Cheng, X., and Li, C. (2015). The evolution trend, key features and countermeasures of urban flood risk. China Flood Drought Manag. 25, 6–9.
Cobby, D. M., Mason, D. C., and Davenport, I. J. (2001). Image processing of airborne scanning laser altimetry for improved river flood modelling. ISPRS J. Photogramm. Remote Sensing 56, 121–138. doi: 10.1016/s0924-2716(01)00039-9
Djokic, D., and Maidment, D. R. (1991). Terrain analysis for urban stormwater modelling. Hydrol. Process. 5, 115–124. doi: 10.1002/hyp.3360050109
Dottori, F., Baldassarre, G. D., and Todini, E. (2013). Detailed data is welcome, but with a pinch of salt: accuracy, precision, and uncertainty in flood inundation modeling. Water Resour. Res. 49, 6079–6085. doi: 10.1002/wrcr.20406
Duke, G. D., Kienzle, S. W., Johnson, D. L., and Byrne, J. M. (2003). Improving overland flow routing by incorporating ancillary road data into Digital Elevation Models. J. Spatial Hydrol. 3, 23–49.
Fewtrell, T., Bates, P., Horritt, M., and Hunter, N. (2008). Evaluating the effect of scale in flood inundation modelling in urban environments. Hydrol Process. 22, 5107–5118. doi: 10.1002/hyp.7148
Funke, S., Pain, C., Kramer, S., and Piggott, M. (2011). A wetting and drying algorithm with a combined pressure/free surface formulation for non-hydrostatic models. Adv. Water Resour. 34, 1483–1495. doi: 10.1016/j.advwatres.2011.08.007
Gallegos, H. A., Schubert, J. E., and Sanders, B. F. (2009). Two-dimensional, high-resolution modeling of urban dambreak flooding: a case study of Baldwin Hills. California. Adv. Water Resour. 32, 1323–1335. doi: 10.1016/j.advwatres.2009.05.008
Gourbesville, P. (2009). Data and hydroinformatics: new possibilities and challenges. J. Hydroinform. 11, 3–4.
Gourbesville, P., and Savioli, J. (2002). “Urban runoff and flooding: interests and difficulties of the 2D approach,” in Proceedings of the 5th International Hydroinformatics, (Cardiff).
Hénonin, J., Ma, H., Yang, Z.-Y., and Hartnack, J. (2015). Citywide multi-grid urban flood modelling: the July 2012 flood in Beijing. Urban Water J. 12, 52–66. doi: 10.1080/1573062x.2013.851710
Hénonin, J., Russo, B., Ole, M., and Gourbesville, P. (2013). Real-time urban flood forecasting and modelling: state of the art. J. Hydroinform. 15, 717–736. doi: 10.2166/hydro.2013.132
Hu, W., He, W., Huang, G., and Feng, J. (2010). Review of urban storm water simulation techniques. Adv. Water Sci. 1, 137–144.
Hunter, N. M., Bate, P. D., Neelz, S., Pender, G., Villanueva, I., Wright, N. G., et al. (2008). Benchmarking 2D hydraulic models for urban flooding. Proc. Inst. Civil Eng. Water Manag. 161, 13–30. doi: 10.1680/wama.2008.161.1.13
Huxley, C. (2017). “Rapid and accurate stormwater drainage system assessments using GPU technology,” in Proceedings of the IECA-SQ Conference, (Brisbane).
Jaafar, K., Ismail, N., Tajjudin, M., Adnan, R., and Rahiman, M. H. F. (2015). “A review on flood modelling and rainfall-runoff relationships,” in 2015 IEEE 6th Control and System Graduate Research Colloquium (UiTM, Shah Alam: Malaysia), 158–162. doi: 10.1109/ICSGRC.2015.7412484
Josef, S. (2012). Dynamic Modelling Of Urban Rainfall Runoff And Drainage Coupling DHI MIKE URBAN and MIKE FLOOD. University of SalzBurg: SalzBurg.
Krebs, G., Kokkonen, T., Valtanen, M., Setäläb, H., and Koivusaloa, H. (2014). Spatial resolution considerations for urban hydrological modelling. J. Hydrol. 512, 482–497. doi: 10.1016/j.jhydrol.2014.03.013
Leandro, J., Chen, A. S., Djordjević, S., and Savić, D. A. (2009). Comparison of 1D/1D and 1D/2D coupled (sewer/surface) hydraulic models for urban flood simulation. J. Hydraul. Eng. 135, 495–504. doi: 10.1061/(asce)hy.1943-7900.0000037
Leandro, J., and Martins, R. (2016). A methodology for linking 2D overland flow models with the sewer network model SWMM 5.1 based on dynamic link libraries. Water Sci. Techno. 73, 3017–3026. doi: 10.2166/wst.2016.171
Liang, Q., Du, G., Hall, J. W., and Borthwick, A. G. (2008). Flood inundation modeling with an adaptive quadtree grid shallow water equation solver. J. Hydraul. Eng. 134, 1603–1610. doi: 10.1061/(asce)0733-9429(2008)134:11(1603)
Neelz, S., Pender, G., Villanueva, I., Wilson, M., Wright, N. G., Bates, P., et al. (2006). Using remotely sensed data to support flood modelling. Proc. Inst. Civil Eng. Water Manag. 159, 35–43.
Price, R. K., and Vojinovic, Z. (2008). Urban flood disaster management. Urban Water J. 5, 259–276. doi: 10.1080/15730620802099721
Ren, B. (2004). Study on the Urban Design Rainstorm and Rainfall Runoff Calculation Model. Chongqing University, Chongqing.
Song, X., Zhang, J., Wang, G., and He, R. (2014). Development and challenges of urban hydrology in a changing environment II: Urban stormwater modeling and management. Adv. Water Sci. 5, 752–764.
Sui, D., and Maggio, R. (1999). Integrating GIS with hydrological modeling:practices, problems, and prospects. Comput. Environ. Urban Syst. 23, 33–51. doi: 10.1016/s0198-9715(98)00052-0
Tsakiris, G., and Bellos, V. (2014). A numerical model for two-dimensional flood routing in complex terrains. Water Resour. Manag. 28, 1277–1291. doi: 10.1007/s11269-014-0540-3
Wang, X., Cao, Z., Pender, G., and Tan, G. (2010). Modelling of urban flooding due to Yangtze river dike break. Proc. ICE Water Manag. 164, 3–14. doi: 10.1680/wama.900074
WeiFeng, L., Qiuwen, C., and Jingqiao, M. (2009). Development of 1D and 2D coupled model to simulate urban inundation: an application to Beijing Olympic Village. Chin. Sci. Bull. 54, 1613–1621. doi: 10.1007/s11434-009-0208-1
Werner, M., Blazkova, S., and Petr, J. (2005). Spatially distributed observations in constraining inundation modelling uncertainties. Hydrol. Process. 19, 3081–3096. doi: 10.1002/hyp.5833
Xiang, L., Zhang, D., He, X., Li, N., Liu, S., Sun, D., et al. (2018). Research progress in flood control and disaster reduction. J. China Inst. Water Resour. Hydropower Res. 5, 362–372.
Xing, Y., Liang, Q., Wang, G., Ming, X., and Xia, X. (2018). City-scale hydrodynamic modelling of urban flash floods: the issues of scale and resolution. Nat. Hazards 69, 473–496. doi: 10.1007/s11069-018-3553-z
Xu, M., Liu, S., Sun, Y., and Yao, Y. (2020a). Rapid identification and early warning of urban waterlogging risk using flooding model. Geomat. Inf. Sci. Wuhan Univ. 45, 1185–1194.
Xu, M., Sun, Y., and Liu, S. (2020b). Preliminary building and application of Beijing urban flood models. China Flood Drought Manag. 30, 16–21.
Xue, W. (2016). Numerical Simulation of Stormwater and Street Flood in City. Tianjin University, Tianjin.
Yu, H. (2015). Research on numerical simulation technology of urban floods. South China University of Technology, Guangzhou.
Yuan, F., and Li, W. (2019). Research on modeling method of city high-accuracy DEM. Geomatics Spatial Inform. Techno. 1, 80–82.
Zang, W. (2019). Research on urban flood refined simulation system. J. China Inst. Water Resour. Hydropower Res., Beijing.
Zhang, C., Zhi, X., Zhou, G., and Chen, Y. (2012). Interpretation for the partial modification in the new edition of ‘code for design of outdoor wastewater engineering’. Water Wastewater Eng. 38, 34–38.
Zhang, Q., Okada, N., Tatano, H., and Hayakawa, S. (2002). Risk assessment and zoning of flood damage caused by heavy rainfall in Yamaghchi Prefecture. Jpn. Flood Def. 2002, 162–169.
Keywords: detailed urban flooding model, urban waterlogging, surface generalization, elevation amendment, Beijing city
Citation: Xu M, Yao Y, Liu S, Sun Y and Yan Y (2021) Multi-Mode Surface Generalization Supports a Detailed Urban Flooding Simulation Model. Front. Earth Sci. 9:540473. doi: 10.3389/feart.2021.540473
Received: 05 March 2020; Accepted: 09 March 2021;
Published: 30 March 2021.
Edited by:
Mingfu Guan, The University of Hong Kong, Hong KongReviewed by:
Xilin Xia, Loughborough University, United KingdomHaixing Liu, Dalian University of Technology, China
Copyright © 2021 Xu, Yao, Liu, Sun and Yan. This is an open-access article distributed under the terms of the Creative Commons Attribution License (CC BY). The use, distribution or reproduction in other forums is permitted, provided the original author(s) and the copyright owner(s) are credited and that the original publication in this journal is cited, in accordance with accepted academic practice. No use, distribution or reproduction is permitted which does not comply with these terms.
*Correspondence: Yonghui Yao, eWFveWhAbHJlaXMuYWMuY24=