- Institute for Scientific Research of Aerospace Monitoring “AEROCOSMOS”, Moscow, Russia
Here we present the results of satellite monitoring of wildfires in Australia for the period of 2001–2020. Annual and monthly dynamics of wildfire areas and CO and CO2 carbon-bearing trace gas emissions from wildfires have been analyzed for the whole territory of Australia based on satellite data. It was found that anomalous fires occurred in the territory of New South Wales during the 2019–2020 fire season. Values of burned-out areas exceeded the values of previous years 3.5–25.8-fold. Annual mean volumes of carbon-bearing gas emissions in this region exceeded the values of previous years 4–59-fold for carbon monoxide CO and 4.6–50-fold for carbon dioxide CO2. The spatial distribution of the excess concentrations of CO from wildfires in New South Wales was recorded according to the monthly mean data of the AIRS instrument (Aqua satellite). At the same time, the excess of CO2 concentration in the atmosphere was estimated using the TANSO-FTS (GOSAT satellite) data. It was demonstrated that an anomalously high number of fires in this state of Australia was caused by extreme drought associated with abnormally high surface temperatures, low rainfall and humidity which created conditions for intense fires and emissions of carbon-bearing gases associated with the combustion of eucalyptus and tropical rain forests prevailing in this region.
Introduction
Wildfires are one of the main types of natural disasters that occur on Earth. Annually, vast territories of various countries are exposed to these dangerous phenomena (Korovin, 1996; Shvidenko et al., 2011). The strongest wildfires are usually caused by extremely high air temperatures and low relative humidity which in combination with strong wind create ideal conditions for fast fire spreading (Mokhov et al., 2003; Bondur, 2011; Bondur, 2016; Bondur et al., 2019a; Bondur et al., 2019b; Bondur et al., 2020b). Wildfire seasons become longer as the number of dry and hot days increases which leads to more frequent and severe fires (Mokhov et al., 2003).
Apart from direct impact on vegetation cover, wildfires significantly influence the atmospheric composition, being one of the most important natural sources of various trace gas and aerosol emissions (Tomshin et al., 2012; Bondur, 2016; Bondur and Ginzburg, 2016). Overall, the wildfires are the source of more than 20% of pollutants entering the planet’s atmosphere (Isaev and Korovin, 1995). Harmful trace gases from wildfires spread far beyond contamination sources because of the atmospheric circulation. Emission plumes from large wildfires can spread for thousands of kilometers (Andreae and Merlet, 2001; Bondur, 2011; Bondur, 2016). Wildfires and the subsequent biomass burning lead to unfavorable climate changes as they are the cause of increased greenhouse gas emissions into the atmosphere (Matthews, et al., 2012; IPCC, 2013; Kulmala et al., 2015; Bondur and Ginzburg, 2016). The products of biomass combustion resulting from wildfires consist of many compounds with the main share of carbon-bearing trace gases (CO, CO2) (Bondur, 2016). Carbon dioxide (CO2) is the main biomass combustion product due to its high carbon content. Carbon monoxide (CO) is the by-product of incomplete biomass combustion and it is present in the wildfire smoke in high concentrations (Koppmann et al., 2005).
For the Australian territory, wildfires are widespread and regular phenomena that annually cause significant damage to the forest resources, infrastructure and has a serious impact on the environment (Filkov et al., 2020). Wildfires in Australia take place throughout the whole year; however, their intensity and seasonality vary depending upon the region (Matthews et al., 2012; Dowdy, 2018; BoM, 2019; Di Virgilio et al., 2019).
Australia is the third largest source of global emissions of carbon-bearing gases from biomass combustion (Desservettaz et al., 2017). Estimated contribution of emissions from wildfires in Australia into global carbon emissions is about 8% (Paton-Walsh et al., 2010; Desservettaz et al., 2017; Dong et al., 2020).
Vast areas and the inaccessibility of many territories exposed to wildfires complicate early fire detection and assessment of its effects. Therefore, taking into account the features and scales of these phenomena, satellite methods and technologies appear promising to address the problem of detecting sources of wildfires and assessment of their effects (Bondur, 2011; Bondur, 2016; Bondur et al., 2017; Bondur et al., 2019a; Bondur et al., 2019b; Bondur et al., 2020a).
Low-resolution satellite data from Terra, Aqua, NOAA, Suomi NPP, FengYun-3, Meteor-M, and other satellites are the main sources of fresh data on wildfires in large areas (Bondur, 2016; Bondur et al., 2019a; Bondur et al., 2020a). The use of such higher frequency data allows to detect fires quickly even on remote territories. This is especially important for the monitoring of wildfires and assessment of volumes of wildfire emissions into the atmosphere in order to take timely measures to ensure safety and prevent negative effects of these natural phenomena (Pu et al., 2004; Bondur, 2011, 2016; Giglio et al., 2016; Bondur et al., 2017, Bondur and Gordo, 2018; Bondur et al., 2019b; Bondur et al., 2020a).
The primary objective of this study is to obtain spatiotemporal distributions of long-term values of burned-out areas and volumes of carbon-bearing gas (CO and CO2) emissions in Australia to identify the annual and seasonal dynamics of wildfires and their effects.
One of the key problems addressed in this study was to obtain the most accurate data on the volumes of emissions of carbon-bearing gases (CO, CO2), achieved through the integrated use of satellite data of various spatial resolution, as well as vegetation maps, taking into account the variability of vegetation cover every 5 years.
Satellite data from Terra and Aqua satellites (MODIS instrument) were used in this work. Based on these data, the burned-out areas were calculated, and the volumes of emissions of carbon-bearing gases (CO, CO2) caused by combustion of biomass in Australia from 2001 to September 2020 were assessed. The 2019–2020 fire season was analyzed in more detail in the state of New South Wales. Variations in surface temperature and changes in CO concentrations were analyzed using data from the AIRS instrument (Aqua satellite). Through the use of GOSAT (TANSO-FTS) data, the share of carbon dioxide in the atmosphere was estimated for the period of 2019–2020 wildfires in the state of New South Wales.
This study can serve as a basis for comparing the values of the concentrations of carbon-bearing trace gases detected by satellite and data calculated on the basis of emission factors to assess the contribution of wildfire emissions to atmospheric pollution against other sources.
Materials and Methods
A technique described in (Bondur, 2011; Bondur, 2016; Bondur et al., 2017; Bondur and Gordo, 2018) was used to monitor wildfires in Australia. MODIS (Terra, Aqua satellites) data were used during wildfire monitoring as main data for the assessment of areas of burned-out territories and the detection of fire source boundary changes. To calculate the wildfire areas, we used 1 km spatial resolution Level-2 data processing MOD14 product (Giglio et al., 2016).
In this study the calculation of the total matter mass emitted into the atmosphere as a result of a wildfire, including CO and CO2 emissions, was carried out using the Seiler-Crutzen equation (Seiler and Crutzen, 1980) with the introduction of a correction factor obtained to clarify the burned-out area (Bondur, 2016; Bondur and Gordo, 2018).
Where A is the wildfire area based on MOD14 data (m2); B is the biomass density within the burned-out territory (kg/m2); C is the biomass combustion completeness (%); D is the emission factor (the matter mass emitted into the air during the burning of 1 kg of the biomass (g/kg); k is the correction factor; E is the total matter mass emitted into the atmosphere as a result of a fire (g).
The correction factor k was obtained according to the technique described in (Bondur and Gordo, 2018), the technique is based on comparing the results of calculations of wildfire areas obtained from satellite data of low (Terra) and medium (Landsat-8) spatial resolution for selected test sites. As a result, the values of the correction factor k were obtained, varying in the range of 0.65–0.91. The use of the correction factor k allowed to obtain more reliable values of burned-out areas using satellite data of low spatial resolution, and, therefore, to assess of the volumes of emissions of carbon-bearing gases CO, CO2 in a more accurate way.
The values of emission factors B, C and D in Eq. 1 are presented in (Akagi et al., 2011; Wiedinmyer et al., 2011). Each factor corresponds to specific type of burned vegetation. For the selected study area, the type and characteristics of the vegetation cover were determined using the satellite data of the MODIS instrument (Terra and Aqua satellites) data, the Land Cover Type 1 (MCD12Q1) International Geosphere-Biosphere Program (IGBP) Сlassification product (Version 6) with 500 m spatial resolution (Friedl et al., 2010).
One of the important factors influencing the frequency and intensity of wildfires is the temperature of the Earth's surface. To study the seasonal variations in the temperature we used monthly mean data for 2003–2020, obtained from the AIRS instrument (Aqua satellite), 1° × 1° spatial resolution AIRS3STM v006 product (Tian et al., 2013).
Carbon-bearing trace gases such as CO and CO2 constitute a main share of wildfire emissions from biomass combustion. Their impact on the climate on the regional and planetary scales is long lasting (Bondur, 2016; Bondur and Ginzburg, 2016; Bondur et al., 2020b). To study changes in the concentrations of carbon monoxide (CO), the excess of the monthly mean values (product AIRS3STM) was calculated in comparison with the data of previous years starting from 2003. The study of carbon dioxide (CO2) concentration changes was carried out using TANSO-FTS (GOSAT satellite) data in the near-IR region of the electromagnetic spectrum, 2.5° × 2.5° spatial resolution product (Yoshida et al., 2011). The excess CO2 concentrations over monthly mean concentrations for previous years since 2009 were calculated.
In the course of the study, the total burned-out area values and the volumes of emissions of carbon-bearing trace gases caused by fires for the entire territory of Australia were obtained. New South Wales was selected for more detailed study.
Results
Figure 1 shows distributions of monthly wildfire areas for the whole territory of Australia from January to December for the period of 2001–2020 (A) and annual areas of burned-out territories for this period (B) obtained from satellite monitoring data.
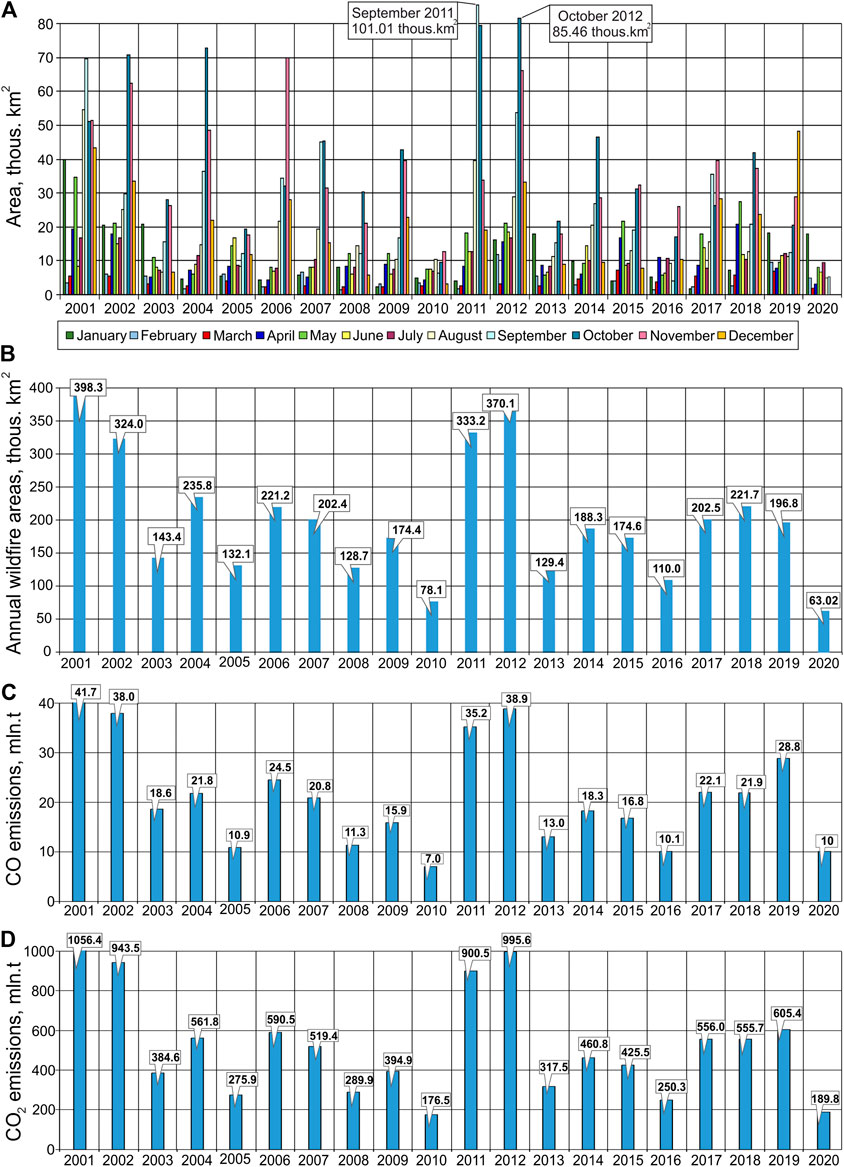
FIGURE 1. The results of satellite monitoring of wildfires for the whole territory of Australia in 2001–2020: (A) Distribution of wildfire areas by months (January—December); (B) Annual distribution of wildfire areas; (C) Annual distribution of CO emissions; (D) Annual distribution of CO2 emissions.
The analysis of Figure 1A has shown that the largest wildfire areas on the Australian territory were detected in spring and summer months (for the southern hemisphere), i.e., from September to December. Maximum burned-out area values were detected in September 2001 (69.7 thous. km2) and in September 2011 (101 thous. km2), in October 2011 (79.6 thous. km2) and in October 2012 (85.4 thous. km2), in November 2006 (69.9 thous. km2) and in November 2012 (66.2 thous. km2), as well as in December 2019 (48.3 thous. km2).
The analysis of Figure 1B has shown that the largest total wildfire areas were detected in 2001 (398.3 thous. km2), 2002 (324 thous. km2), 2011 (333.2 thous. km2), and in 2012 (370.1 thous. km2), as from 2003 to 2011 and from 2013 to 2019 the wildfire areas for the whole territory of Australia were quite stable.
Annual CO and CO2 emission volumes estimated based on satellite monitoring data for the Australian territory in 2001–2020 are given in Figures 1C,D, respectively. Figures 1C,D indicate that maximum carbon-bearing gas emission volumes were detected in 2001 (41.7 mln. t CO and 1056.4 mln. t CO2), 2002 (38 mln. t CO and 943.5 mln. t CO2), 2011 (35.2 mln. t CO and 900.5 mln. t CO2), 2012 (38.9 mln. t CO and 995.6 mln. t CO2), and in 2019 (28.8 mln. t CO and 605.4 mln. t CO2). The joint analysis of Figure 1 has shown that the values of carbon-bearing gas emissions were approximately proportional to the areas of burned-out territories.
As an example, Figure 2A presents spatial distribution of wildfire sources detected in Australia in November-December 2019. As can be seen from Figure 2A, wildfire sources were registered in all the states of Australia. However, New South Wales has experienced the most intense wildfires resulting in burning more areas than in other fire seasons in the region over the previous 20 years.
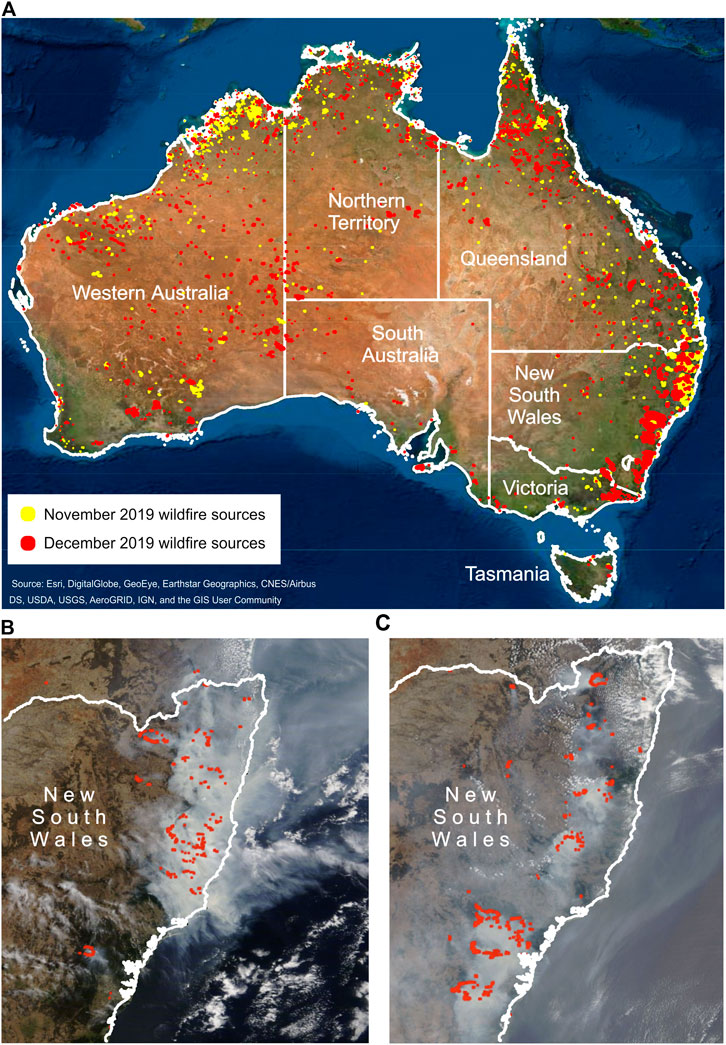
FIGURE 2. Wildfire sources and smoke plumes in Australia: (A) Distribution of wildfire sources in November-December 2019; (B) Terra (MODIS) image, November 11, 2019; (C) Aqua (MODIS) image, December 9, 2019.
Figures 2B,C show examples of synthesized satellite images (MODIS instrument) with fire sources and intense smoke plumes registered in New South Wales on November 11, 2019 by Terra and on December 9, 2019 by Aqua. (https://ladsweb.modaps.eosdis.nasa.gov; https://firms.modaps.eosdis.nasa.gov).
Seasonal variations in the temperature of the Earth's surface directly influence the emergence of new and an increase in the intensity and duration of already occurring wildfires. Based on the monthly mean data of the AIRS instrument (Aqua satellite), changes in the temperature of the Earth's surface were calculated for the period from May 2019 to April 2020 compared with the temperatures for these time periods starting from 2003. This allowed to reveal the excess of multi-year temperature values in the territory of New South Wales (from 2003 to 2018) in September 2019 (by 4.2 K), and in December 2019 by 6 K, which lasted until January 2020 (4 K).
The spatial distributions of obtained temperature anomalies are shown in Figure 3.
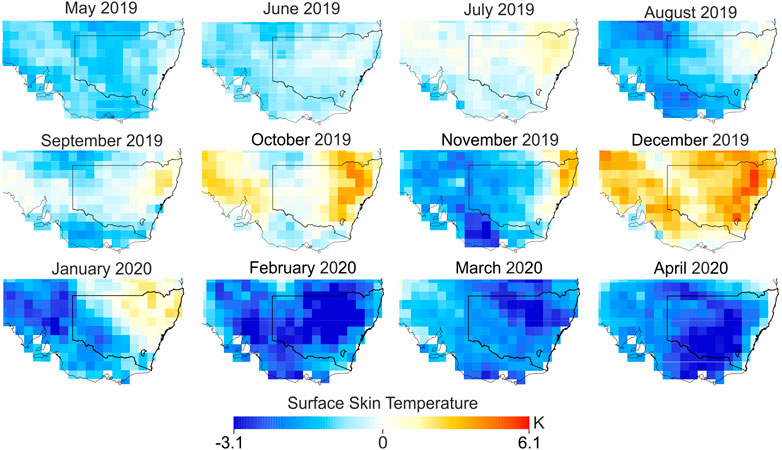
FIGURE 3. Surface skin temperature changes in New South Wales (Australia) from May 2019 to April 2020 in comparison with the data of each month of previous years starting from 2003.
The rise in surface temperature from September 2019 to January 2020 (Figure 3) was above average compared to past years since 2003, increasing the need for evaporation. A long-term rainfall deficit in the territory of New South Wales according to the data of (BoM, 2019) seriously influenced the occurrence and spread of wildfires. Low humidity levels prepared the vegetation cover (Nolan et al., 2020), dominated by eucalyptus and tropical forests, for the burning of biomass caused by wildfires, which contributed to the emergence of significant volumes of emissions of various trace gases, including carbon-bearing gases, into the atmosphere.
Figure 4 shows annual distributions of wildfire areas (A), as well as CO (B) and CO2 (C) emission volumes from wildfires in New South Wales for the time period of 2001–2020. From the analysis of Figure 4A, it follows that the total areas of wildfires in this territory until 2019 were quite stable, with minor peaks in 2002 (14.9 thous. km2) and in 2003 (11.7 thous. km2). Extremely high values of wildfire areas in the territory of this state were registered in 2019 and reached 37.6 thous. km2. Total fire areas in New South Wales in 2019 exceeded those in previous years (2001–2018) 3.5–25.8-fold.
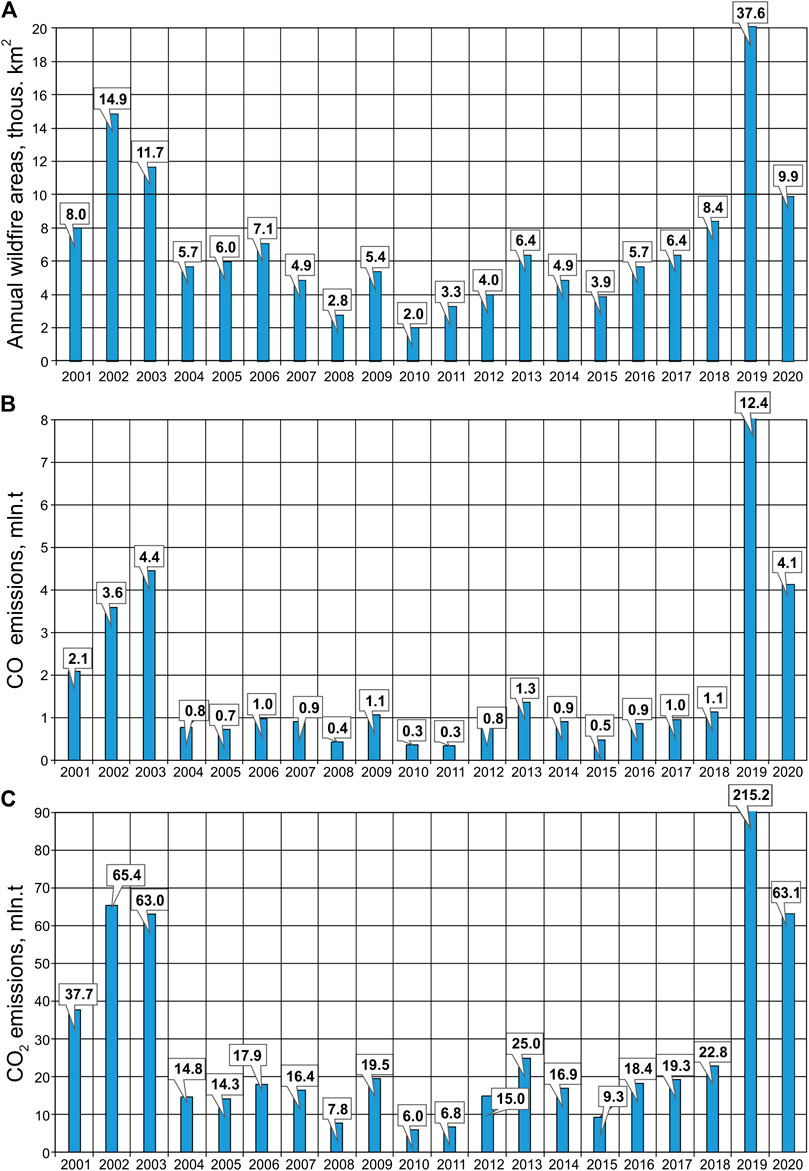
FIGURE 4. The results of wildfire satellite monitoring and emission volumes from wildfires in New South Wales in 2001–2020 (A) Annual distribution of wildfire areas (B) Annual distribution of CO emissions (C) Annual distribution of CO2 emissions.
Figures 4B,C present distributions of total annual CO and CO2 emission volumes caused by wildfires (2001–2020). As can be seen from Figure 4, carbon-bearing gas emission volumes are approximately proportional to the areas of burned-out territories. The largest annual CO and CO2 emissions in New South Wales were detected in 2002 (3.6 mln. t CO and 65.4 mln. t CO2), 2003 (4.4 mln. t CO and 63.0 mln. t CO2) and 2019 (12.4 mln. t CO and 215.2 mln. t CO2). Annual mean carbon-bearing gas emissions in 2019 exceeded those in previous years (2001–2018) more than 4–59-fold for CO and 4.6–50-fold for CO2.
Figure 5 presents the values of wildfire areas (A) and emissions of carbon-bearing gases (B, C) from wildfires obtained on the basis of New South Wales satellite monitoring results for the fire period from September 2019 to February 2020.
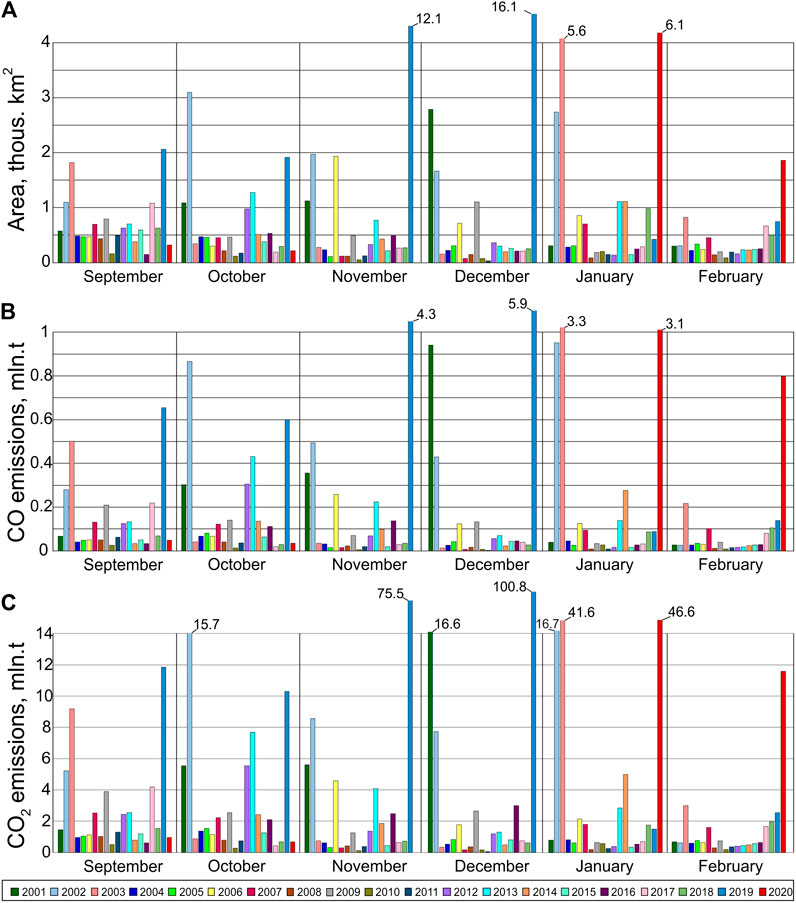
FIGURE 5. The results of wildfire satellite monitoring and emission volumes from wildfire in New South Wales (Australia) during 2019–2020 fire season (A) Distribution of burned-out areas by months (B and C) Monthly distribution of emissions of CO and CO2 respectively.
From the analysis of Figure 5A, it follows that wildfires in New South Wales from November 2019 to February 2020 significantly exceeded the data for past 9 years starting from 2001. Australian wildfires of unprecedented scale in the 2019–2020 fire season burned predominantly temperate broadleaf forests in eastern Australia.
After analyzing the results published in (Boer et al., 2020) and comparing them with our data on the wildfire areas, we observed a discrepancy of about 4 thous. km2. This gap in results may be due to the fact that the end of the study presented in (Boer et al., 2020) fell on the beginning of January 2020, while the data presented in our study includes a full month.
Analysis of Figures 5B,C showed that abnormally high values of the volumes of carbon-bearing gases CO, CO2 were detected in November 2019 (4.3 mln. t CO and 75.5 mln. t CO2), December 2019 (5.9 mln. t CO and 100.8 mln. t CO2) and January 2020 (3.1 mln. t CO and 46.6 mln. t CO2). The highest values of emissions were from the combustion of the sub-tropical broadleaved deciduous forest vegetation type of Wollemi National Park.
In January 2003, recorded wildfire areas were 5.6 thous. km2 and emissions from wildfires were 3.3 mln. t CO and 41.6 mln. t CO2. The largest volume of emissions was due to the combustion of the sub-tropical broadleaved evergreen forest vegetation type in the territory of the national parks - Kosciuszko National Park (KNP) and Cabramurra.
Initial and average CO2 emissions on the east coast of Australia were estimated in (Bowman et al., 2020a) to be approximately 670 mln. t, while other data ranged from 550 to 850 mln. t. Comparing these results with the emissions obtained in this work, it can be concluded that the values obtained in (Bowman et al., 2020a) exceed those obtained by us. This discrepancy may be due to the use of different approaches to calculating wildfire emissions.
The spatial distribution of atmospheric composition changes during severe fires in New South Wales were analyzed using monthly mean AIRS data (CO concentration) and TANSO-FTS data (CO2 concentration). These changes are shown in Figures 6A,B.
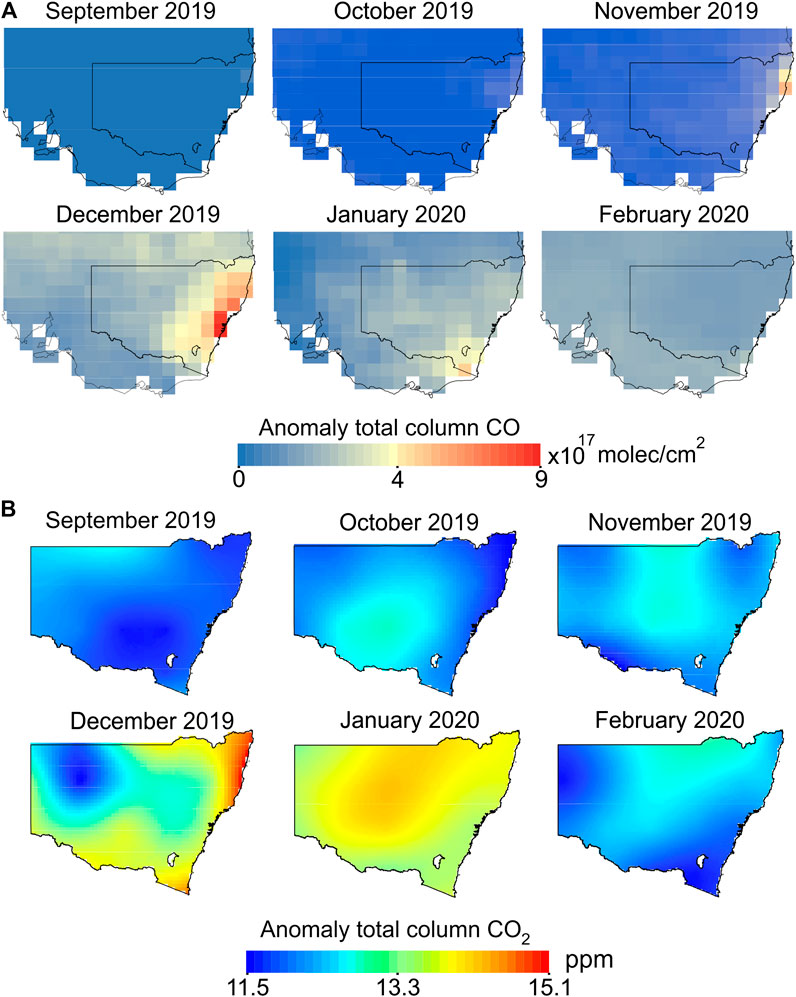
FIGURE 6. Atmospheric composition change in New South Wales (Australia) during wildfires from September 2019 to February 2020 (A) Carbon monoxide (CO) concentration excess as compared to data of previous years starting from 2003, AIRS (Aqua) (B) Carbon dioxide (CO2) concentration excess as compared to data of previous years starting from 2009, TANSO-FTS (GOSAT).
Monthly mean CO concentrations from September 2019 to February 2020 were calculated using AIRS (Aqua satellite) data and compared to CO concentrations for the period of previous years starting from 2003 (Figure 6A). The analysis of the obtained results allowed to detect anomalous excess of carbon monoxide concentration by 9×10¹⁷ moles/cm2 in December 2019 over the values of previous years in the territory of New South Wales.
Monthly mean carbon dioxide (CO2) concentrations in the atmosphere in 2019 were calculated using TANSO-FTS (GOSAT) data. These concentrations for each month were compared with the data for previous years starting from 2009. The results are provided in Figure 6B. Their analysis revealed 11.5 ppm excess in carbon dioxide (CO2) concentrations in northeastern New South Wales in October 2019. In December 2019, an anomalous excess of carbon dioxide concentrations in the atmosphere (by 15 ppm) was revealed compared to previous years (2009–2018). The amount of CO2 that enters the atmosphere as a result of severe wildfires tends to accumulate and persist in the atmosphere for a period of time. Probably for this reason, in January 2020, in the territory of New South Wales, excess CO2 concentrations were observed compared to the data of 2009–2019 for this month (Figure 6B).
Studying the impact of carbon-bearing emissions from wildfires on the overall carbon balance in the long term is essential for understanding the damage to the atmosphere. These studies require a much more consistent and comprehensive evidence base, including coordinated work involving laboratory and field measurements of emissions, natural and classical field experiments examining the effects of fire severity and forestry practices, integrated into forest demography, carbon cycle and economic modeling (Bowman et al., 2020a; Bowman et al., 2020b).
Conclusion
Spatial distributions of fire sources, burned-out areas and carbon-bearing gas emissions from wildfires for the whole continent and its regions were analyzed on the basis of the results of multi-year satellite wildfire monitoring in Australia in 2001–2020. Extremely high total values of burned-out areas were detected in 2001 (398.3 thous. km2), 2002 (324.0 thous. km2), and 10 years after in 2011 (333.2 thous. km2) and in 2012 (370.1 thous. km2).
The analysis of surface temperature changes according to the AIRS (Aqua) data in September - December 2019 in New South Wales (Australia) have revealed temperature anomalies where excess values reached 6 K as compared to 2003–2018 data. Such temperature anomalies as well as a long-term rainfall deficit and low humidity led to anomalous increase of wildfire number and their fast spreading within the state. Maximum values of burned-out areas in this region were observed in December 2019 (16.09 thous. km2), emission volumes reached: CO–5.9 mln. t; CO2–100.8 mln. t. Total wildfire areas in this region in 2019 exceeded the values of previous years (2001–2018) 3.5–25.8-fold.
Given the features of the vegetation cover in New South Wales which is dominated by eucalyptus and tropical rain forests, the burning of biomass caused by wildfires contributed significant emissions of various trace gases into the atmosphere. Annual mean volumes of carbon-bearing gas emissions in 2019 exceeded previous values more than 4–59-fold (CO) and 4.6–50-fold (CO2).
The analysis of atmospheric composition in New South Wales revealed the areas of anomalously high values of CO and CO2 concentrations in December 2019. According to AIRS (Aqua) data, CO concentrations were higher by 9×10¹⁷ moles/cm2 comparing to data for 2003–2018. According to the TANSO-FTS instrument (GOSAT satellite) the share of carbon dioxide (CO2) in the atmosphere was exceeded by 15 ppm compared to the previous years (2009–2018).
Excess concentrations of CO and CO2 revealed from satellite data and calculated volumes of emissions of carbon-bearing trace gases from wildfires will be in demand for analyzing the effects of fires and assessing the contribution of emissions to atmospheric pollution.
The obtained results demonstrate high efficiency of satellite data use for assessing the spatiotemporal dynamics of fire sources, burned-out areas, and volumes of harmful gas emissions from wildfires, as well as for conducting research in the field of the atmospheric composition change during the spreading of strong fires and their impact on the planetary climate.
Data Availability Statement
Publicly available datasets were analyzed in this study. These data can be found here: https://ladsweb.modaps.eosdis.nasa.gov, https://firms.modaps.eosdis.nasa.gov.
Author Contributions
VB, KG, OV chose the topic of the research, test sites, satellite data used for the research. VB, KG developed a method for estimation of the wildfire areas and the resulting CO and CO2 emissions. AZ, KG performed calculations and statistical analysis of the obtained results. OV carried out studies of seasonal variations in surface temperature in the studied area, as well as changes in CO and CO2 concentrations. All authors have read and approved the final manuscript.
Funding
The work was carried out with the financial support of the project by the Russian Federation represented by the Ministry of Science and Higher Education of the Russian Federation, the Agreement No. 075-15-2020-776.
Conflict of Interest
The authors declare that the research was conducted in the absence of any commercial or financial relationships that could be construed as a potential conflict of interest.
References
Akagi, S. K., Yokelson, R. J., Wiedinmyer, C., Alvarado, M. J., Reid, J. S., Karl, T., et al. (2011). Emission factors for open and domestic biomass burning for use in atmospheric models. Atmos. Chem. Phys. 11, 4039–4072. doi:10.5194/acp-11-4039-2011
Andreae, M. O., and Merlet, P. (2001). Emission of trace gases and aerosols from biomass burning. Global Biogeochem. Cycles 15 (4), 955–966. doi:10.1029/2000GB001382
Boer, M. M., de Dios, V. R., and Bradstock, R. A. (2020). Unprecedented burn area of Australian mega forest fires. Nat. Clim. Change 10 (3), 171–172. 10.1038/s41558-020-0716-1
BoM (2019). Special Climate Statement 72—dangerous bushfire weather in spring 2019. Available at: http://www.bom.gov.au/climate/current/statements/scs72.pdf (Accessed August 3, 2019).
Bondur, V. G., and Ginzburg, A. S. (2016). Emission of carbon-bearing gases and aerosols from natural fires on the territory of Russia based on space monitoring. Dokl. Earth Sci. 466 (2), 148–152. doi:10.1134/S1028334X16020045
Bondur, V. G., Gordo, K. A., and Kladov, V. L. (2017). Spacetime distributions of wildfire areas and emissions of carbon-containing gases and aerosols in northern eurasia according to satellite-monitoring data. Izvestiya Atmos. Ocean. Phys. 53 (9), 859–874. doi:10.1134/S0001433817090055
Bondur, V. G., and Gordo, K. A. (2018). Satellite monitoring of burnt-out areas and emissions of harmful contaminants due to forest and other wildfires in Russia. Izvestiya Atmos. Ocean. Phys. 54 (9), 955–965. doi:10.1134/S0001433818090104
Bondur, V. G., Mokhov, I. I., Voronova, O. S., and Sitnov, S. A. (2020b). Satellite monitoring of siberian wildfires and their effects: features of 2019 anomalies and trends of 20-year changes. Dokl. Earth Sci. 492 (1), 370–375. doi:10.1134/S1028334X20050049
Bondur, V. G. (2016). Satellite monitoring of trace gas and aerosol emissions during wildfires in Russia. Izvestiya Atmos. Ocean. Phys. 52 (9), 1078–1091. doi:10.1134/S0001433816090103
Bondur, V. G. (2011). Satellite monitoring of wildfires during the anomalous heat wave of 2010 in Russia. Izvestiya Atmos. Ocean. Phys. 47 (9), 1039–1048. doi:10.1134/S0001433811090040
Bondur, V. G., Tsidilina, M. N., and Cherepanova, E. V. (2019b). Satellite monitoring of wildfire impacts on the conditions of various types of vegetation cover in the federal districts of the Russian Federation. Izvestiya Atmos. Ocean. Phys. 55 (9), 1238–1253. doi:10.1134/S000143381909010X
Bondur, V. G., Tsidilina, M. N., Kladov, V. L., and Gordo, K. A. (2019a). Irregular variability of spatiotemporal distributions of wildfires and emissions of harmful trace gases in europe based on satellite monitoring data. Dokl. Earth Sci. 485 (2), 461–464. doi:10.1134/S1028334X19040202
Bondur, V. G., Voronova, O. S., Cherepanova, E. V., Tsidilina, M. N., and Zima, A. L. (2020a). The spatiotemporal analysis of multiannual wildfires and trace gas and aerosol emissions in Russia based of satellite data. Issledovanie Zemli iz kosmosa 4, 3–17. doi:10.31857/S0205961420040028
Bowman, D. M. J. S., Williamson, G. J., Price, O. F., Ndalila, M. N., and Bradstock, R. A. (2020a). Australian forests, megafires and the risk of dwindling carbon stocks. Plant Cell Environ. doi:10.1111/pce.13916
Bowman, D. M. J. S., Williamson, G. J., Yebra, M., Lizundia-Loiola, J., Pettinari, M. L., Shah, S., et al. (2020b). Wildfires: Australia needs national monitoring agency, Nature, 584, 188–191. doi:10.1038/d41586-020-02306-4
Desservettaz, M., Paton-Walsh, C., Griffith, D. W. T., Kettlewell, G., Keywood, M. D., Vanderschoot, M. V., et al. (2017). Emission factors of trace gases and particles from tropical savanna fires in Australia. J. Geophys. Res. Atmos. 122 (11), 6059–6074. doi:10.1002/2016JD025925
Di Virgilio, G., Evans, J. P., Blake, S. A. P., Armstrong, M., Dowdy, A. J., Sharples, J., et al. (2019). Climate change increases the potential for extreme wildfires. Geophys. Res. Lett. 46, 8517–8526. doi:10.1029/2019GL083699
Dong, T. T. T., Hinwood, A. L., Callan, A. C., and Stock, W. D. (2020). Emissions of gaseous pollutants from laboratory-based fires of vegetation from five common vegetation types in Western Australia. Atmos. Pollut. Res. 11 (6), 180–189. doi:10.1016/j.apr.2020.03.015
Dowdy, A. J. (2018). Climatological variability of fire weather in Australia. J. Appl. Meteorol. Climatol. 57 (2), 221–234. doi:10.1175/JAMC-D-17-0167.1
Filkov, A., Ngo, T., Matthews, S., Telfer, S., and Penman, T. (2020). Impact of Australia's catastrophic 2019/20 bushfire season on communities and environment. Retrospective analysis and current trends. J. Saf. Sci. Resil. 1 (1), 44–56. doi:10.1016/j.jnlssr.2020.06.009
Friedl, M. A., Sulla-Menashe, D., Tan, B., Schneider, A., Ramankutty, N., Sibley, A., et al. (2010). MODIS Collection 5 global land cover: algorithm refinements and characterization of new datasets. Remote Sens. Environ. 114 (1), 168–182. doi:10.1016/j.rse.2009.08.016
Giglio, L., Schroeder, W., and Justice, C. O. (2016). The collection 6 MODIS active fire detection algorithm and fire products. Remote Sens. Environ. 178, 31–41. doi:10.1016/j.rse.2016.02.054
IPCC (2013). “Climate change 2013: the physical science basis,” in Contribution of working group I to the fifth assessment report of the intergovernmental panel on climate change. Editors T. F. Stocker, D. Qin, G.-K. Plattner, M. Tignor, S. K. Allen, J. Boschunget al. (Cambridge, United Kingdom and New York, NY, United States: Cambridge University Press), 1535.
Isaev, A. S., and Korovin, G. N. (1995). Ekologicheskie problem pogloshcheniya uglekislogo gaza posredstvom lesovosstanovleniya i lesorazvedeniya v rossii: analiticheskiy obzor (environmental issues of carbon dioxide absorption through reforestation and afforestation in Russia: an analytical review). Moscow: Center for Russian Environmental Policy Publications, 155 [in Chinese, with English summary].
Koppmann, R., von Czapiewski, K., and Reid, J. S. (2005). A review of biomass burning emissions, part I: gaseous emissions of carbon monoxide, methane, volatile organic compounds, and nitrogen containing compounds. Atmos. Chem. Phys. Discuss. 5, 10455–10516. doi:10.5194/acpd-5-10455-2005
Korovin, G. N. (1996). Analysis of the distribution of forest fires in Russia. For. Sci. 48, 112–128. doi:10.1007/978-94-015-8737-2_8
Kulmala, M., Lappalainen, H. K., Petaja, T., Kurten, T., Kerminen, V. M., Viisanen, Y., et al. (2015). Introduction: the Pan-Eurasian Experiment (PEEX)—multidisciplinary , multiscale and multicomponent research and capacity-building initiative. Atmos. Chem. Phys. 15 (22), 13085–13096. doi:10.5194/acp-15-13085-2015
Matthews, S., Sullivan, A. L., Watson, P., and Williams, R. J. (2012). Climate change, fuel and fire behaviour in a eucalypt forest. Global Change Biol. 18 (10), 3212–3223. doi:10.1111/j.1365-2486.2012.02768.x
Mokhov, I. I., Semenov, V. A., and Khon, V. C. (2003). Estimates of possible regional hydrologic regime changes in the 21st century based on global climate models. Izv. Russ. Acad. Sci. Atmos. Oceanic Phys. 39, 130–144.
Nolan, R. H., Boer, M. M., Collins, L., Resco de Dios, V., Clarke, H., Jenkins, M., et al. (2020). Causes and consequences of eastern Australia's 2019–20 season of mega‐fires. Global Change Biol. 26 (3), 1039–1041. doi:10.1111/gcb.14987
Paton‐Walsh, C., Deutscher, N. M., Griffith, D. W. T., Forgan, B. W., Wilson, S. R., Jones, N. B., et al. (2010). Trace gas emissions from savanna fires in northern Australia. J. Geophys. Res. 115 (D16), D16314. doi:10.1029/2009JD013309
Pu, R., Gong, P., Li, Z., and Scarborough, J. (2004). A dynamic algorithm for wildfire mapping with NOAA/AVHRR data. Int. J. Wildland Fire 13 (3), 275. doi:10.1071/WF03054
Seiler, W., and Crutzen, P. J. (1980). Estimates of gross and net fluxes of carbon between the biosphere and the atmosphere from biomass burning. Climatic Change 2 (3), 207–247. doi:10.1007/BF00137988
Shvidenko, A. Z., Shchepashchenko, D. G., Vaganov, E. A., Sukhinin, A. I., Maksyutov, S. S., Lakyda, I. P., et al. (2011). Impact of wildfire in Russia between 1998-2010 on ecosystems and the global carbon budget. Dokl. Earth Sci. 441 (2), 1678–1682. doi:10.1134/S1028334X11120075
Tian, B., Manning, E., Fetzer, E., Olsen, E., Wong, S., Susskind, J., et al. (2013). Technical Reports 2013. AIRS/AMSU/HSB version 6 level 3 product user guide. Pasadena, CA: Jet Propulsion Laboratory Available at: http://airs.jpl.nasa.gov/ask_airs (Accessed November 27, 2017).
Tomshin, O. A., Protopopov, A. V., and Solovyev, V. S. (2012). Study of atmospheric aerosol and carbon monoxide variations over forest fires. Sovremennye problemy distantsionnogo zondirovaniya Zemli iz kosmosa 9 (1), 145–150.
Wiedinmyer, C., Akagi, S. K., Yokelson, R. J., Emmons, L. K., Al-Saadi, J. A., Orlando, J. J., et al. (2011). The Fire INventory from NCAR (FINN): a high resolution global model to estimate the emissions from open burning. Geosci. Model Dev. (GMD) 4 (3), 625–641. doi:10.5194/gmd-4-625-2011
Keywords: anomalous wildfires, remote sensing, satellite monitoring, emissions of harmful trace gases, temperature anomalies
Citation: Bondur VG, Gordo KA, Voronova OS and Zima AL (2021) Satellite Monitoring of Anomalous Wildfires in Australia. Front. Earth Sci. 8:617252. doi: 10.3389/feart.2020.617252
Received: 14 October 2020; Accepted: 24 December 2020;
Published: 28 January 2021.
Edited by:
Raquel Nieto, University of Vigo, SpainReviewed by:
Grant James Williamson, University of Tasmania, AustraliaChenghai Wang, Lanzhou University, China
Copyright © 2021 Bondur, Gordo, Voronova and Zima. This is an open-access article distributed under the terms of the Creative Commons Attribution License (CC BY). The use, distribution or reproduction in other forums is permitted, provided the original author(s) and the copyright owner(s) are credited and that the original publication in this journal is cited, in accordance with accepted academic practice. No use, distribution or reproduction is permitted which does not comply with these terms.
*Correspondence: Valery G. Bondur, dmdib25kdXJAYWVyb2Nvc21vcy5pbmZv; Olga S. Voronova, dl9vbHlhODZAbWFpbC5ydQ==
 Valery G. Bondur
 Kristina A. Gordo
 Olga S. Voronova
 Alla L. Zima