- 1Department of Atmospheric & Oceanic Sciences and Institute of Atmospheric Sciences, Fudan University, Shanghai, China
- 2Innovation Center of Ocean and Atmosphere System, Zhuhai, China
- 3Jiangsu Collaborative Innovation Center for Climate Change, Nanjing, China
The interdecadal change of the BOBSM–SCSSM relationship around the late 1970s is investigated in this paper. We found that the correlation between the BOBSM and SCSSM is 0.22 in 1958–1979, while it is 0.66 in 1980–2018. Further analyses showed that the strength of the South Asian High (SAH) at upper troposphere circulation experiences an interdecadal enhancement around the late 1970s; meanwhile its meridional shift exhibits a wider range in the second subperiod. Both the interdecadal change of the strength and meridional shift of the SAH contribute to a closer relationship of the BOBSM and SCSSM through modulating the divergent field at upper troposphere. As for the external forcing, the basin warming of the Indian Ocean after the late 1970s may serve as a relatively primary factor, which could induce a consistent background flow that may favor a closer BOBSM–SCSSM relationship in the second period. It is noted that the Indian Ocean warming is related to high pressure anomaly widely lying to the south of 20°N at upper troposphere, accompanied by the low pressure anomaly center to the north of 20°N. And this kind of upper-level circulation may result in strong westerly anomaly at the domain where the pressure gradient is large and then modulate the onset of the BOBSM and SCSSM in 1980–2018 through changing the upper-level divergent field. Besides, the low troposphere circulation associated with Indian Ocean warming is featured by the zonal-elongated high pressure anomaly spanning from the BOB and SCS to the northwest Pacific. The above coupling of the upper and lower troposphere, as a larger-scale consistent background flow controls the BOB and SCS, can modulate the interannual variation of the BOBSM and SCSSM synchronously and contributes to the closer relationship of the BOBSM and SCSSM in the second subperiod.
Introduction
The Asian summer monsoon (ASM), as the most active monsoon system, plays an important role on the spatial distribution and strength of rain belt in Asia. The onset of ASM, accompanied by an abrupt change in atmospheric circulation and energy, has great influences on the weather and climate of most Asian countries (Wu and Zhang, 1998; Wang et al., 2004; Mao and Wu, 2007; Zhou et al., 2018). In general, the onset of ASM can be divided into three successive processes: the onset of the Bay of Bengal summer monsoon (BOBSM) occurs in 25th pentad, followed by the onset of the South China Sea summer monsoon (SCSSM) in 28th pentad, and finally, the Indian summer monsoon (ISM) outbreaks in 31st pentad (Ding, 1992b; Xie and Saiki, 1999; Wang, 2006; Wu et al., 2013).
Substantive research studies have highlighted the pronounced variability of ASM systems both in the interannual and interdecadal time scale; meanwhile, many efforts have been devoted to figuring out possible causes which would contribute to the change in ASM systems. It has been noted that both local and remote sea surface temperature (SST) anomalous have a significant influence on the onset of ASM. Specifically, take the BOBSM, for example, it is attributed the interannual variations of BOBSM to either the local SST anomalous over Bay of Bengal or the intra-seasonal oscillation (ISO) (Wei-Dong et al., 2015). The remote forcing by El Niño-Southern Oscillation (ENSO) events can also result in the advanced or delayed onset of the BOBSM by modulating the ISO (Li et al., 2018). Except for the ISO, the ENSO-induced convection anomalous over southern Philippines can influence the upper-level divergence-pumping effect through altering the position of the SAH. And following the ENSO events, there is anomalous zonal gradient of SST over the Indian-western Pacific Ocean. Both the change of the upper-level divergence-pumping and zonal gradient of SST can affect the formation of monsoon convection during the onset process of the BOBSM (Liu et al., 2015b), while many other studies concluded that a warm (clod) ENSO event contributes to the late (early) SCSSM onset by modulating the Walker circulation (Webster and Yang, 1992; Chang and Chen, 1995; Wu and Meng, 1998; Luo et al., 2016). Furthermore, the anomalous SST over the tropical Indian Ocean (TIO) can prolong the effect of ENSO events on the SCSSM onset via changing the Philippine Sea anticyclone as well as the vertical velocity over SCS (Annamalai et al., 2007; Yang et al., 2007; Yuan et al., 2008; Xie et al., 2009; Hu and Duan, 2015).
In the interdecadal time scale, it is noted that there are significant decadal changes of ASM in the late 1970s and mid-1990s (Wang, 2001; Wu et al., 2010). Ensemble experiments point out that the decadal change of SST over the extratropical northern Pacific and tropical Pacific, especially over the tropical region, can qualitatively account for the ASM interdecadal climate shift around the late 1970s (Li et al., 2008; Fu et al., 2009). Furthermore, the combined impact of SST anomalies and the TP snow from winter and spring serves as a primary role in the decadal weakening of ASM in the late 1970s (Ding et al., 2008; Ding et al., 2009). While in the mid-1990s, an evident advance in the onset dates of the SCSSM is observed and studied from different angles. It is attributed to the earlier retreat of subtropical high, the increasing of the intraseasonal variability, and the tropical cyclone (Kajikawa et al., 2012; Kajikawa and Wang, 2012). Besides, the change of mean state over Pacific basin, which is characterized by a “grand” La Niña-like pattern, can advance the monsoon onset through the atmosphere wave (Ding et al., 2009; Yuan and Chen, 2013), and some studies noted that the interannual connection between the SCSSM and SST anomalies over the Indian Ocean and western Pacific performs significant shift around 1993/1994 (Yim et al., 2008; Xiang and Wang, 2013; Liu et al., 2016; Zhang et al., 2017). Overall, the interdecadal change of SST anomaly contributes to the interdecadal variation of ASM systems.
From the perspective of atmospheric circulation, the effects of the South Asian High (SAH) on ASM systems have been mentioned in accumulated studies, since the SAH helps to generate a favorable environment for the onset of both BOBSM and SCSSM. That is, a trumpet-shaped anomalous circulation lying in the southwestern part of the SAH at the upper troposphere leads to strong divergence pumping and then significant ascent movement over the BOB (Liu et al., 2013). Certainly, the SAH can also modulate the SCSSM through advecting anomalous potential vorticity by the northerly along the eastern SAH and enhanced convection over SCS (Liu and Zhu, 2016). These results suggest that the SAH may act as a bridge linking the BOBSM and SCSSM due to its continuous effect on the large-scale atmospheric circulation over the South Asia as well as the SCS. The location and strength of the SAH also exhibit an significant variation on the interdecadal time scale, which is linked to the SST anomalies over the SCS and western North Pacific (Zhang and Qian, 2000; Peng et al., 2018).
Apart from the forcing by tropical SST anomalies and modulation by the SAH, the air-sea interaction in the lower troposphere has been demonstrated as one of the essential factors that exert tremendous impact on the formation of monsoon vortex, which associates with the southerly and convection over BOB (Wu et al., 2011). Besides, some studies emphasize that the thermal and dynamical forcing of Tibetan Plateau (TP) may play an extremely important role on the onset of both BOBSM and SCSSM (He et al., 1987; Wu et al., 1998; Hu and Duan, 2015).
Given that many factors mentioned hereinbefore are linked to the onset of both SCSSM and BOBSM, the climatological onset date of the BOBSM is just 3 pentads before the SCSSM, and there might be a close connection between the BOBSM and SCSSM. For instance, Liu et al., 2002 pointed out that the immense latent heat released by the monsoon convection over the Bay of Bengal can enhance the southerly and convection over SCS based on observational evidence and numerical experiment. However, how the BOBSM correlates the SCSSM in the interannual time scale is not clear. Particularly, considering that the SCSSM exhibits significant variability in the interdecadal time scale (Wang, 2001; Wu et al., 2010), whether the connection changes in the interdecadal time scale remains unknown so far. These related research studies would advance our understanding of the mechanism responsible to the onset of the tropical monsoon and help to improve the prediction skill of monsoon onset.
The remainder of the paper is organized as follows: Section 2 introduces the data and the method used in the present study. Section 3 investigates the correlations of onset date between the BOBSM and SCSSM and shed light on a closer connection between these two monsoon systems after the late 1970s. Section 4 focuses on the factors that result in the interdecadal shift of the linkage between the BOBSM and SCSSM. Section 5 serves as a summary and discussion.
Data and Methods
To lessen the uncertainty caused by any individual dataset, two sets of data, the National Centers for Environment Prediction (NCEP)–National Center for Atmospheric Research (NCAR) reanalysis data (NCEP1) (Kalnay et al., 1996), and the third version system of Twentieth Century Reanalysis (20CRv3) Project supported by the National Oceanic and Atmospheric (NOAA) (Slivinski et al., 2019), are used in this paper. The horizontal resolution of the NCEP reanalysis data and 20CRv3 data are 2.5° × 2.5° and 1.0° × 1.0°, respectively. Daily zonal wind (u), meridional wind (v), vertical velocity (ω), geopotential height (z), and temperature (t) are extracted from NCEP1 (20CRv3) during the period of 1958–2018 (1958–2015). The SST data ranged from 1958–2018 is from Met Office Hadley Center observations’ datasets, with a horizontal resolution of 1.0° × 1.0° (Rayner et al., 2003).
In previous studies, various criteria are used to locate the onset date of ASM systems. Some studies identified the onset date based on the change of vertical shear of zonal wind which results from the seasonal transition of meridional temperature gradient (MTG), in the mid to upper troposphere (Webster and Yang, 1992; Li and Yanai, 1996; He et al., 2003). The MTG-based onset date has been used to investigate the interannual variability of the SCSSM in different decades (Liu et al., 2016) and interannual variation of the BOBSM (Mao and Wu, 2007). It was also found that the zonal wind at 850 hPa and the abrupt enhancement of rainfall over the monsoon regions perform well in depicting the year-to-year variation of the SCSSM onset (Wang et al., 2004; Luo et al., 2016). Even more, another definition only based on monsoon rainfall has been proposed to describe the rain band spanning from BOB to SCS (Wang and Linho, 2002; Wang et al., 2004). However, the criteria mentioned hereinbefore were usually used to identify either the onset date of the BOBSM or SCSSM. Considering that our focus is on the plausible connection between the BOBSM and SCSSM, a monsoon index, which was proposed by Wu et al., 2013, was used in the present work. The onset date of the BOBSM and SCSSM is identified by three criteria: (1) the vertical shear of zonal wind (200 hPa, −850 hPa) becomes negative, (2) the shift of surface wind direction is greater than 100°, and (3) daily precipitation is greater than 5 mm over each grid of the interested area, with precipitation over subtropical monsoon land greater than 3 mm. This monsoon index provides a more comprehensive way to describe the monsoon onset by combining the change of both wind and rainfall (Wu et al., 2013; Liu et al., 2015a), while it could reveal the successive process of ASM systems, which starts from the BOB and then develops to the SCS.
Besides, various monsoon indices were applied to be a supplement. The onset date of the BOBSM (Yan et al., 2018) is identified by three criteria: (1) the zonal wind (7.5°N–12.5°N, 85°E–95°E) at 850 hPa is higher than 3 m/s, (2) the zonal wind at 200 hPa is lower than −5 m/s, and (3) the above situation lasts five days. The onset date of the SCSSM (Ding et al., 2016) was defined as following: (1) the zonal wind (5°N–15°N, 110°E–120°E) at 850 hPa is higher than 0.5 m/s, and the averaged zonal wind in the next five days is higher than 0 m/s, (2) in 15 days after the onset date, there are 8 days at least when the westerly dominates the SCS monsoon region; meanwhile, the averaged zonal wind during the 15 days is required to be higher than 1 m/s, and (3) the onset date is supposed to be any date after 20th April.
Interdecadal Change of the Connection between Onset Dates of Bay of Bengal Summer Monsoon and South China Sea Summer Monsoon
Figure 1 shows the climatological onset of ASM in different regions based on the method proposed by Wu et al., 2013. As is well known, ASM first outbreaks in pentad 25 over BOB, and then, it continually extends northward and eastward. In general, the SCSSM onsets in pentad 28, while the Indian summer monsoon onsets in pentad 30, approximately two pentads later than the SCSSM. The result is consistent with previous studies (Ding, 1992b; Xie and Saiki, 1999; Wang, 2006; Wu et al., 2013). The inconsistent outbreak among the BOBSM, Indian summer monsoon, and SCSSM may be attributed to the monsoon onset barrier that blocks the further westward advancement of the monsoon system after the ASM first outbreaks in the BOB (Liu et al., 2015a).
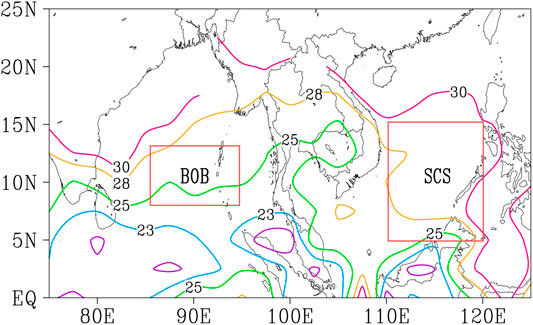
FIGURE 1. The pentad-isochrones indicating the onset process of ASM for 1958–2018. The area encircled by red solid lines represents the selective BOBSM region and SCSSM region, respectively.
Since the focus in this research is on the onset of the BOBSM and SCSSM, two target domains (7.5°N–12.5°N, 85°E–95°E for the BOBSM and 5°N–15°N, 110°E–120°E for the SCSSM) were selected where the area-averaged onset pentad represents the monsoon onset in the BOB or SCS (Figure 2A). The onset dates of both BOBSM and SCSSM possess significant variability in the interannual time scale; moreover, both of them evidently oscillate in the interdecadal time scale. The results obtained from the power spectra analysis (figure not shown) show that the BOBSM onset has significant power in the 3-year, 5-year, and 12-year bands. The SCSSM onset is dominated by a major peak near 5-year band and a minor peak near 2.5-year band, while it also exhibits a 10-11 years periodicity which is insignificant at the 90% confidence level. However, many studies have addressed an interdecadal advance of the SCSSM onset around the late 1970s and mid-1990s (Wang, 2001; Ding et al., 2008; Wu et al., 2010; Xiang and Wang, 2013; Yuan and Chen, 2013; Liu et al., 2016). The inconsistence between our result and previous studies may be attributed to the different identification methods of the SCSSM.
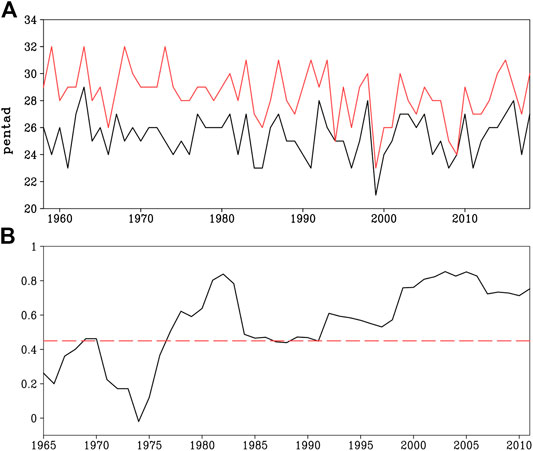
FIGURE 2. (A) Time series of the monsoon onset pentad averaged over the selective BOBSM region (7.5°–12.5°N, 85°–95°E) and SCSSM region (5°–15°N, 110°–120°E). (B) A sliding correlation with a 15-years running window for the time series of the monsoon onset pentad of BOBSM and SCSSM, and the red dashed line denotes values reaching the 90% confidence level.
Furthermore, it seems that the connection between the BOBSM and SCSSM becomes closer after the 1980s. To validate the possible linkage of onset between the BOBSM and SCSSM, a sliding correlation with a 15-year running window is applied (Figure 2B). The correlation coefficients between the BOBSM and SCSSM are below 0.47 before 1977, being mostly insignificant at the 90% confidence level. However, the sliding correlation dramatically rebounds since 1974 and then increases and sustains with the significance at the 90% confidence level after 1977. We calculated the correlation coefficients between the BOBSM and SCSSM during the period of 1958–1979 and 1980–2018, respectively (Table 1). The correlation increases from 0.21 to 0.67 based on the NCEP-1 reanalysis, which is also true based on 20CRv3 reanalysis, with correlation increasing from 0.21 to 0.66. Besides, whether the interdecadal change in the BOBSM–SCSSM relationship depends on the monsoon definition has been examined by virtue of different identifications mentioned in Section 2. The result shows that the BOBSM–SCSSM connection becomes closer with an increasing correlation from 0.15 to 0.69. These results suggest that the closer relationship between the BOBSM and SCSSM after the late 1970s was insensitive to the used reanalysis data and monsoon definition.

TABLE 1. Correlation coefficients between the BOBSM and SCSSM onsets during the period of 1958–1979 and 1980–2018, respectively.
Due to the correction and improvement of datasets during the satellite era since the 1970s, there is a possibility that a closer BOBSM–SCSSM connection may be attributed to the quality of reanalysis data, which is, however, not easy to be overcome. To avoid the influence of unrealistic interdecadal change, all the variables used to identify the monsoon onset were subjected to a harmonic analysis to remove periods longer than 8 years. The correlation between the BOBSM and SCSSM onset is 0.31 in the first subperiod and 0.67 in the second subperiod, which is similar to the result shown in Table 1. Overall, the interdecadal change in the BOBSM–SCSSM relationship is robust.
Primarily, the evolutional processes of different monsoon systems in different periods were investigated by a lead-lag composite analysis (Figures 3, 4), in which 0 pentad represents the monsoon onset pentad and −1 pentad represents the pentad before. During the first subperiod, the convection activities first appear over the Asian-Australian land bridge near the equator and in the eastern Indochina Peninsula in the −3 pentad (Figure 3A). Meanwhile, a weak convection center is observed to the south of the Indian Peninsula (namely, 0°–10°N, 70°E–85°E), which gradually enhances in the −2 pentad (Figure 3C) and then forms a zonal-elongated rain belt between the equator and 10°N in the −1 pentad (Figure 3E). With the breakdown of the ridge line of subtropical high over BOB, this zonal-elongated rain belt propagates northward to the north of 10°N and the westerly almost covers the BOB, leading to the onset of the BOBSM (Figure 3G). In the onset pentad, the northeast-southwest oriented rain belt remarkably enhances, in tandem with the further eastward retreat of the subtropical high and the building-up of the SAH at the upper troposphere (Figure 3G). From the perspective of the SCSSM, in −3 pentad, earlier than the SCSSM onset, the SAH solidly lies to the south of TP at the upper troposphere and the westerly controls the BOB (Figure 3B), suggesting that the BOBSM already outbreaks at the time. As time goes by, the SAH further strengthens and expands northeastward (Figures 3D,F), while the convection activity over the SCS becomes active after the eastward retreat of subtropical high in the -1 pentad (Figure 3F). In line with the abundant rainfall over the SCS and the strong and well-organized SAH covering the South Asian monsoon region in 0 pentad, the SCSSM eventually outbreaks (Figure 3H).
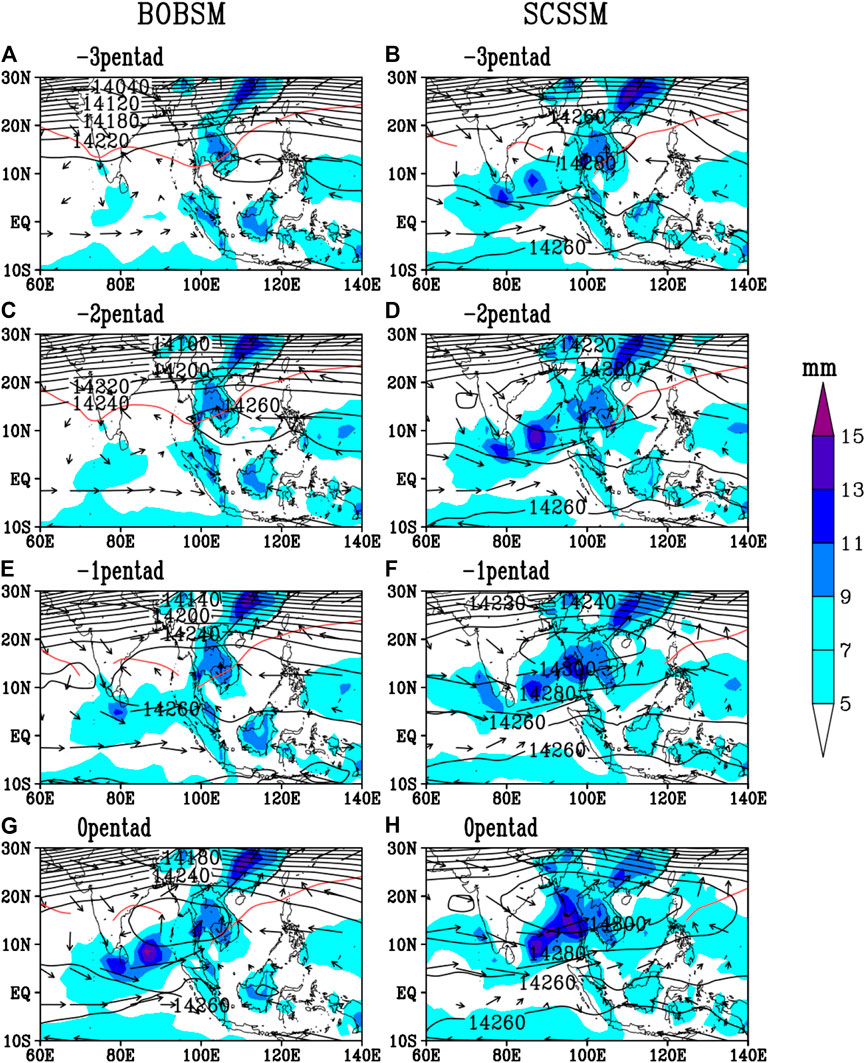
FIGURE 3. Composite maps of precipitation (shaded; unit: mm), 850 hPa horizontal wind (vectors; unit: m/s), and geopotential height at 150 hPa (contour; unit: m) from −3 pentad to the onset pentad of (left panel) BOBSM and (right panel) SCSSM in the period of 1958–1979. The red line represents the ridge of western North subtropical high, which is defined by the zero zonal wind at 850 hPa (u = 0 m/s).
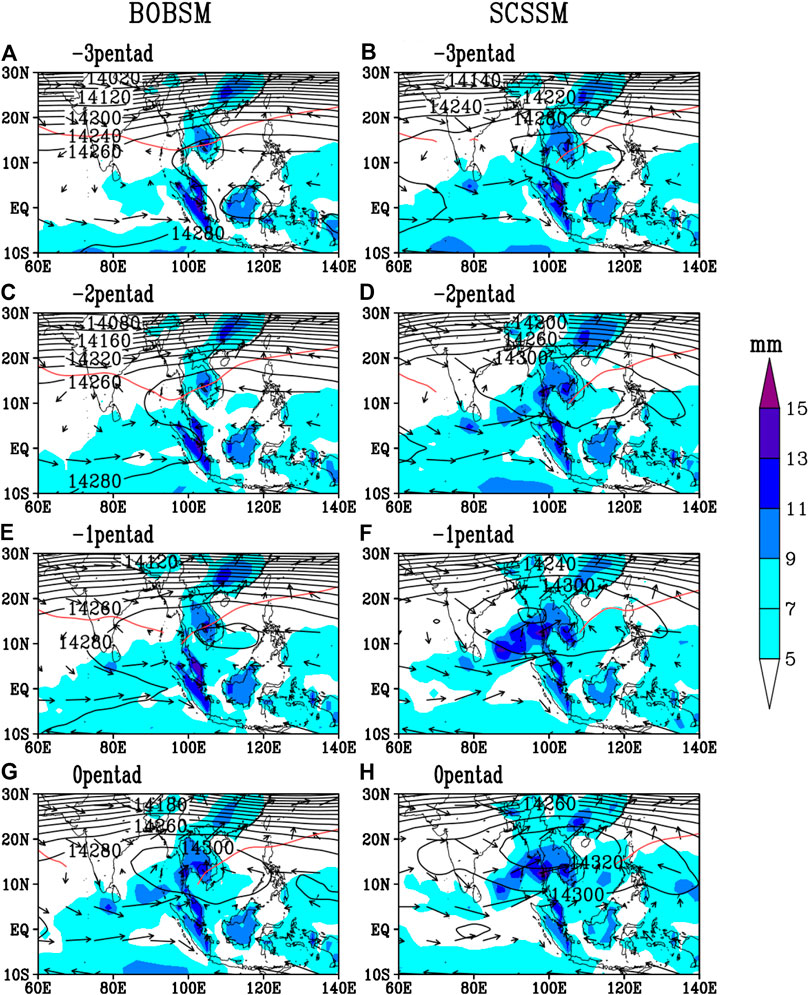
FIGURE 4. Same as Figure 3, but in the period of 1980–2018.
During the second subperiod, the convection activities were observed over the Asian-Australian land bridge near the equator in the −3 pentad (Figure 4A), with stronger amplitude compared with the counterpart during the first subperiod (Figure 3A). In the −1 pentad, there is a closed pressure high center appearing over the southern Indochina Peninsula and SCS (Figure 4E), which rapidly strengthens in the onset pentad of the BOBSM (Figure 4G). Compared with the first subperiod (Figure 3G), the SAH in onset pentad of the second subperiod (Figure 4G) is apparently stronger and lies more eastward, spanning from the BOB to the SCS. In term of the SCSSM, the SAH appears over the Indochina Peninsula and SCS in the −3 pentad (Figure 4B), lying more eastward compared with the SAH in the first subperiod (Figure 3B). Accompanied by the northward displacement of the SAH and significant enhancement of convection activities over the SCS, the southwesterly advances toward the SCS (Figure 4H), which indicates the outbreak of the SCSSM.
Overall, the spatial distribution and temporal evolution of the SAH before the SCSSM onset is distinguishable in different epochs. Specifically, the SAH already forms before the onset of both the BOBSM and SCSSM in the second subperiod, while a broader SAH spans from the BOB to the SCS, possibly providing a uniform background flow which may contribute to the closer connection between the BOBSM and SCSSM after the late 1970s.
Plausible Causes of Interdecadal Change in the Bay of Bengal Summer Monsoon–South China Sea Summer Monsoon Relationship
Role of the South Asian High in May
Some studies indicate that the atmospheric circulation associated with the SAH can serve as divergence pumping over the BOB (Liu et al., 2012; Liu et al., 2013), while it can also provide positive potential vorticity, favoring the ascend movement over the SCS (Liu and Zhu, 2016). Hence, it was hypothesized that a stronger and boarder SAH may be an essential factor that jointly modulates the atmospheric circulation associated with the BOBSM and SCSSM onset. In general, the SAH first appears in early April (Liu et al., 2012; Liu et al., 2013; Wang et al., 2017), and then, the SAH solidly lies over the Indochina Peninsula between 10°N and 20°N in May, illustrated by the climatological geopotential height at the upper troposphere (Figure 5). Based on the onset pentads of different ASM systems identified by Wu et al., 2013, the BOBSM generally outbreaks in the 25th pentad and the SCSSM in the 28th pentad. Hence, the SAH variability in May (from the 25th to 30th pentad, approximately) was examined in this subsection in order to figure out the role of the SAH on the change of BOBSM–SCSSM relationship.
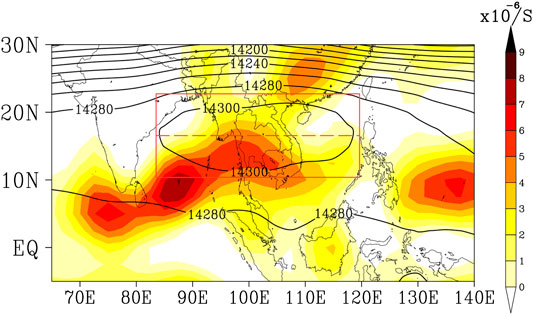
FIGURE 5. Climatological geopotential height (contour; unit: m) and divergence (shaded; unit: s−1) in May at 150 hPa from 1958 to 2018. Two regions (17.5°–22.5°N, 82.5°E–120°E and 10°–15°N, 82.5°E–120°E) are highlighted by red boxes, which were used to define the meridional displacement of the SAH.
For the purpose of exhibiting the spatiotemporal variation of the SAH, we applied the empirical orthogonal function (EOF) analysis to the geopotential height field at 150hPa (Figure 6). As it can be seen in Figure 6A, the first EOF mode (EOF1), accounting for 84.0% of the total variance, displays a monopolar pattern with a center spanning from the Indochina Peninsula, BOB to SCS, which might represent a change in the strength of the SAH. The associated principle component (PC1) exhibits a significant interannual and interdecadal change. The running t-test was performed onto PC1 to determine the interdecadal shift time of PC1, which shows that the PC1 experiences a significant interdecadal shift around the late 1970s, that is, the SAH becomes stronger after then. This result is consistent with previous studies, for instance, it observed a stronger and boarder SAH in boreal summer after 1978 (Zhang et al., 2000; Peng et al., 2018). The correlation coefficients between PC1 and the BOBSM/SCSSM onset were calculated and are given in Table 2. Whether the BOBSM or SCSSM onset has a poor correlation with PC1 during the first subperiod, as the coefficients are −0.06 and −0.15, respectively. However, the correlations increase to 0.43 and 0.34 during the second subperiod, suggesting that a stronger SAH may play a more important role in connecting the BOBSM and SCSSM.
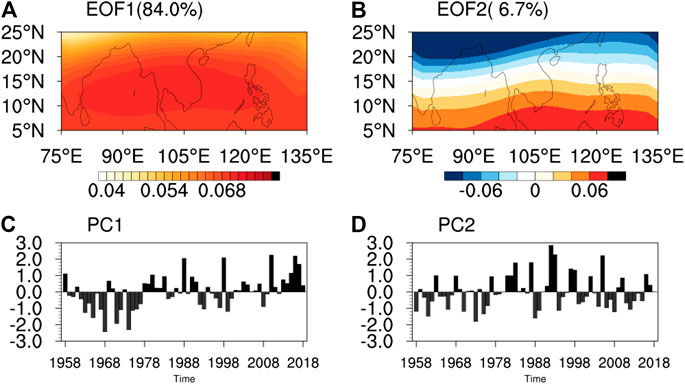
FIGURE 6. Spatial distribution of (A) the first EOF mode (shaded), (B) the second EOF mode (shaded), and (bottom) the corresponding PCs of 150 hPa geopotential height anomalies in May from 1958–2018.

TABLE 2. Correlation coefficients between the first two EOF modes obtained from 150 hPa geopotential height in May (shown in Figure 6) and the onset of BOBSM and SCSSM during the period of 1958–1979 and 1980–2018, respectively.
The upper tropospheric geopotential height and divergence flow associated with PC1 are shown in Figure 7. For the positive PC1 years in the first period, the composite 150 hPa height shows positive anomalies covering South Asia (Figure 7C), while the anomalous convergence is extremely weak, particularly over the BOB and SCS regions (Figure 7A), which indicates that a weak SAH seemly could not induce significant divergence flow at upper troposphere in the South Asia. In contrast, the positive anomalous cover larger scale of South Asia (Figure 7D), which means the SAH enhances significantly in the second period. And there are convergent anomalies covering the eastern BOB and SCS (Figure 7B), which may act as a larger-scale background flow that forms and sustains after the onset of the BOBSM. The pumping effect by the anomalous divergence/convergence flow at the upper troposphere over the BOB and SCS was supposed to be an important mechanism responsible to the closer BOBSM–SCSSM relationship after the late 1970s. However, the effect of advecting anomalous potential vorticity caused by the SAH on SCSSM (Liu and Zhu, 2016) is not significant in the interdecadal change (figures not shown).
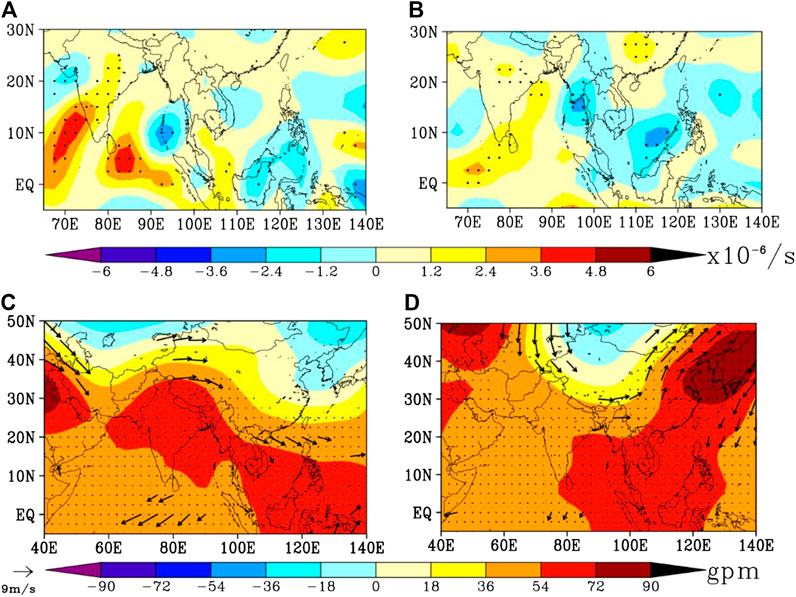
FIGURE 7. Composite differences of (upper) the divergence anomaly (shaded; unit: s-1) and (bottom) geopotential height (shaded; unit: gpm) and horizontal wind (vector; unit: m/s) anomaly at 150 hPa in May between positive and negative years of PC1 for the period of (left) 1958–1979 and (right) 1980–2018. The positive (negative) years of PC1 are higher (lower) than 0.5 (−0.5). The stippling and black vectors denote values exceeding the 90% confidence level.
The spatial pattern of the second EOF mode (EOF2), with a variance contribution of 6.7%, shows a meridional dipole pattern with out-of-phase signals to the north and south of 15°N, suggesting a meridional displacement of the SAH (Figure 6B). To further verify that the EOF2 reveals the meridional shift of the SAH, an index measuring the north-south displacement of the SAH (NSI) is defined by using the difference between the geopotential height at 150 hPa averaged over 10°–15°N, 82.5°–120°E and 17.5°–22.5°N, 82.5°–120°E (Wei et al., 2015). The principal component of EOF2 (PC2) is well related to the NSI with a correlation coefficient as high as 0.9, which implies the EOF2 can represent the north-south movement of the SAH in May to a large extent. Seemly, PC2 shifts from negative to positive phase around the late 1970s (Figure 6D), while the running t-test performed onto PC2 shows that it also experiences a significant interdecadal change in 1979. Overall, the EOF analysis suggests that the SAH may be stronger and more southward in the second subperiod.
Table 2 shows that the correlations of PC2 with the BOBSM (SCSSM) onset are 0.50 (0.35) in the first subperiod, while that increase to 0.51 (0.55) in the second subperiod. Note that the relationship between the meridional location of the SAH and SCSSM becomes tighter after 1979. In the first subperiod, there is a negative anomaly center of upper tropospheric geopotential height lying over South Asia (Figure 8C). Meanwhile, an anomalous convergence center locates at 150 hPa over the BOB, while the anomalous convergence over SCS is not significant (Figure 8A). When the SAH tends to displace southward in the second subperiod, the composite divergence field shows significant anomalous convergence over both the BOB and SCS (Figure 8B), accompanied by a wider range of the meridional shift of the SAH. A larger amplitude of the north-south displacement of the SAH may be related to a larger range of the upper tropospheric divergent pumping, so it possibly has influence on the development of the monsoon-related convection over the eastern BOB and SCS, and then, it contributes to the increasing of the correlation between the SAH meridional shift and SCSSM onset in the 1980–2018 period.
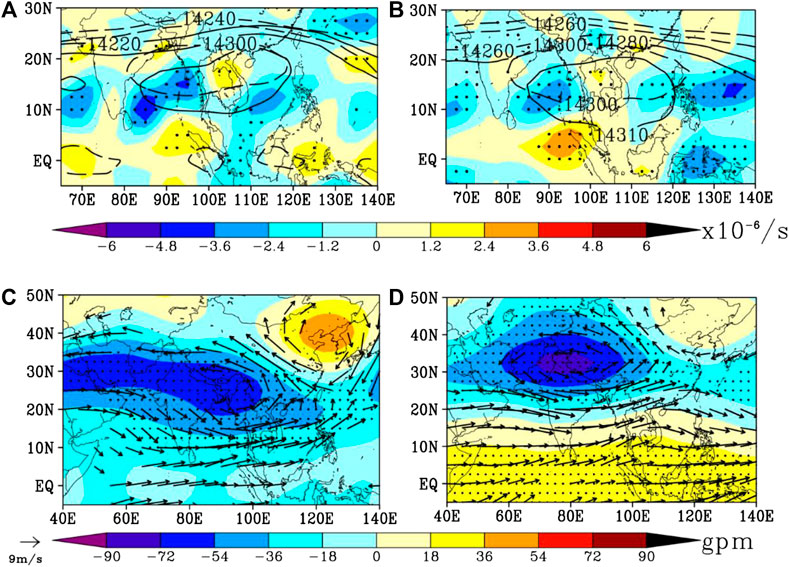
FIGURE 8. Composite differences of (upper) the divergence anomaly (shaded; unit: s-1) and (bottom) geopotential height (shaded; unit: gpm) and horizontal wind (vector; unit: m/s) anomaly at 150 hPa in May between positive and negative years of PC2 for the period of (left) 1958–1979 and (right) 1980–2018. The positive (negative) years of PC1 are higher (lower) than 0.5 (−0.5). The black contour of (A) and (B) indicates the composites of 150 hPa geopotential height (contour; unit: m) for PC2 higher than 0.5 (solid line) or lower than −0.5 (dashed line). The stippling and black vectors denote values exceeding the 90% confidence level.
Both the strength and the meridional swing patterns of the SAH exert impact on the onset of the monsoon, while Liu et al. 2017 demonstrated that the variations of the strength and the position of the SAH are linked to ENSO events. The evolution of ENSO events in spring regulates the relative contribution of the SST over Indian and Pacific oceans to the SAH. Except for the SAH, the role of SST forcing plays an important role in the decadal variations of the relationship of monsoon onset via modulating the background flow, which is analyzed in the next part.
Role of Sea Surface Temperature Forcing
Many previous studies have demonstrated that the perturbation of SST may have pronounced influence on the Asian monsoon onset (Webster and Yang, 1992; Chang and Chen, 1995; Wu and Meng, 1998; Luo et al., 2016). For example, in the 1970s, the interdecadal warming over eastern Pacific weakens the ASM by enhancing the Hadley circulation over eastern Asia (Zeng et al., 2007). The anomalous SST over Indo-Pacific warm pool leads to the anomalous anticyclone over BOB and SCS which may contribute to the interdecadal change of ASM (Zhou et al., 2009). Hence, it is necessary to figure out what role the SST forcing plays on the interdecadal change of the BOBSM–SCSSM relationship around the late 1970s.
At first, the atmospheric circulation associated with different monsoon systems has been examined in different epochs. Considering that the SST forcing often affects the monsoon circulation by changing the background flow, the average was taken from April to May as the April-May mean includes the onset pentads of both BOBSM and SCSSM. Figures 9, 10 present the atmospheric circulation at the lower and upper troposphere associated with the BOBSM and SCSSM in different subperiods. When the BOBSM builds up late, a prominent anomalous low pressure is centered over the north of BOB and is accompanied by anomalous westerly over BOB in the upper troposphere (Figure 9A). In contrast, there is not evident system related to the BOBSM onset in the lower troposphere (Figure 10A). When the SCSSM onsets late, the upper troposphere over SCS is controlled by anomalous westerly wind (Figure 9B), while lower troposphere is taken place by an anomalous anticyclone (Figure 10B). Thus, in the first subperiod, there are distinguishable characteristics between the upper tropospheric circulation related to the BOBSM and SCSSM, respectively. However, in the second subperiod, the associated circulations with the BOBSM are similar to that with the SCSSM. Specifically, the location of anomalous low pressure at the upper troposphere presents a northeastward shift (Figure 9C), compared with that in the first subperiod (Figure 9A). The large-scale anomalous high pressure appears at 150 hPa from TIO to Arabian Sea, BOB and SCS, which cannot be seen in the first subperiod. The anomalous low pressure accompanied by large-scale anomalous high pressure at 150 hPa may contribute to a wider range westerly flow, which controls the upper troposphere of both BOB and SCS in the second subperiod (Figures 9C,D).
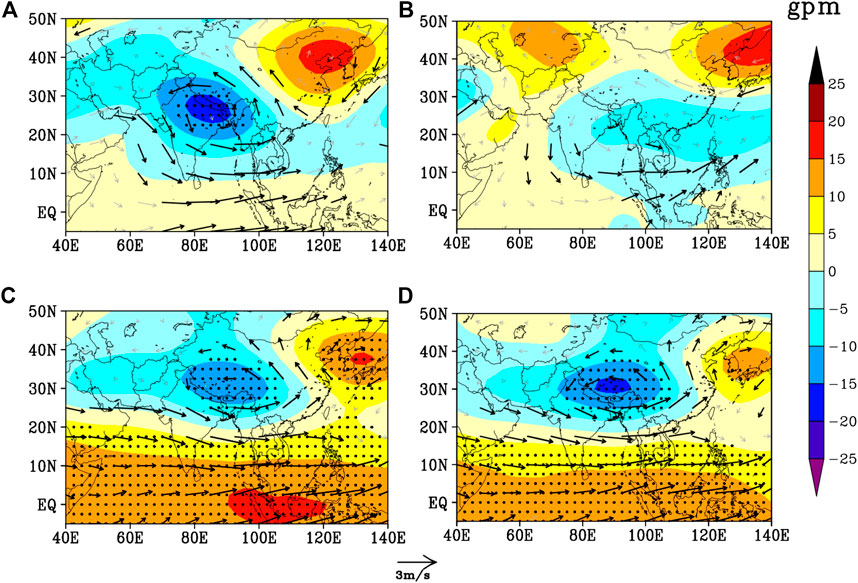
FIGURE 9. Regression maps of the AM-mean wind anomaly (vectors; unit: m/s) and geopotential height anomaly (shaded; unit: m) at 150 hPa against the (left) BOBSM onset time and (right) SCSSM onset for (upper) 1958–1979 and (bottom) 1980–2018. The stippling and black vectors denote values exceeding the 90% confidence level.
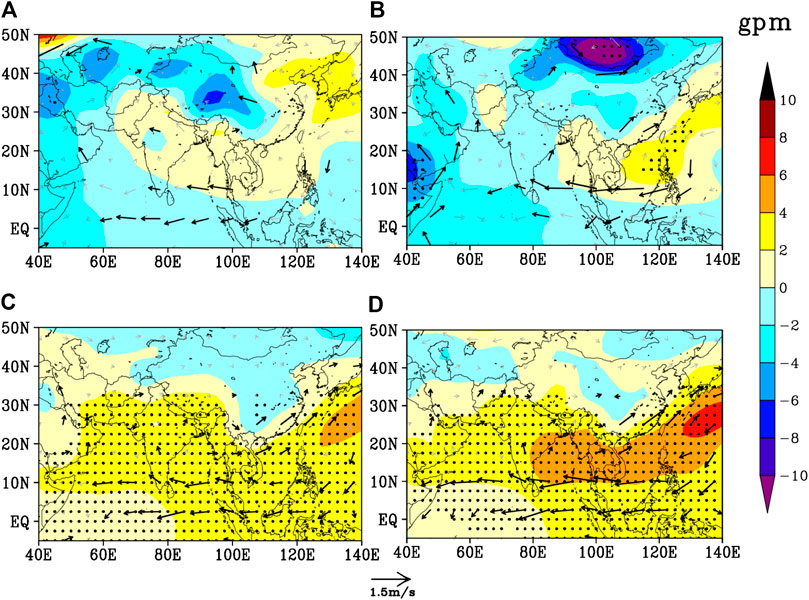
FIGURE 10. Same as Figure 9, but for the variables at 850 hPa.
As term for the lower troposphere, when the BOBSM and SCSSM onset late in the 1980–2018 period, there is anomalous anticyclone accompanied by anomalous high pressure occurring in the BOB and SCS (Figures 10C,D), which is adverse to the development of the westerly flow and monsoon convection in lower troposphere (Figure 4). Except for the anomalous high pressure at 850 hPa over BOB and SCS coupling with the same anomalies at 150 hPa (Figures 9C,D), the vertical structure in the whole troposphere is occurred by the anomalous high pressure (figure not shown), which implies that it is a barotropic structure in the 1980–2018 period. In addition to the lower tropospheric circulation linked to the monsoon convection, Liu et al., 2013 showed that the trumpet-shaded easterly flow of the SAH forms divergence pumping and ascent movement, which are in favor of the monsoon outbreak. Figure 11 demonstrates the divergence filed associated with the BOBSM and SCSSM in two periods, respectively. In the 1958–1979 period, the anomalous convergence over the south of BOB is relevant to the delayed BOBSM onset. But when the SCSSM builds up late, the related anomalous convergence only occurs over SCS where the development of convection contributes to the monsoon forming and some parts of tropical western North Pacific. In the 1980–2018 period, compared with the BOBSM (Figure 11C), although the SCSSM-related anomalous convergence is relatively weak (Figure 11D), the location of BOBSM-related anomalous convergence is similar to the SCSSM-related anomalous convergence. When the BOBSM and SCSSM onset late, the anomalous convergence ranging from the south of BOB and SCS to the east of Philippines modulates the monsoon convection in lower troposphere over BOB and SCS at the same pace. The larger scale of anomalous convergence may result from the anomalous westerly flow at 150 hPa (Figures 9C,D) because wider range of the anomalous westerly wind at 150 hPa in 1980–2018 weaken the trumpet-shaped easterly wind of the southern SAH, which results in the divergence pump for the formation of convection, and then contributes to the increasing correlation between the BOBSM and SCSSM in the 1980–2018 period.
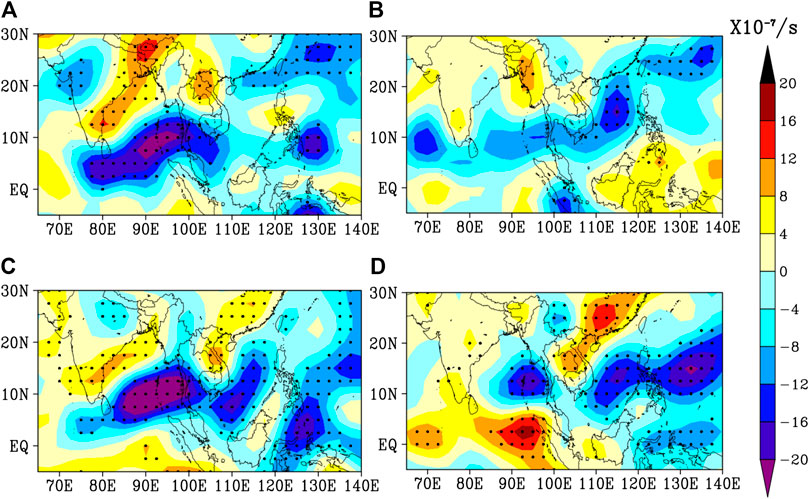
FIGURE 11. Regression maps of the preonset divergence anomaly (shaded; unit: s−1) at 150 hPa against the (left) BOBSM onset time and (right) SCSSM onset time for (upper) 1958–1979 and (bottom) 1980–2018. The stippling denotes values exceeding the 90% confidence level. The preonset stages of BOBSM and SCSSM are pentads 22–24 and 25–27, respectively.
As for the anomalies in lower troposphere, many research studies indicate that the SST anomaly can efficiently modulate the low-level circulations, leading to the change of the monsoon onset (Hu and Duan, 2015; Liu et al., 2016). According to Figure 12, the relevant SST anomalies are characterized by the anomalous cold SST in the SCS and western North Pacific in the 1958–1979 period. Besides, as for the onset of the BOBSM in the first subperiod, there is a positive SST anomaly over the western tropical Pacific (Figure 12A), and the negative SST anomalies (Figure 12A) are weaker than the SCSSM-related over SCS (Figure 12B). The difference of the relevant SST anomalies between the BOBSM and SCSSM indicates that the SST anomalies serving as the external forcing for the onset of the BOBSM and SCSSM are different. And the lack of synchronous SST anomalies over the whole northern Indian Ocean in the first period may be the reason why the anomalous anticyclone shrinks compared with the second period (Ding et al., 2010). In the 1980–2018 period, the warm SST anomalies over TIO, Arabian Sea, SCS, and the western North Pacific (Figures 12C,D) are resembling the basin warming mode of Indian Ocean after the 1980s which is noted by some studies (Saji et al., 2006; Zheng et al., 2011; Huang et al., 2015). This result is consistent with previous studies which demonstrated that the Indian Ocean basin warming mode serves as the main driver to the abnormal low-level anticyclone and the upper-level anomalous high pressure over South Asia (Yang et al., 2007; Yuan et al., 2008; Hu and Duan, 2015). However, the specific mechanism of the SSTA modulating the anomalous anticyclone at 850 hPa (Figures 6C,D) and the anomalous high pressure in upper troposphere (Figures 5C,D) remains unclear. And the contribution of the basin warming mode of the Indian Ocean to the variation of the BOBSM and SCSSM on the interdecadal time scale needs to be further analyzed.
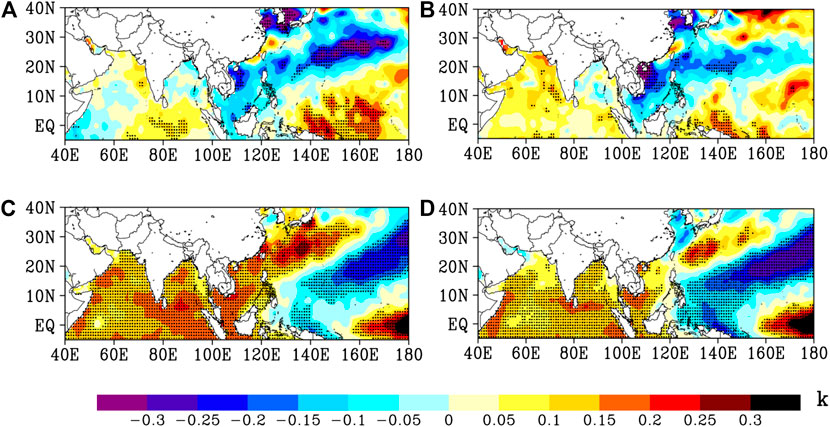
FIGURE 12. Regression maps of the AM-mean SST (shaded; unit: K) against the (left) BOBSM onset time and (right) SCSSM onset time for (upper) 1958–1979 and (bottom) 1980–2018. The stippling denotes values exceeding the 90% confidence level.
Summary and Discussion
In terms of onset, observations show that the BOBSM–SCSSM relationship experienced a significant interdecadal change around the late 1970s. In 1958–1979, the correlation between the BOBSM and SCSSM is 0.22, while it increases to 0.66 in 1980–2018, suggesting a closer connection between the BOBSM and SCSSM after the late 1970s. The evolution of the circulation at low troposphere and the SAH at upper troposphere during the monsoon onset shows interdecadal change as well. Through the analysis of upper troposphere circulation and the SAH, we found that the strength and the meridional shift of the SAH also experience a significant interdecadal change around the late 1970s. That is, the strength of the SAH experiences an interdecadal enhancement, while the meridional shift of the SAH exhibits a wider range in the second subperiod. Both interdecadal change of strength and the meridional shift of the SAH shed more influence in the monsoon onset by modulating the divergent field of upper troposphere in the second subperiod, which may contribute to the closer relationship of the BOBSM and SCSSM. Except for the internal variation of the atmospheric circulation, the external forcing from the SST cannot be ignored. It was found that the tropical Indian Ocean possesses a basin-scale warming after the late 1970s. The upper-level anomalous high pressure over the warming Indian Ocean is accompanied by an anomalous low-pressure center to its north, which is associated with strong westerly anomaly around 20°N, and then modulate the onset of the BOBSM and SCSSM in 1980–2018 through the upper-level divergent field. Furthermore, the zonal-elongated anomalous high pressure lying from the BOB and SCS to the western North Pacific at lower troposphere influences the outbreak of both BOBSM and SCSSM in the second subperiod. This coupling system between the upper and lower tropospheres can act as a large-scale background flow which may modulate the onset of the BOBSM and SCSSM synchronously.
In the present work, the role of SST forcing and the SAH in the BOBSM–SCSSM connection is investigated, respectively. However, the SAH can be influenced by the SST anomaly over the Indian Ocean via a heat-induced Matsuno–Gill pattern in upper troposphere according to previous studies (Yang et al., 2007; Wu et al., 2011; Hu and Duan, 2015). The linkage between SST forcing and the SAH and their relative contribution to the BOBSM–SCSSM relationship need more research. Except for the SST forcing, the interdecadal change of the BOBSM–SCSSM relationship may result from the thermal condition of upper tropospheric atmosphere to the north of BOB, which is plausibly linked to the thermal forcing of TP. According to the regressions of the 20°–30°N-averaged pressure-longitude cross-section of the air temperature in two subperiods, respectively (Figure 13), it was noted that there is an anomalous cold center to the north of BOB (80°–100°E) from the lower to upper troposphere (Figure 13A), which matches the location of the anomalous low pressure well (Figure 9A). In the 1980–2018 period, the prominent cold anomalies related to the BOBSM and SCSSM only extend from the middle to upper troposphere (Figures 13C,D), with a wider zonal range and shifting more eastward. It indicates that the difference of anomalous low pressure at upper troposphere in the two subperiods might be attributed to the discrepancies of atmospheric temperature. Besides, the solid existence of anomalous cold over the southern TP might be adverse to the reverse of meridional temperature gradient at the upper troposphere over the South Asia, which is concurrent with the onset of ASM (Webster and Yang, 1992; Li and Yanai, 1996; He et al., 2003). According to previous studies, the air temperature over the TP is significantly influenced by the TP through the sensible heating and vertical velocity (Ding, 1992a; Si and Ding, 2013). Hence, the role of TP forcing on the interdecadal change of the BOBSM–SCSSM relationship remains unknown which needs to be further investigated. Furthermore, the basin warming of the Indian Ocean can also affect the heat condition of TP through modulating the atmosphere circulation (Hu and Duan, 2015), the relative contribution of TP and SST on the monsoon onset remains unclear.
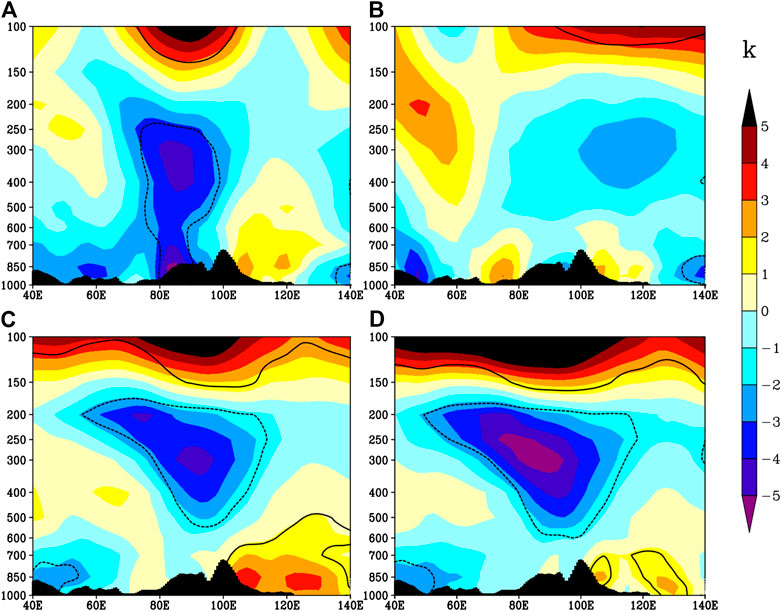
FIGURE 13. Regression maps of the pressure–longitude cross-section of the AM-mean air temperature (shaded; unit: K) averaged between 20° and 30°N against the (left) BOBSM onset time and (right) SCSSM onset time for (upper) 1958–1979 and (bottom) 1980–2018. The area circled by black line denotes values exceeding the 90% confidence level.
It is well-known that the ASM onset is a very complex issue, since it is linked to abundant climate systems on different timescale. For instance, the onset of the monsoon is related to the intraseasonal convection activity, the variability of the subtropical high over the western North Pacific, the cold-surge derived from the mid-latitude, and so on, which may be play a role on the change of the BOBSM–SCSSM relationship on the interdecadal time scale. Further analysis needs to be carried on to figure out what causes the closer connection between the BOBSM and SCSSM after the late 1970s.
Data Availability Statement
Publicly available datasets were analyzed in this study. This data can be found here: NCEP1 [https://psl.noaa.gov/data/gridded/data.ncep.reanalysis.html]20CRv3 [https://psl.noaa.gov/data/gridded/data.20thC_ReanV3.html#detail]HadISST [https://www.metoffice.gov.uk/hadobs/index.html].
Author Contributions
All authors have made a substantial, direct and intellectual contribution to the work, and approved it for publication.
Funding
This research is jointly supported by the National Key Research and Development Program of China (2016YFA0600601) and National Natural Science Foundation of China (41530530,41875087,41905072).
Conflict of Interest
The authors declare that the research was conducted in the absence of any commercial or financial relationships that could be construed as a potential conflict of interest.
Acknowledgments
The authors thank the reviewers for their valuable suggestions that helped improve this manuscript.
References
Annamalai, H., Okajima, H., and Watanabe, M. (2007). Possible impact of the Indian ocean SST on the northern hemisphere circulation during El Niño*. J. Clim. 20, 3164–3189. doi:10.1175/JCLI4156.1
Chang, C.-P., and Chen, G. T.-J. (1995). Tropical circulations associated with southwest monsoon onset and westerly surges over the south China sea. Mon. Weather Rev. 123, 3254–3267. doi:10.1175/1520-0493(1995)123%3C3254:TCAWSM%3E2.0.CO;2
Ding, R., Ha, K. J., and Li, J. P. (2010). Interdecadal shift in the relationship between the East Asian summer monsoon and the tropical Indian Ocean. Clim. Dynam. 34, 1059–1071. doi:10.1007/s00382-009-0555-2
Ding, S., Wen, Z., and Chen, W. (2016). Interdecadal change in the relationship between the South China Sea summer monsoon onset and two types of pacific sea surface temperature anomaly. Chin. J. Atmos. Sci. 40, 243–256. doi:10.3878/j.issn.1006-9895.1507.15102
Ding, Y. (1992a). Effects of the Qinghai-Xizang (Tibetan) plateau on the circulation features over the plateau and its surrounding areas. Adv. Atmos. Sci. 9, 112–130. doi:10.1007/BF02656935
Ding, Y. H. (1992b). Summer monsoon rainfalls in China. J. Meteorol. Soc. Japan Ser. II. 70, 373–396. doi:10.2151/jmsj1965.70.1B_373
Ding, Y. H., Sun, Y., Wang, Z. Y., Zhu, Y. X., and Song, Y. F. (2009). Inter-decadal variation of the summer precipitation in China and its association with decreasing Asian summer monsoon Part II: possible causes. Int. J. Climatol. 29, 1926–1944. doi:10.1002/joc.1759
Ding, Y. H., Wang, Z. Y., and Sun, Y. (2008). Inter-decadal variation of the summer precipitation in East China and its association with decreasing Asian summer monsoon. Part I: observed evidences. Int. J. Climatol. 28, 1139–1161. doi:10.1002/joc.1615
Fu, J. J., Li, S. L., and Luo, D. H. (2009). Impact of global SST on decadal shift of east asian summer climate. Adv. Atmos. Sci. 26, 192–201. doi:10.1007/s00376-009-0192-z
He, H., Mcginnis, J. W., Song, Z., and Yanai, M. (1987). Onset of the asian summer monsoon in 1979 and the effect of the Tibetan plateau. Mon. Weather Rev. 115, 1966–1995. doi:10.1175/1520-0493(1987)115%3C1966:OOTASM%3E2.0.CO;2
He, H. Y., Sui, C. H., Jian, M. Q., Wen, Z. P., and Lan, G. D. (2003). The evolution of tropospheric temperature field and its relationship with the onset of Asian summer monsoon. J. Meteorol. Soc. Jpn. 81, 1201–1223. doi:10.2151/jmsj.81.1201
Hu, J., and Duan, A. (2015). Relative contributions of the Tibetan Plateau thermal forcing and the Indian Ocean Sea surface temperature basin mode to the interannual variability of the East Asian summer monsoon. Clim. Dynam. 45, 2697–2711. doi:10.1007/s00382-015-2503-7
Huang, G., Hu, K., Qu, X., Weichen, T., Shailei, Y., Guijie, Z., et al. (2015). A review about Indian Ocean basin mode and its impacts on east asian summer climate. Chin. J. Atmos. Sci. 40, 121–130. doi:10.3878/j.issn.1006-9895.1505.15143
Kajikawa, Y., and Wang, B. (2012). Interdecadal change of the south China Sea summer monsoon onset. J. Clim. 25, 3207–3218. doi:10.1175/JCLI-D-11-00207.1
Kajikawa, Y., Yasunari, T., Yoshida, S., and Fujinami, H. (2012). Advanced Asian summer monsoon onset in recent decades. Geophys. Res. Lett. 39, 1033. doi:10.1029/2011GL050540
Kalnay, E., Kanamitsu, M., Kistler, R., Collins, W., Deaven, D., Gandin, L., et al. (1996). The NCEP/NCAR 40-year reanalysis project. Bull. Am. Meteorol. Soc. 77, 437–471. doi:10.1175/1520-0477
Li, C., and Yanai, M. (1996). The onset and interannual variability of the asian summer monsoon in relation to land–sea thermal contrast. J. Clim. 9, 358–375. doi:10.1175/1520-0442(1996)009%3C0358:TOAIVO%3E2.0.CO;2
Li, H., Dai, A., Zhou, T., and Lu, J. (2008). Responses of East Asian summer monsoon to historical SST and atmospheric forcing during 1950–2000. Clim. Dynam. 34, 501–514. doi:10.1007/s00382-008-0482-7
Li, K. P., Liu, Y. L., Li, Z., Yang, Y., Feng, L., Khokiattiwong, S., et al. (2018). Impacts of ENSO on the Bay of bengal summer monsoon onset via modulating the intraseasonal oscillation. Geophys. Res. Lett. 45, 5220–5228. doi:10.1029/2018GL078109
Liu, B. Q., He, J. H., and Wang, L. J. (2012). On a possible mechanism for southern asian convection influencing the south asian high establishment during winter to summer transition. J. Trop. Meteorol. 18, 473–484. doi:10.16555/j.1006-8775.2012.04.007
Liu, B. Q., Liu, Y. M., Wu, G. X., Yan, J. H., He, J. H., and Ren, S. L. (2015a). Asian summer monsoon onset barrier and its formation mechanism. Clim. Dynam. 45, 711–726. doi:10.1007/s00382-014-2296-0
Liu, B. Q., Wu, G. X., Mao, J. Y., and He, J. H. (2013). Genesis of the south asian high and its impact on the asian summer monsoon onset. J. Clim. 26, 2976–2991. doi:10.1175/JCLI-D-12-00286.1
Liu, B. Q., Wu, G. X., and Ren, R. C. (2015b). Influences of ENSO on the vertical coupling of atmospheric circulation during the onset of South Asian summer monsoon. Clim. Dynam. 45, 1859–1875. doi:10.1007/s00382-014-2439-3
Liu, B. Q., and Zhu, C. W. (2016). A possible precursor of the south China Sea summer monsoon onset: effect of the south asian high. Geophys. Res. Lett. 43, 11072–11079. doi:10.1002/2016GL071083
Liu, B. Q., Zhu, C. W., and Yuan, Y. (2017). Two interannual dominant modes of the South Asian High in May and their linkage to the tropical SST anomalies. Clim. Dynam. 49, 2705–2720. doi:10.1007/s00382-016-3490-z
Liu, B. Q., Zhu, C. W., Yuan, Y., and Xu, K. (2016). Two types of interannual variability of South China Sea summer monsoon onset related to the SST anomalies before and after 1993/94. J. Clim. 29, 6957–6971. doi:10.1007/s00382-016-3490-z
Liu, Y. M., Chan, J. C. L., Mao, J. Y., and Wu, G. X. (2002). The role of Bay of Bengal convection in the onset of the 1998 South China Sea summer monsoon. Mon. Weather Rev. 130, 2731–2744. doi:10.1175/JCLI-D-16-0065.1
Luo, M., Leung, Y., Graf, H.-F., Herzog, M., and Zhang, W. (2016). Interannual variability of the onset of the South China Sea summer monsoon. Int. J. Climatol. 36, 550–562. doi:10.1175/1520-0493(2002)130%3C2731:TROBOB%3E2.0.CO;2
Mao, J., and Wu, G. (2007). Interannual variability in the onset of the summer monsoon over the Eastern Bay of Bengal. Theor. Appl. Climatol. 89, 155–170. doi:10.1002/joc.4364
Peng, L. X., Zhu, W. J., Li, Z. X., Ni, D. H., Chen, H. S., Pan, L. L., et al. (2018). The interdecadal variation of the south asian high and its association with the sea surface temperature of tropical and subtropical regions. J. Trop. Meteorol. 24, 111–122. doi:10.16555/j.1006-8775.2018.01.011
Rayner, N. A., Parker, D. E., Horton, E. B., Folland, C. K., Alexander, L. V., Rowell, D. P., et al. (2003). Global analyses of sea surface temperature, sea ice, and night marine air temperature since the late nineteenth century. J. Geophys. Res. Atmos. 108, 4407. doi:10.1029/2002JD002670
Saji, N. H., Xie, S. P., and Yamagata, T. (2006). Tropical Indian Ocean variability in the IPCC twentieth-century climate simulations. J. Clim. 19, 4397–4417. doi:10.1175/JCLI3847.1
Si, D., and Ding, Y. (2013). Decadal change in the correlation pattern between the Tibetan plateau winter snow and the east asian summer precipitation during 1979–2011. J. Clim. 26, 7622–7634. doi:10.1175/JCLI-D-12-00587.1
Slivinski, L. C., Compo, G. P., Whitaker, J. S., Sardeshmukh, P. D., Giese, B. S., Mccoll, C., et al. (2019). Towards a more reliable historical reanalysis: improvements for version 3 of the twentieth century reanalysis system. Q. J. R. Meteorol. Soc. 145, 2876–2908. doi:10.1002/qj.3598
Wang, B., and Linho, (2002). Rainy season of the asian–pacific summer monsoon*. J. Clim. 15, 386–398. doi:10.1175/1520-0442(2002)015<0386:RSOTAP>2.0.CO;2
Wang, B., Linho, , Zhang, Y., and Lu, M.-M. (2004). Definition of South China sea monsoon onset and commencement of the east Asia summer monsoon*. J. Clim. 17, 699–710. doi:10.1175/2932.1
Wang, H. (2001). The weakening of the Asian monsoon circulation after the end of 1970's. Adv. Atmos. Sci. 18, 376–386.
Wang, L. J., Dai, A. G., Guo, S. H., and Ge, J. (2017). Establishment of the south asian high over the Indo-China Peninsula during late spring to summer. Adv. Atmos. Sci. 34, 169–180. doi:10.1007/s00376-016-6061-7
Webster, P. J., and Yang, S. (1992). Monsoon and enso - selectively interactive systems. Q. J. R. Meteorol. Soc. 118, 877–926. doi:10.1002/qj.49711850705
Wei, W., Zhang, R. H., Wen, M., Kim, B. J., and Nam, J. C. (2015). Interannual variation of the south asian high and its relation with Indian and east asian summer monsoon rainfall. J. Clim. 28, 2623–2634. doi:10.1175/JCLI-D-14-00454.1
Wei-Dong, Y., Kui-Ping, L., Jian-Wei, S., Lin, L., Hui-Wu, W., and Yan-Liang, L. (2015). The onset of the monsoon over the Bay of bengal: the year-to-year variations. Atm. Ocean. Sci. Lett. 5, 342–347. doi:10.1080/16742834.2012.11447011
Wu, G., Duan, A., Liu, Y., Yan, J., Liu, B., Ren, S., et al. (2013). Recent advances in the study on the dynamics of the Asian summer monsoon onset. Chin. J. Atmos. Sci. 37, 211–228. doi:10.1007/s00376-007-0972-2
Wu, G., Guan, Y., Liu, Y., Yan, J., and Mao, J. (2011). Air–sea interaction and formation of the Asian summer monsoon onset vortex over the Bay of Bengal. Clim. Dynam. 38, 261–279. doi:10.1007/s00382-010-0978-9
Wu, G. X., and Meng, W. (1998). Gearing between the indo-monsoon circulation and the pacific-walker circulation and the ENSO. Part I: Data analyses. Chin. J. Atmos. Sci. 22, 380.
Wu, G. X., and Zhang, Y. S. (1998). Tibetan plateau forcing and the timing of the monsoon onset over south Asia and the south China sea. Mon. Weather Rev. 126, 913–927. doi:10.1175/1520-0493(1998)126<0913:TPFATT>2.0.CO;2
Wu, R. G., Wen, Z. P., Yang, S., and Li, Y. Q. (2010). An interdecadal change in southern China summer rainfall around 1992/93. J. Clim. 23, 2389–2403. doi:10.1175/2009JCLI3336.1
Xiang, B. Q., and Wang, B. (2013). Mechanisms for the advanced asian summer monsoon onset since the mid-to-late 1990s. J. Clim. 26, 1993–2009. doi:10.1175/JCLI-D-12-00445.1
Xie, S.-P., Hu, K., Hafner, J., Tokinaga, H., Du, Y., Huang, G., et al. (2009). Indian ocean capacitor effect on indo–western pacific climate during the summer following El Niño. J. Clim. 22, 730–747. doi:10.1175/2008JCLI2544.1
Xie, S. P., and Saiki, N. (1999). Abrupt onset and slow seasonal evolution of summer monsoon in an idealized GCM simulation. J. Meteorol. Soc. Jpn. 77, 949–968. doi:10.2151/jmsj1965.77.4_949
Yan, H. M., Sun, C. H., Wang, L., Li, R., and Jin, Y. (2018). Studies on onset criterion and interannual characteristics of summer monsoon over Bay of Bengal. Chin. J. Geophys.-Chin. Edit. 61, 4356–4372. doi:10.1080/16742834.2012.11447011
Yang, J. L., Liu, Q. Y., Xie, S. P., Liu, Z. Y., and Wu, L. X. (2007). Impact of the Indian Ocean SST basin mode on the Asian summer monsoon. Geophys. Res. Lett. 34, L02708. doi:10.1029/2006GL028571
Yim, S.-Y., Jhun, J.-G., and Yeh, S.-W. (2008). Decadal change in the relationship between east Asian–western North Pacific summer monsoons and ENSO in the mid-1990s. Geophys. Res. Lett. 35. doi:10.1029/2008GL035751
Yuan, F., and Chen, W. (2013). Roles of the tropical convective activities over different regions in the earlier onset of the South China Sea summer monsoon after 1993. Theor. Appl. Climatol. 113, 175–185. doi:10.1007/s00704-012-0776-x
Yuan, Y., Zhou, W., Chan, J. C. L., and Li, C. Y. (2008). Impacts of the basin-wide Indian Ocean SSTA on the South China Sea summer monsoon onset. Int. J. Climatol. 28, 1579–1587. doi:10.1002/joc.1671
Zeng, G., Sun, Z., Wang, W. C., and Min, J. (2007). Interdecadal variability of the east Asian summer monsoon and associated atmospheric circulations. Adv. Atmos. Sci. 24, 915–926. doi:10.1007/s00376-007-0915-y
Zhang, H. Y., Wen, Z. P., Wu, R. G., Chen, Z. S., and Guo, Y. Y. (2017). Inter-decadal changes in the East Asian summer monsoon and associations with sea surface temperature anomaly in the South Indian Ocean. Clim. Dynam. 48, 1125–1139. doi:10.1007/s00382-016-3131-6
Zhang, Q., Qian, Y., and Zhang, X. (2000). Interannual and interdecadal variations of the south Asia high. Chin. J. Atmos. Sci. 24, 67–78.
Zheng, X. T., Xie, S. P., and Liu, Q. Y. (2011). Response of the Indian Ocean basin mode and its capacitor effect to global warming. J. Clim. 24, 6146–6164. doi:10.1175/2011JCLI4169.1
Zhou, T. J., Yu, R. C., Zhang, J., Drange, H., Cassou, C., Deser, C., et al. (2009). Why the western pacific subtropical high has extended westward since the late 1970s. J. Clim. 22, 2199–2215. doi:10.1175/2008JCLI2527.1
Keywords: Bay of Bengal summer monsoon, South China Sea summer monsoon, interdecadal change, South Asian High, Indian Ocean basin warming
Citation: Zeng Z, Guo Y and Wen Z (2021) Interdecadal Change in the Relationship Between the Bay of Bengal Summer Monsoon and South China Sea Summer Monsoon Onset. Front. Earth Sci. 8:610982. doi: 10.3389/feart.2020.610982
Received: 28 September 2020; Accepted: 18 November 2020;
Published: 13 January 2021.
Edited by:
Lin Wang, Institute of Atmospheric Physics (CAS), ChinaReviewed by:
Boqi Liu, Chinese Academy of Meteorological Sciences, ChinaMaoqiu Jian, Sun Yat-sen University, China
Copyright © 2021 Zeng, Guo and Wen. This is an open-access article distributed under the terms of the Creative Commons Attribution License (CC BY). The use, distribution or reproduction in other forums is permitted, provided the original author(s) and the copyright owner(s) are credited and that the original publication in this journal is cited, in accordance with accepted academic practice. No use, distribution or reproduction is permitted which does not comply with these terms.
*Correspondence: Zhiping Wen, enB3ZW5AZnVkYW4uZWR1LmNu
 Zhenjie Zeng
 Yuanyuan Guo
 Zhiping Wen