- 1Dadu River Hydropower Development Co., Ltd., Chengdu, China
- 2Institute of Geophysics, China Earthquake Administration, Beijing, China
- 3Sichuan Earthquake Administration, Chengdu, China
Study of the mechanical response of rock slopes to moderate earthquakes is important for understanding the local rheology of landslide and earthquake interactions and for mitigating the risks associated with subsurface geological processes in tectonically active mountainous belts. To complement existing point measurements from surface observations (e.g., global positioning system and interferometric synthetic-aperture radar measurements), measuring the ambient noise-based velocity change (
Introduction
Deep-seated rock slopes are widely distributed in the mountainous areas of Sichuan Province, which is one of the most active geohazard regions in China. There are over 300,000 slopes in this area, which are susceptible to a high level of landslide activity (Lin and Wang, 2018). Simultaneously, it is also a seismically active area. Increased seismicity has been recognized in the last decade since the 2008 Wenchuan earthquake (Chigira et al., 2010). According to the earthquake catalogs from Sichuan Earthquake Administration, over 4,000 earthquakes occurred in 2019 with magnitudes ranging from Mw 1 to Mw 5.7.
Mass movement on the damaged rock slopes constitutes a major geological hazard, damaging infrastructure such as dams, roads, railways, and bridges and leading to loss of life. Among a variety of physical parameters (e.g., atmospheric pressure, tide, temperature, and rainfall), seismicity has a strong impact on the damage evolution of the rock slopes as dynamic strain is applied by seismic shaking. Previous studies on seismic hazard assessment on slopes after earthquakes have been based on the statistical analysis of regional inventories of earthquake-triggered landslides (Keefer, 1984; Keefer, 2002). Due to a lack of in-situ data and a cost-effective method that is sensitive to the changes of elastic properties, there have been few quantitative studies on earthquake-induced temporal changes on slopes.
Observational evidence (Larose et al., 2015) and theoretical models (Colombero et al., 2017) suggest the earthquake-induced damage is associated with changes in the material’s elastic moduli, which lead to failure of the rock slopes. Owing to the heterogeneous elastic nonlinearity, it is hard to quantify such damage on the rock slopes at scales ranging from macroscopic fractures to microscopic contact changes between grains. Nevertheless, it is widely recognized that loss of rigidity is a fundamental signature of the damage development. Therefore, this makes monitoring the changes in elastic wave velocity (Murnaghan, 1951) an ideal method to remotely assess the internal damage development of the rock slopes.
Among the emerging techniques in this field, one promising monitoring approach is ambient seismic noise cross-correlation. This is a passive technique that enables retrieval of impulse responses through cross-correlation of ambient seismic noise recorded at any two sensors. Depending on the multiple scattered coda waves retrieved by the ambient cross-correlation technique (Larose et al., 2006), it is possible to further monitor stress changes of the medium by inferring velocity changes from the phase shift in the coda at different times (Snieder, 2006). This forms the basis of ambient seismic noise interferometry for time-lapse applications. Ambient seismic noise interferometry has been used in geophysics for more than 30 years, e.g., to study the dynamic evolution in faults by monitoring velocity changes caused by nearby earthquakes (Brenguier et al., 2008). This method has been proposed to study the precursor instabilities responsible for landslides. A significant velocity reduction was reported several days before the failure on the Pont Bourquin clay soil of the Swiss Alps (Mainsant et al., 2012). Moreover, the method enhances the knowledge of deformation by environmental variations (e.g., seasonal fluctuations and groundwater infiltration) on slopes with materials composed of clay soil and/or volcanic deposits (Larose et al., 2015).
Monitoring changes of rock slopes during earthquake shaking and the subsequent recovery phase is used to study the dynamic elastic properties of the rock slopes and also to evaluate the damage level. However, to the best of the authors’ knowledge, only few observations with limited typology of the slope have successfully tracked co-seismic changes. Even less understood is the healing process due to post-seismic changes when moderate dynamic stress solicitation is applied on rock slopes by a distant earthquake.
This paper focuses on the co-seismic and post-seismic changes on the Pubugou rock slope due to the Changning Mw 5.7 earthquake in 2019. The coda wave velocity changes with a 1-h temporal resolution are measured by applying ambient seismic noise interferometry to continuous recordings on the slope. With these results, some possible explanations and implications of the observations are discussed.
Materials and Methods
Study Area
As shown in Figure 1A, the Pubugou rock slope is in the middle of the deep-seated bare bedrock alpine valleys of Dadu River between the west margin of Sichuan Basin and the Tibet Plateau. The rock slope is
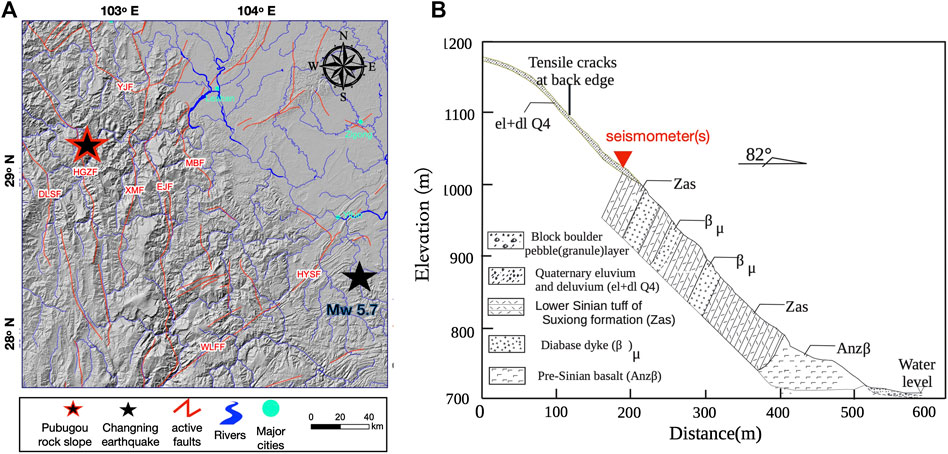
FIGURE 1. (A) Tectonic settings surrounding the Pubugou slope (the hypocenter of the Changning Mw 5.7 earthquake is indicated by the black star). (B) Geological profile of the slope, mainly composed of sedimentary rocks.
Figure 1B illustrates that the east-facing slope with its height of about 1,180 m above mean sea level (m a.m.s.l.) consists of highly weathered tuffaceous rocks and diabases, in addition to gravels with thin clays on a shallow layer at the upper rear part. The gradient of the slope is approximately 45°. The surface displacement monitoring indicates progressive toppling of the upper part (980–1,180 m a.s.m.l.) at an annual displacement rate of 21 mm/yr. The damaged lower part (
Data
As illustrated in Figure 2A, two observational huts (T01 and T02) were located
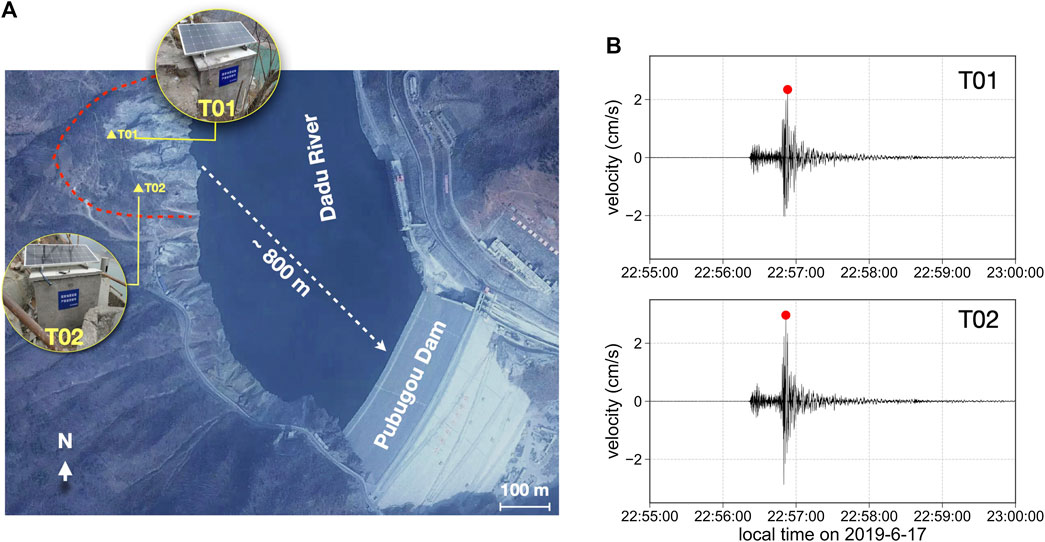
FIGURE 2. (A) Configuration of two seismic stations (yellow triangles) on the slope (the boundary of the slope is delineated by a red dashed line). (B) Peak ground velocity (red circles) due to the Changning Mw 5.7 earthquake recorded for its vertical component by the two stations T01 and T02 on the slope.
A bi-frequency global positioning system (GPS) receptor (GMX902, Leica™) was installed on the roof of each hut, together with a GPS antenna at each hut, to measure the surface deformation along the central part of the slope since April 24, 2019. The hourly global navigation system satellite (GNSS) measurements were transformed into daily values by averaging over every 24 h. Daily rainfall data were gathered from a weather station on the east bank of the rock slope.
On June 17, 2019, an Mw 5.7 earthquake occurred in Changning county, a region of Sichuan Province in southwest China. Despite the distance between the rock slope and the epicenter of the earthquake being
Method
The hourly ambient seismic noise was pre-processed at each seismometer following a standard routine procedure (Larose et al., 2015): the hourly seismic noise was first normalized in the frequency domain between 2 and 20 Hz using the whitening method and then normalized in the time domain using the clipping method with amplitudes exceeding three standard deviations. The purpose of the above steps was to enhance the specific frequency band of the ambient noise and also reduce the impact of spatially isolated noise sources such as earthquakes. Finally, the vertical components of the pre-processed noise values between the seismometers were cross-correlated for each hour with a 15 s time lag. As the cross-correlation functions were asymmetric, due to the anisotropy of the noise propagation direction, the causal and acausal parts of the cross-correlation functions were further averaged.
Figure 3B illustrates the 384 hourly correlograms
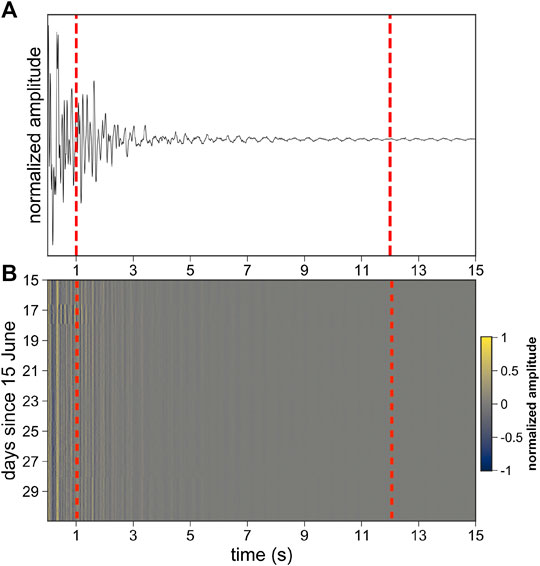
FIGURE 3. (A) Reference trace averaged over all the correlograms. (B) Hourly correlograms from June 15 to June 30, 2019, in the 2–20 Hz frequency range. Vertical red dash lines mark the time window (1–12 s) of the coda used to estimate
To understand how changes in seismic velocities can be measured from phase shifts in the correlograms, consider a ray that travels a distance L between two seismometers in time t at velocity v. These quantities are related via
Taking the differential of L,
For a homogeneous velocity change, the ray path does not change (
The change in arrival time scales linearly with lag time, resulting in stretching or compression of the waveform following a decrease or an increase, respectively. Thus, to quantify the temporal changes, the
The apparent velocity changes
where T is the inverse of the frequency bandwidth and
Results
Co-Seismic Change
A time window from 1 to 12 s was used (Figure 3) to measure the in-situ global temporal change using scattered coda waves. Figure 4A illustrates the general evolution of the apparent velocity change together with its color-coded uncertainty as a function of time during the period of interest from June 15 to June 30. The uncertainty (
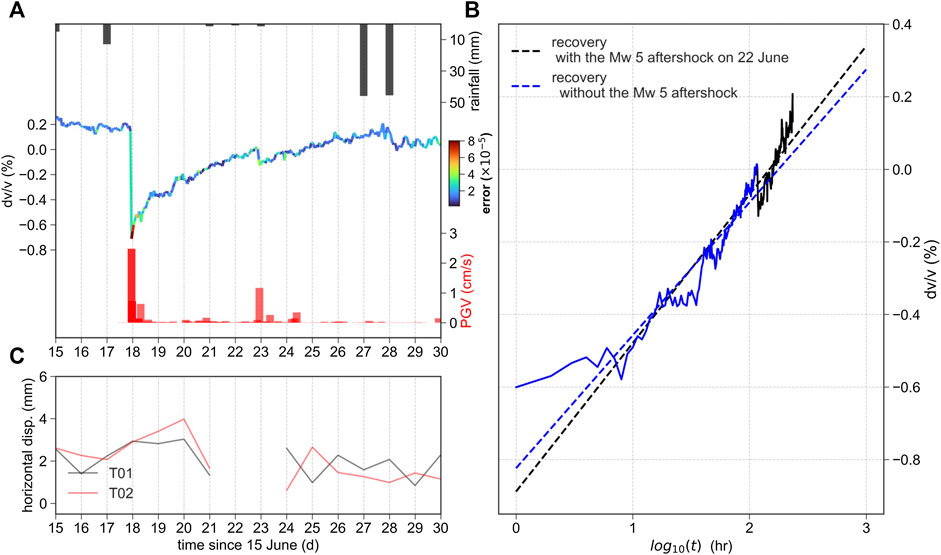
FIGURE 4. (A)
We observe a rapid co-seismic velocity drop by
where G is the bulk modulus and
The seismologists (Peng et al., 2010; Gonzalez-Huizar et al., 2012) have reported that even though the earthquake generating PGV remains as low as millimeters per second at a distance of thousand kilometers, the induced stress loading still exists at least 10,000 Pa and has the potential to remotely trigger seismicity. Therefore, such a strong but sudden decease in velocity cannot be influenced by the undrained loading effect due to the groundwater-induced liquefaction of the slope (Lecocq et al., 2017), or by the thermal loading effect due to the air temperate change (Tsai, 2011). The only possible mechanism is attributed to the opening of new or pre-existing cracks/fractures on the slope which decrease the elastic modulus due to the stress loading of earthquake shaking (Bontemps et al., 2020). We interpret that the observed co-seismic velocity drop is caused by the weakness of the slope due to the earthquake-induced dynamic stress transient.
Post-Seismic Change
Almost immediately after the co-seismic velocity drop, a clear logarithmic recovery of the velocity change to the pre-earthquake state is observed over approximately 14 days. Such a healing increase back toward its initial value following a logarithmic evolution after moderate solicitation is referred to as “slow dynamics” (TenCate, 2011).
Slow dynamics is a nonlinear elastic response of the material after imposing a strain of moderate amplitude that does not generate any macroscopic damage and has been found to be universal in granular solids of various compositions ranging from that of the Earth’s crust to the inter-grained microscopic cracks of sedimentary rocks or concrete samples of the order of micrometers (TenCate et al., 2000). Hence, we interpret this recovery phase as a nonlinear response to the re-compaction of the opened fractures and micro-cracks due to seismic shaking. Note there was an earthquake sequence that began with an Mw 5.7 earthquake on June 17 and comprised
In addition, a small velocity fluctuation was observed at the end of the recovery phase. It was noted that such velocity fluctuations occurred after 2 days of precipitations with a total of
To quantify the healing process, the logarithmic evolution of
where d is the recovery time in hours, A is the extrapolated
Figure 4B shows the estimation of these parameters with (June 18–27) and without (June 18–22) the Mw 5 aftershock on June 22. The characterized recovery times (
This suggests that the rigidity of the slope experiences a faster recovery process with the effect of additional small seismic event(s). It also implies that even seismic shaking with its PGV value as low as 1 cm/s can accelerate the healing recovery processes by altering the slope’s weakness. A possible mechanism for this effect is the re-arranging of existing grains/cracks that favor the closing of opened earthquake-generated micro/macro-fractures (Bontemps et al., 2020).
It is worth noting that compared with ambient noise interferometry, the horizontal displacement (Figure 4C) measured at each seismometer site did not show significant co-seismic and post-seismic effects. One reason is that due to low temporal resolution (1 day) of the GNSS measurements, it was hard to track sudden earthquake-induced changes over such a short time. However, such measurements hardly reveal small changes of mechanical properties of the material because they are less sensitive to the state of stress, rigidity, or damage due to their surface measurement configuration.
Different Times in the Coda
The changes are assumed to be in a spatially global homogeneous medium (Snieder, 2006). Thus, velocity change is proportional to a time shift in the later arriving coda waves. However, as a strong heterogeneous material, velocity change in the rock slope is not global, but is influenced by the time in the coda with respect to the sampled domain. Therefore, instead of analyzing a long coda segment as in the previous section, the stretching technique is applied to a series of sliding windows of 3 s in the coda, with the window width corresponding to six periods of applied lowest frequency (2 Hz).
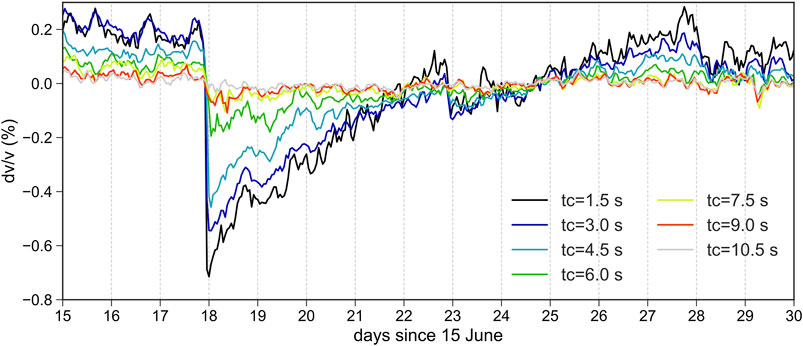
Figure 5 illustrates the velocity changes within seven consecutive shorter time windows centered around
As the early coda waves are mostly sensitive to the changes at shallow depths, as well as the weaker bonds between the elements of the weathered tuff rocks, we suggest that earthquake-induced strong ground motion can introduce more opening cracks/fractures, which is the signature of mechanical damage in the form of crack appearance, at a shallow depth of the higher-weathered rock material in the slope.
It is worth noting that the sensitivity to absolute depth requires detailed measurements of the scattering properties of the slope, which are not available for the study area. Nevertheless, the relative depth resolution of coda waves measured at different time lapses of the coda using existing theoretical and numerical testing can be discussed.
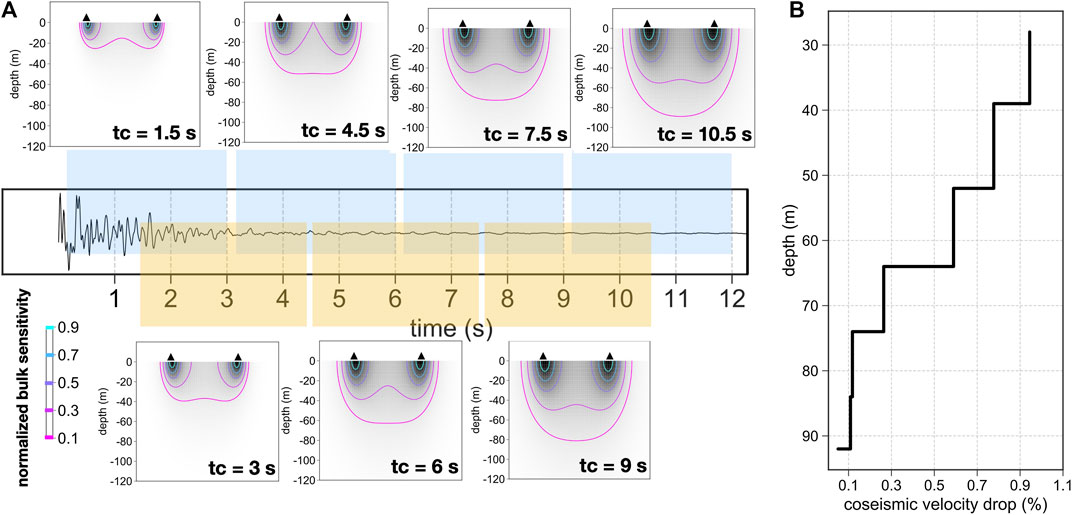
FIGURE 6. (A) Numerical modeling of the depth resolution of coda waves measured at different time lapses of the coda. (B) Kernel depth sensitivity values greater than 10% as a function of measured co-seismic velocity reduction at each lapse time.
Discussion
The in-situ apparent velocity evolution on the rock slope due to moderate earthquake shaking raises at least two questions. First, what is the depth sensitivity of the measurements? Second, why is the slow dynamics effect due to earthquake shaking related to the damage features?
To answer the first question, we estimate that the first-order depth resolution for the velocity decrease is due to earthquake. Although the depth sensitivity of coda waves has not yet been fully solved (Obermann and Hillers, 2019), as the study area is neither a layered medium nor a completely solid rock material, we thus evaluate the bulk sensitivity of the scattered coda waves by considering a two-dimensional body wave sensitivity kernel formulation (Obermann and Hillers, 2019):
where s and r are the positions of the stations,
where
With an empirical scattering mean free path of
Figure 6B plots the normalized depth sensitivities with values greater than 10% as a function of measured co-seismic velocity reduction at each lapse time. Figure 6B shows that the
For the second question, due to their direct sensitivity to the higher-order elastic properties of materials, scattered coda waves are more sensitive to the nonlinear elastic response of the material than direct waves (Xie et al., 2018). Compared with nondestructive testing techniques based on common elastic waves, the emerging methods based on coda waves have shown great promise in terms of being more accurate and sensitive in detecting the initiation of damage in various solid materials as early as possible (Xie et al., 2019). As a particularly attractive nonlinear elastic effect, time-logarithmic recovery (slow dynamics) back to the unperturbed elastic modulus following a sharp drop in the elastic modulus (fast dynamics) has been reported in response to moderate mechanical solicitation. Such nonlinear responses were first probed with nonlinear resonant ultrasound spectroscopy and can now be monitored efficiently via velocity changes from coda wave interferometry at various scales (Tremblay et al., 2010).
As far as earthquake-triggered landslides are concerned, some studies have suggested that in contrast to the post-seismic recovery during the dry season, rainfall-produced fluid activities disturbed the post-seismic relaxation process causing a slower recovery time (Bontemps et al., 2020). Laboratory studies have also suggested that the characterized recovery times are dependent on the damage of the medium (Tremblay et al., 2010).
In addition, in contrast to seismometer’s record, daily GNSS has been applied comprehensively to measure subtle surface mass deformation at a high confidence level of millimeter scale with 24-h static data. It is presumed that the deformation continuously accumulates from months to years, where the GNSS suffices in such high precision level. Nevertheless, there are indeed strong-motion scenarios with rapid deformation (e.g., storm surge loading, pre-eruption volcanic unrest, and earthquakes), which require epoch-wise GPS displacements to capture motions on a wide sub-daily timescale from seconds to hours. However, high-rate GPS solutions to detect sub-daily deformations in a reliable manner are still of great challenges as the magnitudes of such signals are usually close to the lower bound of GNSS carrier-phase measurement precision (Bilich et al. (2008); Geng et al. (2017)). Therefore, so far, it is hard for current GNSS techniques to reveal such small changes of mechanical properties of the rock slope due to their low sensitivity.
To summarize, from scientific point of view, this work quantitatively characterizes the weak but solid dynamic loading effect due to a distant earthquake and subsequent time-dependent recovery process in terms of elastic change using ambient noise interferometry. It is the first time to reveal such physical process inside the rock slope at such highly temporal (1-h) and stress-sensitive (
Conclusions
This study has applied in-situ ambient noise interferometry to two seismic stations installed on a slope and has measured coda wave velocity changes at frequencies between 2 and 20 Hz with a 1-h temporal resolution, 2 days before and 14 days after an earthquake. The findings are as follows:
Co-seismic wave velocity decreases caused by the Changning earthquake of up to
By analyzing the co-seismic and post-seismic
It may be possible to quantitatively characterize slope weakness using moderate earthquakes in mountainous areas in the future.
Data Availability Statement
The datasets for this study can be obtained from the repository on Figshare: https://figshare.com/articles/dataset/Monitoring_in-situ_seismic_response_on_rock_slope_with_ambient_noise_interferometry_Application_to_the_2019_Changning_Mw_5_7_Earthquake_China/13530911.
Author Contributions
HH and FX designed the experiments, analyzed the results, and wrote the paper. SD collected the earthquake catalogue and processed the data acquired. All authors contributed to the manuscript revision.
Funding
FX acknowledges funding from the Central Research Institutes of Basic Research and Public Service Special Operations (Grant No. DQJB19B24) and the National Science Foundation of China (Grant No. NSFC41874061).
Conflict of Interest
Author, HH, is employed by the Dadu River Hydropower Development Co., Ltd. The remaining authors declare that the research was conducted in the absence of any commercial or financial relationships that could be construed as a potential conflict of interest..
Acknowledgments
The authors are grateful to the Editor Chong Xu and three anonymous reviewers for comments and suggestions that significantly improved this manuscript. They also thank the Editor Chong Xu for his efforts on modification of the figures. They thank Sichuan Luopin Science and Technology Company for supporting seismometers, data acquisition system, and maintenance service.
References
Bilich, A., Cassidy, J. F., and Larson, K. M. (2008). Gps seismology: application to the 2002 mw 7.9 denali fault earthquake. Bull. Seismol. Soc. Am. 98 (2), 593–606. doi:10.1785/0120070096
Bontemps, N., Lacroix, P., Larose, E., Jara, J., and Taipe, E. (2020). Rain and small earthquakes maintain a slow-moving landslide in a persistent critical state. Nat. Commun. 11, 1–10. doi:10.1038/s41467-020-14445-3
Brenguier, F., Campillo, M., Hadziioannou, C., Shapiro, N. M., Nadeau, R. M., and Larose, E. (2008). Postseismic relaxation along the san andreas fault at parkfield from continuous seismological observations. Science 321, 1478–1481. doi:10.1126/science.1160943
Chigira, M., Wu, X., Inokuchi, T., and Wang, G. (2010). Landslides induced by the 2008 wenchuan earthquake, sichuan, China. Geomorphology 118 (3-4), 225–238. doi:10.1016/j.geomorph.2010.01.003
Colombero, C., Baillet, L., Comina, C., Jongmans, D., and Vinciguerra, S. (2017). Characterization of the 3-d fracture setting of an unstable rock mass: from surface and seismic investigations to numerical modeling. J. Geophys. Res.: Solid Earth 122 (8), 6346–6366. doi:10.1002/2017jb014111
Geng, J., Jiang, P., and Liu, J. (2017). Integrating gps with glonass for high-rate seismogeodesy. Geophys. Res. Lett. 44 (7), 3139–3146. doi:10.1002/2017gl072808
Gonzalez-Huizar, H., Velasco, A. A., Peng, Z., and Castro, R. R. (2012). Remote triggered seismicity caused by the 2011, m9. 0 tohoku-oki, Japan earthquake. Geophys. Res. Lett. 39 (10), doi:10.1029/2012gl051015
Guzzetti, F., Peruccacci, S., Rossi, M., and Stark, C. P. (2008). The rainfall intensity–duration control of shallow landslides and debris flows: an update. Landslides 5 (1), 3–17. doi:10.1007/s10346-007-0112-1
Hill, D. P., Reasenberg, P. A., Michael, A., Arabaz, W. J., Beroza, G., Brumbaugh, D., et al. (1993). Seismicity remotely triggered by the magnitude 7.3 landers, California, earthquake. Science 260, 1617–1623. doi:10.1126/science.260.5114.1617
Keefer, D. K. (1984). Landslides caused by earthquakes. Geol. Soc. Am. Bull. 95 (4), 406–421. doi:10.1130/0016-7606(1984)95<406:lcbe>2.0.co;2
Keefer, D. K. (2002). Investigating landslides caused by earthquakes – a historical review. Surv. Geophys. 23, 473–510. doi:10.1023/A:1021274710840
Larose, E., Montaldo, G., Derode, A., and Campillo, M. (2006). Passive imaging of localized reflectors and interfaces in open media. Appl. Phys. Lett. 88 (10), 104103. doi:10.1063/1.2186112
Larose, E., Carrière, S., Voisin, C., Bottelin, P., Baillet, L., Guéguen, P., et al. (2015). Environmental seismology: what can we learn on earth surface processes with ambient noise?. J. Appl. Geophys. 116, 62–74. doi:10.1016/j.jappgeo.2015.02.001
Lecocq, T., Longuevergne, L., Pedersen, H. A., Brenguier, F., and Stammler, K. (2017). Monitoring ground water storage at mesoscale using seismic noise: 30 years of continuous observation and thermo-elastic and hydrological modeling. Sci. Rep. 7, 14241–16. doi:10.1038/s41598-017-14468-9
Lin, Q., and Wang, Y. (2018). Spatial and temporal analysis of a fatal landslide inventory in China from 1950 to 2016. Landslides 15 (12), 2357–2372. doi:10.1007/s10346-018-1037-6
Mainsant, G., Larose, E., Brönnimann, C., Jongmans, D., Michoud, C., and Jaboyedoff, M. (2012). Ambient seismic noise monitoring of a clay landslide: toward failure prediction. J. Geophys. Res.: Earth Surface 117 (F1), doi:10.1029/2011JF002159
Obermann, A., and Hillers, G. (2019). Seismic time-lapse interferometry across scales, in Advances in geophysics, 60. (Amsterdam, Netherlands; Elsevier), 65–143. doi:10.1016/bs.agph.2019.06.001
Peng, Z., Hill, D. P., Shelly, D. R., and Aiken, C. (2010). Remotely triggered microearthquakes and tremor in central California following the 2010 mw 8.8 Chile earthquake. Geophys. Res. Lett. 37 (24), doi:10.1029/2010gl045462
Snieder, R. (2006). The theory of coda wave interferometry. Pure Appl. Geophys. 163 (2-3), 455–473. doi:10.1007/s00024-005-0026-6
TenCate, J. A., Smith, E., and Guyer, R. A. (2000). Universal slow dynamics in granular solids. Phys. Rev. Lett. 85, 1020. doi:10.1103/PhysRevLett.85.1020
TenCate, J. A. (2011). Slow dynamics of earth materials: an experimental overview. Pure Appl. Geophys. 168 (12), 2211–2219. doi:10.1007/s00024-011-0268-4
Tremblay, N., Larose, E., and Rossetto, V. (2010). Probing slow dynamics of consolidated granular multicomposite materials by diffuse acoustic wave spectroscopy. J. Acoust. Soc. Am. 127, 1239–1243. doi:10.1121/1.3294553
Tsai, V. C. (2011). A model for seasonal changes in gps positions and seismic wave speeds due to thermoelastic and hydrologic variations. J. Geophys. Res.: Solid Earth 116 (B4). doi:10.1029/2010jb008156
Weaver, R. L., Hadziioannou, C., Larose, E., and Campillo, M. (2011). On the precision of noise correlation interferometry. Geophys. J. Int. 185 (3), 1384–1392. doi:10.1111/j.1365-246x.2011.05015.x
Xie, F., Larose, E., Moreau, L., Zhang, Y., and Planes, T. (2018). Characterizing extended changes in multiple scattering media using coda wave decorrelation: numerical simulations. Waves Random Complex Media 28 (1), 1–14. doi:10.1080/17455030.2017.1308042
Xie, F., Li, W., and Zhang, Y. (2019). Monitoring of environmental loading effect on the steel with different plastic deformation by diffuse ultrasound. Structural Health Monitoring-an International Journal 18 (2), 602–609. doi:10.1177/1475921718762323
Keywords: seismic noise, rock slope, seismicity, slow dynamics, velocity change
Citation: Huang H, Dai S and Xie F (2021) Monitoring In-Situ Seismic Response on Rock Slopes Using Ambient Noise Interferometry: Application to the 2019 Changning (Mw 5.7) Earthquake, China. Front. Earth Sci. 8:610181. doi: 10.3389/feart.2020.610181
Received: 25 September 2020; Accepted: 12 November 2020;
Published: 14 January 2021.
Edited by:
Chong Xu, National Institute of Natural Hazards, ChinaCopyright © 2021 Huang, Dai and Xie. This is an open-access article distributed under the terms of the Creative Commons Attribution License (CC BY). The use, distribution or reproduction in other forums is permitted, provided the original author(s) and the copyright owner(s) are credited and that the original publication in this journal is cited, in accordance with accepted academic practice. No use, distribution or reproduction is permitted which does not comply with these terms.
*Correspondence: Fan Xie, eGllZmFuQGNlYS1pZ3AuYWMuY24=
 Huibao Huang1,2
 Fan Xie