 Jinhua Li1,2,3,4*
 Yan Liu1,2,3,4
 Shuangchi Liu1,4
 Andrew Philip Roberts5Hongmiao Pan3,6
 Tian Xiao3,6
 Yongxin Pan1,2,3,4
- 1Key Laboratory of Earth and Planetary Physics, Institute of Geology and Geophysics, Innovation Academy for Earth Sciences, Chinese Academy of Sciences, Beijing, China
- 2Laboratory for Marine Geology, Qingdao National Laboratory for Marine Science and Technology, Qingdao, China
- 3International Associated Laboratory of Evolution and Development of Magnetotactic Multicellular Organisms (LIA-MagMC), CNRS-CAS, Beijing, China
- 4College of Earth and Planetary Sciences, University of Chinese Academy of Sciences, Beijing, China
- 5Research School of Earth Sciences, Australian National University, Canberra, ACT, Australia
- 6Key Laboratory of Marine Ecology and Environmental Sciences, Institute of Oceanology, Chinese Academy of Sciences, Qingdao, China
Unambiguous magnetic mineral identification in sediments is a prerequisite for reconstructing paleomagnetic and paleoenvironmental information from environmental magnetic parameters. We studied a deep-sea surface sediment sample from the Clarion Fracture Zone region, central Pacific Ocean, by combining magnetic measurements and scanning and transmission electron microscopic analyses. Eight titanomagnetite and magnetite particle types are recognized based on comprehensive documentation of crystal morphology, size, spatial arrangements, and compositions, which are indicative of their corresponding origins. Type-1 particles are detrital titanomagnetites with micron- and submicron sizes and irregular and angular shapes. Type-2 and -3 particles are well-defined octahedral titanomagnetites with submicron and nanometer sizes, respectively, which are likely related to local hydrothermal and volcanic activity. Type-4 particles are nanometer-sized titanomagnetites hosted within silicates, while type-5 particles are typical dendrite-like titanomagnetites that likely resulted from exsolution within host silicates. Type-6 particles are single domain magnetite magnetofossils related to local magnetotactic bacterial activity. Type-7 particles are superparamagnetic magnetite aggregates, while Type-8 particles are defect-rich single crystals composed of many small regions. Electron microscopy and supervised magnetic unmixing reveal that type-1 to -5 titanomagnetite and magnetite particles are the dominant magnetic minerals. In contrast, the magnetic contribution of magnetite magnetofossils appears to be small. Our work demonstrates that incorporating electron microscopic data removes much of the ambiguity associated with magnetic mineralogical interpretations in traditional rock magnetic measurements.
Introduction
Sedimentary sequences provide important geological records for understanding long-term variations of Earth's magnetic field and paleoclimate (e.g., Valet and Meynadier, 1993; Guyodo and Valet, 1999; Kissel et al., 1999; Evans and Heller, 2001; Evans and Heller, 2003; Yamazaki, 2009; Hao et al., 2012; Liu et al., 2012; Roberts et al., 2013; Kissel et al., 2020; Valet et al., 2020). Magnetic mineral identification in sediments is fundamentally important for both paleomagnetic and environmental magnetic studies because the type, concentration, size and shape of magnetic minerals control their magnetic properties, including magnetic recording quality (e.g., Dunlop and Özdemir, 1997; Dekkers, 2003; Liu et al., 2012; Chang et al., 2014a; Larrasoaña et al., 2014; Roberts et al., 2019). However, quantitative identification of individual magnetic mineral components is challenging because each component can have different origins, grain size, shape, mineralogy and stoichiometry. For example, four or five distinct magnetic mineral components are identified commonly in pelagic carbonate sediments, which might otherwise be considered to be among the simplest of magnetic mineral assemblages (e.g., Roberts et al., 2013). Quantitative identification of each magnetic mineral component and its magnetic contribution can be important in environmental and paleomagnetic studies (e.g., Ouyang et al., 2014; Chen et al., 2017).
Numerous magnetic techniques have been developed to measure the bulk magnetic properties of sediments to provide information about the concentration, domain state (a measure of magnetic grain size), and mineralogy of magnetic particles in a sample (e.g., Verosub and Roberts, 1995; Evans and Heller, 2003; Lascu et al., 2010; Liu et al., 2012; Roberts et al., 2014; Zhao et al., 2017; Roberts et al., 2019). Mathematical unmixing methods have also been developed to identify these magnetic mineral components quantitatively based on their bulk magnetic properties (e.g., Heslop, 2015). They generally involve fitting of functions to derivatives of isothermal remanent magnetization (IRM) acquisition or direct current demagnetization (DCD) curves (e.g., Robertson and France, 1994; Kruiver et al., 2001; Heslop et al., 2002; Egli, 2003, Egli, 2004a; Egli, 2004c; Heslop and Dillon, 2007; Maxbauer et al., 2016), alternating field demagnetization curves of an anhysteretic remanent magnetization or IRM (Egli and Lowrie, 2002; Egli, 2004a, Egli, 2004b, Egli, 2004c), or analysis of hysteresis loops (e.g., Roberts et al., 1995; Dunlop, 2002a, Dunlop, 2002b; Tauxe et al., 2002; Heslop and Roberts, 2012a; Heslop and Roberts, 2012b), ferromagnetic resonance (FMR) spectra (e.g., Weiss et al., 2004; Kopp et al., 2006a; Kopp et al., 2006b; Gehring et al., 2011; Kind et al., 2011; Gehring et al., 2013; Chang et al., 2014b), or first-order reversal curve (FORC) diagrams (e.g., Roberts et al., 2014; Lascu et al., 2015; Channell et al., 2016; Harrison et al., 2018; Roberts et al., 2018).
Nonuniqueness is a fundamental issue for bulk magnetic property analysis because 1) mathematical unmixing can produce an infinite number of solutions, and 2) magnetic minerals have variable magnetic properties that can overlap with those of other minerals (e.g., Liu et al., 2012). The combined presence of multiple magnetic mineral components produces a complicated relationship between the magnetic properties of magnetic minerals and their domain states, concentration, sizes, shapes and stoichiometry, which often frustrates component-specific magnetic diagnosis (e.g., Yamazaki and Ioka, 1997; Heslop, 2009; Roberts et al., 2011a; Li et al., 2012; Liu et al., 2012; Li et al., 2013a; Roberts et al., 2019). To minimize ambiguity for environmental and paleomagnetic interpretations, integration of multiple magnetic parameters and non-magnetic techniques is recommended to identify and quantify magnetic minerals in sediments (e.g., Kopp and Kirschvink, 2008; Liu et al., 2012; Chang et al., 2014b; Heslop, 2015; Roberts et al., 2019).
Transmission electron microscope (TEM) observations are among the most useful microscopic approaches because they can be used to characterize simultaneously mineralogy, stoichiometry, magnetism and crystallography of magnetic minerals at the micron and nanometer scales, even to the atomic level (e.g., Harrison et al., 2002; Galindo-Gonzalez et al., 2009; Pósfai et al., 2013; Li and Pan, 2015; Li et al., 2020). TEM and scanning electron microscope (SEM) observations have been used in environmental magnetism and paleomagnetism for many years (e.g., Evans and Wayman, 1970; Kirschvink and Chang, 1984; Harrison et al., 2002; Roberts and Weaver, 2005; Kopp and Kirschvink, 2008; Harrison and Feinberg, 2009). Most recent studies emphasize the use of TEM in testing for the presence of biogenic magnetite particles produced by magnetotactic bacteria (MTB) (magnetofossils) from sediments (e.g., Petersen et al., 1986; Stolz et al., 1986; Chang and Kirschvink, 1989; Vali and Kirschvink, 1989; Akai et al., 1991; Hesse, 1994; Snowball, 1994; Tarduno et al., 1998; Yamazaki and Kawahata, 1998; Pan et al., 2005; Housen and Moskowitz, 2006; Kopp et al., 2007; Maloof et al., 2007; Kopp and Kirschvink, 2008; Schumann et al., 2008; Kopp et al., 2009; Roberts et al., 2011b; Chang et al., 2012; Larrasoaña et al., 2012; Yamazaki and Shimono, 2013; Chang et al., 2014a; Chang et al., 2014b; Liu et al., 2015; Chang et al., 2016a; Dong et al., 2016; Chang et al., 2018; Usui et al., 2019; He and Pan, 2020; Jiang et al., 2020; Qian et al., 2020; Yamazaki et al., 2020; Yuan et al., 2020). In contrast, relatively few studies have used TEM observations to study the mineralogy and chemistry of other magnetic mineral types in sediments (e.g., Gibbs-Eggar et al., 1999; Franke et al., 2007; Chang et al., 2016b; Zhang et al., 2018; Li et al., 2019). While magnetofossils are relatively easy to recognize in TEM observations due to their distinctive crystal morphologies and chain structures compared to other magnetic mineral types (e.g., Kopp and Kirschvink, 2008; Jimenez-Lopez et al., 2010; Li et al., 2013b), this can lead to bias in overestimating their magnetic contributions, and/or to ignoring contributions from, for example, weakly interacting or noninteracting single domain (SD) magnetite particles hosted by silicates (e.g., Wang et al., 2015; Chang et al., 2016b).
We combine rock magnetic measurements with SEM and TEM observations to characterize the magnetic mineralogy of a surface sediment from the central Pacific Ocean. We show that by incorporating detailed SEM and TEM characterizations, much of the ambiguity that is inherent to magnetic mineralogy interpretations when using only rock magnetic measurements is eliminated. This approach allows evaluation of the contribution of magnetic mineral components to paleomagnetic and rock magnetic signals and/or their environmental significance.
Materials and Methods
Sample and Preparation
Surface sediment was retrieved at station XTGC1311 (158.0485,917 W, 14.44244 N; 5,260 m water depth; Figure 1) during cruise DY29–02 of R/V Haiyang Liuhao in 2013 to the Pacific Ocean (Dong et al., 2016). The station is adjacent to the Clarion Fracture Zone to the south, the Hawaiian Island Chain to the North, and Kiribati (Line Islands) to the West. The surrounding islands were formed by upper Jurassic to lower Cretaceous volcanic activity (Clouard and Bonneville, 2005). The seafloor between the Clarion Fracture Zone and the Clipperton Fracture Zone is characterized by long, north-south-trending hills, ridges, intervening valleys, and furrows (Vithana et al., 2019; Maciąg and Harff, 2020). Sediments in the area are characterized by organic carbon-starved siliceous clay (Mewes et al., 2016). Modern sedimentation at the sampled station consists of both Asian eolian dust transported by zonal westerlies and northeast trade winds and local hydrothermal and volcanic inputs (Hyeong et al., 2005; Hyeong et al., 2006; Maciąg and Harff, 2020). It is also possibly influenced by Antarctic Bottom Water (AABW), which is oxygen rich and migrates eastward and northward into this area (Deng et al., 2016; Mewes et al., 2016).
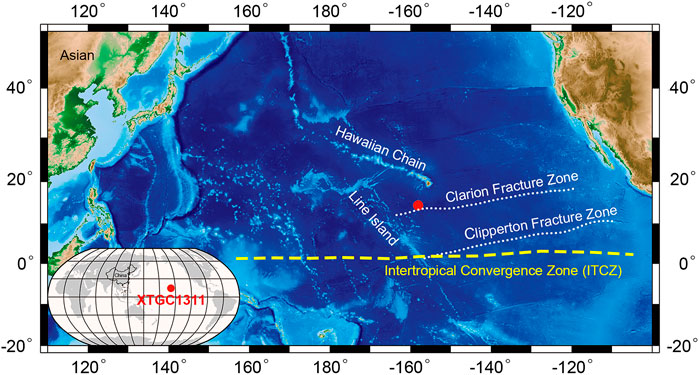
FIGURE 1. Location map with the position of sample station.
Sediment samples were collected using a gravity corer. Surface sediments were subsampled immediately on the ship from the upper 1 cm of the core (hereafter referred to as EPMNP-31) and were then stored at −20°C prior to analysis to minimize oxidation. Samples were vacuum dried at 30°C for 12 h and were then loaded into non-magnetic gelatin capsules for magnetic measurements.
For nanometer scale characterization, magnetic minerals were separated from the bulk sediment. Magnetic separation was carried out with the following procedure. First, about ∼10 mg of sediment was suspended into ∼50 ml of Milli-Q water in a ∼100 ml beaker and was then mixed by ultrasonication assisted by agitation with a glass stirring rod. Second, a 5 × 5 mm cylindrical neodymium magnet (surface field strength > 100 mT) was attached to the outside of the beaker ∼2 mm above the water-sediment surface. After ∼4 h of magnetic absorption, magnetic minerals that were concentrated adjacent to the magnet were transferred to a 10 ml glass tube. To extract as much of the magnetic mineral content from the sediment as possible, the first and second steps were repeated several times until no obvious magnetic aggregates adjacent to the magnet were found. Third, extracted magnetic minerals were resuspended in ∼5 ml of Milli-Q water in a 10 ml glass tube, mixed by ultrasonication, and then extracted magnetically again following a similar procedure as the second step above. To remove non-magnetic minerals from the extracts, the third step was repeated several times until non-magnetic particles were not observed at the bottom of the tube. The final three repeats were performed in 99.5% ethanol. Finally, extracted magnetic minerals were suspended in 50 µl of 99.5% ethanol and were stored at −20°C prior to TEM or SEM observations.
Magnetic Measurements
Low-temperature magnetic measurements were made with a Quantum Design Magnetic Property Measurement System (MPMS XP-5, 5.0 × 10⁻¹⁰ Am2 sensitivity). Zero-field-cooled (ZFC) and field-cooled (FC) curves were obtained by cooling the sample from 300 to 10 K in a zero field and in a 2.5-T field, respectively, followed by imparting a saturation IRM (SIRM) to the sample in a 2.5-T field at 10 K (hereafter SIRM10 K_2.5 T), and then by measuring SIRM10 K_2.5 T during warming back to 300 K in zero field (Moskowitz et al., 1993). For low-temperature cycling (LTC) of a room temperature SIRM obtained in a 2.5-T field at 300 K (hereafter SIRM300 K_2.5 T), remanence was measured in zero field during a cooling-warming cycle (300 → 10 → 300 K).
Room-temperature magnetic experiments were made using a Micromag Model 3,900 vibrating sample magnetometer (VSM) (Princeton Measurement Corporation; 5.0 × 10⁻¹¹ Am2 sensitivity). A hysteresis loop was measured in a 1 T maximum field with 500 ms averaging time. The saturation magnetization (Ms), saturation remanence (Mrs), and coercivity (Bc), were determined after applying a high-field (0.7–1 T) slope correction. Static IRM acquisition and DCD curves were measured on an initially demagnetized and 1 T-re-magnetized sample, respectively. The coercivity of remanence (Bcr) was determined from the DCD curve. IRM acquisition and DCD curves were measured to 1 T using a logarithmic sweep mode with 1 mT initial field and 120 measurement points. To simplify comparison of remanence results and to calculate the R-value of the Wohlfarth-Cisowski test (Cisowski, 1981), the IRM acquisition curve was normalized to the SIRM, and the DCD curve was rescaled as ½ [1 + IRM(−H)/SIRM]. To quantify contributions from different coercivity families to the total IRM, the IRM curve was decomposed into cumulative log Gaussian (CLG) curves (Robertson and France, 1994) using the software of Heslop et al. (2002). The different coercivity families are defined by their half saturation IRM (SIRM) field (B1/2) and the percentage of their contribution to the total IRM.
FORCs (Pike et al., 1999; Roberts et al., 2000) were also measured with the VSM using the protocol described by Egli et al. (2010). A total of 300 FORCs were measured with a positive saturation field of 1 T, increasing field steps of 0.976 mT, and a 600 ms averaging time. A FORC diagram was calculated using the FORCinel v3.06 software (Harrison and Feinberg, 2008) and smoothed using the VARIFORC algorithm (Egli, 2013). The horizontal (Bc) and vertical (Bi) axes on a FORC diagram indicate the microcoercivity and interaction field distribution for SD particles, respectively (Pike et al., 1999; Roberts et al., 2000).
Scanning Electron Microscope and Transmission Electron Microscope Analyses
Extracted magnetic minerals were deposited onto carbon-based, double sided adhesive tape that was mounted onto the surface of an aluminum stub for SEM observations. The sample was carbon coated prior to imaging to create a conductive layer. Extracted magnetic minerals were deposited onto carbon-coated copper grids for TEM experiments. SEM and TEM experiments were carried out with a Nova NanoSEM 450 field-emission SEM (15 kV accelerating voltage) and a JEM2100 TEM (200 kV accelerating voltage), respectively, at the Institute of Geology and Geophysics, Chinese Academy of Sciences (IGGCAS, Beijing, China). Microchemical analyses were made by Energy-dispersive X-ray spectrometry (EDXS) elemental mapping in the SEM and point analysis in the TEM.
Results
Room- and Low-Temperature Magnetic Properties
A hysteresis loop for the sample is closed at values well below ∼400 mT (Figure 2A). Stepwise SIRM acquisition and demagnetization indicate that the sample is saturated and demagnetized largely below ∼300 mT, and completely at ∼600 mT (Figure 2B). Hysteresis parameters after high-field slope correction are Bc = 20.6 mT, Bcr = 44.9 mT, Bcr/Bc = 2.18, and Mrs/Ms = 0.28. Normalized IRM acquisition and DCD curves are roughly symmetric with a calculated R-value of 0.45 for the Wohlfarth-Cisowski test (Cisowski, 1981).
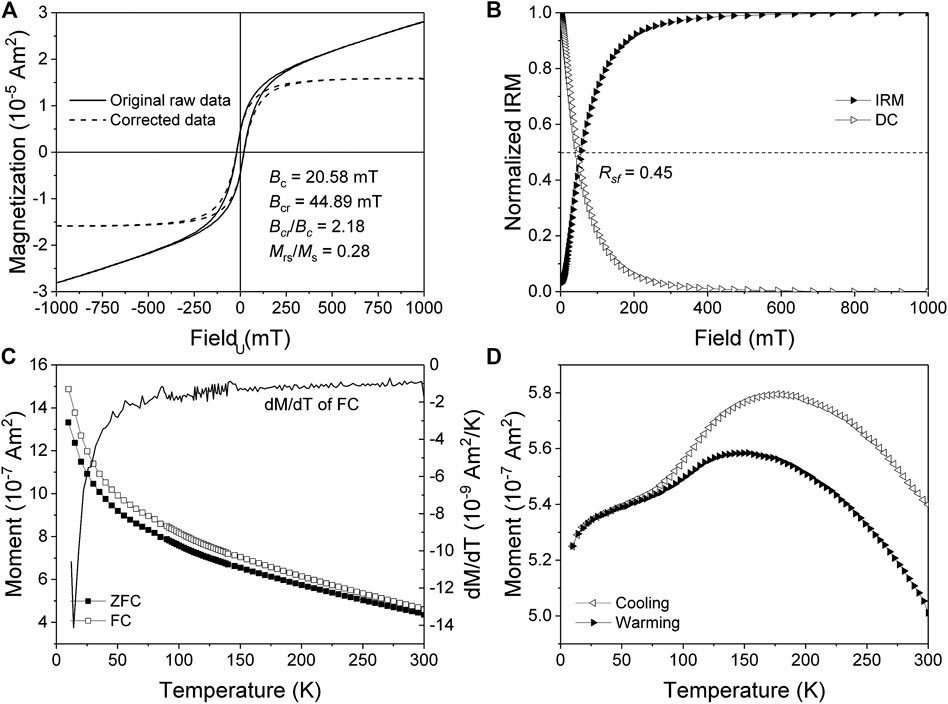
FIGURE 2. (A) Room-temperature hysteresis loop (solid and dashed lines are the original raw and high-field slope-corrected data, respectively. (B) Normalized IRM acquisition and DCD curves. (C) FC-SIRM10 K_2.5 T and ZFC-SIRM10 K_2.5 T warming curves. (D) SIRM300 K_2.5 T cooling-warming cycle curves.
Both ZFC and FC SIRM10 K_2.5 T curves decrease gradually during warming from 10 to 300 K (Figure 2C). The LTC curve is humped. The SIRM300 K_2.5 T cooling curve increases gradually from 300 to ∼176 K and then decreases gradually to 10 K. The warming curve overlaps with the cooling curve below ∼50 K, and then increases slowly to 153 K, and finally decreases gradually to 300 K. The SIRM300 K_2.5 T cooling-warming curves are roughly reversible with a ∼6% remanence loss after cycling (Figure 2D). The Verwey transition, which is characterized by an obvious remanence drop at ∼100–120 K, is not clearly present in the ZFC/FC warming and LTC curves. This indicates that magnetite particles in this sample are nonstoichiometric, either due to surface oxidation or cation substitution (e.g., Muxworthy and McClelland, 2000; Özdemir and Dunlop, 2010).
First-Order Reversal Curve Results
FORC measurements provide information about all magnetic particles in a sample in terms of their magnetization (magnitude), microcoercivity (horizontal distribution) and magnetic interaction field for SD particles (vertical distribution) (Pike et al., 1999; Roberts et al., 2000; Roberts et al., 2014). The FORC diagram in Figure 3 indicates the presence of non-interacting SD (Newell, 2005; Egli et al., 2010; Roberts et al., 2014), vortex state (Pike and Fernandez, 1999; Muxworthy and Dunlop, 2002; Roberts et al., 2017) and viscous particles near the superparamagnetic (SP)/SD threshold size (Pike et al., 2001). The non-interacting SD contribution produces a central ridge signal that can be extracted (Figure 3B) following Egli et al. (2010) and separated into three components along a horizontal profile at Bi = 0 mT (Figure 3D). The three SD components have peak coercivities of ∼20.4, ∼76.8, and 126.1 mT. The remaining FORC distribution after central ridge extraction has a tri-lobate shape (Figure 3C) associated with the vortex state (Lascu et al., 2018). The upper lobe intersects the vertical axis at higher values (Bi = ∼50 mT) than the lower lobe, which intersects the vertical axis closer to the origin. The middle lobe is narrower and extends along the horizontal axis to Bc = ∼140 mT (Figure 3C). A narrow FORC distribution along the lower vertical axis is related to viscous magnetic particles near the SP/SD threshold size (Figures 3A,C) (Pike et al., 2001; Roberts et al., 2014).
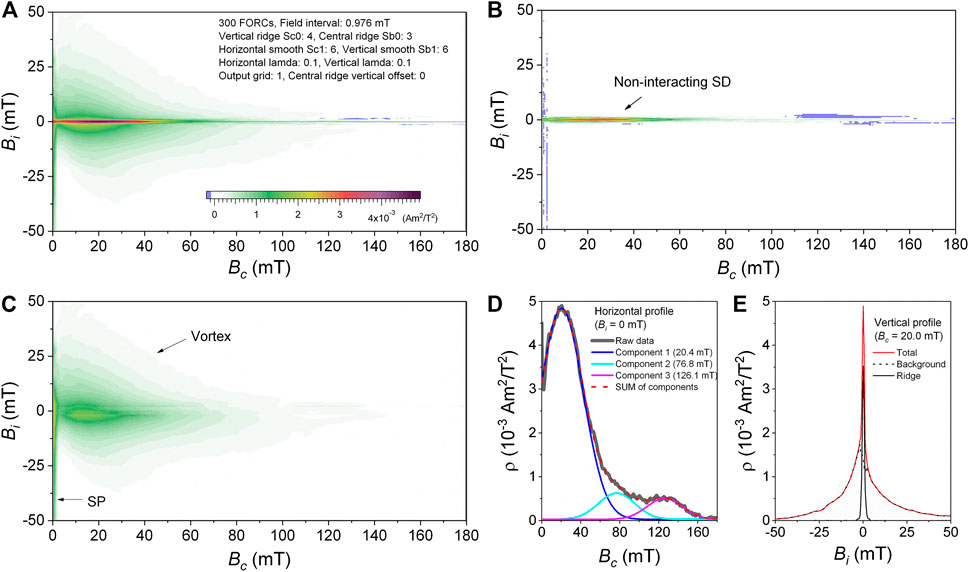
FIGURE 3. First-order reversal curve (FORC) results. (A) FORC diagram. (B) Central ridge component extracted from the FORC diagram. (C) Background FORC component after removal of the central ridge. (D) Horizontal profile ρ(Bc) of the FORC function (coercivity distribution at Bi = 0 mT). The black line indicates raw data, while blue, cyan and purple lines indicate three components decomposed from the raw data. The dashed red line indicates a sum of all three Gaussian components. (E) Vertical profiles ρ(Bi) of the FORC function (magnetostatic-interaction field distribution) at 20 mT: the central ridge component (black), the background component with vertical spread (dashed black line), and the total of the two components (red line) are shown.
Scanning Electron Microscope Analyses of Magnetic Minerals
SEM observations combined with EDXS elemental mapping reveal the overall microscale morphology and composition of sedimentary magnetic minerals. Minerals can be distinguished readily by combining analysis of particle morphologies and corresponding backscattered electron contrast and chemical composition (Figure 4; Supplementary Material S1). Most particles with dark contrast generally consist of Si, O and Fe (and/or Mn), which indicates that they are Fe/Mn silicates. In contrast, particles with bright contrast are often composed of Fe and O, some of which also contain Ti. They are titanomagnetite (with variable Ti contents) or magnetite, as confirmed by TEM analyses (see below). The particles are morphologically diverse with sizes ranging from tens of nm to tens of µm.
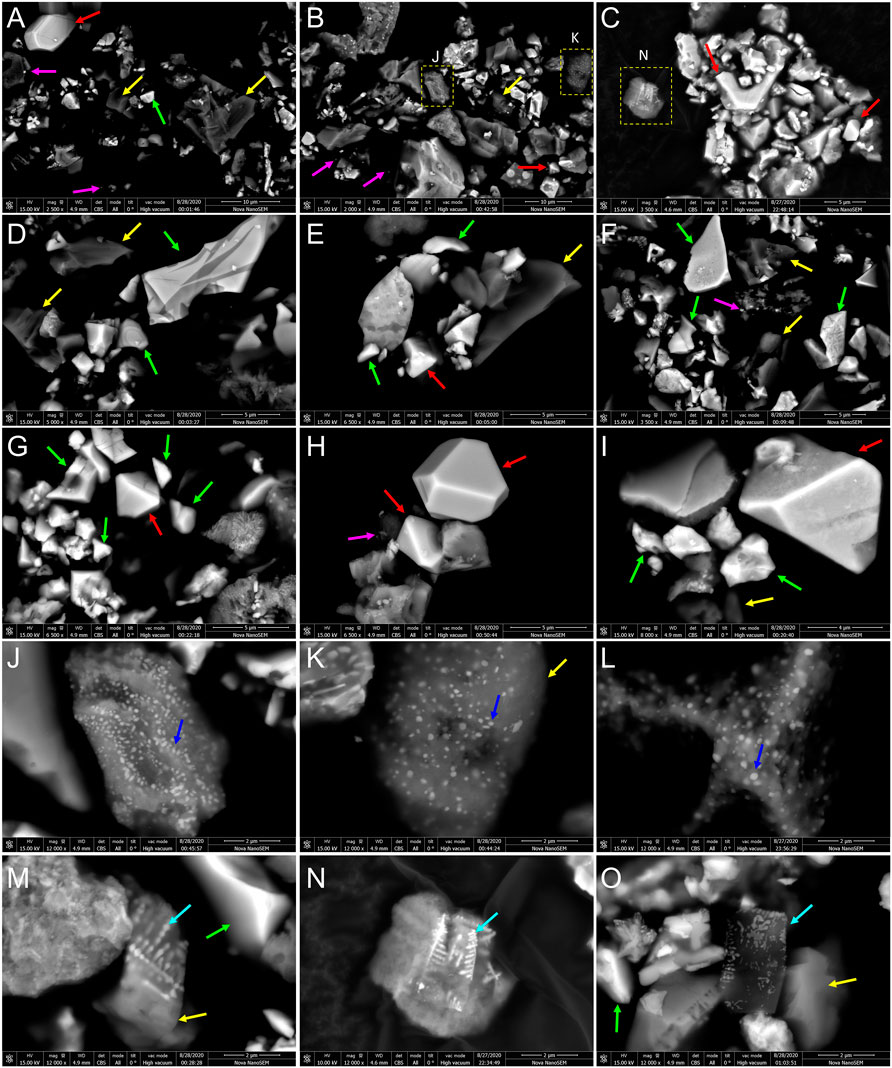
FIGURE 4. Backscattered SEM images of magnetic mineral extracts. Fe-Mn silicate particles (yellow arrows), angular titanomagnetite particles (green arrows), octahedral or truncated octahedral titanomagnetite particles (red arrows), silicate-hosted magnetite particles (blue arrows), silicate-hosted dendritic magnetite particles (cyan arrows), and individual nanometer-sized magnetite particles (purple arrows) are recognized from SEM morphological observations and SEM-EDXS elemental mapping (Supplementary Material S1).
SEM observations reveal well-defined and uncorroded octahedral (Figures 4G,I), truncated octahedral (Figure 4H) and irregular and angular shapes for micron- and submicron magnetite particles (Figures 4A–I). Most nanometric magnetite particles are hosted within silicates (Figures 4J–O); a few are isolated or attached onto other particles (Figures 4A–4F). Two silicate-hosted titanomagnetite inclusion types are identified: randomly oriented, dispersed particles (Figure 4J–L) and dendritic particles (Figures 4M–O). Compared to the micron-sized titanomagnetite particles, the morphology and stoichiometry of these nanometric magnetite particles are difficult to characterize with SEM imaging and SEM-EDXS elemental mapping because of the ∼1 nm spatial resolution limit.
Transmission Electron Microscope Analyses of Magnetic Minerals
Systematic TEM and high-resolution TEM (HRTEM) observations were made on different magnetic particle types to identify their mineralogy and stoichiometry. Representative particles were further studied by selected area electron diffraction (SAED) and TEM-EDXS point analyses. Eight magnetic particle types were identified based on crystal morphology, size, composition and spatial arrangement (Figures 5–9).
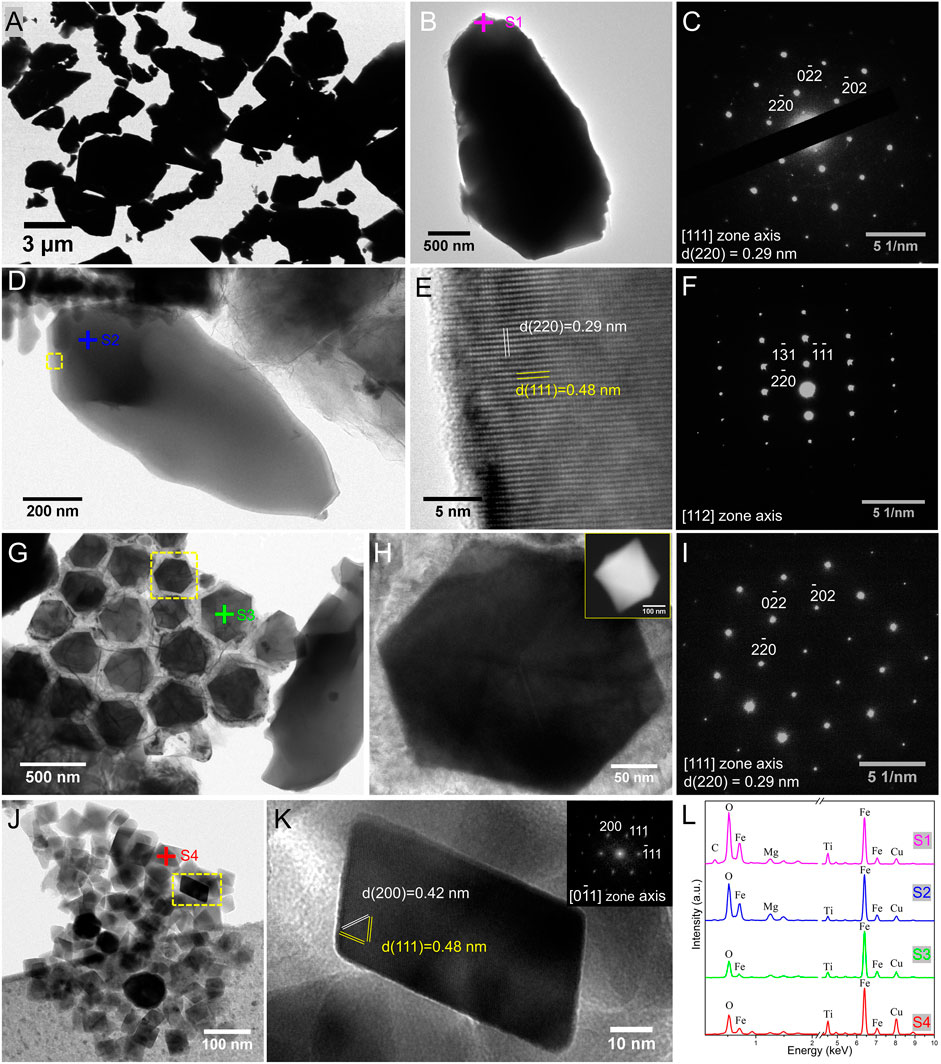
FIGURE 5. TEM analyses of (A–F) Type-1, (G–I) Type-2, and (J–K) Type-3 magnetite particles. (A) Low-magnification TEM image of many micron-sized titanomagnetite particles. (B) TEM image of an individual titanomagnetite particle. (C) SAED pattern recorded from the [111] zone axis of the particle in (B). (D) TEM image of an individual magnetite particle. (E) HRTEM image of a thin edge region of the particle in (D) (yellow dashed box). (F) SAED pattern recorded from the [112] zone axis of the particle in (D). (G) TEM image of many octahedral magnetite particles [367.8 ± 44.9 nm average size (n = 18)]. (H) TEM image of a single octahedral magnetite particle recorded from the [111] zone axis [yellow dashed box in (G)]. The inset SEM image demonstrates an octahedral morphology. (I) SAED pattern of the particle in (H) recorded from the [111] zone axis of magnetite. (J) TEM image of many nanometer titanomagnetite particles. (K) HRTEM image of a single magnetite particle [yellow dashed box in (J)] recorded from the [0
Type-1 and type-2 particles are micron-or submicron-sized and generally occur as loose aggregates (Figures 5A,D) or isolated particles (Figure 5B). They are too thick to image lattice fringes directly by HRTEM. We generally tilted the sample stage to allow the incident electron beam to pass through large particles along a certain zone axis, and then selected thinner edge areas for HRTEM, SAED and TEM-EDXS point analyses. As shown in Figures 5A–F, TEM observations from one zone axis combined with SAED analyses on individual Type-1 particles reveal that they consist mainly of micron or submicron angular titanomagnetite (Figures 5A,B,D), with Type-2 particles consisting of well-defined octahedral magnetite (Figures 5G,H). Type-3 aggregates tend to consist of randomly organized nanometric titanomagnetite particles. HRTEM observations combined with corresponding Fast Fourier Transform (FFT) analyses reveal that these particles are elongated octahedral magnetite with average length of 52.9 ± 10.9 nm, width of 43.9 ± 9.2 nm and aspect ratio (length/width) of 1.22 ± 0.18 (n = 30). TEM-EDXS point analyses reveal that Type-1 to Type-3 particles are titanomagnetite with variable Ti contents.
In contrast to Type-1 to Type-3 titanomagnetite, Type-4 and Type-5 magnetic particles are hosted within silicates (Figures 6 and 7). No preferred particle orientations are observed for the morphologically diverse Type-4 particles, which have sizes ranging from a few to several hundred nanometers. Some particles appear to have rounded or irregular 2D-projections in which crystal faces are difficult to define even from HRTEM lattice images (Figures 6A–D). In contrast, other particles likely have euhedral octahedral or cubo-octahedral shapes (Figures 6E–N). Type-5 particles are typical dendrite-like self-assembled magnetic nanoparticles (Figure 7). Combined HRTEM, SAED and TEM-EDXS point analyses reveal that these silicate-hosted nanometer-sized particles are titanomagnetite with variable Ti contents (Figures 6 and 7).
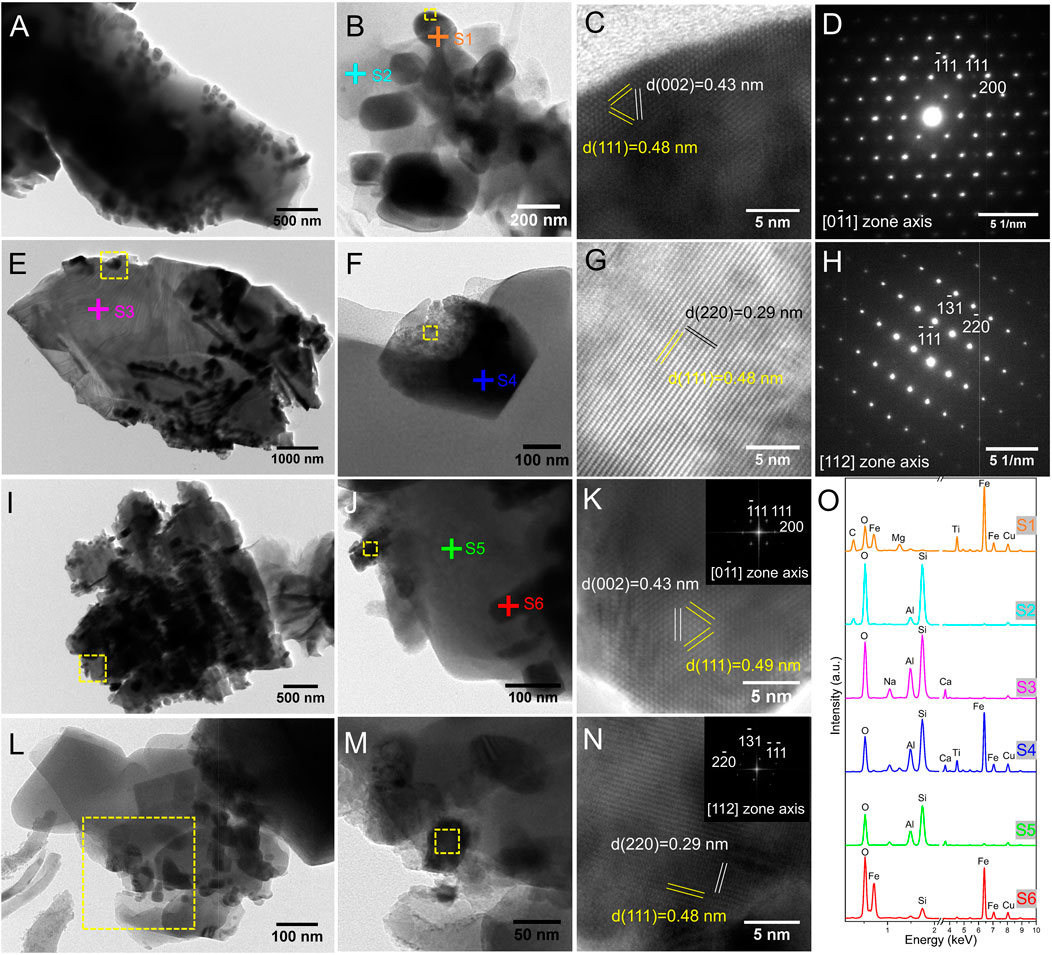
FIGURE 6. TEM analyses of Type-4 magnetite inclusions hosted within silicates. (A) TEM image of a silicate particle hosting many dispersed titanomagnetite or magnetite inclusions. (B–D) Titanomagnetite or magnetite particles likely attached to silicates: (B) low-magnification TEM image, (C) HRTEM image of part of the particle in the yellow dashed box in (B) and (D) the corresponding SAED pattern recorded from the [0
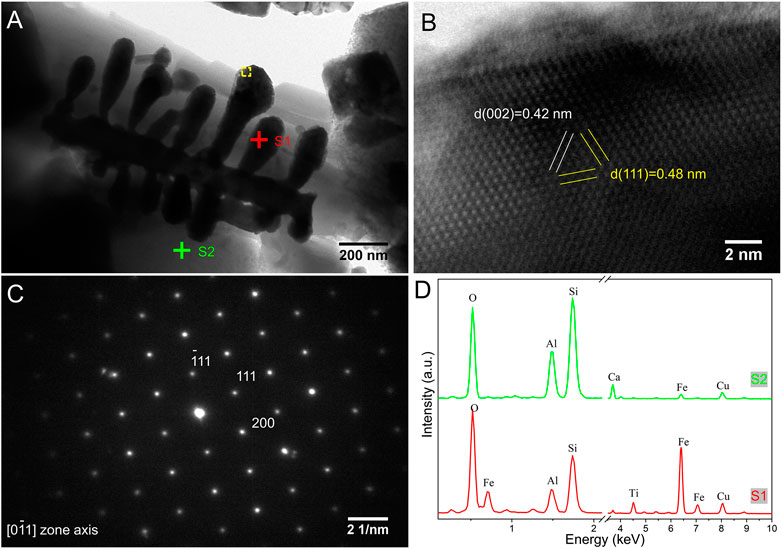
FIGURE 7. TEM analyses of Type-5 magnetite dendrites hosted within silicates. (A) TEM image of a magnetite dendrite aggregate hosted within a silicate. (B) HRTEM image of a small region of the particle indicated by the yellow dashed box in (A). (C) SAED pattern recorded from the [0
Consistent with SEM results, Type-1 to Type-5 particles dominate the magnetic mineral assemblage in TEM observations. With careful and extensive searching, we also found Type-6 particles, which clearly represent magnetite magnetofossils based on their well-defined crystal morphologies, nanometer sizes and chain organization (e.g., Kopp and Kirschvink, 2008; Li et al., 2013a). Three magnetofossil crystal morphologies are found in this sediment sample (Figure 8): octahedral magnetofossils have an average length of 53.0 ± 5.7 nm, width of 50.6 ± 5.9 nm and aspect ratio of 1.05 ± 0.05 (n = 19), prismatic magnetofossils have an average length of 103.3 ± 21.2 nm, width of 81.9 ± 15.8 nm and aspect ratio of 1.26 ± 0.13 (n = 13) and bullet-shaped magnetofossils have an average length of 116.5 ± 13.7 nm, width of 41.1 ± 1.3 nm and aspect ratio of 2.83 ± 0.3 (n = 3). HRTEM observations confirm that they are single crystals without obvious twinning defects.
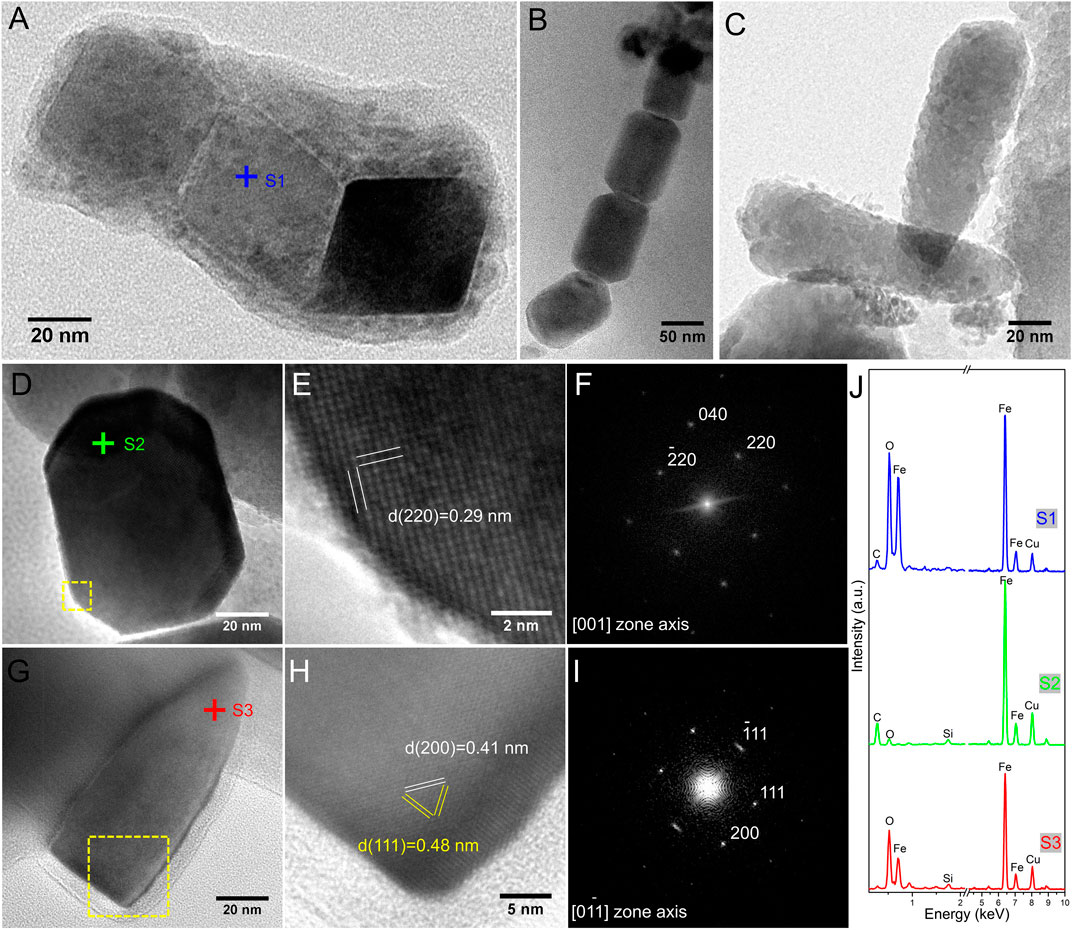
FIGURE 8. TEM analyses of Type-6 magnetite magnetofossils. (A) Three octahedral magnetite particles with chain structure. (B) Four elongated prismatic magnetite particles with chain structure. (C) Two bullet-shaped magnetite particles. (D) HRTEM image of an individual elongated prismatic particle recorded from the [001] zone axis. (E) Close-up image of the lower left-hand part of the particle in (D) (indicated by the yellow dashed box). (F) FFT pattern from the HRTEM image of the particle in (E). (G) HRTEM image of a bullet-shaped magnetite particle recorded from the [0
Type-7 and Type-8 particles have similar morphology in low-magnification TEM observations. Both appear to be tight aggregates of nanometer-sized magnetite (Figures 9A,D). However, HRTEM observations and SAED analyses demonstrate that they are different. Type-7 magnetite aggregates are composed of many randomly oriented single crystals with sizes of about 10 nm. As a result, SAED analysis of Type-7 magnetite aggregates have a typical ring-like diffraction pattern for polycrystalline samples (Figures 9B,C). In contrast, Type-8 magnetite aggregates are single crystals with significant defects. Despite obvious boundaries that divide particles into different small regions, HRTEM observations reveal clearly that the same lattice fringes run intact through the particle, resulting in a typical spot-like single crystal diffraction pattern (Figures 9E,F).
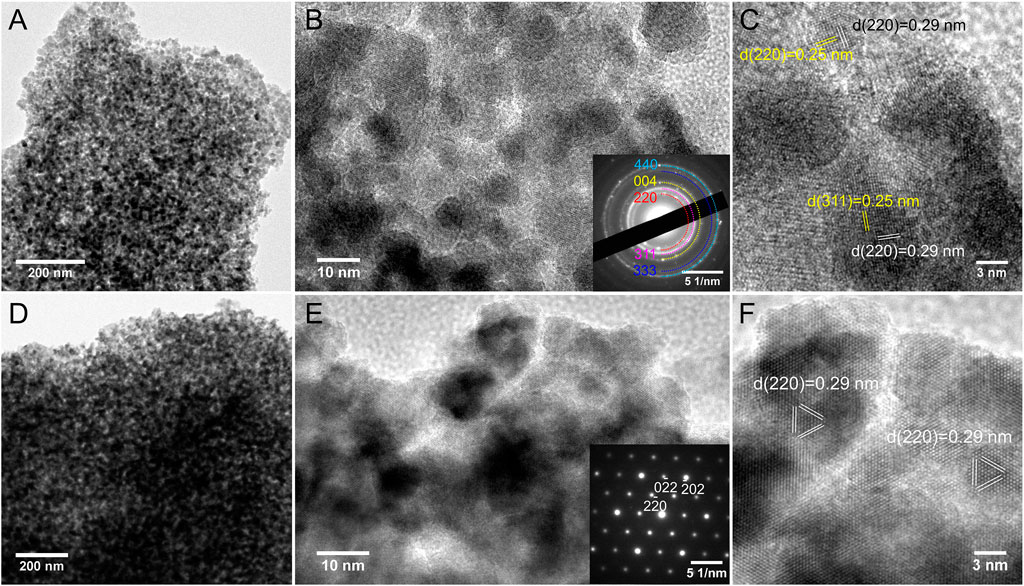
FIGURE 9. TEM analyses of Type-7 (A–C) and Type-8 (D–F) nanometer-sized magnetite aggregates. (A–C) Randomly oriented magnetite crystal aggregates: (A) low-magnification TEM image, (B) HRTEM image of many particles with the corresponding SAED pattern (inset), and (C) HRTEM image of several particles with Miller indices. (D–F) Uniformly oriented magnetite crystal aggregates: (D) low-magnification TEM image, (E) HRTEM image of many particles with the corresponding SAED pattern (inset) and (F) HRTEM image of several particles with Miller indices.
Discussion
Magnetic Mineral Assemblage in Surface Sediment Sample EPMNP-31
The generally low magnetic mineral concentration and mixture with non-magnetic minerals in sediments makes it necessary to pre-treat samples effectively to extract and enrich magnetic minerals for SEM and TEM analyses. Any magnetic mineral extraction process has inevitable biases, i.e., strongly magnetic minerals are relatively easy to extract from sediments (e.g., Hounslow and Maher, 1996; Han et al., 2016). The extraction process used here did not involve chemical treatment (e.g., dissolution by acid-ammonium oxalate) or mechanical treatment apart from ultrasonication to disperse the sediment slurry. It is, therefore, a relatively straightforward process. Our experimental results indicate that this extraction procedure has removed most non-magnetic minerals and that it has concentrated magnetic minerals, which is necessary for SEM and TEM analyses, although the procedure might miss weakly magnetic minerals (e.g., hematite, goethite). Five dominant (Type-1 to -5) and three minor (Type-6 to-8) titanomagnetite and magnetite particle types were identified from sample EPMNP-31 by combined use of SEM, SEM-EDXS elemental mapping, TEM, HRTEM, SAED and TEM-EDXS point analyses from micron to atomic scales. These microscopic observations provide direct evidence to help understand bulk sediment magnetic properties.
IRM decomposition indicates that the remanent magnetization in this sample is carried by four main coercivity components (Figure 10). Component 1 has a 7% contribution and might represent the magnetic response from coarse vortex state grains (e.g., Type-1,-2 and some submicron Type-4 and-5 particles). Component 2 has a 56% contribution and may originate mainly from SD magnetite particles with low Ti contents (e.g., Type-4 and -5), and SD magnetite magnetofossils (i.e., Type-6). Component 3 has a 28% contribution, which may originate from SD titanomagnetite particles with relatively high Ti contents, good crystallinity and elongated Type-3 particles. Component 4 has a 9% contribution and may represent the magnetic response of weakly magnetic minerals that were missed by the magnetic extraction procedure. The Type-7 and -8 magnetite aggregates were missed by IRM decomposition possibly because they are likely to have SP properties. It should be noted that magnetic unmixing with CLG functions does not enable fitting of skewed distributions, which can result in solutions with more components (e.g., from three to five components) (Figures 11A,B). When using skewed generalized Gaussian (SGG) functions (Egli, 2003), as few as two components can also give a good match (Figures 11C,D). Therefore, we argue that precise magnetic mineral assemblage identification based on systematic electron microscopic observations is a prerequisite for supervised unmixing.
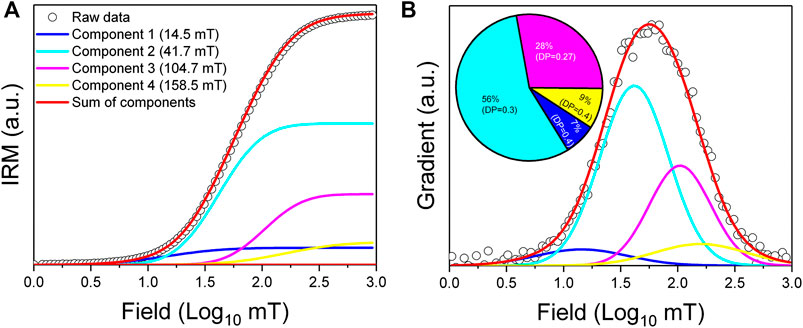
FIGURE 10. IRM component analysis based on supervised unmixing with information from magnetic mineral assemblages identified from SEM and TEM analyses. (A) Linear acquisition plot. (B) Gradient of acquisition plot. Four CLG components are required to fit the IRM acquisition curve: raw data (black circles), component 1 (blue), component 2 (cyan), component 3 (purple), component 4 (yellow), and the sum of the four components (red). Bc,1/2 values (the acquisition field at which 50% of the IRM is reached) for each coercivity fraction are indicated in parentheses in (A). The dispersion parameter (DP, i.e., IRM coercivity distribution width) and remanence contribution for each coercivity fraction are indicated in the pie chart in (B).
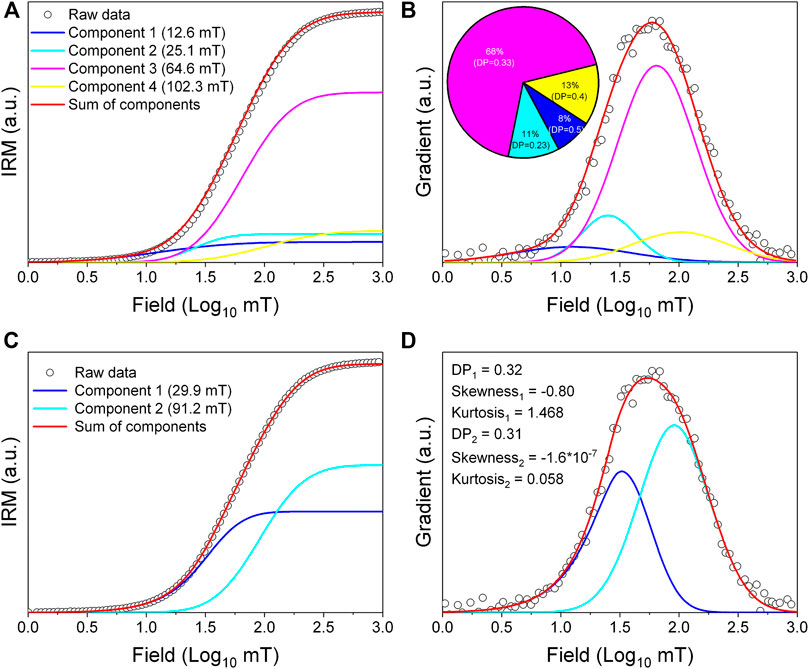
FIGURE 11. Alternative IRM component analysis based on unsupervized fitting of coercivity distributions with (A,B) CLG functions (e.g., Kruiver et al., 2001) and (C,D) SGG functions (Egli, 2003). Left-hand column: linear acquisition plots; right-hand column: gradient of acquisition plots.
Magnetic mineral types and their corresponding domain states were further identified by linking IRM, FORC and electron microscope analyses. Coarse-grained titanomagnetite or magnetite particles (e.g., IRM component 1) occur in the vortex state, as indicated by a tri-lobate FORC distribution after central ridge extraction (Figure 3C). A strong central ridge FORC signal can be divided into three components with distinctive peak coercivities, which correspond to the other three IRM components. The lowest coercivity SD FORC component is dominant and corresponds to IRM component 2 and likely corresponds to Type-4 and -5 fine magnetite and low-Ti titanomagnetite particles. The intermediate coercivity SD FORC component corresponds to IRM component 3 and may be carried by Type-3 high-Ti titanomagnetite particles. The highest coercivity SD FORC component corresponds to IRM component 4 and likely represents weakly magnetic minerals that were missed by the magnetic extraction procedure. The magnetic minerals responsible for IRM component 2 are non-interacting (e.g., Type-4 and -5). For IRM component 3, individual titanomagnetite particles may be separated by non-magnetic sediment matrix, and therefore behave as non-interacting SD particles (e.g., Type-3; particles aggregate relatively easily during magnetic extraction). IRM measurements cannot detect SP particles because they do not carry a remanence at room temperature. However, as shown in Figures 3 and 9, small particles (Type-7, -8 and some Type-4 particles) near the SP/SD threshold size (∼25–30 nm for equidimensional magnetite; Muxworthy and Williams (2009)) produce a clear FORC signal, which is confirmed by TEM observations.
Magnetite magnetofossils (Type-6 particles) should also contribute to the central ridge FORC signal and IRM component 2. However, the magnetofossil contribution within the studied sample appears to be small. First, both SEM and TEM analyses reveal that Type-1 to -5 titanomagnetite or magnetite particles are the dominant magnetic minerals within the magnetic extract. Magnetofossil chain structures should be observed readily by SEM if they are as abundant in the magnetic mineral assemblage as they are in silicate-hosted nanometric magnetite particles. They were found only occasionally after much searching under TEM. Second, although magnetite magnetofossils may have comparable coercivities to IRM component 2, they generally produce two typical IRM components between ∼30 and ∼80 mT with DP values <0.2 due to their narrow grain size distributions (e.g., Kruiver et al., 2001; Egli, 2004b; Heslop, 2015). IRM component 2 has DP = 0.3, which matches well with the silicate-hosted magnetite particles with diverse grain sizes ranging from a few to several hundred nanometers. Third, the chain structure of magnetite particles produced by modern MTB or preserved within sediments as magnetofossils generally produces significant shape anisotropy, which can be enhanced by elongation of prismatic and bullet-shaped magnetite particles (e.g., Moskowitz et al., 1993; Pan et al., 2005; Housen and Moskowitz, 2006; Li et al., 2010; Li et al., 2012; Li et al., 2013a; Chang et al., 2016b). Such shape anisotropy results in an apparent bifurcation of FC and ZFC warming curves below the Verwey transition temperature (i.e., ∼90–110 K) (e.g., Moskowitz et al., 1993; Li et al., 2013b). Despite detection of chain structures for octahedral and prismatic magnetofossils and elongated bullet-shaped magnetofossils in TEM observations, FC and ZFC warming curves do not bifurcate; the former is slightly higher than the latter throughout warming, possibly due to the presence of particles that undergo thermal activation and remanence gain/loss during cooling/warming. Despite magnetite magnetofossils being found in the studied sediment, both bulk magnetic measurements and electron microscope observations reveal that they are much less abundant than other SD particle types, and that their magnetic contributions are small.
Combined Use of Magnetic and Microscopic Analyses: Importance and Necessity
Precise sedimentary magnetic mineral identification is a prerequisite for many paleomagnetic and environmental magnetic studies. In practice, bulk sediment samples are generally screened using bulk magnetic measurements to provide indications of the possible presence of certain magnetic minerals, which are then confirmed by direct SEM or TEM observations. Such a strategy enables efficient identification of targeted magnetic minerals, which has been used widely to identify magnetofossils in marine and lake sediments (e.g., Kopp and Kirschvink, 2008; Roberts et al., 2012; Chang et al., 2014a). Of the available magnetic measurements, combined use of FORC diagrams and FMR analyses is powerful for detecting magnetofossil chain structures because these methods are sensitive to the SD properties and strong shape anisotropy of magnetofossil chains and less sensitive to surface magnetite oxidation, which can compromise low-temperature remanence warming tests (e.g., Kind et al., 2011; Chang et al., 2013). However, like all other magnetic magnetofossil identification methods, FORC and FMR analyses also have limitations because neither method gives unique indications of a single magnetic mineral (e.g., Liu et al., 2012) and sediments tend to contain mixed magnetic mineral assemblages. Each component may have different origins and magnetic responses that can carry useful paleomagnetic and paleoenvironmental information. This is why so much effort has been expended in recent decades to identify magnetic minerals precisely and quantitatively in sediments by developing magnetic, mathematical, microscopic and non-magnetic methods (e.g., Liu et al., 2012; Heslop, 2015; Roberts et al., 2019).
Based on systematic analysis of a marine surface sediment sample, we emphasize the importance and necessity of combined use of bulk magnetic and electron microscopic approaches to precisely and comprehensively identify sedimentary magnetic minerals. First, direct SEM and TEM observations provide important constraints on supervising IRM curve unmixing, which allows quantification of four major remanence-bearing components. FORC analysis then enables association of each magnetic component with its respective domain state. FORC diagrams also indicate the presence of particles near the SP/SD threshold size, which cannot be detected by IRM measurements. IRM and FORC analyses also indicate that the sediment contains weakly magnetic high-coercivity minerals (e.g., hematite, goethite) that were not extracted or detected by SEM and TEM observations. Second, metagenomic analyses have shown that this sample contains 16S rRNA genes affiliated with MTB (Dong et al., 2016). A strong central ridge FORC component might be interpreted to indicate the presence of magnetofossils. However, careful comparative SEM and TEM analyses, along with IRM decomposition, demonstrate that magnetite magnetofossils are not abundant in this sample and that their contribution to remanence may be small or even negligible compared to abiotic SD magnetite and titanomagnetite. Third, systematic analyses of magnetic mineral morphology, mineralogy and composition by combined SEM and TEM approaches allow identification of at least eight magnetite and titanomagnetite particle types from central Pacific Ocean surface sediment. Each magnetic particle type may have its own origin that reflects local or remote environmental processes. Irregular angular shapes for Type-1 titanomagnetite or magnetite particles indicate that they have a detrital origin related to erosion of magnetite-bearing igneous rocks from elevated submarine volcanic sources, of which there are nearby sources (Clouard and Bonneville, 2005). Submicron (Type-2) and nanometer-sized (Type-3) octahedral titanomagnetite particles may have formed from local hydrothermal and volcanic activity in the Clarion Fracture Zone region (e.g., Mewes et al., 2016; Gartman and Hein, 2019). Dendritic titanomagnetite particles (Type-5) are generally self-assembled and embedded within silicates, which indicates that they are exsolved microstructures that formed by phase separation in an originally homogenous solid solution during igneous rock cooling. In contrast, nanometer-sized titanomagnetite and magnetite particles occur as randomly oriented inclusions within silicates. They may have formed prior to the host silicate minerals and were incorporated into the silicate during its subsequent crystallization (e.g., Tarduno et al., 2006; Chang et al., 2016a). Magnetite magnetofossils (Type-6) represent local MTB activity (e.g., Dong et al., 2016). Weakly magnetic high-coercivity minerals likely result from remote westerly-transported input from the Asian interior (e.g., Hyeong et al., 2005; Hyeong et al., 2006). Despite their unknown origin, two types of SP magnetite particles were found, which indicates that reductive dissolution of fine-grained magnetite is limited in this area. Two oxygen sources, i.e., diffusive oxygen transfer from underlying seamount basaltic basement and oxygen rich AABW (e.g., Deng et al., 2016; Mewes et al., 2016), produce a fully oxic sediment column at the study site. Such an oxic environment will produce surficial titanomagnetite and magnetite oxidation, while limiting reductive diagenetic modification of fine-grained titanomagnetite and magnetite (e.g., Roberts, 2015).
Conclusions
We have studied systematically a deep-sea surface sediment from the Clarion Fracture Zone region in the central Pacific Ocean by combining bulk magnetic analyses and electron microscope observations. Eight titanomagnetite and magnetite particle types with different magnetic properties were identified, and their corresponding origins are discussed (Table 1). Type-1 particles are micron- and submicron-sized titanomagnetite with irregular and angular shapes, which are likely to be detrital particles that originated from erosion of magnetite-bearing igneous rocks in surrounding submarine volcanic highlands. Type-2 and-3 particles are well-defined octahedral titanomagnetite with submicron and nanometer sizes, respectively, which indicates that their formation may have been related to local hydrothermal and volcanic activity along the Clarion Fracture Zone region. Type-4 and-5 particles are silicate-hosted nanometer-sized titanomagnetite inclusions with diverse crystal morphologies and sizes that range from a few to a hundred nanometers. Type-4 particles are randomly assembled, while Type-5 particles are typical dendritic titanomagnetite. The inclusions would have resulted from exsolution within host silicates.
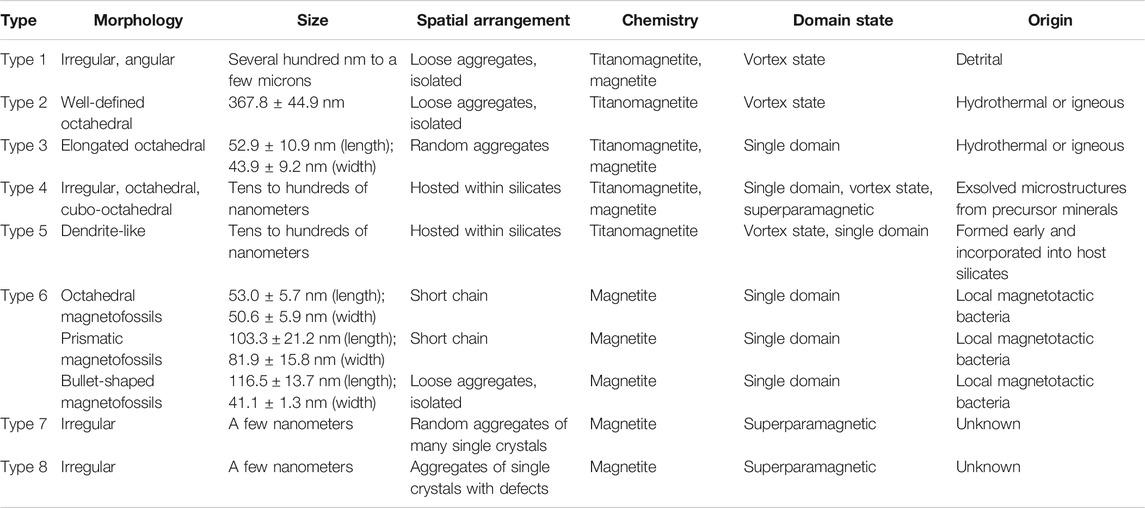
TABLE 1. Magnetic mineral types identified in sample EPMNP-31.
The above five magnetic particle types dominate the magnetization of the studied sediment. In contrast, Type-6 to-8 magnetic particles are much less abundant. Type-6 particles are magnetite magnetofossils, which are related to local MTB activity. Type-7 comprises SP magnetite aggregates that consist of many randomly oriented single crystals. Type-8 consists of single crystals with significant defects in which obvious boundaries divide particles into many small (SP-like) regions. The well-preserved nature of the fine-grained magnetite indicates that surface sediments in this area are fully oxic.
Electron microscope results are consistent with bulk magnetic properties. They also provide a basis to constrain supervised IRM unmixing to identify quantitatively each magnetic component in the sediment. Coarse-grained titanomagnetite (e.g., Type-1, -2, and some submicron Type-4 and-5 titanomagnetite particles) are in the vortex state and contribute 7% of the remanence. Noninteracting SD titanomagnetite particles of Type-4 and -5 contribute 56% of the remanence. Noninteracting SD titanomagnetite particles of Type-3 contribute 28% of the remanence. A fourth IRM component due to weakly magnetic high-coercivity minerals was not extracted successfully by our extraction method and was not documented in TEM observations; it contributes 9% of the remanence.
Our work demonstrates that diagenetically unmodified natural surface sediments host diverse detrital magnetic mineral assemblages. Magnetic methods are used widely to identify magnetic minerals within such assemblages, although unsupervized interpretation is unlikely to accurately represent the complexity of natural magnetic mineral assemblages. Electron microscopic observations of the type presented here are time-consuming but essential for ground truthing of supervised magnetic unmixing. Nevertheless, the diversity of observed magnetic mineral types means that we aggregated different particle types to explain identified magnetic components. This demonstrates the complexity of producing consistent supervised magnetic data interpretations.
Data Availability Statement
The original contributions presented in the study are included in the article/Supplementary Material, further inquiries can be directed to the corresponding author.
Author Contributions
JL designed and initiated the study, interpreted the measurements, and prepared the manuscript. JL and YL performed electron microscopic experiments and data analyses. JL, YL, and SL performed magnetic experiments and data analyses. AR and YP participated in data interpretation and manuscript refinement. HP and TX helped with sampling.
Funding
This study was supported financially by the National Natural Science Foundation of China (Grant Nos. 41920104009, 41890843, and 41621004), The Senior User Project of RVKEXUE2019GZ06 (Center for Ocean Mega-Science, Chinese Academy of Sciences), and the Australian Research Council (Grant Nos. DP160100805 and DP200100765).
Conflict of Interest
The authors declare that the research was conducted in the absence of any commercial or financial relationships that could be construed as a potential conflict of interest.
Acknowledgments
We thank Dr Qingsong Liu and two reviewers for constructive comments that helped to improve the manuscript significantly. We thank Mr. Tang Xu for assistance with TEM experiments and the people from cruise DY29–02 on R/V Haiyang Liuhao in 2013 for assistance with sampling.
Supplementary Material
The Supplementary Material for this article can be found online at: https://www.frontiersin.org/articles/10.3389/feart.2020.609058/full#supplementary-material.
References
Akai, J., Sato, T., and Okusa, S. (1991). TEM study on biogenic magnetite in deep-sea sediments from the Japan sea and the Western Pacific Ocean. J. Electron. Microsc. 40, 110–117. doi:10.1093/oxfordjournals.jmicro.a050878
Chang, S. B. R., and Kirschvink, J. L. (1989). Magnetofossils, the magnetization of sediments, and the evolution of magnetite biomineralization. Annu. Rev. Earth Planet Sci. 17, 169–195. doi:10.1146/annurev.ea.17.050189.001125
Chang, L., Roberts, A. P., Williams, W., Fitz Gerald, J. D., Larrasoaña, J. C., Jovane, L., et al. (2012). Giant magnetofossils and hyperthermal events. Earth Planet Sci. Lett. 351, 258–269. doi:10.1016/j.epsl.2012.07.031
Chang, L., Winklhofer, M., Roberts, A. P., Heslop, D., Florindo, F., Dekkers, M. J., et al. (2013). Low-temperature magnetic properties of pelagic carbonates: oxidation of biogenic magnetite and identification of magnetosome chains. J. Geophys. Res. Solid Earth 118, 6049–6065. doi:10.1002/2013JB010381
Chang, L., Roberts, A P., Winklhofer, M., Heslop, D., Dekkers, M. J., Krijgsman, W., et al. (2014a). Magnetic detection and characterization of biogenic magnetic minerals: a comparison of ferromagnetic resonance and first-order reversal curve diagrams. J. Geophys. Res. Solid Earth 119, 6136–6158. doi:10.1002/2014JB011213
Chang, L, Vasiliev, I., Baak, C. G. V., Krijgsman, W., Dekkers, M., Roberts, A. P., et al. (2014b). Identification and environmental interpretation of diagenetic and biogenic greigite in sediments: a lesson from the Messinian Black Sea. Geochem. Geophys. Geosyst. 15, 3612–3627. doi:10.1002/2014GC005411
Chang, L., Heslop, D., Roberts, A. P., Rey, D., and Mohamed, K. J. (2016a). Discrimination of biogenic and detrital magnetite through a double Verwey transition temperature. J. Geophys. Res. Solid Earth 121, 3–14. doi:10.1002/2015JB012485
Chang, L., Roberts, A P., Heslop, D., Hayashida, A., Li, J., Zhao, X., et al. (2016b). Widespread occurrence of silicate-hosted magnetic mineral inclusions in marine sediments and their contribution to paleomagnetic recording. J. Geophys. Res. Solid Earth 121, 8415–8431. doi:10.1002/2016JB013109
Chang, L., Harrison, R. J., Zeng, F., Berndt, T. A., Roberts, A. P., Heslop, D., et al. (2018). Coupled microbial bloom and oxygenation decline recorded by magnetofossils during the Palaeocene-Eocene Thermal Maximum. Nat. Commun. 9, 4007. doi:10.1038/s41467-018-06472-y
Channell, J. E. T., Harrison, R. J., Lascu, I., McCave, I. N., Hibbert, F. D., and Austin, W. E. N. (2016). Magnetic record of deglaciation using FORC-PCA, sortable-silt grain size, and magnetic excursion at 26 ka, from the Rockall Trough (NE Atlantic). Geochem. Geophys. Geosyst. 17, 1823–1841. doi:10.1002/2016GC006300
Chen, L., Heslop, D., Roberts, A. P., Chang, L., Zhao, X., McGregor, H. V., et al. (2017). Remanence acquisition efficiency in biogenic and detrital magnetite and recording of geomagnetic paleointensity. Geochem. Geophys. Geosyst. 18, 1435–1450. doi:10.1002/2016GC006753
Cisowski, S. (1981). Interacting vs. non-interacting single domain behavior in natural and synthetic samples. Phys. Earth Planet. In. 26, 56–62. doi:10.1016/0031-9201(81)90097-2
Clouard, V., and Bonneville, A. (2005). “Ages of seamounts, islands, and plateaus on the Pacific plate,” in Plates, plumes and paradigms. Editors G.R. Foulger, J. H. Natland, D. C Presnall, and D. L. Anderson, Vol. 388, 71–90. doi:10.1130/0-8137-2388-4.71
Dekkers, M. J. (2003). “Magnetic properties of sediments,” in Encyclopedia of sediments and sedimentary rocks. Editors G. V Middleton, M. J Church, M. Coniglio, L. A. Hardie, and F. J. Longstaffe (Dordrecht: Springer Netherlands), 418–424. doi:10.1007/978-1-4020-3609-5_130
Deng, X., Yi, L., Paterson, G. A., Qin, H., Wang, H., Yao, H., et al. (2016). Magnetostratigraphic evidence for deep-sea erosion on the Pacific Plate, south of Mariana Trench, since the middle Pleistocene: potential constraints for Antarctic bottom water circulation. Int. Geol. Rev. 58, 49–57. doi:10.1080/00206814.2015.1055597
Dong, Y., Li, J, Zhang, W, Zhang, W, Zhao, Y, Xiao, T, Wu, L-F, and Pan, H (2016). The detection of magnetotactic bacteria in deep sea sediments from the east Pacific Manganese Nodule Province. Environ. Microbiol. Rep. 8, 239–249. doi:10.1111/1758-2229.12374
Dunlop, D. J., and Özdemir, Ö. (1997). Rock magnetism: fundamentals and frontiers. London: Cambridge University Press. doi:10.1017/CBO9780511612794
Pan, D. J. (2002a). Theory and application of the Day plot (Mrs/Ms versus Hcr/Hc) 1. theoretical curves and tests using titanomagnetite data. J. Geophys. Res. 107 (B3). doi:10.1029/2001JB000486
Dunlop, D. J. (2002b). Theory and application of the Day plot (Mrs/Ms versus Hcr/Hc) 2. application to data for rocks, sediments, and soils. J. Geophys. Res. 107 (B3). doi:10.1029/2001JB000487
Egli, R., and Lowrie, W. (2002). Anhysteretic remanent magnetization of fine magnetic particles. J. Geophys. Res. 107 (B3), 2209. doi:10.1029/2001JB000671
Egli, R., Chen, A. P., Winklhofer, M., Kodama, K. P., and Horng, C. S. (2010). Detection of noninteracting single domain particles using first-order reversal curve diagrams. Geochem. Geophys. Geosyst. 11, Q01Z11. doi:10.1029/2009GC002916
Egli, R. (2003). Analysis of the field dependence of remanent magnetization curves. J. Geophys. Res. 108, 2081. doi:10.1029/2002JB002023
Egli, R. (2004a). Characterization of individual rock magnetic components by analysis of remanence curves, 1. Unmixing natural sediments. Studia Geophys. Geod. 48, 391–446. doi:10.1023/B:SGEG.0000020839.45304.6d
Egli, R. (2004b). Characterization of individual rock magnetic components by analysis of remanence curves. 2. Fundamental properties of coercivity distributions. Phys. Chem. Earth 29, 851–867. doi:10.1016/j.pce.2004.04.001
Egli, R. (2004c). Characterization of individual rock magnetic components by analysis of remanence curves. 3. Bacterial magnetite and natural processes in lakes. Phys. Chem. Earth 29, 869–884. doi:10.1016/j.pce.2004.03.010
Egli, R. (2013). VARIFORC: an optimized protocol for calculating non-regular first-order reversal curve (FORC) diagrams. Global Planet. Change 110, 302–320. doi:10.1016/j.gloplacha.2013.08.003
Evans, M. E., and Heller, F. (2001). Magnetism of loess/palaeosol sequence: recent developments. Earth Sci. Rev. 54, 129–144. doi:10.1016/S0012-8252(01)00044-7
Evans, M., and Heller, F. (2003). Environmental magnetism: principles and applications of enviromagnetics. San Diego, CA: Academic Press, Vol. 19. doi:10.1002/jqs.858
Evans, M. E., and Wayman, M. L. (1970). An investigation of small magnetic particles by electron microscopy. Earth Planet Sci. Lett. 9, 365–370. doi:10.1016/0012-821X(70)90137-8
Franke, C., von Dobeneck, T., Drury, M. R., Meeldijk, J. D., and Dekkers, M. J. (2007). Magnetic petrology of equatorial Atlantic sediments: electron microscopy results and their implications for environmental magnetic interpretation. Paleoceanography 22, PA4207. doi:10.1029/2007PA001442
Galindo-Gonzalez, C., Feinberg, J. M., Kasama, T., Gontard, L. C., Posfai, M., Kosa, I., et al. (2009). Magnetic and microscopic characterization of magnetite nanoparticles adhered to clay surfaces. Am. Mineral. 94, 1120–1129. doi:10.2138/am.2009.3167
Gartman, A., and Hein, J. R. (2019). “Mineralization at oceanic Transform faults and fracture zones,” in Transform plate boundaries and fracture zones. Editor J.C Duarte (Amsterdam: Elsevier), 105–118. doi:10.1016/B978-0-12-812064-4.00005-0
Gehring, A. U., Kind, J., Charilaou, M., and García-Rubio, I. (2011). The detection of magnetotactic bacteria and magnetofossils by means of magnetic anisotropy. Earth Planet Sci. Lett. 309, 113–117. doi:10.1016/j.epsl.2011.06.024
Gehring, A. U., Kind, J., Charilaou, M., and García-Rubio, I. (2013). S-band ferromagnetic resonance spectroscopy and the detection of magnetofossils. J. R. Soc. Interface 10, 20120790. doi:10.1098/rsif.2012.0790
Gibbs-Eggar, Z., Jude, B., Dominik, J., Loizeau, J. L., and Oldfield, F. (1999). Possible evidence for dissimilatory bacterial magnetite dominating the magnetic properties of recent lake sediments. Earth Planet Sci. Lett. 168, 1–6. doi:10.1016/S0012-821X(99)00054-0
Guyodo, Y., and Valet, J-P. (1999). Global changes in intensity of the Earth’s magnetic field during the past 800-kyr. Nature 399, 249–252. doi:10.1038/20420
Han, F., Wang, F. X., Li, J. H., Qin, H. F., Deng, C. L., and Pan, Y. X. (2016). Identification of magnetic minerals in surface sediments of Miyun Lake, Beijing. Chin. J. Geophys. 59, 2937–2948. doi:10.6038/cjg20160818
Hao, Q., Wang, L., Oldfield, F., Peng, S., Qin, L., Song, Y., et al. (2012). Delayed build-up of Arctic ice sheets during 400,000-year minima in insolation variability. Nature 490, 393–396. doi:10.1038/nature11493
Harrison, R. J., and Feinberg, J. M. (2008). FORCinel: an improved algorithm for calculating first-order reversal curve distributions using locally weighted regression smoothing. Geochem. Geophys. Geosyst. 9, Q05016. doi:10.1029/2008GC001987
Harrison, R. J., and Feinberg, J. M. (2009). Mineral magnetism: providing new insights into geoscience processes. Elements 5, 209–215. doi:10.2113/gselements.5.4.209
Guo, R. J., Dunin-Borkowski, R. E., and Putnis, A. (2002). Direct imaging of nanoscale magnetic interactions in minerals. Proc. Natl. Acad. Sci. U.S.A. 99 (16), 16556–16561. doi:10.1073/pnas.262514499
Harrison, R. J., Muraszko, J., Heslop, D., Lascu, I., Muxworthy, A. R., and Roberts, A. P. (2018). An improved algorithm for unmixing first-order reversal curve diagrams using principal component analysis. Geochem. Geophys. Geosyst. 19, 1595–1610. doi:10.1029/2018GC007511
He, K., and Pan, Y. X. (2020). Magnetofossil abundance and diversity as palaeoenvironmental proxies: a case study from Southwest Iberian margin sediments. Geophys. Res. Lett. 47, e2020GL087165. doi:10.1029/2020GL087165
Heslop, D., and Dillon, M. (2007). Unmixing magnetic remanence curves without a priori knowledge. Geophys. J. Int. 170, 556–566. doi:10.1111/j.1365-246X.2007.03432.x
Heslop, D., and Roberts, A. P. (2012a). Estimating best fit binary mixing lines in the Day plot. J. Geophys. Res. Solid Earth 117, B01101. doi:10.1029/2011JB008787
Heslop, D., and Roberts, A. P. (2012b). Estimation of significance levels and confidence intervals for first-order reversal curve distributions. Geochem. Geophys. Geosyst. 13, Q12Z40. doi:10.1029/2012GC004115
Heslop, D., Dekkers, M. J., Kruiver, P. P., and van Oorschot, I. H. M. (2002). Analysis of isothermal remanent magnetization acquisition curves using the expectation-maximization algorithm. Geophys. J. Int. 148, 58–64. doi:10.1046/j.0956-540x.2001.01558.x
Heslop, D. (2009). On the statistical analysis of the rock magnetic S-ratio. Geophys. J. Int. 178, 159–161. doi:10.1111/j.1365-246X.2009.04175.x
Heslop, D. (2015). Numerical strategies for magnetic mineral unmixing. Earth Sci. Rev. 150, 256–284. doi:10.1016/j.earscirev.2015.07.007
Hesse, P. P. (1994). Evidence for bacterial paleoecological origin of mineral magnetic cycles in oxic and sub-oxic Tasman Sea sediments. Mar. Geol. 117, 1–17. doi:10.1016/0025-3227(94)90003-5
Hounslow, M. W., and Maher, B. A. (1996). Quantitative extraction and analysis of carriers of magnetization in sediments. Geophys. J. Int. 124, 57–74. doi:10.1111/j.1365-246X.1996.tb06352.x
Housen, B. A., and Moskowitz, B. M. (2006). Depth distribution of magnetofossils in near-surface sediments from the Blake/Bahama Outer Ridge, western North Atlantic Ocean, determined by low-temperature magnetism. J. Geophys. Res. 111, G01005. doi:10.1029/2005JG000068
Hyeong, K., Park, S-H., Yoo, C. M., and Kim, K-H. (2005). Mineralogical and geochemical compositions of the eolian dust from the northeast equatorial Pacific and their implications on paleolocation of the Intertropical Convergence Zone. Paleoceanography 20, PA1010. doi:10.1029/2004PA001053
Hyeong, K., Yoo, C. M., Kim, J., Chi, S-B., and Kim, K-H. (2006). Flux and grain size variation of eolian dust as a proxy tool for the paleo-position of the Intertropical Convergence Zone in the northeast Pacific. Palaeogeogr. Palaeoclimatol. Palaeoecol. 241, 214–223. doi:10.1016/j.palaeo.2006.03.011
Jiang, X. D., Zhao, X., Chou, Y. M., Liu, Q. S., Roberts, A. P., Ren, J. B., et al. (2020). Characterization and quantification of magnetofossils within abyssal manganese nodules from the Western Pacific Ocean and implications for nodule formation. Geochem. Geophys. Geosyst. 21, e2019GC008811. doi:10.1029/2019GC008811
Jimenez-Lopez, C., Romanek, C. S., and Bazylinski, D. A. (2010). Magnetite as a prokaryotic biomarker: a review. J. Geophys. Res. 115, G00G03. doi:10.1029/2009JG001152
Kind, J., Gehring, A. U., Winklhofer, M., and Hirt, A. M. (2011). Combined use of magnetometry and spectroscopy for identifying magnetofossils in sediments. Geochem. Geophys. Geosyst. 12, Q08008. doi:10.1029/2011GC003633
Kirschvink, J. L., and Chang, S. B. R. (1984). Ultrafine-grained magnetite in deep-sea sediments: possible bacterial magnetofossils. Geology 12, 559–562. doi:10.1130/0091-7613(1984)12<559:UMIDSP>2.0.CO;2
Kissel, C., Laj, C., Labeyrie, L., Dokken, T., Voelker, A., and Blamart, D. (1999). Rapid climatic variations during marine isotopic stage 3: magnetic analysis of sediments from Nordic Seas and North Atlantic. Earth Planet Sci. Lett. 171, 489–502. doi:10.1016/S0012-821X(99)00162-4
Kissel, C., Laj, C., Jian, Z., Wang, P., Wandres, C., and Rebolledo-Vieyra, M. (2020). Past environmental and circulation changes in the South China Sea: input from the magnetic properties of deep-sea sediments. Quat. Sci. Rev. 236, 106263. doi:10.1016/j.quascirev.2020.106263
Kopp, R. E., and Kirschvink, J. L. (2008). The identification and biogeochemical interpretation of fossil magnetotactic bacteria. Earth Sci. Rev. 86, 42–61. doi:10.1016/j.earscirev.2007.08.001
Kopp, R. E., Nash, C. Z., Kobayashi, A., Weiss, B. P., Bazylinski, D. A., and Kirschvink, J. L. (2006a). Ferromagnetic resonance spectroscopy for assessment of magnetic anisotropy and magnetostatic interactions: a case study of mutant magnetotactic bacteria. J. Geophys. Res. 111, B12S25. doi:10.1029/2006JB004529
Kopp, R. E., Weiss, B. P., Maloof, A. C., Vali, H., Nash, C. Z., and Kirschvink, J. L. (2006b). Chains, clumps, and strings: magnetofossil taphonomy with ferromagnetic resonance spectroscopy. Earth Planet Sci. Lett. 247, 10–25. doi:10.1016/j.epsl.2006.05.001
Kopp, R. E., Raub, T. D., Schumann, D., Vali, H., Smirnov, A. V., and Kirschvink, J. L. (2007). Magnetofossil spike during the Paleocene-Eocene thermal maximum: ferromagnetic resonance, rock magnetic, and electron microscopy evidence from Ancora, New Jersey, United States. Paleoceanography 22, PA4103. doi:10.1029/2007PA001473
Kopp, R. E., Schumann, D., Raub, T D., Powars, D S., Godfrey, L V., Hysell, N. L. S., et al. (2009). An Appalachian Amazon? Magnetofossil evidence for the development of a tropical river-like system in the mid-Atlantic United States during the Paleocene-Eocene thermal maximum. Paleoceanography 24, PA4211. doi:10.1029/2009PA001783
Kruiver, P. P., Dekkers, M. J., and Heslop, D. (2001). Quantification of magnetic coercivity components by the analysis of acquisition curves of isothermal remanent magnetisation. Earth Planet Sci. Lett. 189, 269–276. doi:10.1016/S0012-821X(01)00367-3
Larrasoaña, J. C., Roberts, A. P., Chang, L., Schellenberg, S. A., Fitz Gerald, J. D., Norris, R. D., et al. (2012). Magnetotactic bacterial response to Antarctic dust supply during the Palaeocene–Eocene thermal maximum. Earth Planet Sci. Lett. 333–334, 122–133. doi:10.1016/j.epsl.2012.04.003
Larrasoaña, J. C., Liu, Q., Hu, P., Roberts, A. P., Mata, P., Civis, J., et al. (2014). Paleomagnetic and palaeoenvironmental implications of magnetofossil occurrences in late Miocene marine sediments from the Guadalquivir Basin, SW Spain. Front. Microbiol. 5, 71. doi:10.3389/fmicb.2014.00071
Lascu, I., Banerjee, S. K., and Berquo, T. S. (2010). Quantifying the concentration of ferrimagnetic particles in sediments using rock magnetic methods. Geochem. Geophys. Geosyst. 11, Q08Z19. doi:10.1029/2010GC003182
Lascu, I., Harrison, R. J., Li, Y. T., Muraszko, J. R., Channell, J. E. T., Piotrowski, A. M., et al. (2015). Magnetic unmixing of first-order reversal curve diagrams using principal component analysis. Geochem. Geophys. Geosyst. 16, 2900–2915. doi:10.1002/2015GC005909
Lascu, I., Einsle, J. F., Ball, M. R., and Harrison, R. J. (2018). The vortex state in geologic materials: a micromagnetic perspective. J. Geophys. Res. Solid Earth 123, 7285–7304. doi:10.1029/2018JB015909
Li, J. H., and Pan, Y. X. (2015). Applications of transmission electron microscopy in the earth sciences [C]. Sci. Sinica Terrae 45, 1359–1382. doi:10.1360/zd2015-45-9-1359
Li, J. H., Pan, Y., Liu, Q., Yu-Zhang, K., Menguy, N., Che, R., et al. (2010). Biomineralization, crystallography and magnetic properties of bullet-shaped magnetite magnetosomes in giant rod magnetotactic bacteria. Earth Planet Sci. Lett. 293, 368–376. doi:10.1016/j.epsl.2010.03.007
Li, J. H., Wu, W. F., Liu, Q. S., and Pan, Y. X. (2012). Magnetic anisotropy, magnetostatic interactions and identification of magnetofossils. Geochem. Geophys. Geosyst. 13, Q10Z51. doi:10.1029/2012GC004384
Li, J. H., Benzerara, K., Bernard, S., and Beyssac, O. (2013a). The link between biomineralization and fossilization of bacteria: insights from field and experimental studies. Chem. Geol. 359, 49–69. doi:10.1016/j.chemgeo.2013.09.013
Li, J. H., Ge, K. P., Pan, Y. X., Williams, W., Liu, Q. S., and Qin, H. F. (2013b). A strong angular dependence of magnetic properties of magnetosome chains: implications for rock magnetism and paleomagnetism. Geochem. Geophys. Geosyst. 14, 3887–3907. doi:10.1002/ggge.20228
Li, Q., Zhang, Q., Li, G. X., Liu, Q. S., Chen, M-T., Xu, J. S., et al. (2019). A new perspective for the sediment provenance evolution of the middle Okinawa trough since the last deglaciation based on integrated methods. Earth Planet Sci. Lett. 528, 115839. doi:10.1016/j.epsl.2019.115839
Li, J. H., Menguy, N., Roberts, A. P., Gu, L., Leroy, E., Bourgon, J., et al. (2020). Bullet-shaped magnetite biomineralization within a magnetotactic Deltaproteobacterium: implications for magnetofossil identification. J. Geophys. Res. Biogeoscie. 125, e2020JG005680. doi:10.1029/2020JG005680
Liu, Q. S., Roberts, A. P., Larrasoaña, J. C., Banerjee, S. K., Guyodo, Y., Tauxe, L., et al. (2012). Environmental magnetism: principles and applications. Rev. Geophys. 50, RG4002. doi:10.1029/2012RG000393
Liu, S. (2015). Insolation driven biomagnetic response to the Holocene warm period in semi-arid east Asia. Sci. Rep. 5, 8001. doi:10.1038/srep08001
Maciąg, Ł., and Harff, J. (2020). Application of multivariate geostatistics for local-scale lithological mapping – case study of pelagic surface sediments from the Clarion-Clipperton Fracture Zone, north-eastern equatorial Pacific (Interoceanmetal claim area). Comput. Geosci. 139, 104474. doi:10.1016/j.cageo.2020.104474
Maloof, A. C., Kopp, R. E., Grotzinger, J. P., Fike, D. A., Bosak, T., Vali, H., et al. (2007). Sedimentary iron cycling and the origin and preservation of magnetization in platform carbonate muds, Andros Island, Bahamas. Earth Planet Sci. Lett. 259, 581–598. doi:10.1016/j.epsl.2007.05.021
Maxbauer, D. P., Feinberg, J. M., and Fox, D. L. (2016). MAX UnMix: a web application for unmixing magnetic coercivity distributions. Comput. Geosci. 95, 140–145. doi:10.1016/j.cageo.2016.07.009
Mewes, K., Mogollón, J. M., Picard, A., Rühlemann, C., Eisenhauer, A., Kuhn, T., et al. (2016). Diffusive transfer of oxygen from seamount basaltic crust into overlying sediments: an example from the Clarion–Clipperton Fracture Zone. Earth Planet Sci. Lett. 433, 215–225. doi:10.1016/j.epsl.2015.10.028
Moskowitz, B. M., Frankel, R. B., and Bazylinski, D. A. (1993). Rock magnetic criteria for the detection of biogenic magnetite. Earth Planet Sci. Lett. 120, 283–300. doi:10.1016/0012-821X(93)90245-5
Muxworthy, A. R., and Dunlop, D. J. (2002). First-order reversal curve (FORC) diagrams for pseudo-single-domain magnetites at high temperature. Earth Planet Sci. Lett. 203, 369–382. doi:10.1016/S0012-821X(02)00880-4
Muxworthy, A. R., and McClelland, E. (2000). Review of the low-temperature magnetic properties of magnetite from a rock magnetic perspective. Geophys. J. Int. 140, 101–114. doi:10.1046/j.1365-246x.2000.00999.x
Muxworthy, A. R., and Williams, W. (2009). Critical superparamagnetic/single-domain grain sizes in interacting magnetite particles: implications for magnetosome crystals. J. R. Soc. Interface 6, 1207–1212. doi:10.1098/rsif.2008.0462
Newell, A. J. (2005). A high-precision model of first-order reversal curve (FORC) functions for single-domain ferromagnets with uniaxial anisotropy. Geochem. Geophys. Geosyst. 6, Q05010. doi:10.1029/2004GC000877
Ouyang, T. P., Heslop, D., Roberts, A. P., Tian, C. J., Zhu, Z. Y., Qiu, Y., et al. (2014). Variable remanence acquisition efficiency in sediments containing biogenic and detrital magnetites: implications for relative paleointensity signal recording. Geochem. Geophys. Geosyst. 15, 2780–2796. doi:10.1002/2014GC005301
Özdemir, Ö., and Dunlop, D. J. (2010). Hallmarks of maghemitization in low-temperature remanence cycling of partially oxidized magnetite nanoparticles. J. Geophys. Res. 115, B02101. doi:10.1029/2009JB006756
Pan, Y. X., Petersen, N., Davila, A. F., Zhang, L., Winklhofer, M., Liu, Q., et al. (2005). The detection of bacterial magnetite in recent sediments of Lake Chiemsee (Southern Germany). Earth Planet Sci. Lett. 232, 109–123. doi:10.1016/j.epsl.2005.01.006
Petersen, N., Von Dobeneck, T., and Vali, H. (1986). Fossil bacterial magnetite in deep-sea sediments from the South Atlantic Ocean. Nature 320, 611–615. doi:10.1038/320611a0
Pike, C., and Fernandez, A. (1999). An investigation of magnetic reversal in submicron-scale Co dots using first order reversal curve diagrams. J. Appl. Phys. 85, 6668–6676. doi:10.1063/1.370177
Pike, C. R., Roberts, A. P., and Verosub, K. L. (1999). Characterizing interactions in fine magnetic particle systems using first order reversal curves. J. Appl. Phys. 85, 6660–6667. doi:10.1063/1.370176
Pike, C. R., Roberts, A. P., and Verosub, K. L. (2001). First-order reversal curve diagrams and thermal relaxation effects in magnetic particles. Geophys. J. Int. 145, 721–730. doi:10.1046/j.0956-540x.2001.01419.x
Pósfai, M., Kasama, T., and Dunin-Borkowski, R. E. (2013). Biominerals at the nanoscale: transmission electron microscopy methods for studying the special properties of biominerals. Eur. Mineral Union Notes Mineral 14, 377–435. doi:10.1180/EMU-notes.14.11
Qian, Y., Roberts, A. P., Liu, Y., Hu, P., Zhao, X., Heslop, D., et al. (2020). Assessment and integration of bulk and component-specific methods for identifying mineral magnetic assemblages in environmental magnetism. J. Geophys. Res. Solid Earth 125, B019024. doi:10.1029/2019JB019024
Roberts, A. P., and Weaver, R. (2005). Multiple mechanisms of remagnetization involving sedimentary greigite (Fe3S4). Earth Planet Sci. Lett. 231, 263–277. doi:10.1016/j.epsl.2004.11.024
Roberts, A. P., Cui, Y., and Verosub, K. L. (1995). Wasp-waisted hysteresis loops: mineral magnetic characteristics and discrimination of components in mixed magnetic systems. J. Geophys. Res. 100, 909–917.
Roberts, A. P., Pike, C. R., and Verosub, K. L. (2000). First-order reversal curve diagrams: a new tool for characterizing the magnetic properties of natural samples. J. Geophys. Res. 105 (B12), 461–528 doi:10.1029/2000JB900326
Roberts, A. P., Chang, L., Rowan, C. J., Horng, C.-S., and Florindo, F. (2011a). Magnetic properties of sedimentary greigite (Fe3S4): an update. Rev. Geophys. 49, RG1002. doi:10.1029/2010RG000336
Roberts, A. P., Florindo, F., Villa, G., Chang, L., Jovane, L., Bohaty, S. M., et al. (2011b). Magnetotactic bacterial abundance in pelagic marine environments is limited by organic carbon flux and availability of dissolved iron. Earth Planet Sci. Lett. 310, 441–452. doi:10.1016/j.epsl.2011.08.011
Roberts, A. P., Chang, L., Heslop, D., Florindo, F., and Larrasoaña, J. C. (2012). Searching for single domain magnetite in the “pseudo-single-domain” sedimentary haystack: implications of biogenic magnetite preservation for sediment magnetism and relative paleointensity determinations. J. Geophys. Res. 117, B08104. doi:10.1029/2012JB009412
Roberts, A. P., Florindo, F., Chang, L., Heslop, D., Jovane, L., and Larrasoaña, J. C. (2013). Magnetic properties of pelagic marine carbonates. Earth Sci. Rev. 127, 111–139. doi:10.1016/j.earscirev.2013.09.009
Roberts, A. P., Heslop, D., Zhao, X., and Pike, C. R. (2014). Understanding fine magnetic particle systems through use of first-order reversal curve diagrams. Rev. Geophys. 52, 557–602. doi:10.1002/2014RG000462
Roberts, A. P., Almeida, T. P., Church, N. S., Harrison, R. J., Heslop, D., Li, Y., et al. (2017). Resolving the origin of pseudo-single domain magnetic behavior. J. Geophys. Res. Solid Earth 122, 9534–9558. doi:10.1002/2017JB014860
Roberts, A. P., Zhao, X., Harrison, R. J., Heslop, D., Muxworthy, A. R., Rowan, C. J., et al. (2018). Signatures of reductive magnetic mineral diagenesis from unmixing of first-order reversal curves. J. Geophys. Res. Solid Earth 123, 4500–4522. doi:10.1029/2018JB015706
Roberts, A. P., Hu, P, Harrison, R J, Heslop, D., Muxworthy, A R., et al. (2019). Domain state diagnosis in rock magnetism: evaluation of potential alternatives to the Day diagram. J. Geophys. Res. Solid Earth 124, 5286–5314. doi:10.1029/2018JB017049
Roberts, A. P. (2015). Magnetic mineral diagenesis. Earth Sci. Rev. 151, 1–47. doi:10.1016/j.earscirev.2015.09.010
Robertson, D. J., and France, D. E. (1994). Discrimination of remanence-carrying minerals in mixtures, using isothermal remanent magnetisation acquisition curves. Phys. Earth Planet. In. 82, 223–234. doi:10.1016/0031-9201(94)90074-4
Schumann, D. (2008). Gigantism in unique biogenic magnetite at the paleocene-eocene thermal maximum. Proc. Natl. Acad. Sci. U.S.A. 105 (17), 17648–17653. doi:10.1073/pnas.0803634105
Snowball, I. F. (1994). Bacterial magnetite and the magnetic properties of sediments in a Swedish lake. Earth Planet Sci. Lett. 126, 129–142. doi:10.1016/0012-821X(94)90246-1
Stolz, J. F., Chang, S. B. R., and Kirschvink, J. L. (1986). Magnetotactic bacteria and single-domain magnetite in hemipelagic sediments. Nature 321, 849–851. doi:10.1038/321849a0
Tarduno, J. A., Tian, W. L., and Wilkison, S. (1998). Biogeochemical remanent magnetization in pelagic sediments of the western equatorial Pacific Ocean. Geophys. Res. Lett. 25, 3987–3990. doi:10.1029/1998GL900079
Tarduno, J. A., Cottrell, R. D., and Smirnov, A. V. (2006). The paleomagnetism of single silicate crystals: recording geomagnetic field strength during mixed polarity intervals, superchrons, and inner core growth. Rev. Geophys. 44, RG1002. doi:10.1029/2005RG000189
Tauxe, L., Bertram, H. N., and Seberino, C. (2002). Physical interpretation of hysteresis loops: micromagnetic modeling of fine particle magnetite. Geochem. Geophys. Geosyst. 3, 1055. doi:10.1029/2001GC000241
Usui, Y., Yamazaki, T., Oka, T., and Kumagai, Y. (2019). Inverse magnetic susceptibility fabrics in pelagic sediment: implications for magnetofossil abundance and alignment. J. Geophys. Res. Solid Earth 124 (10), 672–710. doi:10.1029/2019JB018128
Valet, J.-P., and Meynadier, L. (1993). Geomagnetic field intensity and reversals during the past four million years. Nature 366, 234–238. doi:10.1038/366234a0
Valet, J.-P., Thevarasan, A., Bassinot, F., Savranskaia, T., and Haddam, N. (2020). Two records of relative paleointensity for the past 4 Myr. Front. Earth Sci. 8, 148. doi:10.3389/feart.2020.00148
Vali, H., and Kirschvink, J. L. (1989). Magnetofossil dissolution in a paleomagnetically unstable deep-sea sediment. Nature 339, 203–206. doi:10.1038/339203a0
Verosub, K. L., and Roberts, A. P. (1995). Environmental magnetism: past, present, and future. J. Geophys. Res. 100, 2175–2192. doi:10.1029/94JB02713
Vithana, M. V. P., Xu, M., Zhao, X., Zhang, M. C., and Luo, Y. M. (2019). Geological and geophysical signatures of the east pacific rise 8°–10°N. Solid Earth Sci. 4, 66–83. doi:10.1016/j.sesci.2019.04.001
Wang, H., Wang, J., Chen-Wiegart, Y. C., and Kent, D. V. (2015). Quantified abundance of magnetofossils at the Paleocene-Eocene boundary from synchrotron-based transmission X-ray microscopy. Proc. Natl. Acad. Sci. U.S.A. 112 (12), 12598–12603 doi:10.1073/pnas.1517475112
Weiss, B. P., Kim, S. S., Kirschvink, J. L., Kopp, R. E., Sankaran, M., Kobayashi, A., et al. (2004). Ferromagnetic resonance and low-temperature magnetic tests for biogenic magnetite. Earth Planet Sci. Lett. 224, 73–89. doi:10.1016/j.epsl.2004.04.024
Yamazaki, T., and Ioka, N. (1997). Cautionary note on magnetic grain-size estimation using the ratio of ARM to magnetic susceptibility. Geophys. Res. Lett. 24, 751–754. doi:10.1029/97GL00602
Yamazaki, T., and Kawahata, H. (1998). Organic carbon flux controls the morphology of magnetofossils in marine sediments. Geology 26, 1064–1066. doi:10.1130/0091-7613(1998)026<1064:OCFCTM>2.3.CO;2
Yamazaki, T., and Shimono, T. (2013). Abundant bacterial magnetite occurrence in oxic red clay. Geology 41, 1191–1194. doi:10.1130/G34782.1
Yamazaki, T., Fu, W., Shimono, T., and Usui, Y. (2020). Unmixing biogenic and terrigenous magnetic mineral components in red clay of the Pacific Ocean using principal component analyses of first-order reversal curve diagrams and palaeoenvironmental implications. Earth Planets Space 72, 120. doi:10.1186/s40623-020-01248-5
Yamazaki, T. (2009). Environmental magnetism of Pleistocene sediments in the North Pacific and Ontong-Java Plateau: temporal variations of detrital and biogenic components. Geochem. Geophys. Geosyst. 10, Q07Z04. doi:10.1029/2009GC002413
Yuan, W., Zhou, H. Y., Yang, Z. Y., Hein, J. R., and Yang, Q. H. (2020). Magnetite magnetofossils record biogeochemical remanent magnetization in hydrogenetic ferromanganese crusts. Geology 48, 298–302. doi:10.1130/G46881.1
Zhang, Q., Liu, Q. S., Li, J. H., and Sun, Y. B. (2018). An integrated study of the eolian dust in pelagic sediments from the North Pacific ocean based on environmental magnetism, transmission electron microscopy, and diffuse reflectance spectroscopy. J. Geophys. Res. Solid Earth 123, 3358–3376. doi:10.1002/2017JB014951
Keywords: marine sediments, magnetic minerals, environmental magnetism, magnetic techniques, transmission electron microscopy, magnetofossils, titanomagnetite
Citation: Li J, Liu Y, Liu S, Roberts AP, Pan H, Xiao T and Pan Y (2020) Classification of a Complexly Mixed Magnetic Mineral Assemblage in Pacific Ocean Surface Sediment by Electron Microscopy and Supervised Magnetic Unmixing. Front. Earth Sci. 8:609058. doi: 10.3389/feart.2020.609058
Received: 22 September 2020; Accepted: 23 November 2020;
Published: 22 December 2020.
Edited by:
Ricardo IF Trindade, University of São Paulo, BrazilReviewed by:
Gary Dean Acton, Texas A&M University, United StatesLuis Manuel Alva Valdivia, National Autonomous University of Mexico, Mexico
Copyright © 2020 Li, Liu, Liu, Roberts, Pan, Xiao and Pan. This is an open-access article distributed under the terms of the Creative Commons Attribution License (CC BY). The use, distribution or reproduction in other forums is permitted, provided the original author(s) and the copyright owner(s) are credited and that the original publication in this journal is cited, in accordance with accepted academic practice. No use, distribution or reproduction is permitted which does not comply with these terms.
*Correspondence: Jinhua Li, bGlqaW5odWFAbWFpbC5pZ2djYXMuYWMuY24=