 Amos Salamon1*
 Eran Frucht1,2Steven N. Ward3Erez Gal2
 Marina Grigorovitch2Rachamim Shem-Tov4Ran Calvo1Hanan Ginat4
- 1Geological Survey of Israel, Jerusalem, Israel
- 2Structural Engineering Department, Faculty of Engineering Sciences, Ben-Gurion University of the Negev, Beer Sheva, Israel
- 3Institute of Geophysics and Planetary Physics, University of California, Santa Cruz, CA, United States
- 4The Dead Sea-Arava Science Center, Mount Masada, Israel
Unique geological and seismotectonic settings may trigger a multicascading hazard and should be identified beforehand. Such is the head of the Gulf of Elat–Aqaba (HGEA) at the northeastern end of the Red Sea where its geology, tectonics, bathymetry, and earthquake and tsunami history exhibit clear potential for earthquake and submarine-landslide tsunami generation. We thus investigated the possible tsunamigenic sources in the gulf and evaluated the resulting hazard at the HGEA. First, we assembled a bathymetric grid and adopted GeoClaw software to simulate most of the earthquake-tsunami scenarios. Next, we resolved the scheme of the largest possible tsunamigenic earthquakes along the deep basins of the Gulf of Elat (GEA) and the associated Dead Sea rift valley, as well as the potential tsunamigenic submarine landslides in the HGEA. The use of GeoClaw was verified against the 1995 tsunami generated by the Nuweiba Mw 7.2 earthquake, and then operated to simulate a suite of earthquake scenarios. Results showed that the marginal faults of Elat Basin pose the highest tsunami hazard to the Israeli part of the HGEA. To better assess that hazard, we screened the geology and seismotectonics of the HGEA and found that the Elat normal fault presents the worst-case scenario for Elat city. It is capable of generating a multicascading threat of earthquake and submarine-landslide tsunami, local subsidence that can increase inundation, and above all, destructive ground motion. Scenarios of a tsunami caused by the worst-case earthquake on the Elat fault simulated by GeoClaw and Ward’s (Tsunami, The encyclopedia of solid earth geophysics. 2011, 1473–1493) approach, and submarine landslide in the HGEA simulated by Wang et al.’s (Geophys. J. Int., 2015, 201, 1534–1544) ‘Tsunami Squares’ approach, demonstrated waves as high as 4 m along these coasts. Accordingly, we constructed a map of the evacuation zone. We also show that strong ground-shaking and retreat of the sea at the HGEA should be considered a tsunami warning, although false alarms are inevitable. Furthermore, tsunami hazard exists all along the gulf and further assessments are needed to quantify this hazard and increase awareness among the area's population.
Introduction
Some recent catastrophic tsunamis have occurred in unexpected settings that were misinterpreted or overlooked by existing early warning procedures and surprised the population. Such were, for example, the sudden 1998 Papua New Guinea tsunami that followed a nearby seismogenic submarine landslide (Synolakis et al., 2002), the multiple cascading earthquake and tsunami hazards triggered by the 2018 Sulawesi strike-slip earthquake that severely affected Palu Bay (Goda et al., 2019), and the tsunamigenic collapse of the Anak Krakatoa emerging volcano (Walter et al., 2019). The high toll of casualties and the unique geological, seismotectonic and geographical setting of such events have attracted comprehensive reviews (e.g., Okal, 2015) and investigations dedicated to understanding unconventional mechanisms and configurations of tsunami generation: for example, tsunami earthquakes (Polet and Kanamori, 2016), the frequent appearance of tsunamis generated by seismogenic submarine landslides (Salamon and Di Manna, 2019), and tsunamis associated with strike-slip earthquakes (e.g., Imamura et al., 1995; Frucht et al., 2019).
Moreover, remote and pastoral coasts with short documented history may seem to be safe from tsunamis, but if they are in active seismotectonic regions, tsunami hazard should not be overlooked. Such is the Gulf of Elat–Aqaba (GEA) at the northeastern end of the Red Sea (Figure 1), which is the focus of this research. The GEA is a deep water body that stretches along the southern segments of the Dead Sea Transform (DST) fault and rift system (e.g., Bartov et al., 1980; Garfunkel, 1981; Ben-Avraham et al., 2008; Ben-Avraham et al., 2012), between the Arabian plate to the east and the Sinai subplate to the west. Since the DST has already produced strong and destructive earthquakes (e.g., Salamon et al., 1996; Salamon et al., 2003, and references therein), it should also be considered capable of generating tsunamis in the GEA. Indeed, the Nuweiba Mw 7.2 earthquake in 1995—the strongest event recorded along the DST in modern times—did produce a tsunami in the GEA (Frucht et al., 2019, and references therein). Today, the head of the GEA (HGEA), which is occupied by Egypt, Israel, Jordan and Saudi Arabia, is undergoing intensive development of residential districts, infrastructure facilities, and international tourist resorts with inner lagoons and large hotels. Realizing that this is a unique setting of a transform in a marine environment with the potential of generating both earthquake and submarine-landslide tsunamis, we initiated a tsunami hazard evaluation for the HGEA to characterize the hazard and assess its potential severity.
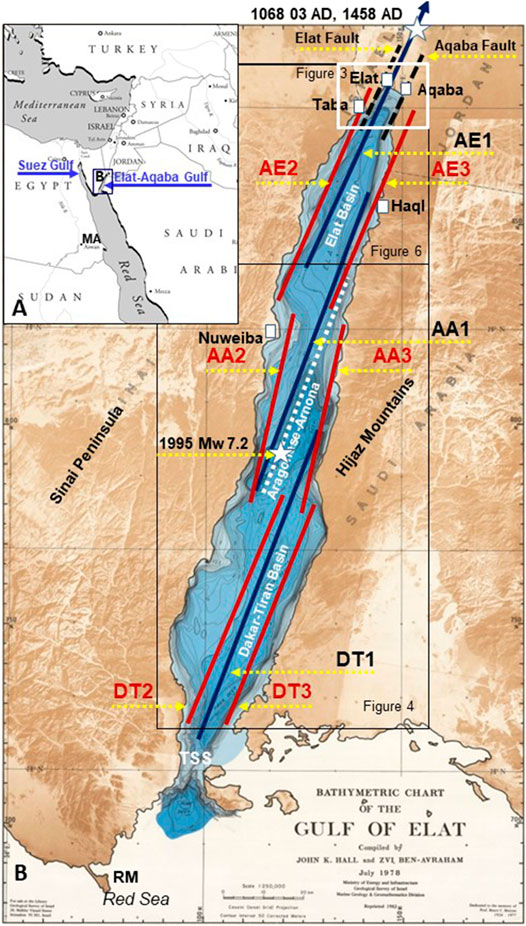
FIGURE 1. Location maps of the study area. The white rectangle marks the Head of the Gulf of Elat-Aqaba (HGEA). (A) General setting (modified from https://www.freeusandworldmaps.com/index.html). MA, Marsa Alam. (B) Tectonic scheme of the potential tsunamigenic structures of the Gulf of Elat–Aqaba superimposed on the geography and bathymetry map (modified from Hall and Ben-Avraham, 1978). Black lines, schematic trace of the Dead Sea Transform by segments: Elat-Aqaba (AE1), Aragonese-Arnona (AA1) and Dakar-Tiran (DT1). Dark red lines, assumed western (AE2, AA2, DT2) and eastern (AE3, AA3, DT3) marginal faults of the basins. Dashed black lines, Elat and Aqaba faults. White dashed line, 1995 Nuweiba earthquake rupture (from Baer et al., 2008). Stars, epicenter of strong earthquakes; RM, Ras Muhammad; TSS, Tiran-Sharm El Sheikh Straits. The rectangles delimit the location of Figures 3, 4, and 6.
The characterization of earthquake source parameters for tsunami modeling is associated with large unknowns, complexities and uncertainties, especially in areas where the geology and seismotectonics are not fully known or understood (e.g., Selva et al., 2016; Geist et al., 2019). Although location, geometry and tectonic deformation are necessary for tsunami simulation, they need to be simplified where data are limited (e.g., Basili et al., 2013). Furthermore, rupture properties of magnitude and slip for a given fault for which there are no data on past earthquake activity have to rely on empirical scaling relations from elsewhere (e.g., Wells and Coppersmith, 1994; Thingbaijam et al., 2017). Above all, mechanical properties, rupture dynamics, complexities and heterogeneities that are necessary for realistic modeling of sea floor coseismic deformation, are associated with large uncertainties (e.g., Geist and Oglesby, 2014) and require large modeling resources.
Landslide-tsunami modeling is no less difficult. Although it is common to assume that the volume of a slide is the most influential factor (Ward, 2001), Løvholt et al. (2017) showed that under certain circumstances, smaller landslides can generate larger tsunamis than those generated by larger landslides. It is thus important to know beforehand the mechanical properties of the sliding materials that control landslide kinematics for realistic modeling (e.g., Harbitz et al., 2014; Kim et al., 2019), but these are largely unknown. Recent comprehensive reviews (e.g., Huhn et al., 2019; Løvholt et al., 2020) discuss the need for a probabilistic framework to consider both aleatory and epistemic uncertainties in tsunami hazard analysis.
The scope of this work, however, is limited to a preliminary investigation based on the available data and expert judgment where needed, with the understanding of the need for a complementary probabilistic assessment in the future.
The Gulf of Elat–Aqaba
Topography, Bathymetry and Geography
The GEA is 180 km long and 15–25 km wide, extending NNE from the northern end of the Red Sea at its junction with the Gulf of Suez (Figure 1). The water depth in this narrow and elongated gulf is about 900 m, reaching 1,850 m in some places. The marginal slopes of the GEA are steep, both offshore in the gulf and on land, where the nearby mountains of Sinai to the west and Hijaz to the east rise steeply to about 1,000 m above sea level (masl). The southernmost point of the GEA connects with the Red Sea through the Tiran-Sharm El Sheikh Straits and with the Gulf of Suez near Sharm El Sheikh at the southernmost tip of the Sinai Peninsula. The northern end of the bay is the HGEA, which is the focus of this work; it is about 5–8 km wide and 8–10 km long, altogether ∼50 km2 (Tibor et al., 2010). The bathymetry of the HGEA consists of a narrow, 100-m wide shelf in the north, a much narrower shelf in the west, and almost no shelf in the east. Toward the central Elat (Eilat) Basin, the narrow shelves change abruptly into steep slopes and impressive submarine canyons of about 700 m depth (Ben-Avraham and Tibor, 1993; Sade et al., 2008). The slopes are spotted with fresh scars and collapsed materials (Tibor et al., 2010), implying submarine landslides, which may be tsunamigenic. Based on underwater drill cores, Kanari et al. (2014) and Ash-Mor et al. (2017) suggested correlating such landslides with the strong 1068 AD and 1458 AD earthquakes along the DST.
The northwestern and northeastern coasts of the HGEA are densely populated, with the Israeli city of Elat and the Jordanian city of Aqaba. The cities of Taba (Egypt) and Haql (Saudi Arabia) are located on the western and eastern HGEA coasts, respectively.
Geology and Seismotectonics
The GEA is a fault-controlled depression that consists of a series of three deep basins that have formed along the southern part of the DST since the Early Miocene (Ben-Avraham et al., 1979; Ben-Avraham, 1985; Ben-Avraham and Tibor, 1993; Ben-Avraham et al., 2012). The basins follow left-wize segmentation of the left-lateral DST in the form of a leaky transform (Garfunkel, 1981) that has reached a total offset of about 105 km (Quennell, 1959; Freund et al., 1968; Garfunkel, 2014; and others) and that opens as wide as 20 km in the south (Bartov et al., 1980; Garfunkel, 1981; and others). Southward, the DST meets the Red Sea and Suez Gulf rifts at a triple junction that connects the plates of Africa and Arabia with the Sinai subplate.
The long-term geological activity along the southern DST has resulted in a left lateral motion of 5 mm/year and an extension of about 0.5 mm/year (Garfunkel, 2014). Geodesy measurements show that the short-term rate of motion is consistent with its long-term rate (Hamiel et al., 2018), but emphasize the enigmatic deficit of seismic moment release that is reflected in historic and modern earthquake activity (Garfunkel, 1981; Salamon et al., 1996). The HGEA at the northernmost part of the Elat Basin is bounded by the Elat normal fault on the west, the Aqaba normal fault on the east, and several secondary faults in between (Hartman et al., 2014). The other basins, Aragonese-Arnona in the center of the gulf and the southernmost Dakar-Tiran, are also bounded by a series of normal faults on their margins (Figure 11 in Ben-Avraham et al., 1979). Such an active seismotectonic configuration associated with a deep water body should clearly be considered tsunamigenic.
Seismicity along the GEA has been well documented since the 1980s, including several intensive swarms and the strong Mw 7.2 earthquake (Figure 1B) on November 22, 1995 (Hofstetter et al., 2014). Shapira and Hofstetter (1993, 2002) estimated that the return period of M ≥ 6 earthquakes at the HGEA and along the Aragonese fault is about 460 years each, and about 300 years along the Arnona fault. Amit et al. (1999) estimated a minimal return period of M > 6.5 earthquakes along the Dead Sea fault across the Avrona (Evrona) Playa of about 2,000 years.
Pre-instrumental activity is known from historical events—the March 1,068, 1,212 and 1,458 AD earthquakes (Zohar et al., 2016, and references therein)—and these were verified by paleoseismic evidence to have ruptured the DST on land in the southern Arava Valley (Amit et al., 1999; Zilberman et al., 2005; Klinger et al., 2015). Based on paleoseismology, Klinger et al. (2015) and Lefevre et al. (2018) suggested that the 114 and 363 AD historical events also ruptured the surface there (in their opinion, another 363 AD event occurred in the north, along the Jordan Valley), as well as two other events unknown to history, in the fourth century BC and the eighth century AD. Paleoliquefaction evidence near Elat and Aila (a historic city, where Aqaba now sits) (Al-Homoud and Tal, 1998; Kanari et al., 2014) supports the presence of such activity. The long-term Holocene activity along the Evrona strike-slip fault (the DST segment in the southern Arava Valley) is estimated by Hartman et al. (2014) to be 2.3–3.4 mm/year. In their opinion, the rate of motion along the Elat fault (EF) is 1 and 0.4 mm/year along the Aqaba fault, both in a normal sense of motion.
Late Pleistocene events, 80K–20 K years BP, are known from paleoseismology to have occurred along the western margins of the DST rift (Amit et al., 2002). The findings show surface offsets of 1–1.5 m that imply M 6.7–7 events, and return periods of ∼2,800 years (deviation 700 years). Over the last 20 K years, the offsets have become smaller—0.2–1.3 m, indicating weaker events in the range of M 5.9–6.7, while the return period has increased to ∼1,200 years (deviation of 300 years).
Tsunami Reports and Evidence
The record of tsunamis in the HGEA is limited to a few events, some of them equivocal. Shaked et al. (2004) suggested that a sediment outcrop that is ∼2,300 years old near Elat is a tsunamite. Goodman-Tchernov et al. (2016) interpreted evidence from two cores offshore of the HGEA as a record of a major paleotsunami that also occurred ∼2,300 years ago. It is not clear whether the two findings relate to the same event. The historical accounts of a tsunami associated with the 1068 AD earthquakes are debated. Guidoboni and Comastri (2005) suggested that the tsunami occurred in the Mediterranean Sea in association with the earthquake of May 1,068 in central Israel, whereas Ambraseys (2009) argues that the available information does not allow pinpointing the exact location of the tsunami. In modern times, Ben-Menahem (1991) mentioned that the “Sea at Eilat Gulf became stormy” after the Shadwan ML 6.8 earthquake that occurred where the Red Sea meets the Gulf of Suez, outside the GEA. The 1995 tsunami, however, was the first to have been recorded in the GEA (Wust, 1997; Frucht et al., 2019). The last report regards a 5-cm wave that was observed in Elat after the December 2004 Indian Ocean tsunami (Eng. S.D. Rosen, personal communication, 2017).
Indirect evidence of past tsunamis might be the finding of submarine mass-transport deposits in two different marine boreholes at the HGEA (Kanari et al., 2014; Ash-Mor et al., 2017). The two studies suggest a correlation between the submarine landslides and paleo and historic (1068 AD and 1458 AD) earthquakes. It is reasonable to assume that these slumps were tsunamigenic. Another study by Salem (2009) proposes some deposits near the city of Marsa Alem along the Egyptian coast of the Red Sea as evidence of a paleo tsunami.
Methodology
To achieve the goal of this research—understanding the potential of tsunami generation and the resulting hazard in the HGEA—we established the phases of our study as follows (Figure 2):
I Study the area and collect data: geography, geology, seismotectonics and bathymetry of the GEA, and a literature search for past tsunami evidence. This part was described in the introduction; Identify the potential tsunamigenic sources in the GEA, mainly earthquakes and submarine landslides, characterize their areal spread, geometry and magnitudes, and estimate the repeat times (Potential Tsunamigenic Sources in the Gulf of Elat–Aqaba); Formulate the potential tsunamigenic earthquakes and submarine landslides (Potential Tsunamigenic Sources in the Gulf of Elat–Aqaba).
II Build tsunami-propagation-modeling capacity, construct topographic and bathymetric grids for simulation (Building Modeling Capability).
III validate suitability of the adopted simulation platform against the real case of the 1995 M 7.2 Nuweiba earthquake and tsunami (Testing the Modeling Capacity–The 1995 Nuweiba Tsunami).
IV Simulate the potential earthquake scenarios, retrieve hazard parameters, such as arrival times and wave heights and identify the actual worst case scenario (Tsunami Scenarios).
V Evaluate the hazard and assess maximal wave heights, potential inundation, repeat times, construct map of evacuation zone, warning signals etc., (Discussion)
VI Conclude and recommend implementation of the outcomes, in terms of maximal wave height at the coast, return period of the worst-case scenario (WCS), evacuation zone, and early warning principles (Conclusions and Recommendations).
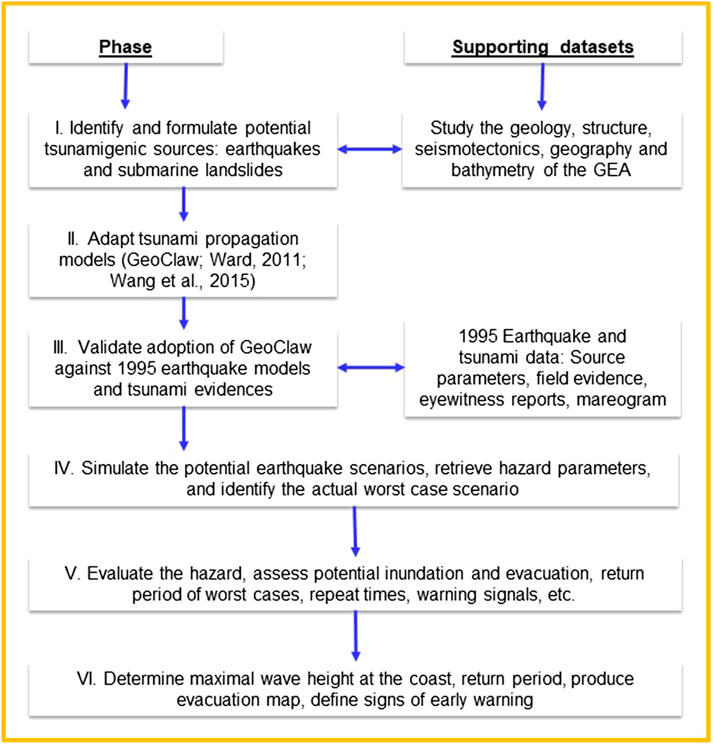
FIGURE 2. Work plan and phases of the research. The hazard assessment focused on the Israeli coast of the head of the Gulf of Elat–Aqaba (HGEA).
A similar methodology was found applicable and useful for tsunami hazard evaluation along the Mediterranean coast of Israel (Salamon et al., 2007; Salamon et al., 2010; Salamon, 2011), based on which Israel formulated its policy for warning principles and frame of preparedness (Salamon et al., 2014). The present evaluation is in line with this policy.
Building Modeling Capability
Modeling capability was based on the adoption of a tsunami wave-propagation platform, construction of a topographic and bathymetric grid of the area of interest, and benchmark validation.
Tsunami Wave Propagation
The GeoClaw tsunami-modeling platform, which is part of the Clawpack Package (LeVeque, 2006; Clawpack Development Team, 2017), was selected to conduct most of the numerical simulations of earthquake-tsunami scenarios in the GEA. The GeoClaw is an open-source model that has already been validated worldwide and applied in numerous peer-reviewed publications (http://www.clawpack.org/geoclaw.html). The US Federal Emergency Management Agency (FEMA) has recognized GeoClaw as a suitable open-source alternative for its existing tsunami risk software platform (FEMA, 2017). In Israel, the Oceanographic and Limnological Research Institute (IOLR) and the Geological Survey of Israel (GSI) have adopted GeoClaw to conduct several projects (e.g., Galanti and Salamon, 2017).
GeoClaw solves the shallow water equations, a nonlinear system of hyperbolic conservation laws for depth and momentum, for two lateral space dimensions (Eqs 1–3) using finite-volume methods.
where h (x, y, t) is the fluid depth/thickness, and the two depth-averaged horizontal velocity components are u (x, y, t) (eastward) and v (x, y, t) (northward). B (x, y, t) represents the varying topography (also referred to as bathymetry), g is the gravitational constant and D (h, u, v) is the drag coefficient (Eq. 4), given by Berger et al. (2011). M is the Manning coefficient, taken as 0.0025 (Te Chow, 1959).
The coseismic deformation that displaces the water and initiates the tsunami waves was modeled according to Okada’s (1985, 1992) approach which is now part of GeoClaw.
GeoClaw computation uses Adaptive Mesh Refinement (AMR), which is an efficient way to achieve high accuracy in areas of interest if computation resources and time are limited. For our purposes, we constructed three AMR domains that were derived from the main GEA grid (Figure 3). The resolution level of the main grid is 1,539.2 m cells and the local, finest AMRs of Taba, Elat and Aqaba domains are 48.1 m cells. In addition, the run time of each scenario was limited to simulate the first 100 min of the event.
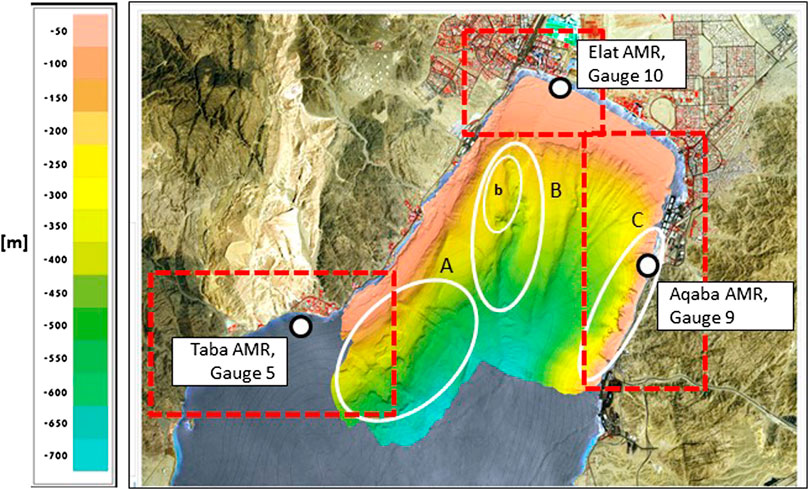
FIGURE 3. Zones of past submarine slope failure projected on the multibeam bathymetric map of the head of the Gulf of Elat–Aqaba (HGEA) (after Sade et al., 2008). Note the three zones of submarine slope failure—(A)–(C)—and the potential area of the largest slide—b. Note also the location of the three artificial tide gauges used to record the waveforms presented in Figure 5. See Figure 1 for the location of this map.
Elat Fault scenario was simulated also by the ‘Tsunami Squares’ approach (background and detailed formulation in Ward, 2011, Wang et al., 2015, and Xiao et al., 2015) which is a variant of the “Tsunami Balls” (Ward and Day, 2008). This method is capable of simulating propagation of tsunami waves, overland floods, inundation, dam breaks, lava flows, and more. In ‘Tsunami Squares’, the computational space is divided into a set of N square cells with chosen dimension. At time t each cell holds water with mean horizontal velocity and mean horizontal acceleration. The wave propagation is calculated by updating those conditions to time t + dt. The generation mechanism of the tsunami can be obtained by the No Momentum Transfer (NMT) approach (Xiao et al., 2015). This method is useful for simulating earthquake-tsunami or long run out submarine landslides. In NMT, seabed topography becomes time dependent and the water in each cell are vertically lifted up or dropped down accordingly. Gravity acts on the disturbed water surface, but no momentum is transferred in the lifting itself.
The landslide-tsunami was also simulated by the ‘Tsunami Squares’ approach that is able to simulates generation, propagation and resting of flow-like landslides. The sliding material is represented by squares that are accelerated downward by gravity and decelerated by basal and dynamic friction. While sliding, the squares are displaced and fractured into new squares again and again, but conserve the initial volume and linear momentum of the collapsed material. This procedure “takes into account of solid/fluid mechanics and particle interactions by updating velocities through the slope of the top or bottom surfaces of the flow” and “it incorporates entrainment and deposition into landslide modeling” (Wang et al., 2015).
In all methods, we regarded the GEA as a closed water body and thus saved, for simplicity, the need to calculate the incoming and outgoing waves through the southern narrow straits of Tiran-Sharm El Sheikh.
Bathymtric Grid of the Gulf of Elat–Aqaba
The GEA topographic and bathymetric grid was based on NASA's 30 m digital elevation model (DEM) (https://gdex.cr.usgs.gov/gdex/, last accessed 2017, now retired) of the land and sea areas. A 200 m DEM of the HGEA (Sade et al., 2008) was also used, along with many seagrass elevation measurements (5–15 m apart; Winters et al., 2017). The various nets were assembled and restructured into a 30 m cell-size grid, converted into the WGS84 geographical coordinate system, and then unified. The coseismic deformation calculated by the Okada model was based on a 460 m2 cell grid.
Testing the Modeling Capacity–The 1995 Nuweiba Tsunami
The wealth of data available on the tsunami that followed the Nuweiba, Mw 7.2 strike-slip earthquake in 1995 (Figure 1B) allowed us to test our adopted GeoClaw computational platform. We examined which of the 1995 Nuweiba seismological and InSAR earthquake models was able to replicate and better match the existing eyewitness accounts of an up to 1 m wave rise and drop along Elat coast, minor inundation that flooded local nomad dwellings and left some driftwood and beach waste along several coasts, limited damage in Nuweiba and Aqaba ports, and the analog mareogram recorded in Elat Port. Overall, the simulations correlated reasonably well with the existing reports, field evidence, and the arrival time, amplitude and wave period recorded by the mareogram. Thus, we were able to validate the computational platform, assumptions and approximations, verify that they do not bias the results, and consider our simulations reliable. A detailed description of this process appears in Frucht et al. (2019).
Potential Tsunamigenic Sources in the Gulf of Elat–Aqaba
Aside from the source of the 1995 Nuweiba earthquake and the other segments of the DST, all of the largest active seismotectonic elements within the GEA that are capable of generating M > 6 earthquakes are potentially tsunamigenic due to the coseismic deformation that they can induce inside the water body. The steep bathymetric slopes in the HGEA that are dotted with numerous scars are also suspected of releasing tsunamigenic failures.
Earthquakes
While the structural scheme of the GEA's three basins is fairly well-known (Ben-Avraham et al., 1979; Hartman et al., 2014), the seismotectonic framework of its margins is not sufficiently recognized. The most significant shortcoming is the lack of information regarding the faults that form the rift valley and rise of the Sinai and Hijaz mountains on its margins. Whereas Reches et al. (1987) and Hartman et al. (2014) delineated the Elat and Aqaba faults along the western and eastern HGEA margins, there is no information on equivalent structures along the central and southern parts of the GEA. These tectonic elements are necessary to complement the pattern of potential tsunamigenic earthquake sources. To overcome this gap of knowledge and within the given scope of this work, we generalized the tectonic framework of the GEA and reduced it to three large basins (Figure 1B: Elat, Aragonese-Arnona, and Dakar-Tiran), with each basin associated with a main segment of the DST and two normal faults along its margins, one on the west and the other on the east. The marginal faults represent the tectonics of both the deep basins within the GEA and the shoulders of the rift valley. As such, they represent the largest possible earthquakes along the GEA margins (the DST can generate even stronger events) and are suitable for the largest earthquake-tsunami scenarios. Secondary faults are smaller and less effective in generating significant coseismic deformation and strong ground motion, and thus can be examined at later stages.
The pattern of the potential tsunamigenic sources in the HGEA region is better known. It is based on previous geological and tectonic field and marine work and maps (e.g., Ben-Avraham et al., 1979), on extrapolation of the trace of the main faults from land into the sea (Tibor et al., 2010; Hartman et al., 2014), and on the location of the steep bathymetric slopes along the basin margins (Figures 1B, 3).
The Modeled Earthquakes
Following the conceptual structure of the GEA and the associated rift valley, we considered three basins and ascribed to each of them its relevant DST segment and two marginal faults on its western and eastern boundaries. All in all, we modeled nine tsunamigenic sources and assigned their seismogenic parameters on the basis of existing field evidence and research findings as follows (Table 1, Figure 1B):
• The basins are, from north to south, Elat (abbreviated AE), Aragonese-Arnona (AA) and Dakar-Tiran (DT).
• The three DST segments are annotated ‘1’ (AE1, AA1 and DT1); their mechanism is left-lateral strike slip (LL, rake is 0). Regarding the dip, we followed Baer et al. (2008) who determined the source parameters of the 1995 Nuweiba earthquake that ruptured AA1, and Ben-Avraham (1985), who studied the structural framework of the GEA. Overall, AE1 was assigned 65°E, AA1 65°W, and DT1 65°E.
• The western marginal faults are annotated ‘2’ (AE2, AA2 and DT2), located west of the DST segments inside the gulf; their mechanism is normal (N) and the dip is 60° which is typical of normal faults, to the east (E).
• The eastern marginal faults are annotated ‘3’ (AE3, AA3 and DT3), located east of the DST segments inside the gulf; they are normal (N) and dip 60°W.
• The length of the marginal faults accord with the length of the basins, 60 km for AE and DT and 50 km for the shorter AA basin. The DST segments extend outside the basins toward the nearby structure and thus are longer. AE1 is 80 km, extending northwards to the Arava Valley, AA1, which connects with Elat Basin, is also 80 km, and DT1, which connects to Tiran-Sharm El Sheikh straits, is 85 km.
• The width of the faults in AE was set to 25 km, in accordance with the depth of the seismogenic zone in the nearby Arava Valley (Hofstetter et al., 2014). The width of the faults in the other basins (AA, DT) was set to 30 km, in accordance with the Nuweiba earthquake source parameters (Baer et al., 2008).
• The strike of the DST segments is N25E, whereas the strike of the marginal faults trends more or less NNE, in parallel with the geography of the GEA basins and coasts.
• The slip was adopted from the ‘surface rupture length–maximum displacement’ empirical relationships of Wells and Coppersmith (1994).
• The Mw magnitude was determined according to the length, width and slip.
• The rate of motion of the DST segments, 0.5 cm/year, reflects the relative motion of the DST. The rates of the western and eastern marginal faults follow Hartman et al. (2014), who determined 0.1 and 0.04 cm/year for the Elat and Aqaba faults, respectively.
• The Return Period was the maximal slip divided by the rate of motion.
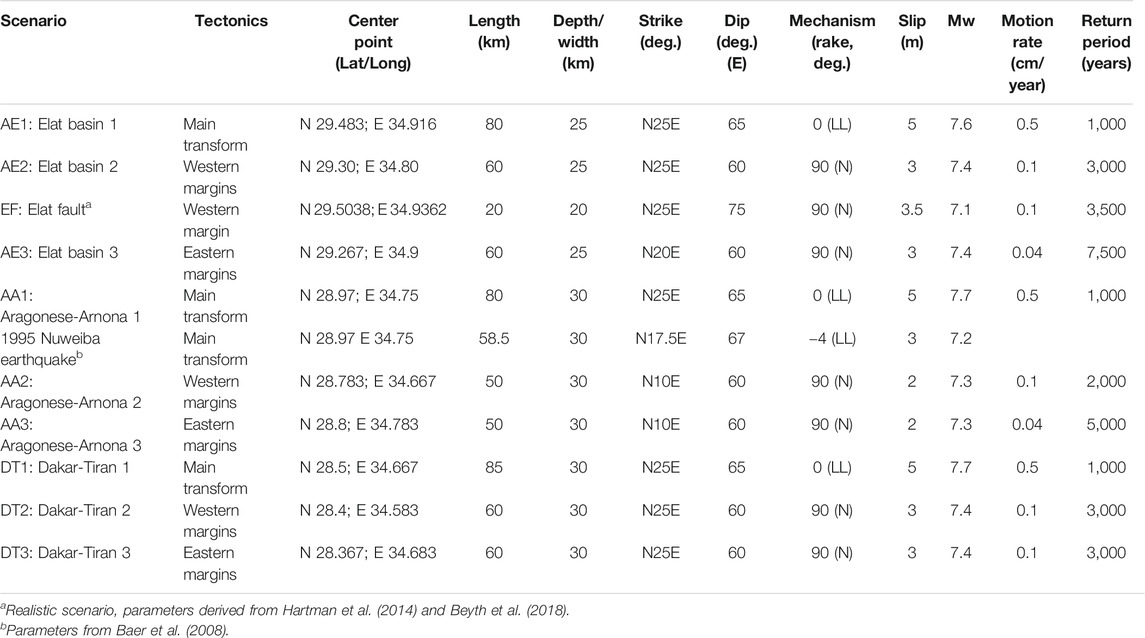
TABLE 1. Inventory of potential worst-case Gulf of Elat–Aqaba (GEA) earthquake scenarios used for our tsunami simulation. See Earthquakes for detailed explanation regarding the origin and rationale of the source parameters.
The modeled scenarios of the nine faults are discussed in Tsunamigenic Earthquakes and Figures 4, 5.
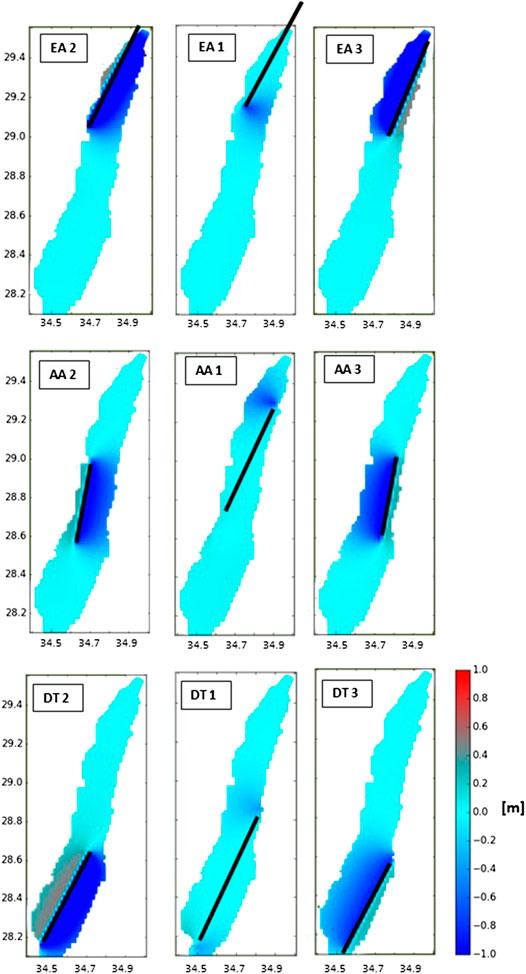
FIGURE 4. Snapshots of the simulated scenarios that were taken 1 s into the event represent the shape of the water surface induced by the coseismic deformation at the initial stage of the tsunami. See Earthquakes for detailed explanation and Table 1 for earthquake source parameters. Black lines denote the simulated faults; EA, Elat-Aqaba Basin; AA, Aragonese-Arnona Basin; DT, Dakar-Tiran Basin. Annotations 1, 2, and 3 refer to the main segment of the transform, and the western and eastern margin faults of the given basin, respectively. See Figure 1 for the locations of these maps.
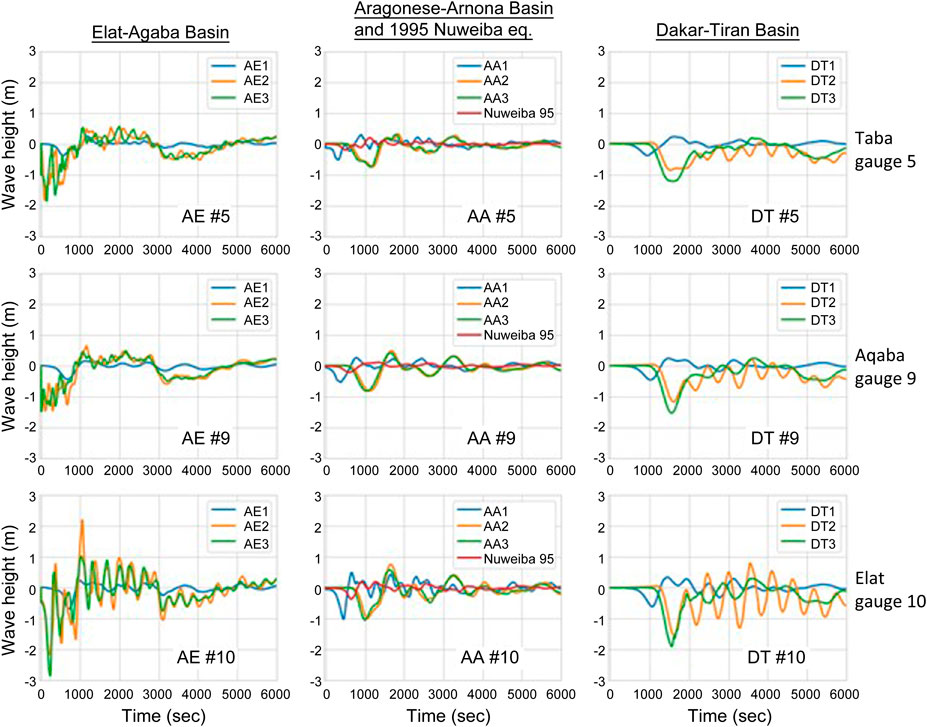
FIGURE 5. Waveforms of the simulated tsunami scenarios recorded by artificial tide gauges in the head of the Gulf of Elat–Aqaba (HGEA) region. Each diagram presents waveforms of three scenarios simulated in the given basin (ordered by columns) as recorded by the given tide gauge (ordered by rows). The left column presents scenario waveforms propagated from Elat-Aqaba Basin (denoted AE), the central column shows waveforms generated in Aragonese-Arnona Basin (AA) and calculated waveform of the 1995 Nuweiba M 7.2 tsunami, the right column waves arriving from Dakar-Tiran Basin (DT). The rows arranged by waveforms recorded in the given gauge: upper row for Taba (#5), central for Aqaba (#9) and lower for Elat (#10).
Submarine Landslides
Although there is no direct evidence of a tsunami resulting from a submarine landslide in the GEA, the presence of numerous fresh scars and collapsed material along the HGEA bathymetric slopes clearly indicates such a potential (Makovsky et al., 2008; Sade et al., 2008; Tibor et al., 2010). Kanari et al. (2014) and Ash-Mor et al. (2017) identified four mass-transport deposits occurring in the past ∼2,500 years in a core drilled in the submarine Elat canyon, and correlated the age of the last ones with the historical earthquakes of 1068 AD and 1458 AD. It is thus reasonable to assume that strong earthquakes in the region are capable of generating mass-transport deposits, and that future landslides may occur along unstable zones where failure has already occurred in the past. Furthermore, the GEA is located in an arid region, and the supply of sediments into the gulf is limited. Therefore, the given frequency of strong earthquakes in this region (Return Period) may suffice to release any load of accumulated sediment before it reaches metastable conditions and is released spontaneously. Extrapolating from the Mediterranean region and elsewhere around the world (Salamon and Di Manna, 2019), the threshold earthquake magnitude for the release of a tsunamigenic submarine landslide would be somewhat below M ∼ 6 with a low probability, but the likelihood increases with the magnitude (Salamon et al., 2007).
The HGEA bathymetry shows several characteristics (Tibor et al., 2010):
• the shelf dips 3°–5°, is about 1 km wide in the north, several hundred meters in the west and minimal on the east
• the continental slope is much steeper and reaches 13°
• typical scars along the slope are several tens of meters wide and several tens to hundreds of meters long
• scar height is up to 20 m
• several scars are made up of combined curves, which hints at the occurrence of a complex failure or multiple events
• the failed materials are deposited below the scars and at the bottom of the slopes, to a distance of several hundred meters and even several kilometers along the Elat submarine canyon.
Following Reches et al. (1987) and Tibor et al. (2010), we recognized three main zones of slope instability in the HGEA (Figure 3):
• along the western slopes, below the city of Taba, at a water depth of ∼200–∼650 m below sea level (mbsl) (‘A’ in Figure 3)
• along the Elat submarine canyon in the northwestern corner of the HGEA, at a water depth of ∼100–∼700 mbsl (‘B’ in Figure 3). The largest slide in the area appears along the western bank of that canyon ('b' in Figure 3). The age and failure mechanism of that slide is not clear, whether by creep, fault controlled or collapse. The presence of fresh scars superimposed on top of it and the collapsed earth materials below, suggests that this mechanism has been active in recent times. Nonetheless, further investigation is needed to evaluate whether the large slide can also be activated in the future.
• along the eastern slopes and below the city of Aqaba (‘C’ in Figure 3). This is a very steep cliff-like slope. It continues from land into the sea with a minimal shelf. Slope failures are of the rock-fall type rather than slumps, and with smaller volume than elsewhere in the HGEA.
Table 2 summarizes the main parameters of the potential tsunamigenic submarine landslides.
The Modeled Submarine Landslide
To simplify the landslide-tsunami simulation and overcome the many unknowns in the geometrical, mechanical and hydrodynamic properties of submarine landslides that dominate the magnitude of the resulting tsunami (e.g., Ward, 2001; Løvholt et al., 2015), we focused on the largest recognizable slump in the HGEA as representing the worst case of landslide-tsunamis (Table 2, case ‘b’). This, of course, does not exclude the need for future investigation of the complete spectrum of possible landslides along the HGEA submarine slopes.
TABLE 2. Characteristics of potential tsunamigenic submarine landslides in the head of the Gulf of Elat–Aqaba (HGEA).
The other missing parameters were inferred from the actual HGEA bathymetric profile, and the geometry and water depth at the initial and terminal track of the existing mass-transport deposits. Slide velocity and other mechanical properties were adopted from Ward (2001) and from Løvholt et al. (2015).
Other Tsunamigenic Sources
Other tsunamigenic sources that might affect the HGEA are considered of secondary importance. The steep topography of the Sinai and Hijaz mountains around the GEA may release subaerial tsunamigenic landslides in the manner of the Lituya Bay, Alaska event (Miller, 1960). However, preliminary screening of the on-land slopes did not reveal any mountain flanks that were vulnerable to failure with a considerable volume.
Tsunamis from afar, such as from the 1969 Shadwan earthquake in the Gulf of Suez and the 2004 Sumatra earthquake in the Indian Ocean, may have penetrated the GEA but had no significant effect (Tsunami Reports and Evidence). The narrow Tiran-Sharm El Sheikh straits at the southern end of the GEA seem to attenuate incoming waves. Nevertheless, further investigation is certainly needed to verify the actual contribution of subaerial landslides and remote sources to tsunami generation and propagation in the GEA.
Tsunami Scenarios
Tsunamigenic Earthquakes
The nine conceptual earthquake-tsunami scenarios originated in the three basins were simulated by the GeoClaw platform. Representative snapshots of the simulations that were taken 1 s into the event (Figure 4) portray the shape of the water surface induced by the coseismic deformation at the initial stage of the tsunami. The waveforms of the first 100 min (6,000 s) that were generated in Elat, Aragonese-Arnona and Dakar-Tiran basins, were recorded by three artificial tide gauges along the HGEA coasts (Taba, Elat and Aqaba, Table 3) and are presented in Figure 5. Here we briefly discuss the main outcomes of the simulations.
TABLE 3. Waveform characteristics of Elat fault scenario recorded by the three artificial tide gauges located in the head of the Gulf of Elat–Aqaba (HGEA).
Dead Sea Transform Earthquake-Tsunamis
The left lateral rupture of the DST segments (AE1, AA1, DT1) in the range of Mw 7.6–7.7 causes slight subsidence at the far ends of the faults that drags the water such that the first wave spreads with a negative phase followed by a positive one. This is echoed in the HGEA gauges (Figure 5) by the negative phase of the first arrivals of about half a meter in Taba and Aqaba and 1 m at the most in Elat. The maximal amplitude of the following rise does not get larger than the first drop, and then the waves fade away slowly.
It is reasonable to assume that the AE1 scenario resembles the 1068 AD historic event that ruptured the northern part of this segment in the Arava Valley (Amit et al., 1999; Zilberman et al., 2005). In this case, the tsunamigenic trigger is the coseismic drop at the southeastern end of the segment which is located in the GEA (Figure 5). The waves hit Elat coast immediately after the earthquake with a drop of 70 cm and then a rise of 25 cm above the original sea level.
The southern part of the AA1 segment ruptured in 1995 (e.g., Baer et al., 2008) and generated a tsunami (Frucht et al., 2019). Therefore, the likelihood that it will rupture again in the near future is very low (Figure 5). The first arrivals to the HGEA start with a negative phase of about half a meter in Taba and Aqaba and of 1 m in Elat, and these are followed by a rise of about half these values within 11 min after the earthquake. The reason for the small amplitudes, even when compared to the 1995 scenario (Figure 5, central column) which was based on a smaller fault with a lower magnitude, is that the AA1 scenario is a pure strike-slip fault) with no vertical component (rake = 0). Nevertheless, some vertical deformation still occurs around the edges of the fault, and this is sufficient to produce some tsunami waves. The southernmost tip of the fault is close to the western GEA shores and thus most of the coseismic deformation disturbs on-land areas. The DT1 waves that are generated further south in the GEA arrive about 12 min after the earthquake (Figure 5) and reach an amplitude of a few tens of centimeters, mostly in the receding phase.
Marginal Basin Earthquake Scenarios
Scenarios of the marginal faults, Mw 7.3–7.4, show much higher coseismic subsidence than the DST segments at the center of the GEA (Figure 5). The subsidence drags the water and release higher waves with negative phase first. In each of the basins, the western marginal faults (AE2, AA2, DT2) mirror the eastern ones (AE3, AA3, DT3, respectively) in their location along the margins, strike, dip, rake and magnitude. Due to this symmetry, each pair generates about the same coseismic subsidence at the center of the GEA, and thus the waves propagating along the GEA are also almost similar in their first phase, amplitude and period. This is evidenced in the waveforms recorded by the HGEA gauges (Figure 5).
In the Elat gauge, the AE2 and AE3 scenarios induce instantaneous coseismic subsidence of about half a meter, associated with a sharp drop of sea level for an additional 1.5 and 2 m, respectively. The maxima arrive after several waves and reach about 2 and 1 m asl respectively, about 17 min after the earthquake. The next waves attenuate slowly with a period of ∼5 min.
The first AA2 and AA3 arrivals to the HGEA gauges occur about 10 min after the earthquake, with a drop of ∼1 m in Elat and ∼80 cm in Taba and in Aqaba. This is followed by a rise of up to ∼70 cm in Elat, and then the oscillations decrease. The average period is 13 min.
The DT2 tsunami waves reach the HGEA after 20 min with a drop in sea level of 1.2, 1.9 and 1.5 m in Taba, Elat and Aqaba, respectively. The waves continue to oscillate in a 9-min period, reach their highest level after 1 h, and then attenuate slowly. The DT3 waves arrive at the HGEA about 3 min earlier with slightly larger amplitude and longer period compared to the DT2 case (Figure 5), and then attenuate with time.
The Worst of the Tsunamigenic Earthquake Scenarios
The resulting waveforms of the nine earthquake scenarios (Table 4 and Figure 5) show that all of the simulated waves reach the HGEA with a drop in sea level, which means a retreat of the sea. This is due to the transtensional tectonics of the GEA (leaky transform) where normal faults and strike slips induce coseismic subsidence. In all cases except for AE2, the subsequent rise does not achieve maxima larger than the preceding minima. In general, the strike-slip scenarios generate lower waves. Waves generated by the marginal faults of Elat Basin impact the HGEA immediately after the earthquake, while the first waves from the central and southern basins arrive 10 and 20 min later, respectively (Table 4).
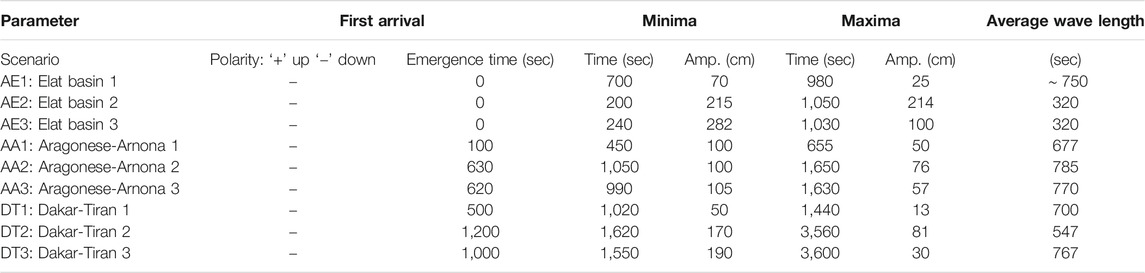
TABLE 4. Characteristics of the resulting waveforms of the nine worst-case scenarios as recorded by the Elat artificial tide gauge (#10, Figure 5, lower row).
Overall, the AE2 scenario produced the largest maxima in Elat (Figure 5 and Table 4), more than 2 m. Furthermore, the AE2 and AE3 scenarios caused subsidence of the northernmost HGEA coasts, which, in turn, is expected to intensify the inundation. Even worse, high accelerations from AE1–3 quakes may trigger tsunamigenic submarine slope failure in the HGEA region that will add to the tsunami that has already been triggered by the earthquake. In these scenarios, however, the ground-shaking may be the dominant hazard to the northern HGEA cities, leaving the tsunami as a secondary contributor to the overall risk (see further discussion on this issue in Elat Fault–The Worst-Case Scenario). Therefore, we find the AE2 scenario to be the worst-case scenario for Elat city (Table 4) and AE3 the worst one for Aqaba city. A similar cascading suite of hazards was triggered by the 2018 Sulawesi, Indonesia, Mw 7.5 strike-slip earthquake (Goda et al., 2019), which had devastating consequences for Palu Bay. We thus searched for a comparable realistic occurrence in the HGEA region and identified the EF that stretches along the western margins of the southern Arava Valley and continues into the sea (Figure 1B).
Realistic Elat Fault Tsunami Scenario
Following the understanding that the EF is the actual worst-case scenario for Elat city due to its potential for generating the highest ground accelerations and the largest coseismic subsidence, we simulated the resulting earthquake tsunami as well as submarine-landslide tsunami. The EF has been mapped on land (geological map of Beyth et al., 2018, scale of 1:50,000), and in the sea (Reches et al., 1987; Hartman et al., 2014). Paleoseismic evidence show that this fault ruptured Late Pleistocene–Holocene erosion fans that descend from the Elat mountains toward the rift valley (Amit et al., 2002).
To simulate the potential impact of a tsunami generated by the EF, we determined its source parameters as follows: the length was taken from the geological and bathymetric maps (Beyth et al., (2018); Hartman et al., (2014), respectively) as 20 km. The 20-km depth to the seismogenic zone (width of the fault) was adopted from Aldersons and Ben-Avraham (2014). Hofstetter et al. (2014) proposed a 25-km depth but this is related to the DST plate border, whereas the EF is a marginal fault. The worst rupture was set to a vertical offset of 3.5 m, to reflect simultaneous rupture of several nearby parallel segments, such as was found by Amit et al. (2002). Such an offset indicates a maximal magnitude of Mw = 7.1 that satisfies the empirical relationships of maximum surface displacement with moment magnitude (Wells and Coppersmith, 1994). Given the average 1 mm/year slip rate of the EF (Hartman et al., 2014), the repeat time of the modeled scenario would be 3,500 years. The actual dip of the EF in the subsurface is not known. Consequently, we set it to 75°E to account for the worst subsidence of a normal fault.
The EF scenario was enacted using two different approaches. The first was with GeoClaw, similar to the previous scenarios. A snapshot of the first second shows a sharp drop of water east of the fault against a rise west of the fault (Figure 6), which is driven by the coseismic deformation. This is also reflected by the Elat gauge which shows a fast drop of about 2.5 m within 3 min after the earthquake and then an immediate rise to 2.7 masl (Figure 6 and Table 3). The Taba gauge experiences a 1 m rise from the earthquake deformation and then a sharp drop to four mbsl within 2.5 min. The Aqaba gauge encounters waves that fluctuate between -1 and +1 m in the first 10 min, and then a slow attenuation.
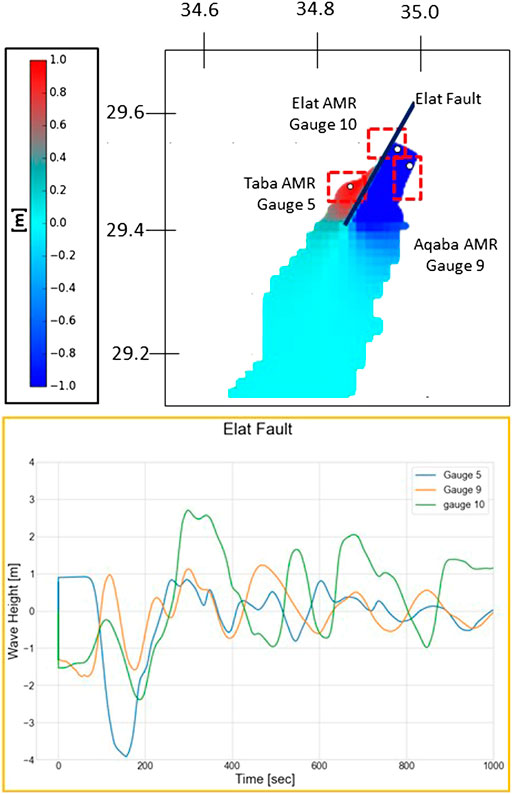
FIGURE 6. Elat fault (EF, black line) tsunami scenario simulated by GeoClaw. See Realistic Elat Fault Tsunami Scenario for detailed explanation and Figure 1 for the location. The upper figure shows a snapshot of the water surface taken 1 s after the start of the simulated event, and the lower diagram presents waveforms of the first 1,000 s as recorded by the artificial tide gauges of Taba (gauge #5), Elat (10#) and Aqaba (#9). Note the coseismic deformation effect on the tide gauges at the start of the event (time = 0): Taba (#5) goes up and Elat (#10) and Aqaba (9#) goes down. AMR locations are marked by red, dashed line squares.
The second approach followed Ward’s (2011) methodology. At 11 min and 12 s, the waves reach 3 and 5 m along several sections of the western and eastern sides of the HGEA, respectively (Figure 7, red and blue lines on the right side diagram, respectively). In general, at that time, the waves along the Aqaba coast are about 2 m higher than in Elat. In Elat, the maximal wave height reaches around 4 m and the maximal current speed reaches about 2 m/s (Figure 7).
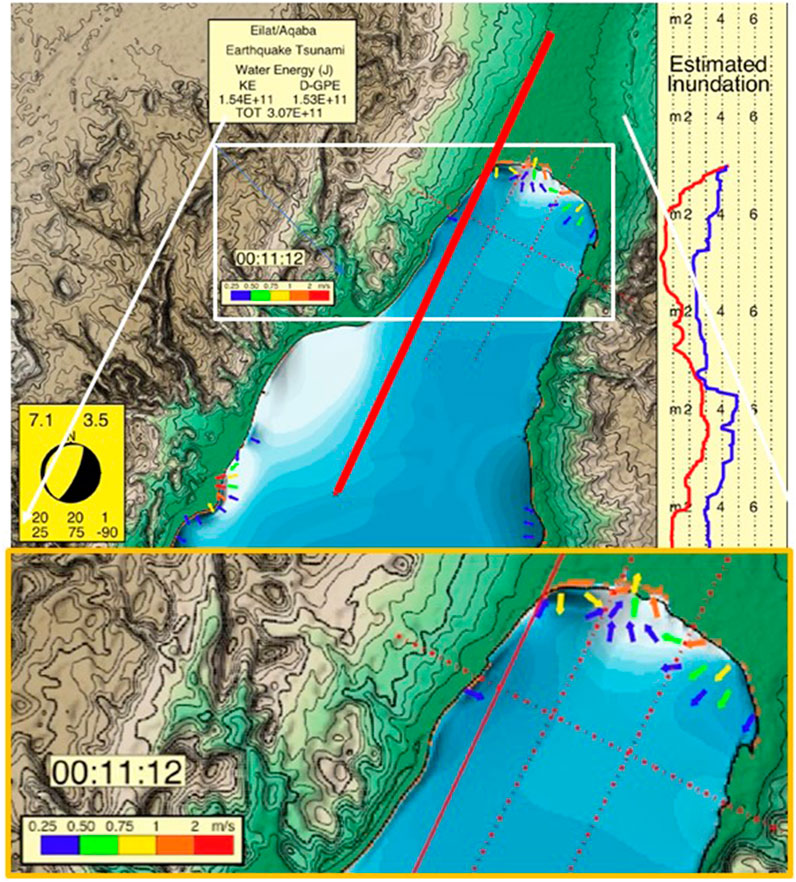
FIGURE 7. Snapshot of the Elat fault (EF; red line) scenario at 11 min and 12 s after the start. Note the maximal wave heights achieved so far in this run along the western and eastern coasts (red and blue lines, respectively, on the right-side diagram). Flow velocities and directions along the coasts at this stage of the simulation are represented by small color coded arrows (enlarged map at the bottom).
Overall, the GeoClaw scenario shows a maximum wave height of 2.7 m along the northern HGEA coast (Elat gauge), whereas Ward’s (2011) approach results in ∼4 m there. Considering that the GeoClaw wave height refers to the initial sea level datum, there is a need to add the coseismic drop of 1.5 m to get the actual wave height above ground at that gauge (Figure 6) That brings the GeoClaw wave height to 4.2 m, not much different from Ward’s (2011) 4 m inundation at the coast.
Submarine-Landslide Scenario
Of the various submarine-landslide areas described in Table 2 and Figure 3, the ‘big slide’ along the western slopes of the submarine Elat canyon (‘b’ in Figure 3) has the potential to generate the worst tsunami, due to its largest volume. Such a scenario was run with the Tsunami Square approach (Wang et al., 2015). The simulation shows that the maximal wave height at the eastern HGEA shores arrives within 2 min and reaches ∼8 m (Figure 8). The reason is that the slide moves eastward and most of its energy is transferred to the waves in this direction. In Elat, the waves reach ∼3 m and along the western HGEA coast, ∼4 m. The slumps on the eastern side of the HGEA (Figure 3 and Table 2) are much smaller than those on the western side (A and B in Figure 3 and Table 2) and therefore are not expected to generate waves higher than those obtained in the current scenario.
FIGURE 8. Snapshot of the submarine-landslide tsunami at the head of the Gulf of Elat–Aqaba (HGEA) 2 min and 6 s after the start. The simulation followed the ‘Tsunami Squares’ approach (Wang et al., 2015). Maximal wave heights achieved until this moment along the western and eastern coasts are presented on the central diagram (red and blue lines, respectively). NW–SE cross sections (along the white dashed line on the map) on the right show the propagation of the waves. Note the location of the landslide on the map (white star) and the scar on the bathymetry in the upper cross section. The lower section zooms in on the vertical dimension and shows the shape and height of the advancing wave. Diagram on the right shows maximal wave heights achieved 10.5 min after the start.
Discussion
Elat Fault–The Worst-Case Scenario
The modeled earthquake tsunamis along the western and eastern HGEA margins, especially AE2, are able to generate the largest tsunami waves from coseismic deformation (Table 4). They can also induce tsunamis from seismogenic submarine landslides. Even worse, the local subsidence can intensify the inundation along the HGEA coastal cities. It is reasonable to assume that the most serious effect, however, is the severe shaking from the earthquake that can spread destruction across the cities. In this case, the damage from a tsunami that is limited to the narrow coastal areas will not be the main concern. The Sulawesi, Indonesia, 2018 sequence of earthquake and then tsunami in Palu Bay shows that such a cascading scenario is feasible (Goda et al., 2019).
Turning from conceptual modeling to the actual geology and seismotectonics of the HGEA region, the EF was found to pose the most severe threat to Elat city. While the Israeli design provisions for earthquake resistance of residential structures (Israel Standard, 2012) points to planning with a peak ground acceleration (PGA) of 0.21 g (10% @ 50 years) in Elat city, ground motion from a Mw 7.1 earthquake on the EF can reach at least >0.3 g in the city, much above the Israeli Standard. Levi et al. (2015) examined expected losses from a Mw seven earthquake in Elat city and showed that “…more than 60% of residential buildings are expected to be ‘extensively and completely damaged’, whereas more than 20% of the commercial buildings are expected to be extensively or completely damaged, highlighting the relatively high vulnerability of residential construction … and the number of estimated fatalities range between a few and up to hundreds.” Although a tsunami damage assessment has not yet been done for Elat city, the zone vulnerable to tsunami inundation along the coast is not expected to affect the residential district, and thus we expect that earthquake damage will be higher than tsunami damage. In the following, we discuss the tsunami hazard posed by the EF on Elat city.
Maximal Wave Height
Focusing on the northernmost HGEA coast and particularly on Elat, the maximal wave height of a tsunami following an earthquake in the EF scenario reaches 4.2 m by GeoClaw (Realistic Elat Fault Tsunami Scenario and Figure 6) and 4 m by Ward’s (2011) approach (Figure 7). The landslide-tsunami scenario shows a 3 m wave height in Elat and 4 m along the western coast of the HGEA (Figure 8). Overall, it is suggested that 4 m maximal tsunami wave height along these coasts be considered a provisional value until probabilistic investigation is performed. Such an investigation will need to consider the uncertainties and unknowns (Limitations and Uncertainties), including the effect of a combined earthquake- and landslide-tsunami scenario on maximal wave height, which is not trivial at all. The interference between the two different tsunamis depends on many factors such as the time delay of the submarine landslide in relation to the earthquake, the evolution and kinematics of the landslide, and more.
Evacuation Zone
In light of the given uncertainties and limitations, the present outcomes are suitable for delineating a tsunami evacuation zone rather than an inundation map. Here we followed the Attenuation Model proposed by the New Zealand Ministry of Civil Defense and Emergency Management (Figure 38 in MCDEM, 2016). This model was tested against data from the 2011 Japan tsunami (Fraser and Power, 2013) and was found to be conservative and reliable. We thus constructed the map of an evacuation zone relevant to the Israeli HGEA coast (Figure 9) on the base of the 25 m DEM of Israel (Hall, 1993; Hall, 1997). First, we doubled the recommended wave height along the coast from 4 to 8 m, and then extrapolated this line landward in a descending slope of 1:200 until it meets with the nearest topography. The resulting map shows that on the northernmost coast, the evacuation zone covers the southern hotel district of Elat, but does not reach the residential district (Figure 9). On the west, it encircles the local port and coastal infrastructure facilities. We further examined how sensitive the delineated evacuation zone is to the maximal wave height at the coast, and introduced the values of 2 and 6 m (Figure 9). While the map shows a slight change on the western coast where the topography is steep, the evacuation zone along the northern, gentle slopes decreases or increases, respectively. Future assessment is certainly needed to verify the maximal wave height in order to delimit the zones that are vulnerable to inundation and construct the evacuation map.
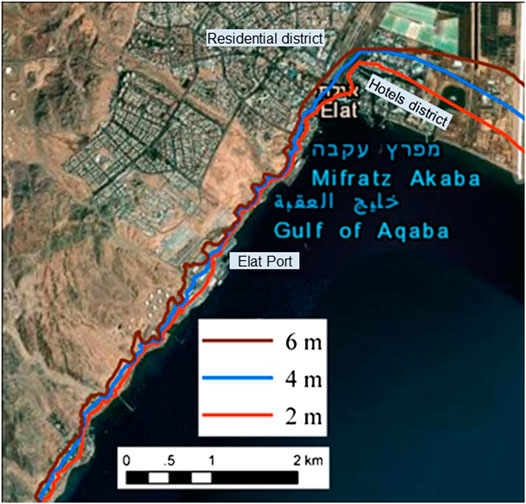
FIGURE 9. Proposed evacuation zone along the Israeli HGEA coast. The blue line delimits the evacuation zone constructed according to the Attenuation Model (MCDEM, 2016), on the basis of 4-m wave height along the coast. For comparison, the red and brown lines delineate evacuation zones for wave heights of 2 and 6 m along the coast, respectively. See Evacuation Zone for detailed explanation. Background map from Google Earth: © 2020 Google, US Dept of State Geographer, Image © 2020 Maxar Technologies, © 2020 ORION-ME.
Return Period
Because earthquakes cannot be predicted, neither can the tsunamis that follow earthquakes or seismogenic submarine slides. Nevertheless, there are several approaches that may hint at the average repeat time of strong earthquakes, although experience shows that it varies a great deal with time.
Recorded seismicity, which shows earthquake frequency with time (Gutenberg–Richter relationship), can be extrapolated to high magnitudes to figure out the expected repeat times. This has already been done for Israeli Building Code SI-413 (Shapira and Hofstetter, 2002) for the three GEA basins, as well as for the Arava Valley north of the HGEA (Table 5). It appears that M > 6 earthquakes may affect the GEA once in a century and M > 7 earthquakes, once in a millennium.
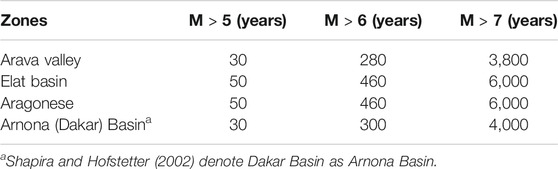
TABLE 5. Repeat time (by magnitude in years) of strong earthquakes in the southern Arava Valley and Gulf of Elat–Aqaba (GEA) basins according to Building Code SI-413 (data and terminology after Shapira and Hofstetter, 2002).
Long-term seismicity: A comprehensive evaluation that combines recorded and historical seismicity, as well as paleoseismic evidence from the past 60,000 years along the southern Arava Valley (Hamiel et al., 2009), shows a repeat time of 500 years for Mw ∼ 6 events and 5,000 years for Mw ∼ 7 events. These are longer return periods than those given by present-day seismicity in the Arava Valley (Table 5, first row).
Seismotectonic considerations: As we were interested in the return period of the faults that pose the highest tsunami hazard to the HGEA, either directly by earthquake or by submarine failure, we focused on the marginal faults of the Elat Basin (scenarios AE2 and AE3) and the main transform (scenario AE1). The estimated repeat times of these structures are 3,000, 7,500 and 1,000 years, respectively (Table 1), and 700 years if combined. This estimate includes the return period of the EF, which in fact, is the realization of the AE2 scenario (Realistic Elat Fault Tsunami Scenario), despite its slightly longer period (3,500 years).
It appears that the maximal magnitude according to seismotectonic considerations is higher than that inferred from modern and long-term seismicity, and the repeat times of strong earthquakes is shorter. The differences may originate from the gap between the actual plate tectonic rate of motion and the lower rate inferred from the actual historic and recorded seismicity (e.g. Garfunkel, 1981; Salamon et al., 1996). A possible explanation is that the analysis of modern and long-term seismicity is based on G-R (Gutenberg–Richter) relationships while the seismotectonic analysis is based on characteristic earthquake behavior. It is also possible that the tectonic motion includes some fraction of a seismic slip that is not present in the earthquake catalogs.
Overall, it can be assumed that the return period of a tsunami in the HGEA, either by an earthquake or via seismogenic submarine landslide, will be longer than the actual seismicity, i.e., Mw > 6 earthquakes once in a century and Mw > 7 once in a millennium. The return time of tsunamis generated by a maximal magnitude earthquake on the main faults modeled in Elat Basin (AE1–3) will not be shorter than 700 years, as inferred from seismotectonic considerations. The return period of the worst-case EF scenario is once in ∼3,500 years.
Limitations and Uncertainties
The limited scope of this preliminary investigation was associated with several unknowns, limitations and uncertainties. First and foremost, identifying the tsunamigenic sources relied on limited geological, seismotectonic and bathymetric data. While the structure of the GEA deep basins is sufficiently recognized (Ben Avraham, 1985), the tectonic elements that form the rift valley had to be presumed and their geometrical dimensions and source parameters had to be inferred from the areal plate tectonics, local geology and bathymetry, and where missing, by expert judgment (Table 1). Indeed, we validated the suitability of our modeling platform on the base of the specific 1995 Nuweiba earthquake and tsunami (Frucht et al., 2019), but examined the other earthquake and landslide scenarios on the base of a conceptual tectonic frame of the GEA. Only after evaluating the resulting scenarios (Table 4) were we able to single out EF and Elat submarine canyon as the real worst-case tsunamigenic sources that threaten Elat city, the focus of this research.
Earthquake-tsunamis by the EF were calculated by two different approaches (Ward, 2011), which gave comparable maximal wave heights of ∼4 m at the coast. However, computational capacity limited us to determining the evacuation zone only, rather than the actual inundation zone. We found that the evacuation zone along the western HGEA coast is not very sensitive to the exact wave height value, whereas the gentle slopes of the northern coast are highly vulnerable and further research is needed to determine the exact runup limits.
Despite these shortcomings, the apparent potential of such a multicascading hazard in the GEA is clear. Nonetheless, concrete modeling is required for a comprehensive understanding of wave heights and extent of inundation in such scenarios, especially in the combined earthquake and landslide scenario.
Conclusion and Recommendations
Seismotectonic considerations, and earthquake and tsunami history show that the GEA is vulnerable to tsunami generation. The worst case that might affect the HGEA is a strong earthquake along the margins of Elat Basin that can generate a combined tsunami due to coseismic deformation and submarine landslide. The associated subsidence may intensify the inundation along the northern HGEA coast. Such an earthquake may occur once in a millennium or so (Return Period), and the WCS once in ∼3,500 years if on the EF. The main concern of such a cascading event, however, is the strong shaking across local urban areas. Palu Bay, following the 2018 Sulawesi, Indonesia Mw 7.5 earthquake (Goda et al., 2019), showed that this is a probable sequence.
A maximal wave height of 4 m along the Israeli portion of the HGEA coast calls for tsunami hazard considerations. We further drafted a map of the evacuation zone for this region (Figure 9), with an understanding of the need to complement the zones of expected inundation, as well as the evacuation map, in a future study. Nevertheless, the outcomes of this research can promote public awareness and education on tsunami hazard, enable preliminary planning of evacuation routes, and support civil protection activities, mong others.
The simulations indicate that tsunami waves generated by earthquakes in Elat Basin hit the HGEA coasts immediately after the earthquake. The events start with immediate retreat of the sea and are followed by high waves within 15 min (Figure 5 and Table 4). Landslide-tsunamis however, bring the high waves to Elat coast within 3 min. Travel time of tsunamis originating from the Aragonese-Arnona and Dakar-Tiran basins in the south are short and arrive at the HGEA in about 10 and 20 min, respectively (Table 4). Thus, strong shaking and retreat of the sea at the HGEA should be considered warnings of a tsunami.
Currently, there is no tsunami warning system in the GEA, and the nearby NEAMTWS system does not monitor this area (http://neamtic.ioc-unesco.org/). It is therefore important to communicate to the public that under the current state of knowledge, strong shaking and retreat of the sea are the main and only tsunami warnings. However, since moderate earthquakes that can feel like strong shaking are not necessarily tsunamigenic, the public should be educated about the inevitability of false alarms, and that these are not a reason to mistrust the notion that strong shaking is a tsunami warning.
Consequently, each country around the GEA needs to rely on its own seismic and tide gauge networks. It is recommended, however, that they all share their data and welcome supporting information from elsewhere. Tsunamis from afar, outside the GEA, seem to pose no significant hazard to the HGEA, but further studies are needed to verify this notion.
This research focused on the HGEA and in particular, on the city of Elat. However, the examined scenarios indicate that tsunami hazard exists, albeit infrequently, all along the GEA coasts and needs to be quantified. It is hoped that this work will raise awareness among those who are part of the GEA and advance focused assessment of the expected hazard and extent of potential risk.
Data Availability Statement
The original contributions presented in the study are included in the article, further inquiries can be directed to the corresponding author/s.
Author Contributions
AS and HG conceived the present idea and coordinated the project. AS planned the project, defined the earthquake and submarines landslide scenarios, and took the lead in writing the manuscript and editing the tables and figures. HG summarized the geology and tectonics of the study area. EG supervised the adoption, preparation and configuration of the GeoClaw numerical model. EF and MG carried out the implementation and brought the GeoClaw to operation. EF performed the GeoClaw computations, interpreted the results and prepared the scenario and waveforms figures. SNW supervised all the tsunami scenarios and simulated tsunamis from the worst-case Elat Fault earthquake and Elat canyon submarine landslide. RS-T assembled and restructured the bathymetry grid. RC prepared the evacuation map. All authors discussed the results and contributed to the final manuscript.
Funding
This work was funded by the Israel Ministry of National Infrastructures, Energy and Water Resources (now Israel Ministry of Energy), Contract No. 213-17-010.
Conflict of Interest
The authors declare that the research was conducted in the absence of any commercial or financial relationships that could be construed as a potential conflict of interest.
Acknowledgments
We thank Mathilde Sørensen and Anita Grezio for thorough reading and detailed comments and suggestions which helped us improve the manuscript. Their effort is very much appreciated. The Editor, Jacopo Selva is acknowledged for handling our submission.
References
Aldersons, F., and Ben-Avraham, Z. (2014). “The seismogenic thickness in the Dead Sea area,” in Dead Sea transform fault system: reviews, modern approaches in solid earth sciences. Editors Z. Garfunkel, Z. Ben-Avraham, and E. Kagan (Dordrecht, Netherlands: Springer), 53–89.
Al-Homoud, A. S., and Tal, A. B. (1998). Geotechnical study for evaluating stability and restoration work at the 1000 year old archaeological site of Ayla, Gulf of Aqaba, Kingdom of Jordan. Environ. Eng. Geosci. 4 (1), 103–114. doi:10.2113/gseegeosci.IV.1.103
Ambraseys, N. N. (2009). Earthquakes in the mediterranean and Middle East. A multidisciplinary study of seismicity up to 1900. New York, NY: Cambridge University Press.
Amit, R., Zilberman, E., Enzel, Y., and Porat, N. (2002). Paleoseismic evidence for time dependency of seismic response on a fault system in the southern Arava Valley, Dead Sea rift, Israel. Geol. Soc. Am. Bull. 114, 192–206. doi:10.1130/0016-7606(2002)114<0192:PEFTDO>2.0.CO;2
Amit, R., Zilberman, E., Porat, M., and Enzel, Y. (1999). Relief inversion in the Avrona playa as evidence of large-magnitude historic earthquakes, southern Arava valley, dead sea rift. Quat. Res. 52, 76–91. doi:10.1006/qres.1999.2050
Ash-Mor, A., Bookman, R., Kanari, M., Ben-Avraham, Z., and Almogi-Labin, A. (2017). Micropaleontological and taphonomic characteristics of mass transport deposits in the northern Gulf of Eilat/Aqaba, Red Sea. Mar. Geol. 391, 36–47. doi:10.1016/j.margeo.2017.07.009
Baer, G., Funning, G. J., Shamir, G., and Wright, T. J. (2008). The 1995 November 22, Mw 7.2 gulf of Elat earthquake cycle revisited. Geophys. J. Int. 175, 1040–1054. doi:10.1111/j.1365-246X.2008.03901.x
Bartov, Y., Steinitz, G., Eyal, M., and Eyal, Y. (1980). Sinistral movement along the gulf of aqaba—its age and relation to the opening of the Red Sea. Nature. 285, 220–221. doi:10.1038/285220a0
Basili, R., Tiberti, M. M., Kastelic, V., Romano, F., Piatanesi, A., Selva, J., et al. (2013). Integrating geologic fault data into tsunami hazard studies. Nat. Hazards Earth Syst. Sci. 13, 1025–1050. doi:10.5194/nhess-13-1025-2013
Ben-Avraham, Z. (1985). Structural framework of the gulf of Elat (AQABA), northern Red Sea. J. Geophys. Res. Solid Earth 90, 703–726. doi:10.1029/JB090iB01p00703
Ben-Avraham, Z., Almagor, G., and Garfunkel, Z. (1979). Sediments and structure of the gulf of Elat (Aqaba)—northern Red Sea. Sediment. Geol. 23, 239–267. doi:10.1016/0037-0738(79)90016-2
Ben-Avraham, Z., Garfunkel, Z., and Lazar, M. (2008). Geology and evolution of the southern dead sea fault with emphasis on subsurface structure. Annu. Rev. Earth Planet Sci. 36, 357–387. doi:10.1146/annurev.earth.36.031207.124201
Ben-Avraham, Z., Lazar, M., Garfunkel, Z., Reshef, M., Ginzburg, A., Rotstein, Y., et al. (2012). “Structural styles along the Dead Sea fault,” in Regional geology and tectonics: phanerozoic passive margins, cratonic basins and global tectonic maps. Editors D. G. Roberts, and A. W. Bally (Burlington, MA: Elsevier), 617–634.
Ben-Avraham, Z., and Tibor, G. (1993). The northern edge of the Gulf of Eilat. Tectonophysics 226, 319–331. doi:10.1016/0040-1951(93)90125-4
Ben-Menahem, A. (1991). Four thousand years of seismicity along the Dead Sea rift. J. Geophys. Res. 91, 20195–20216. doi:10.1029/91JB01936
Berger, M. J., George, D. L., LeVeque, R. J., and Mandli, K. T. (2011). The GeoClaw software for depth-averaged flows with adaptive refinement. Adv. Water Resour. 34 (9), 1195–1206. doi:10.1016/j.advwatres.2011.02.016
Beyth, M., Eyal, Y., and Garfunkel, Z. (2018). Geological map of Israel 1:50,000, elat sheet 26-I,II. Available at: https://www.gov.il/he/departments/general/eilat-map (Accessed August 27, 2020).
Clawpack Development Team (2017). Clawpack version 5.4.0. Available at: http://www.clawpack.orghttp://www.bosai.go.jp/study/application/dc3d/DC3Dhtml_E.html (Accessed August 27, 2020).
FEMA (2017). Hazus tsunami model user guidance. Washington DC, United States: Federal Emergency Management Agency.
Fraser, S. A., and Power, W. L. (2013). Validation of a GIS-based attenuation rule for indicative tsunami evacuation zone mapping. Report 2013/02.
Freund, R., Zak, I., and Garfunkel, Z. (1968). Age and rate of the sinistral movement along the Dead Sea rift. Nature. 220, 253–255. doi:10.1038/220253a0
Frucht, E., Salamon, A., Gal, E., Ginat, H., Grigorovitch, M., Shem Tov, R., et al. (2019). A fresh view of the tsunami generated by the Dead Sea transform, 1995 Mw 7.2 Nuweiba EARTHQUAKE, along the Gulf of Elat-Aqaba. Seismol Res. Lett. 90 (4), 1483–1493. doi:10.1785/0220190004
Galanti, B., and Salamon, A. (2017). Simulation of tsunami scenarios along the mediterranean coast of Israel, final report. Israel oceanographic and limnological research LTD report H48/2015. Geological Survey of Israel. Rep. GSI/26/2017.
Garfunkel, Z. (1981). Internal structure of the Dead Sea leaky transform (rift) in relation to plate kinematics. Tectonophysics 80, 81–108. doi:10.1016/0040-1951(81)90143-8
Garfunkel, Z. (2014). “Lateral motion and deformation along the Dead Sea transform,” in Dead Sea transform system reviews. Editors Z. Garfunkel, Z. Ben-Avraham, and A. Kagan (Dordrecht, Netherlands: Springer), 109–151.
Geist, E. L., and Oglesby, D. D. (2014). “Earthquake mechanism and seafloor deformation for tsunami generation,” in Encyclopedia of earthquake engineering. Editors M. Beer, I. A. Kougioumtzoglou, E. Patelli, and I. S.-K. Au (Berlin, Heidelberg: Springer), 1–17.
Geist, E. L., Oglesby, D. D., and Ryan, K. J. (2019). “Tsunamis: stochastic models of occurrence and generation mechanisms,” in Encyclopedia of complexity and systems science. Editor R. A. Meyers (Berlin, Heidelberg: Springer), 1–30.
Goda, K., Mori, N., Yasuda, T., Prasetyo, A., Muhammad, A., and Tsujio, D. (2019). Cascading geological hazards and risks of the 2018 Sulawesi Indonesia earthquake and sensitivity analysis of tsunami inundation simulations. Front. Earth Sci. 7, 261. doi:10.3389/feart.2019.00261
Goodman-Tchernov, B., Katz, T., Shaked, Y., Qupty, N., Kanari, M., Neimi, T., et al. (2016). Offshore evidence for an undocumented tsunami event in the ‘low risk’ Gulf of Aqaba-Eilat, Northern Red Sea. PloS One 11 (1), 1–14. doi:10.1371/journal.pone.0145802
Guidoboni, E., and Comastri, A. (2005). Catalogue of earthquakes and tsunamis in the mediterranean area from the 11th to the 15th century. Bologna, Italy: INGV-SGA.
Hall, J. K. (1997). Landform of Israel and adjacent areas, 1:500,000 scale. Jerusalem, Israel: Geological Survey of Israel.
Hall, J. K. (1993). The GSI digital terrain model (DTM) project completed. Geol. Surv. Isr. Curr. Res. 8, 47–50.
Hall, J. K., and Ben-Avraham, Z. (1978). Bathymetric chart of the gulf of Elat, scale 1:250,000. Jerusalem, Israel: Geological Survey of Israel.
Hamiel, Y., Amit, R., Begin, Z. B., Marco, S., Katz, O., Salamon, A., et al. (2009). The seismicity along the Dead Sea Fault during the last 60,000 years. Bull. Seismol. Soc. Am. 99, 2020–2026. doi:10.1785/0120080218
Hamiel, Y., Masson, F., Piatibratova, O., and Mizrahi, Y. (2018). GPS measurements of crustal deformation across the southern Arava Valley section of the Dead Sea Fault and implications to regional seismic hazard assessment. Tectonophysics 724–725, 171–178. doi:10.1016/j.tecto.2018.01.016
Harbitz, C. B., Løvholt, F., and Bungum, H. (2014). Submarine landslide tsunamis: how extreme and how likely? Nat. Hazards. 72 (3), 1341–1374. doi:10.1007/s11069-013-0681-3
Hartman, G., Niemi, T. M., Tibor, G., Ben-Avraham, Z., Al-Zoubi, A., Makovsky, Y., et al. (2014). Quaternary tectonic evolution of the northern gulf of elat/aqaba along the Dead Sea transform. J. Geophys. Res. Solid Earth 119, 1–23. doi:10.1002/2013JB010879
Hofstetter, A., Dorbath, C., and Dorbath, L. (2014). “Instrumental data on the seismic activity along the Dead Sea transform,” in Dead Sea transform fault system: reviews, Modern approaches in solid earth sciences. Editors Z. Garfunkel, Z. Ben-Avraham, and E. Kagan (Dordrecht, Netherlands: Springer), 263–278.
Huhn, K., Arroyo, M., Cattaneo, A., Clare, M. A., Gràcia, E., Harbitz, C. B., et al. (2019). “Modern submarine landslide complexes: a short review,” in Submarine landslides: subaqueous mass transport deposits from outcrops to seismic profiles. Editors K. Ogata, A. Festa, and G. A. Pini (Washington D.C., United States: American Geophysical Union), 181–200.
Imamura, F., Gica, E., Takahashi, T., and Shuto, N. (1995). Numerical simulation of the 1992 flores tsunami: interpretation of tsunami phenomena in northeastern flores island and damage at babi island. Pure Appl. Geophys. 144, 555–568. doi:10.1007/BF00874383
Israel Standard (2012). Israel Standard, SI, 413, 1995/2004, amendment No. 5, 2012 Design provisions for earthquake resistance of structures. Tel-Aviv, Israel: The Standards Institution of Israel. Available at: https://ibr.sii.org.il/ibr/#/about.
Kanari, M., Ben-Avraham, Z., Tibor, G., Bookman, R., Goddman-Tchernov, B. N., Neimi, T. M., et al. (2014). “On-land and offshore evidence for Holocene earthquakes in the northern gulf of aqaba-elat, Israel/Jordan,” in 6th international INQUA Meeting on paleoseismology, active tectonic and archeoseismology, Pescina, Italy, 19–24 April, 2015. Roma, Italy: Miscellanea INGV, 240–243.
Kim, J., Løvholt, F., Issler, D., and Forsberg, C. F. (2019). Landslide material control on tsunami genesis—the Storegga Slide and tsunami (8,100 years BP). J. Geophys. Res. Oceans 124 (6), 3607–3627. doi:10.1029/2018JC014893
Klinger, Y., Le Béon, M., and Al-Qaryouti, M. (2015). 5000 yr of paleoseismicity along the southern Dead Sea fault. Geophys. J. Int. 202, 313–327. doi:10.1093/gji/ggv134
Lefevre, M., Klinger, Y., Al-Qaryouti, M., Le Béon, M., and Moumani, K. (2018). Slip deficit and temporal clustering along the Dead Sea fault from paleoseismological investigations. Sci. Rep. 8, 4511. doi:10.1038/s41598-018-22627-9
LeVeque, R. J. (2006). Clawpack software. Available at: http://www.clawpack.org (Accessed August 27, 2020). [
Levi, T., Bausch, D., Katz, O., Rozelle, J., and Salamon, A. (2015). Insights from hazus loss estimations in Israel for Dead Sea transform earthquakes. Nat. Hazards 75, 365–388. doi:10.1007/s11069-014-1325-y
Løvholt, F., Bondevik, S., Laberg, J. S., Kim, J., and Boylan, N. (2017). Some giant submarine landslides do not produce large tsunamis. Geophys. Res. Lett. 44 (16), 8463–8472. doi:10.1002/2017GL074062
Løvholt, F., Glimsdal, S., and Harbitz, C. B. (2020). On the landslide tsunami uncertainty and hazard. Landslides 17, 2301–2315. doi:10.1007/s10346-020-01429-z
Løvholt, F., Pedersen, G., Harbitz, C. B., Glimsdal, S., and Kim, J. (2015). On the characteristics of landslide tsunamis. Phil. Trans. R. Soc. A. 373, 20140376. doi:10.1098/rsta.2014.0376
Makovsky, Y., Wunch, A., Ariely, R., Shaked, Y., Rivlin, A., Shemesh, A., et al. (2008). Quaternary transform kinematics constrained by sequence stratigraphy and submerged coastline features: the Gulf of Aqaba. Earth Planet Sci. Lett. 271, 109–122. doi:10.1016/j.epsl.2008.03.057
MCDEM (2016). Tsunami evacuation zones, director’s guideline for civil defence emergency management groups. Available at: http://www.civildefence.govt.nz/assets/Uploads/publications/dgl-08-16-Tsunami-Evacuation-Zones.pdf (Accessed August 27, 2020).
Miller, D. J. (1960). Giant waves in Lituya bay, Alaska. U.S. Geological Survey. Professional Paper 354-C.
Okada, Y. (1992). Internal deformation due to shear and tensile faults in a half space. Bull. Seismol. Soc. Am. 82, 1018–1040.
Okada, Y. (1985). Surface deformation due to shear and tensile faults in a half-space. Bull. Seismol. Soc. Am. 75, 1135–1154.
Okal, E. A. (2015). The quest for wisdom: lessons from 17 tsunamis, 2004–2014. Phil. Trans. Math. Phys. Eng. Sci. 373, 20140370. doi:10.1098/rsta.2014.0370
Polet, J., and Kanamori, H. (2016). “Tsunami earthquakes,” in Encyclopedia of Complexity and systems science. Editor R. A. Meyers (Berlin, Germany: Springer), 1–22.
Quennell, A. M. (1959). The structural and geomorphic evolution of the Dead Sea Rift. Quart. J. Geol. Soc. 144, 1–24. doi:10.1144/gsjgs.114.1.0001
Reches, Z., Erez, J., and Garfunkel, Z. (1987). Sedimentary and tectonic features in the northwestern Gulf of Elat, Israel. Tectonophysics 141, 169–180. doi:10.1016/0040-1951(87)90183-1
Sade, A. R., Hall, J. K., Tibor, G., Neimi, T. M., Ben-Avraham, Z., Al-Zoubi, A., et al. (2008). Multibeam bathymetry of the northern gulf of ‘aqaba/elat. GSI Rep. GSI/03/2008, IOLR Rep. IOLR/08/2008, MDSRC Rep. MDSRC/02/2008.
Salamon, A., and Di Manna, P. (2019). Empirical constraints on magnitude-distance relationships for seismically induced submarine tsunamigenic landslides. Earth Sci. Rev. 191, 66–92. doi:10.1016/j.earscirev.2019.02.001
Salamon, A., Hofstetter, A., Garfunkel, Z., and Ron, H. (1996). Seismicity of the eastern Mediterranean region: perspective from the Sinai subplate. Tectonophysics 263, 293–305. doi:10.1016/S0040-1951(96)00030-3
Salamon, A., Hofstetter, A., Garfunkel, Z., and Ron, H. (2003). Seismotectonics of the Sinai subplate – the eastern Mediterranean region. Geophys. J. Int. 155, 149–173. doi:10.1046/j.1365-246X.2003.02017.x
Salamon, A. (2011). “Potential tsunamigenic sources in the eastern Mediterranean and a decision matrix for a tsunami early warning system,” in Marine Geo-Hazards in the Mediterranean, Workshop Monographs, Rapports et Procés-Verbaux des Réunions de la Commission Internationale pour l’Exploration Scientifique de la Mer Méditeranée (CIESM). Editor F. Briand (Monaco, United Kingdom: CIESM), 35–42.
Salamon, A., Rockwell, T., Guidoboni, E., and Comastri, A. (2010). A critical evaluation of tsunami records reported for the Levant coast from the second millennium BCE to the present, Israel. Isr. J. Earth Sci. 58 (3-4), 327–354. doi:10.1560/IJES.58.2-3.327
Salamon, A., Rockwell, T., Ward, S. N., Guidoboni, E., and Comastri, A. (2007). Tsunami hazard evaluation of the eastern Mediterranean: historical analysis and selected modeling. Bull. Seismol. Soc. Am. 97 (3), 705–724. doi:10.1785/0120060147
Salamon, A., Rosen, D. S., Gitterman, Y., Yahav, A., Ben-Arieh, S., Debutton, Y., et al. (2014). Recommendations on the policy, warning principles and frame of preparedness for tsunamis in Israel. The scientific committee for formulating policy of early warning principles for tsunami hazards in Israel. Geological survey of Israel report GSI/16/2014. Geophysical Institute of Israel. Rep. 30/797/14.
Salem, E. M. (2009). Paleo-tsunami deposits on the Red Sea beach, Egypt, arabian. J. Geosci. 2, 185–197. doi:10.1007/s12517-008-0027-8
Selva, J., Tonini, R., Molinari, I., Tiberti, M. M., Romano, F., Grezio, A., et al. (2016). Quantification of source uncertainties in seismic probabilistic tsunami hazard analysis (SPTHA). Geophys. J. Int. 205, 1780–1803. doi:10.1093/gji/ggw107
Shaked, Y., Agnon, A., Lazar, B., Marco, S., Avner, U., and Stein, M. (2004). Large earthquakes kill coral reefs at the north-west Gulf of Aqaba. Terra. Nova. 6, 133–138. doi:10.1111/j.1365-3121.2004.00541.x
Shapira, A., and Hofstetter, A. (2002). Seismic parameters of seismogenic zones. Appendix C in: Shapira A. 2002. An updated map of peak ground accelerations for Israel Standard 413. GII Rep. 592/230/02, 74 pp.
Shapira, A., and Hofstetter, A. (1993). Source parameters and scaling relationships of earthquakes in Israel. Tectonophysics 217, 217–229. doi:10.1016/0040-1951(93)90005-5
Synolakis, C. E., Bardet, J.-P., Borrero, J., Davies, H., Okal, E., Silver, E., et al. (2002). The slump origin of the 1998 Papua New Guinea tsunami. Proc. R. Soc. Lond. Ser. A. 458, 763–789. doi:10.1098/rspa.2001.0915
Thingbaijam, K. K. S., Mai, P. M., and Goda, K. (2017). New empirical earthquake source‐scaling laws. Bull. Seismol. Soc. Am. 107, 2225–2246. doi:10.1785/0120170017
Tibor, G., Neimi, T., and Ben-Avraham, Z. (2010). Active tectonic morphology and submarine deformation of the northern Gulf of Eilat/Aqaba from analyses of multibeam data. Geo Mar. Lett. 30, 561–573. doi:10.1007/s00367-010-0194-y
Walter, T. R., Haghshenas Haghighi, M., Schneider, F. M., Coppola, D., Motagh, M., Saul, J., et al. (2019). Complex hazard cascade culminating in the Anak Krakatau sector collapse. Nat. Commun. 10, 4339. doi:10.1038/s41467-019-12284-5
Wang, J., Ward, S., and Xiao, L. (2015). Numerical modelling of rapid, flow-like landslides across 3-D terrains: a Tsunami Squares approach to El Picacho landslide, El Salvador, September 19, 1982. Geophys. J. Int. 201, 1534–1544. doi:10.1093/gji/ggv095
Ward, S. N. (2011). “Tsunami,” in The encyclopedia of solid earth geophysics. Editor H. Gupta (Dordrecht, Netherlands: Springer Press), 1473–1493.
Ward, S. N., and Day, S. (2008). Tsunami balls: a granular approach to tsunami runup and inundation. Commun. Comput. Phys. 3 (1), 222–249.
Wells, D. L., and Coppersmith, K. J. (1994). New empirical relationships among magnitude, rupture length, rupture width, rupture area, and surface displacement. Bull. Seismol. Soc. Am. 84 (4), 974–1002.
Winters, G., Edelist, D., Shem-Tov, R., Beer, S., and Rilov, G. (2017). A low-cost field-survey method for mapping seagrasses and their potential threats: an example from the northern Gulf of Aqaba, Red Sea. Aquat. Conserv. Mar. Freshw. Ecosyst. 27, 324–339. doi:10.1002/aqc.2688
Wust, H.. (1997). The November 22, 1995, Nuweiba earthquake, Gulf of Elat (Aqaba), Post-seismic analysis of failure features and seismic hazard implications. Geological Survey of Israel Rep. GSI/3/97.
Xiao, L., Ward, S. N., and Wang, J. (2015). Tsunami squares approach to landslide-generated waves: application to gongjiafang landslide, three gorges reservoir, China. Pure Appl. Geophys. 172, 3639–3654. doi:10.1007/s00024-015-1045-6
Zilberman, E., Amit, R., Porat, N., Enzel, Y., and Avner, U. (2005). Surface ruptures induced by the devastating 1068 AD earthquake in the southern Arava valley, Dead Sea Rift, Israel. Tectonophysics 408, 79–99. doi:10.1016/j.tecto.2005.05.030
Keywords: earthquake-tsunami, Gulf of Elat (Aqaba), landslide-tsunami, multi-hazard, tsunami evacuation zone, worst-case scenario
Citation: Salamon A, Frucht E, Ward SN, Gal E, Grigorovitch M, Shem-Tov R, Calvo R and Ginat H (2021) Tsunami Hazard Evaluation for the Head of the Gulf of Elat–Aqaba, Northeastern Red Sea. Front. Earth Sci. 8:602462. doi: 10.3389/feart.2020.602462
Received: 03 September 2020; Accepted: 17 December 2020;
Published: 28 January 2021.
Edited by:
Jacopo Selva, Istituto Nazionale di Geofisica e Vulcanologia (INGV), ItalyReviewed by:
Mathilde Sørensen, University of Bergen, NorwayAnita Grezio, Istituto Nazionale di Geofisica e Vulcanologia (INGV), Italy
Copyright © 2021 Salamon, Frucht, Ward, Gal, Grigorovitch, Shem-Tov, Calvo and Ginat. This is an open-access article distributed under the terms of the Creative Commons Attribution License (CC BY). The use, distribution or reproduction in other forums is permitted, provided the original author(s) and the copyright owner(s) are credited and that the original publication in this journal is cited, in accordance with accepted academic practice. No use, distribution or reproduction is permitted which does not comply with these terms.
*Correspondence: Amos Salamon, c2FsYW1vbkBnc2kuZ292Lmls