 John I. Ejembi
 Eric C. Ferré
 Sara Satolli
 Sarah A. Friedman
94% of researchers rate our articles as excellent or good
Learn more about the work of our research integrity team to safeguard the quality of each article we publish.
Find out more
ORIGINAL RESEARCH article
Front. Earth Sci., 07 December 2020
Sec. Geomagnetism and Paleomagnetism
Volume 8 - 2020 | https://doi.org/10.3389/feart.2020.601415
This article is part of the Research TopicAdvances in Magnetism of Soils and SedimentsView all 15 articles
The anisotropy of magnetic susceptibility (AMS) in sedimentary rocks results from depositional, diagenetic, syn- and post-sedimentary processes that affect magnetic grains. Some studies have also shown the potential role played by post-depositional fluid flow in detrital and carbonate formations. Here we present a new case study of Middle-Upper Jurassic sandstones where secondary iron oxides, precipitated from fluids that migrated through pores, give rise to the AMS. These sandstones are well exposed in the Uncompahgre Uplift region of the Central Colorado Trough, Colorado. The magnetic foliation of these undeformed, subhorizontal strata consistently strike NE-SW over a large distance with an average 45° dip to the SE. This steep AMS fabric is oblique with respect to the regional subhorizontal bedding and therefore does not reflect the primary sedimentary fabric. Also, outcrop-scale and microscopic observations show a lack of post-depositional plastic (undulose extinction) or pressure-solution (stylolites) deformation microstructures in these sandstones, hence precluding a tectonic origin. The combination of magnetic hysteresis, isothermal remanent magnetization, and thermal demagnetization of the natural remanent magnetization indicate that these rocks carry a chemical remanent magnetization born primarily by hematite and goethite. High-field magnetic hysteresis and electron microscopy indicate that detrital magnetite and authigenic hematite are the main contributors to the AMS. These results show that post-depositional iron remobilization through these porous sandstones took place due to the action of percolating fluids which may have started as early as Late Cretaceous along with the Uncompahgre Uplift. The AMS fabric of porous sandstones does not systematically represent depositional or deformation processes, and caution is urged in the interpretation of magnetic fabrics in these types of reservoir rock. Conversely, understanding these fabrics may advance our knowledge of fluid flow in porous sandstones and may have applications in hydrocarbon exploration.
Fluid-flow through permeable sandstones is a key process in multiple economically important geological processes such as, hydrocarbon migration (e.g., Oliver, 1986; Hunt, 1990; Ungerer et al., 1990), diagenetic alteration through fluid-rock interaction (Chan et al., 2000; Beitler et al., 2005; Potter and Chan, 2011; Potter-McIntyre et al., 2014), groundwater contamination of aquifers (e.g., Massei et al., 2002), or fluid-driven precipitation of ore minerals (e.g., Wilkinson, 2001). Common approaches to characterize regional fluid flow through rocks include fluid geochemistry (Musgrove and Banner, 1993) and hydrodynamic flow models (Wing and Ferry, 2007). For example, Musgrove and Banner (1993) used elemental and stable isotopic signatures in groundwater samples from a Cambro-Ordovician and Mississippian aquifer that were collected from different wells to evaluate the origin and mixing of meteoric and saline fluids in the United States Midcontinent. This approach relies on direct sampling of fluids for geochemical analysis and modeling whereas the hydrodynamic model approach requires multiple topographic relationships to be maintained for an accurate prediction of fluid-flow directions. These approaches, although generally successful, have limited application in ancient geologic systems particularly when fluid-flow is no longer active or when the original paleotopography has been modified either through erosion, alteration or tectonic activity.
In this study, we investigate the magnetic mineralogy, the origin and significance of the anisotropy of magnetic susceptibility (AMS), the NRM, and their implications regarding regional-scale fluid migration. The Jurassic sandstones of this study originate from two sites, located 12 km apart, along the southwest margin of the Central Colorado Trough, on the Eastern flank of the Uncompahgre Uplift: Escalante Canyon—EC and Dominguez Canyon, also known as Bridgeport—BP (Figures 1, 2). The study area in the western Colorado Plateau consists primarily of Mesozoic sedimentary rocks underlain by deeply faulted Proterozoic crystalline basement blocks (Figure 1; e.g., Marshak et al., 2000). The Cenozoic and some Late Mesozoic sedimentary formations in this region have been eroded through successive uplifts (Figures 1, 2; Pederson et al., 2002).
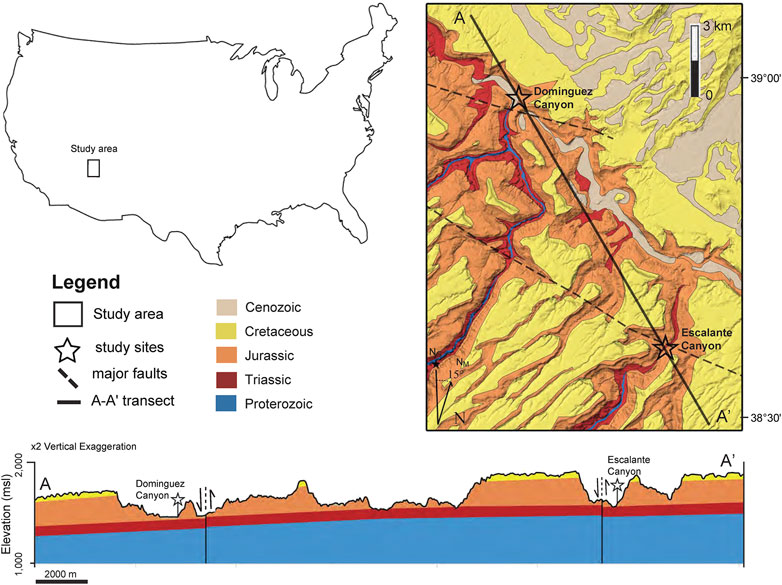
FIGURE 1. Geologe map of the study area in western Colorado (after Tweto and Schoenfeld, 1979) and a northwest to southeast trending geologic cross-section of the study sites. The depth profile across section according to USGS DEM maps of area.
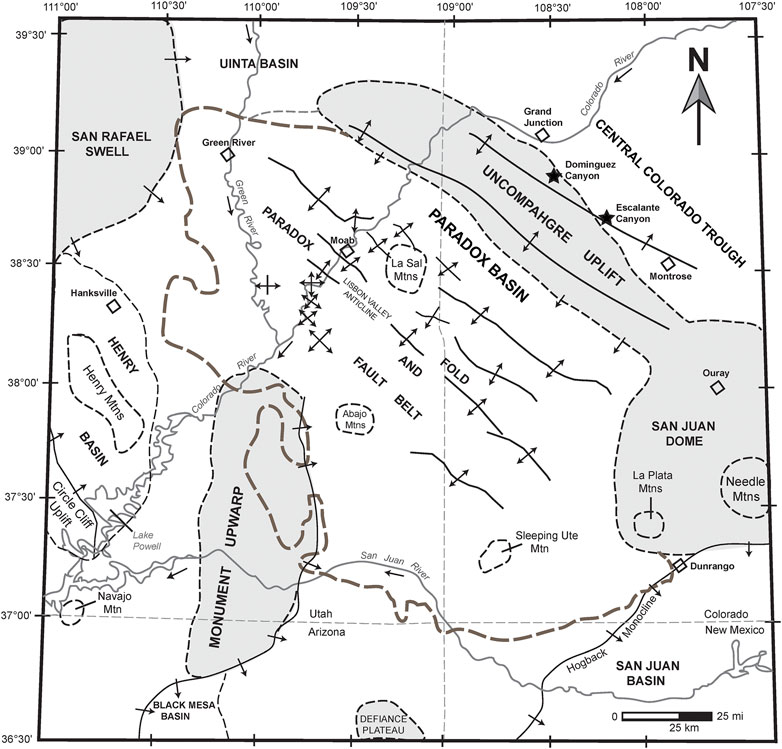
FIGURE 2. Tectonic setting of the Paradox Basion and adjacent areas (after Kelley, 1958). Brown dashed line delineates the extent of the Paradox Basin. The Central Colorado Trough within the Paradox fold and thrust belt collected vast eolian and fluvio-lacustrine deposition during the Middle-Upper Jurassic.
AMS has been an effective tool for tracking paleofluid flow in sedimentary rocks, magma flow in igneous provinces, and hydrothermal fluids caused by mantle upwelling (e.g., Schieber and Ellwood, 1993; Ferré et al., 2002; Sizaret et al., 2006; Essalhi et al., 2009). This method is sensitive to the petrofabric and crystallographic orientations of magnetic mineral grains (Tarling and Hrouda, 1993). The AMS of sediments has been successfully used to characterize syn- and post-depositional processes in sedimentary systems since its introduction by Ising (1942). Examples have been shown for geometry of pore spaces in siliciclastic rocks (Robion et al., 2014; Parés et al., 2016), flow mechanisms and nature of sediment deposition (Dall'Olio et al., 2013), and microscopic strain and deformational structures (e.g., Aubourg et al., 2004; Aubourg et al., 2010; Robion et al., 2007; Burmeister et al., 2009).
The maroon, red, pink and in some cases, tan to grayish colors of the Middle-Late Jurassic sandstones of the Entrada Sandstone, Wanakah Formation, and Tidwell Member of the Morrison Formation in the Paradox Basin and adjacent areas are classic examples of secondary coloration acquired through fluid flow in permeable rocks (Parry et al., 2004; Beitler et al., 2005). The extent to which a primary and depositional fabric is preserved in these rocks, as opposed to a pervasive chemical overprint, constitutes the focus of this study. The magnetic mineralogy itself, along with the magnetic grain morphology, provide useful information on the syn- or post-depositional origin of the AMS. While radiometrically dating the development of the AMS is generally difficult, the paleomagnetic data acquired in our investigations could shed light on the type of AMS in these sandstones. The hypothesis we test using paleomagnetic data, combined with a well-established regional Jurassic-Cretaceous magnetostratigraphy, is that the AMS was acquired during or shortly after deposition, and therefore reflects primarily the sediment transport direction. The alternative hypothesis is that the AMS records a late stage precipitation event related to the downcutting of the Colorado and Gunnison Rivers (Hunt, 1969; Cook et al., 2009).
The study area is situated on the northeastern margin along the Northeast flank of the Uncompahgre Plateau, west of the Central Colorado Trough (Figure 2). To the Southwest of the study area, the Paradox Basin formation began with crustal loading and downward lithospheric flexure during the contractional Pennsylvanian–Permian orogeny that formed the Ancestral Rocky Mountains (Figure 2; Kluth and Coney, 1981; Barbeau, 2003). Basin subsidence continued from the Triassic through Cretaceous. The Paradox Basin and other adjacent basins consist of Paleozoic through Cenozoic strata that unconformably overlie Proterozoic basement rocks that include granitic, high-grade metamorphic gneiss and schist (Tweto and Schoenfeld, 1979; Figure 2). Cretaceous rocks exposed on the Colorado Plateau have mostly been eroded away due to subsequent uplift and downcutting of major fluvial drainages (Figure 1). The Paradox Basin shows a prominent fold-and-fault belt defined by NW-SE striking faults, anticlines, and synclines (Figure 2). Some of these structures are related to salt walls and grabens caused by diapirism of the Paradox Formation (Nuccio and Condon, 1996).
The tectonic layer-parallel shortening (LPS) axis in the Paradox Basin is oriented NE-SW, parallel to the maximum principal stress (Figure 2). Kluth and Coney (1981) interpreted the orientation of this axis and the Ancestral Rocky Mountains as part of a complex intraplate response in the western United States due to the Ouachita-Marathon orogeny, a collision of the North American craton with South America and Africa during the Pennsylvanian. These authors also suggested that the suturing at the southern margin of the North American craton combined with northward directed thrusting from the Marathon region led to a progressive migration of stresses onto the continental interior. Other studies have suggested that 1) the origin of the Paradox Basin structures might be related to compressive stresses from either the Ancestral Rockies or Laramide orogenic events (Marshak et al., 2000) or 2) these structures predates these events but were reactivated along pre-existing faults in the basement (Davis, 1978; Baars and Stevenson, 1981).
The Uncompahgre Uplift was originally interpreted as a Pennsylvanian structure associated with the formation of the Ancestral Rocky Mountains (e.g., Kluth and Coney, 1981). However, recent thermochronological constraints document a far more recent uplift history beginning in the Late Cretaceous (Laramide orogeny) and continuing with deep incision up to the Miocene-Pliocene (Rønnevik et al., 2017).
From oldest to youngest, we collected hand samples (with an average dimension of 15 × 12 × 8 cm) from the Entrada Sandstone, the Wanakah Formation, and the Tidwell Member of the Morrison Formation (Figure 3). Hand samples were georeferenced using hand-held Global Positioning System units (GPS). The geographic orientation of the samples was determined using a magnetic compass, after correction of the magnetic declination (11°E). Hand samples were extracted using a rock hammer to obtain fresh surfaces and to avoid supergene alteration overprints. The sandstones exhibit light brown to pale tan colors in the Tidwell Member of the Morrison Formation (Figures 4A), brown, pink or tan colors in the Wanakah Formation (Figures 4B) and relatively bright red to orange colors in the Entrada Sandstone (Figures 4C). These colors attest to the presence of iron oxides and hydroxides cement in the bulk sample. Polished petrographic thin-sections were prepared for selected, representative specimens to assess the mineralogy, morphology and grain size of the constituent mineral phases. The thin-sections were examined using a Hitachi S-3400N scanning electron microscope (SEM) in backscatter (BSE) mode at Montana State University Billings. Additional analyses with an energy dispersive spectroscopy (EDS) Ametek EDAX system provided semi-quantitative spot chemical analyses. Before imaging, thin-sections were coated with a 45 Å-thick layer of gold/palladium to prevent charging. The operation conditions of 15–20 kV accelerating voltage and a working distance of 10.0 μm yielded the best results.
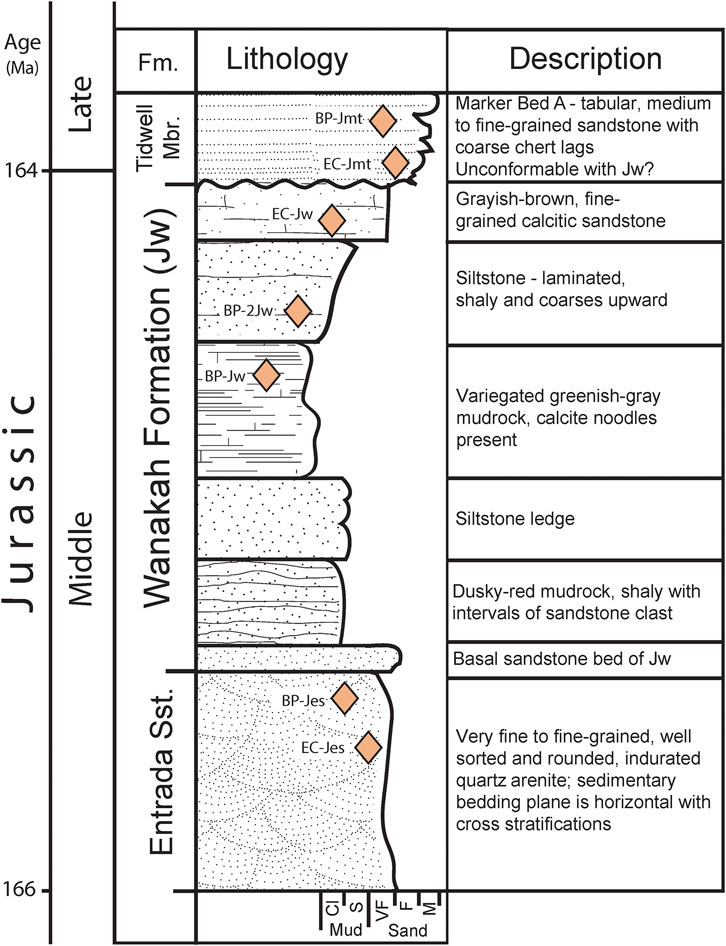
FIGURE 3. Generalized stratigraphy of the Middle to early Late Jurassic in the study areas. Diamond symbols denote sampling horizons. Abbreviation of lithologies in the figure is Mud (CI, clayey; S, silty), Sand (VF, very fine-grained; F, fine-grained; and M, medium-grained).
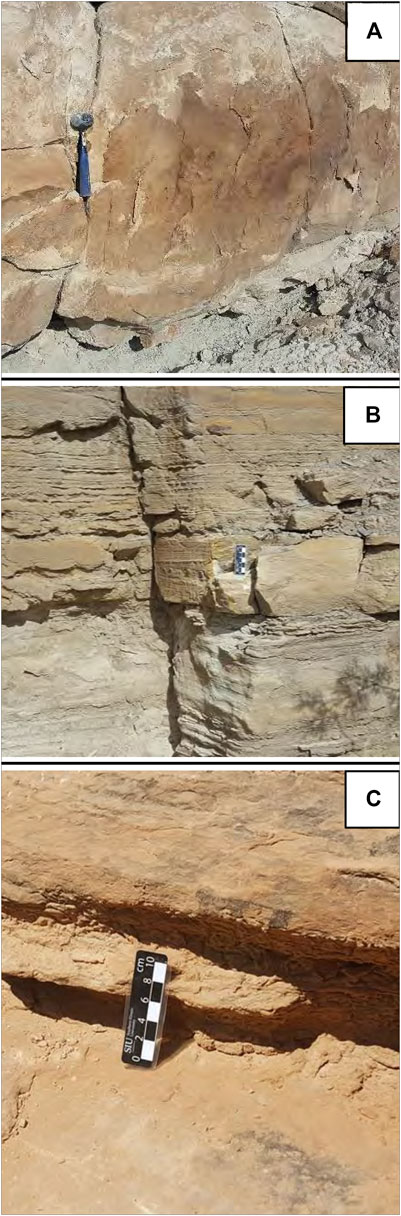
FIGURE 4. Field photographs showing sedimentary bedding and sandstone lithologies of (A). Marker Bed A - the basal sandstone of the Tidwell Mbr. of Morrison Fm. Marker Bed A is the sandstone bed that separates the Middle and Late Jurassic rocks. (B) Wanakah Fm. and (C) Entrada Sandstone. Hammer and scale bars are for scale.
We cut several serial 2 cm-thick slabs from the hand samples to produce 2 cm sample cubes. The 2 cm AMS cubes were cut, side-by-side, from these slabs to yield about 15 cubic specimen per one hand sample. These oriented cubes were measured using the AGICO KLY-4S Kappabridge susceptibility meter at Southern Illinois University Carbondale. Measurements were performed at room temperature with an applied magnetic field of 300 A/m and frequency of 875 Hz. The AMS measurements were processed using the AGICO SUFAR program while the acquired data were plotted using the AGICO Anisoft 4.2 program. Directional data obtained from the projection of the three principal magnetic susceptibility axes on equal-area lower hemisphere stereonets, including their 95% confidence ellipses, were calculated using the Jelinek statistics (Jelínek, 1978; Supplementary Material).
The AMS is defined by a symmetric, second-rank tensor consisting of six independent elements represented by an ellipsoid with three mutually perpendicular axes. The three axes represent the three principal magnetic susceptibilities namely: K1 (maximum), K2 (intermediate), and K3 (minimum). The AMS parameters used in this study include the mean magnetic susceptibility
We performed both magnetic hysteresis experiments and Isothermal Remanent Magnetization (IRM) experiments at room temperature, on rock fragments to identify the nature of the AMS carriers. Magnetic hysteresis was measured on 11 specimens using the MicroMag 3900-04 vibrating sample magnetometer (VSM; Princeton Measurements Corporation) at Southern Illinois University Carbondale. IRM experiments were performed on two representative specimens with contrasting colors (one specimen from each locality). A field strength of up to 1.5 T was applied to saturate the specimens magnetically. For comparison, the induced magnetization in both specimens was normalized after correcting for high-field slope, in this case, 70% of the maximum applied field.
Due to the assumed presence of hematite in the hand samples, we chose thermal demagnetization of the NRM to constrain the different magnetic phases present in each specimen. Thermal demagnetization of the NRM was performed at the CIMaN-ALP laboratory of paleomagnetism (Peveragno, Italy) using a Superconducting Rock Magnetometer 2G Enterprise 755 hosted in a shielded room. Forty-eight representative AMS cubes (16 per formation) were selected for thermal demagnetization of the NRM. The specimens were subjected to a stepwise thermal demagnetization in 15 steps from room temperature to 600°C, with additional four steps up to 700°C for specimens showing higher unblocking temperatures.
Previous work reports on the petrographic characteristics of the Entrada Sandstone, Wanakah Formation and Tidwell Member of the Morrison Formation (Ejembi et al., in review). Based on Folk (1980) sandstone classification, the Entrada Sandstone consists dominantly of sublitharenites, while the Wanakah Formation and Tidwell Member range from feldspathic litharenite to litharenite. The Entrada Sandstone in the two localities is predominantly pinkish to reddish brown, cross-bedded, and is composed of fine to very fine-grained, sub-rounded to rounded framework grains. The Wanakah Formation consists of distinct, thin beds (<0.15 m) of fine-grained sandstone with interbedded mudrocks that have a characteristic red and green color. The Tidwell Member consists of a regionally extensive, dark gray to tan, marker sandstone bed with overlying beds that are tabular, coarse-grained, and are interbedded with mudrocks. These sandstone beds vary in thicknesses (0.7–1.5 m), with a maximum measured thickness of ∼1.5 m at Escalante Canyon.
The quartz and feldspar grains in these units are strikingly free of any transgranular or intergranular deformation fractures and inherited or cognate plastic deformation microstructures such as undulose extinction. Both optical microscopy and scanning electron microscopy reveal very pristine detrital grains assembled in undeformed, fabric-less assemblages. Cross-bedding structures, when present, result from grain size variation. Figure 5, for example, shows representative SEM-BSE images of polished thin sections along with corresponding maps of major elements from the sandstone specimens using x-ray energy-dispersive systems (EDS) analysis. The maps of iron distribution in the matrix reveal no specific coating along grain margins. The EDS chemical analyses help identify quartz, alkali feldspar, calcium carbonates, and iron oxides/hydroxides. However, magnetite and titanomagnetite detrital grains were observed in some of the specimen (based on the Fe, O and Ti elemental maps, e.g., EC-2Jmt and EC-3Jw (Figure 5). This lack of ferromagnetic grains is not unusual in terrestrial sandstones where these minerals are quickly degraded and precipitated as early hematite grain coatings (e.g., Chan et al., 2007).

FIGURE 5. Backscattered electron microscopy images of polished thin section from three represntative samples from Escalante Canyon (A,C and E) and elemental maps from x-ray EDC analysis (B,D) of the matrix and some framework grains. White grains in the EC-2Jmt and the EC-3Jw images are magnetite and and/or titanomagnetite grains. Hematite grain coatings are found in the EC-1Jes sample along quartz grain boundaries. Jes, Entrada Sandone; Jw, Wanakah Formation; Jmt, Tidwell Member; Fe, Iron; Qz, quartz; Hem, hematite; Mag, magnetite; Kfs, potassium feldspar; cal, calcite.
The hysteresis behaviors show negligible contributions of diamagnetic minerals, minor contributions of paramagnetic minerals, and the dominance of ferromagnetic phases (Table 1 and Figure 6). The magnetic hysteresis parameters, saturation magnetization (Ms), saturation remanent magnetization (Mr), and magnetic coercivity (Hc) are calculated after correction of the high field slope, which arises primarily from the sum of diamagnetic (quartz and carbonates) and paramagnetic (clay and other detrital grains) and antiferromagnetic contributions. The coercivity of remanence (Hcr) was determined through back-field experiments. Two fundamental behaviors are observed: a single phase with a low to moderate remanent coercivity phase (e.g., EC-1Jmt, Hcr ≈ 49.5 mT; Figures 6A); and a two-phase mixture with high- and moderate-coercivity phases resulting in a wasp-waisted shaped hysteresis loop (e.g., EC-1Jes, Hcr ≈ 176 mT; Figures 6B). Most specimens reach magnetic saturation at fields above 0.6 T. A few specimens show a negative high-field slope (e.g., EC-1Jes) indicative of a very small diamagnetic contribution. As the contribution of the high-coercivity phase is highly variable, the Mr/Ms and Hcr/Hc ratios result from a mixture of several single-phase properties and therefore cannot be used as indicators of magnetic granulometry. The relatively low values of the high field slope (Table 2) indicate that paramagnetic phases cannot account for the observed AMS.
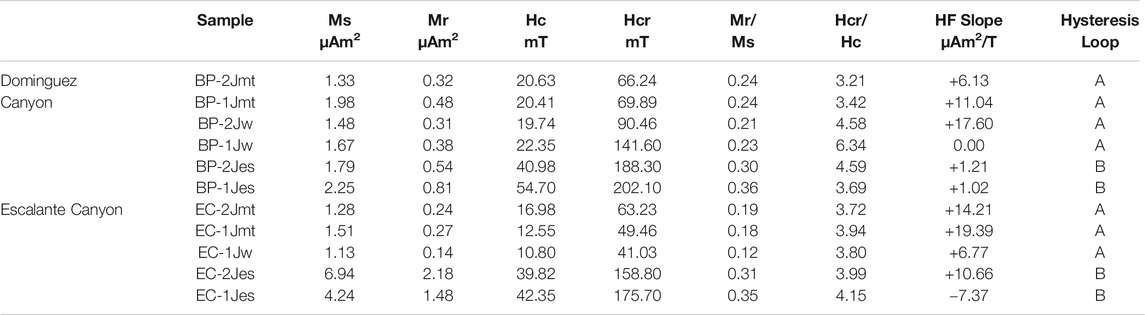
TABLE 1. Magnetic hysteresis properties of Middle-Late Jurassic sandstones from the Paradox Basin, western Colorado.

FIGURE 6. Representative magnetic hystersis curves (magnetic moment, m versus applied field, H) observed in all the sandstone samples. Both samples exhibit low paramagnetic susceptibility behaviour,with EC-1Jmt showing a single component magnetic hysteresis behavior (A) and EC-1Jes showing at least two components magnetic hystersis behaviour (B).

TABLE 2. Average scalar and tensorial AMS data of Middle-Upper Jurassic sandstones from the Paradox Basin, western United States.
Two types of IRM acquisition behavior for specimens with contrasting lithofacies (i.e., color, texture, and porosity) are shown in Figure 7. The IRM plots show distinct approaches to magnetic saturation up to 1.5 T. These differences correlate with the color of the specimen: red sandstones are more magnetically coercitive than tan sandstones.
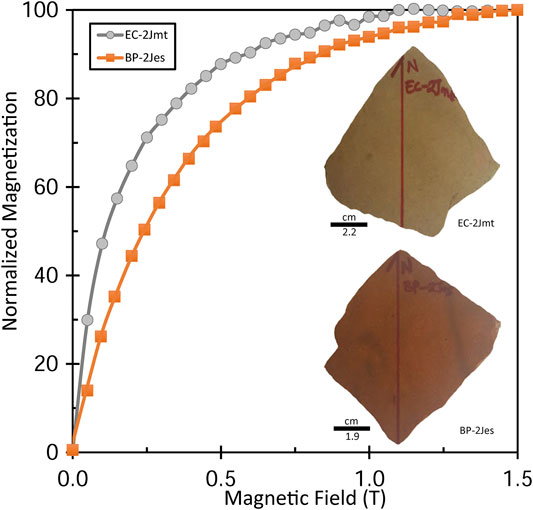
FIGURE 7. Isothermal Remanent Magnetization (IRM) acquisition plot of two samples (BP-2Jes and EC-2Jmt) from the Middle and Late Jurassic, respectively. The two samples are remarkably different lithologically. Insets are photographs of a freshly cut slab of both samples taken during the AMS sample preparation stage. The marker on the sample surface shows the in situ geographic orientation.
The AMS scalar parameters (Km, T, and P’) are plotted in binary diagrams in Figure 8 and provided in Table 2. The specimens display consistent magnetic properties. P’ shows a negative correlation with Km, both at the scale of the specimen and across specimens. Km ranges from ∼8.14 to 31.0 × 10⁻⁶ SI (Figures 8A). There is no correlation between the rock color and AMS parameters. P’ ranges from 1.02 to 1.27, clearly outside the range of values attributed to paramagnetic only assemblages, but most specimens have P’ < 1.05 (Figures 8B). T varies substantially within each specimen but overall shows mainly oblate symmetry (Figures 8C). Although the degree of anisotropy in the specimens is strongly influenced by the weak magnetic susceptibility, it does not provide a reliable estimate of the strain at magnetic susceptibilities close to zero.

FIGURE 8. Composite plots of AMS parameters of all the samples in both localities. (A) Mean magnetic susceptibility vs. the degree of magnetic anisotropy. (B) Mean magnetic susceptibility vs. the shape factor and (C). The degree of magnetic anisotropy vs. the shape factor.
The stereonets of the three principal magnetic susceptibility axes (K1, K2, and K3) obtained from the sandstone specimens from the two study sites are shown in Figure 9. The 95% confidence ellipses around averages per specimen are derived from the Jelinek statistics (Jelínek, 1978). The AMS directional parameters are rather consistent at the hand sample scale and between specimens. The specimens display a strong and consistent—but varying degree of steepness of the—magnetic foliation (planar fabric) defined by the K1–K2 plane (Figure 9), which dips to the SE. The double arrow shows the dip angle of the magnetic foliation. The magnetic lineation (K1) is moderately well-defined and show discrete clusters. The AMS planar fabric of these rocks is clearly oblique with respect to the sub-horizontal bedding plane observed on the outcrop where each hand sample was collected from.
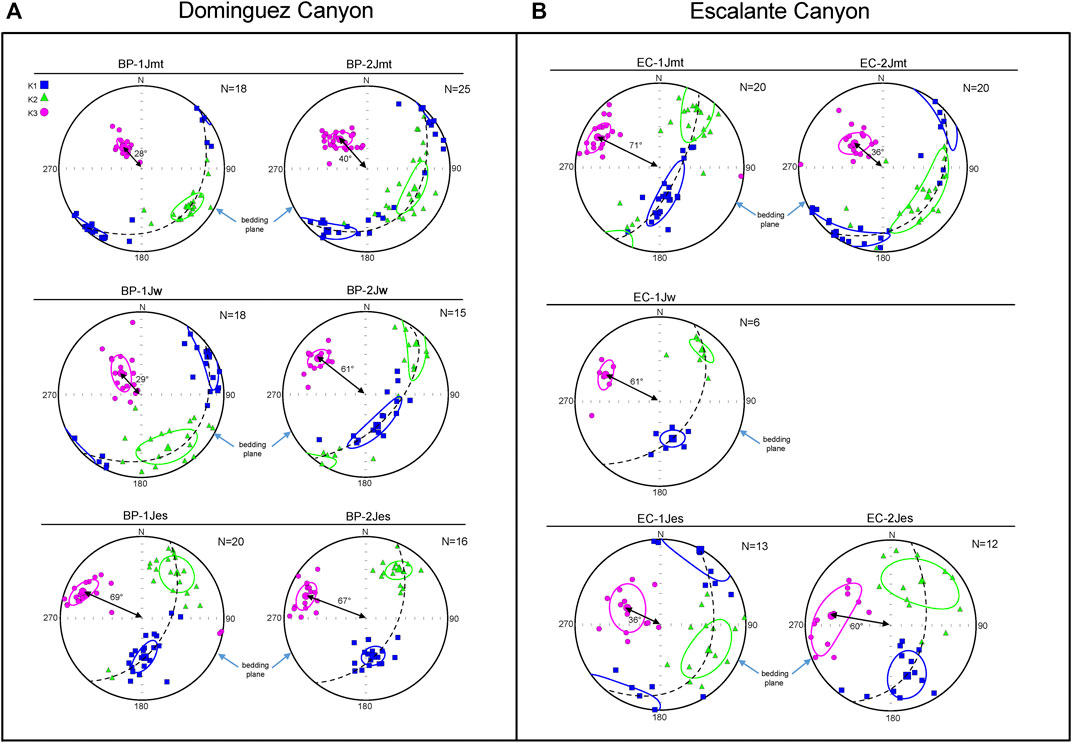
FIGURE 9. Equal-area lower hemisphere stereographic projections of the three principal magnetic susceptibility axes, including their 95% confidence ellipses around weighted averages derived using Jelinek statistics (1981). Samples in A are from Bridgeport in Dominguez Canyon and B Escalante Canyon (Figure 1). Samples are in stratigraphic order from oldest- youngest: Jes, Entrade sandstone; Jw, Wanakah Fm. and Jmt, Tidwell Mbr of the Morrison Fm. K1 in squares, K2 in traingles and K3 in circles. Dotted arc is the K1-K2 plane which defines the magnetic foliation. K1 defines the magnetic lineation. The tilt of magnetic lineation. The tilt of the magnetic fabric, i.e., the deviation of the K3 axis from 90° (the sedimentary bedding pole), is represented by the double-headed arrow on the stereonet for each sample.
Stepwise thermal demagnetization of the NRM is shown for six out of forty-eight representative specimens in Figure 10. The NRM intensities range from 3.69 × 10⁻⁵ to 9.91 × 10⁻³ A/m, with an average of 1.86 × 10⁻³ A/m. Characteristic remanent magnetizations (ChRMs) were successfully isolated in 39 (over 48) specimens, both with normal (16 specimens) and reversed polarities (23 specimens). In most cases, the experiments show a stable single-component behavior, with a relatively straight ChRM toward the origin. Few specimens show evidence of a second directional components, isolated at lower temperatures (e.g., BP-1Jmt), including some with normal and reverse components. The ChRMs are scattered, and do not pass the reversal test (McFadden and McElhinny, 1990). The weakly magnetized specimens (which were independent of the formation or lithology) that lack stable demagnetization behaviors could not be interpreted. In most specimens from the Tidwell Member and the Wanakah Formation, the main demagnetization occurs below 150°C while the remainder is generally removed below 300°C (e.g., Figures 10A–D). Most specimens from the Entrada Sandstone also display demagnetization below 150°C, but some retain part of their magnetization up to 500°C–680°C (e.g., Figures 10F). The stable demagnetization directions vary substantially in inclination (Figure 10) with an average ∼55° for the <150°C stable component, while the variations in magnetic declination are also high.
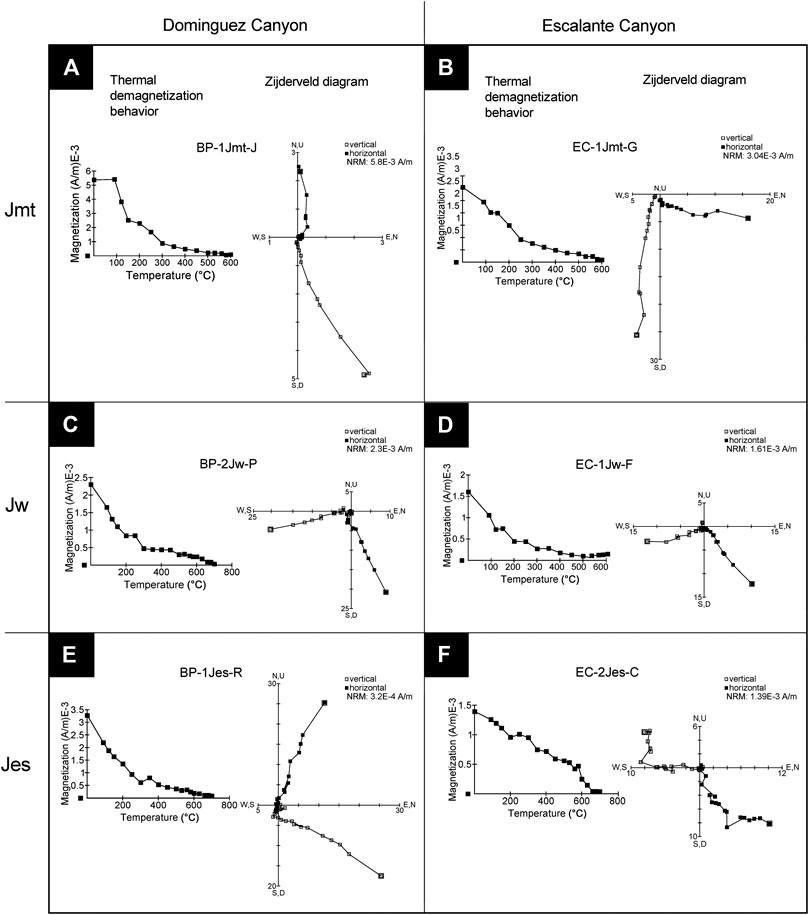
FIGURE 10. Stepwise thermal demagnetization of the natural remanent magnetization (NRM) behaviour and corresponding Zijderveld diagram of representative samples from the two study localities. Demagnetization steps are in °C. Full (open) symbols in the Zijderveld diagram represent orthogonal projection on to the horizontal (vertical) plane. Refer to Figure 9 caption for sample abbreviations.
Previous studies have shown that the origin of magnetic fabrics in sedimentary rocks is controlled by sedimentary vs. tectonic processes (e.g., Tarling and Hrouda, 1993; Li et al., 2014). The sedimentary origin of AMS lies in the depositional process by which particles settling in a slurry acquire a shape preferred orientation parallel to the depositional plane, which is close to horizontal in most cases. The compaction of sediments generally strengthens the planar component of the syn-depositional fabric because it results from the application of a vertical stress (gravity).
When bedding is horizontal, there is either no lineation of the maximum susceptibility, or a very weak lineation. Regardless of the magnetic carriers, the resulting AMS tends to be strongly planar and weakly linear, i.e., oblate fabrics (e.g., Schieber and Ellwood, 1993; Tarling and Hrouda, 1993; Saint-Bezar et al., 2002; Aubourg et al., 2004; Aubourg et al., 2010; Parés et al., 2007; Robion et al., 2007; Dall'Olio et al., 2013). Sedimentary magnetic fabrics in sedimentary rocks are characterized by a tight clustering of the K3 axis along the bedding pole, with the K1 and K2 axes dispersed within the bedding plane (Figures 11A). In rare cases, eolian sedimentary rocks may acquire a linear fabric parallel to the wind direction (e.g., Lagroix and Banerjee, 2002). For materials deposited under a strong current, a linear fabric parallel to the current may be imparted, although such fabrics are typically reported in shales and rarely in sandstones (e.g., Ellwood and Howard, 1981; Schieber and Ellwood, 1993; Tarling and Hrouda, 1993), and the amplitude of the imbrication angle of deposited sediments is very small compared to the strongly oblique magnetic fabric observed in our specimens (Figures 11B).
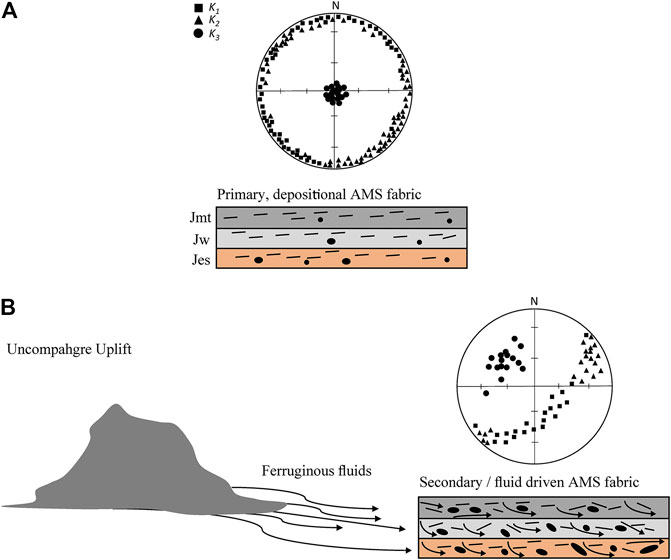
FIGURE 11. Model for the acquisition of (A). primary, depositional AMS fabrics in sedimentary rocks in this study, and (B). modified AMS fabrics, caused by the alteration of primary detrital grains and/or presipitation of new magnetic minerals, in pore spaces due to the percolation of ferruginous fluids, driven by the Late Cretaceous Uncompahgre Uplift in western United States.
Tectonic overprints of a sedimentary fabric can be detected with AMS even for anisotropies as low as 1% (1.01), e.g., Burmeister et al. (2009). In clay-bearing rocks, such overprints result in a reorientation of platy minerals perpendicular to the instantaneous shortening axis (i.e., the LPS) due to tectonic strain. In sandstones, tectonic overprints are typically identified through specific microstructures including transgranular or intra-granular fractures, recrystallization rims, lobate grain boundaries and outcrop-scale structures such as stylolites or deformation bands (e.g., Saint-Bezar et al., 2002).
In the case of the Uncompahgre Uplift rocks investigated in this study, detailed petrographic observations indicate a lack of plastic deformation, beyond rare detrital quartz grain that exhibits pre-existing undulose extinction. The tectonic uplift that occurred in this region resulted in broad-scale tilting of beds, in places up to 10°. But at our sampling localities, the bedding is close to horizontal (<3 dip). Based on lack of deformation at the scale of the outcrop, the specimen and that of the thin-section, a tectonic origin for the observed AMS fabric can be ruled out. Further, the generally steep attitude (i.e., dip) of the magnetic foliation (∼50°), if it were of tectonic origin, would require an attitude of the shortening axis inconsistent with regional tectonics.
The AMS fabrics of all the specimens are systematically strongly oblique (28–71 dip) with respect to the subhorizontal bedding. Considering this pronounced paradoxical obliquity and the remarkably consistent dip direction to the South East between hand samples from the same site and across the two sampling sites, a sedimentary origin for the AMS can be ruled out.
To better understand the origin of these magnetic fabrics we need to consider the magnetic minerals present in these rocks. At the outcrop scale, the Entrada Sandstone hand samples commonly show a red color (Figures 4C) indicative of the presence of relatively fine hematite. Most specimen also contain relatively large, multi-domain (up to 200 µm) magnetite grains that we interpret as detrital grains based on their rounded and smooth morphology as well as their location in between quartz clasts (Figure 5). The hysteresis behavior of most specimens shows a strong contribution from a high magnetic coercivity phase that cannot be magnetite because this mineral typically saturates at the field of 0.2 T or less (e.g., Dunlop and Özdemir, 1997). Hematite and goethite are, in a diagenetic environment, by far the most likely phases responsible for this behavior. The IRM acquisition curves (Figure 7) confirm the presence of at least one high coercivity phase. Finally, the thermal demagnetization behavior of these rocks shows that in most cases, goethite dominates the NRM, except in the Entrada Formation where hematite contributes more. In general, the magnetic phase carrying the NRM can be—but is not necessarily the same as—the phase carrying the AMS. In summary, most specimens contain a mixture of detrital magnetite (Fe3O4), and its typical alteration products; hematite (Fe2O3) and goethite FeO(OH). While the absolute percentage of magnetite may be relatively small, this phase contributes substantially to AMS due to its high intrinsic magnetic susceptibility.
While the respective contributions of these three minerals to the AMS of our specimens remain quantitatively unconstrained, their intrinsic magnetic anisotropy may shed light on the origin of the AMS. Magnetite primarily has a magnetostatic anisotropy (i.e., shape anisotropy) that tends to dominate magnetic fabrics because it has a high magnetic susceptibility (Dunlop and Özdemir, 1997). Hematite, in low fields, has mainly a magnetocrystalline anisotropy that mimics its planar hexagonal shape (Rochette et al., 1992). Goethite grains are elongated along their crystallographic c-axis, which is also the K3 axis and gives goethite an inverse AMS fabric (e.g., Rochette et al., 1992).
Considering the magnetic assemblage observed in our specimens, two alternative explanations can be proposed:
In these studies, hot fluids precipitate iron oxides and hydroxides in pore spaces of a porous rock and the resulting AMS effectively reflects pore space shape anisotropy.
The first hypothesis cannot explain oblique AMS fabrics because mixtures of normal and inverse AMS fabrics systematically result in perpendicular AMS fabrics (Ferré, 2002). It also seems unlikely because the thermal demagnetization behaviors and magnetic properties of the specimens indicate that the proportion of magnetite, hematite, and goethite varies between hand samples (Figure 10 and Tables 1, 2).
The second hypothesis is consistent with most observations including the variations in magnetic mineralogy across formation depending on the availability of iron in the environment and possible variations in rock permeability. The fundamental mechanism driving fluids through these formations could be the tectonic uplift of the Uncompahgre mountains which would have caused a regionally consistent hydraulic head to the West of the sampling localities (Figures 11B). Although rock fractures are visible at outcrop scale (Figure 4), we did not identify any linkage to presence of systematic fracture or pore networks at the microscopic scale (Figure 5) and assessing the potential role of fracture networks in contributing to the regional fluid flow through these formation is beyond the scope of this work. Today, the paleomagnetic data showing a reverse period of magnetization at least in the Entrada Formation (e.g., EC-1Jes) supports a Cretaceous precipitation event associated with the Uncompahgre Uplift, although this process is highly unlikely because iron is a very mobile element and subsequent erosion created by the uplift and Quaternary downcutting of the Gunnison River almost certainly created a late-stage fluid flow event to the west.
Magnetic fabrics have previously been used both to characterize fluid flow through porous rocks (e.g., Sizaret et al., 2003; Just et al., 2004; Essalhi et al., 2011) and to quantify pore anisotropy (e.g., Pfleiderer and Halls, 1990; Pfleiderer and Halls, 1993; Benson et al., 2003). Crystallographic analyses of magnetite grains and whether its preferred grain orientation align with pore spaces in the bulk rock (if it exists) are outside the scope of this work. Here in this study of the Uncompahgre Uplift, contrarily to many similar studies of sedimentary rocks using magnetic fabrics, we show that the AMS does not inform on depositional processes, compaction or paleocurrents. Instead, the AMS reflects a regionally consistent post-depositional, tectonically-driven fluid flow owing to cycling via redox reactions of a highly mobile element (Fe) over geologic history in porous and permeable media.
The magnetic mineralogy of the Jurassic rocks on the Eastern flank of the Uncompahgre Uplift rocks attests to a primary, detrital magnetite subsequently altered into hematite and goethite. Further dedicated paleomagnetic studies might provide insights into the timing of the uplift and the origin of the oblique foliation symmetry, which we infer might be unrelated to the competition between different phases of ferromagnetic minerals carrying the AMS. This study shows that the AMS fabrics of the Middle-Late Jurassic sandstones of the Uncompahgre Uplift are not primary sedimentary magnetic fabrics. Instead, these fabrics are secondary in origin and most likely developed through unidirectional percolation of Fe-rich fluids that migrated due to the hydraulic head caused by the uplift. Future AMS studies on sedimentary rocks will have to consider that regional hydraulic systems may ultimately affect results and that caution should be exerted in the interpretation of magnetic fabrics.
The original contributions presented in the study are included in the article/Supplementary Material, further inquiries can be directed to the corresponding author.
JE did the fieldwork, collected and prepared the samples, performed the AMS, magnetic hysteresis, and IRM experiments, and wrote the first draft of the manuscript. EF advised, provided the lab equipment, directed the research, and edited the successive versions of the manuscript. EF, SS, and JE designed and arranged samples for the thermal demagnetization of the NRM experiment. SS performed the thermal demagnetization of the NRM experiment, took the measurements, and analyzed the data. EF, JE, and SF designed and arranged thin-section samples for SEM. SF performed the SEM experiment, analyzed, and collected the EDS data. JE and EF jointly analyzed all the data. All authors read, edited, and contributed to the final draft of the manuscript.
This research was partly funded by the American Chemical Society-Petroleum Research Fund (ACS-PRF) Grant No. 55161 (to Sally Potter-McIntyre) and the Department of Geology at Southern Illinois University. Sally Potter McIntyre also provided samples, thin-sections, unpublished field and petrographic data and input into this manuscript. The Classen Family Named, American Association of Petroleum Geologists (AAPG) Grants-in-Aid, the Geological Society of America (GSA) Graduate Research Grant and the National Association of Black Geoscientists (NABG) Scholarship Award to JE benefitted this research as well. Joe Krienert helped to digitize and compile the geologic map of the study area. Elham Hosseinzadehsabeti graciously assisted with some of the VSM measurements.
The authors declare that the research was conducted in the absence of any commercial or financial relationships that could be construed as a potential conflict of interest.
The handling editor declared a past co-authorship with one of the authors (SS).
The Supplementary Material for this article can be found online at: https://www.frontiersin.org/articles/10.3389/feart.2020.601415/full#supplementary-material.
Aubourg, C., Klootwijk, C., and Korsch, R. J. (2004). Magnetic fabric constraints on oroclinal bending of the Texas and Coffs Harbour blocks: new England Orogen, eastern Australia. Geol. Soc. Spec. Publ. 238 (1), 421. doi:10.1144/GSL.SP.2004.238.01.22.
Aubourg, C., Smith, B., Eshraghi, A., Lacombe, O., Authemayou, C., Amrouch, K., et al. (2010). New magnetic fabric data and their comparison with palaeostress markers in the Western Fars Arc (Zagros, Iran): tectonic implications. Geol. Soc. Spec. Publ. 330 (1), 97. doi:10.1144/SP330.6.
Baars, D., and Stevenson, G. (1981). “Tectonic evolution of western Colorado and eastern Utah,” in Western slope (western Colorado) - New Mexico geological society 32nd annual fall field conference guidebook. Editors R. C., Epis, and J. F., Callender (Socorro, NM: New Mexico Geological Society), 337.
Barbeau, D. L. (2003). A flexural model for the Paradox Basin: implications for the tectonics of the ancestral Rocky mountains. Basin Res. 15, 97–115. doi:10.1046/j.1365-2117.2003.00194.x.
Beitler, B., Parry, W. T., and Chan, M. A. (2005). Fingerprints of Fluid Flow: Chemical Diagenetic History of the Jurassic Navajo Sandstone, Southern Utah, U.S.A, J. Sediment. Res. 75, 547–561. doi:10.2110/jsr.2005.045.
Benson, P. M., Meredith, P. G., and Platzman, E. S. (2003). Relating pore fabric geometry to acoustic and permeability anisotropy in Crab Orchard Sandstone: A laboratory study using magnetic ferrofluid. Geophys. Res. Lett. 30 (19). doi:10.1029/2003gl017929.
Burmeister, K. C., Harrison, M. J., Marshak, S., Ferré, E. C., Bannister, R. A., and Kodama, K. P. (2009). Comparison of Fry strain ellipse and AMS ellipsoid trends to tectonic fabric trends in very low-strain sandstone of the Appalachian fold–thrust belt. J. Struct. Geol. 31, 1028–1038. doi:10.1016/j.jsg.2009.03.010.
Chan, M. A., Ormö, J., Park, A. J., Stich, M., Souza-Egipsy, V., and Komatsu, G. (2007). Models of iron oxide concretion formation: field, numerical, and laboratory comparisons. Geofluids 7 (3), 356–368. doi:10.1111/j.1468-8123.2007.00187.x.
Chan, M. A., Parry, W. T., and Bowman, J. R. (2000). Diagenetic hematite and manganese oxides and fault-related fluid flow in Jurassic sandstones, Southeastern Utah. AAPG (Am. Assoc. Pet. Geol.) Bull. 84, 1281–1310. doi:10.1306/A9673E82-1738-11D7-8645000102C1865D
Cook, K. L., Whipple, K. X., Heimsath, A. M., and Hanks, T. C. (2009). Rapid incision of the Colorado River in Glen Canyon – insights from channel profiles, local incision rates, and modeling of lithologic controls, Earth Surf. Process. Landforms 34, 994–1010. doi:10.1002/esp.1790
Dall'Olio, E., Felletti, F., and Muttoni, G. (2013). Magnetic-fabric analysis as a tool to constrain mechanisms of deep-water mudstone deposition in the Marnoso Arenacea Formation (Miocene, Italy). J. Sediment. Res. 83, 170–182. doi:10.2110/jsr.2013.12.
Davis, G. H. (1978). “Monocline fold pattern of the Colorado Plateau,” in Laramide folding associated with basement block faulting in the western United States. Editors V., Matthews (Boulder, CO: Geological Society of America), 215–233.
Dunlop, D. J., and Özdemir, Ö. (1997). Rock magnetism: fundamentals and Frontiers. Cambridge, UK: Cambridge University Press.
Ejembi, J. I., Potter-McIntyre, S. L., Sharman, G. R., Smith, T. M., Saylor, J. E., Hatfield, K., et al. (in revision). Detrital zircon geochronology and provenance of the Middle to Upper Jurassic Paradox Basin, western Colorado: paleogeographic implications for southwestern Laurentia. Geosphere.
Ellwood, B. B., and Howard, J. H. (1981). Magnetic fabric development in an experimentally produced barchan dune, J. Sediment. Res. 51, 97–100. doi:10.1306/212F7C16-2B24-11D7-8648000102C1865D
Essalhi, M., Sizaret, S., Barbanson, L., Chen, Y., Branquet, Y., Panis, D., et al. (2009). Track of fluid paleocirculation in dolomite host rock at regional scale by the Anisotropy of Magnetic Susceptibility (AMS): An example from Aptian carbonates of La Florida, Northern Spain. Earth Planet Sci. Lett. 277, 501–513. doi:10.1016/j.epsl.2008.11.011.
Essalhi, M., Sizaret, S., Barbanson, L., Chen, Y., Lagroix, F., Demory, F., et al. (2011). A case study of the internal structures of gossans and weathering processes in the Iberian Pyrite Belt using magnetic fabrics and paleomagnetic dating. Miner. Deposita 46, 981–999. doi:10.1007/s00126-011-0361-8.
Ferré, E. C., Bordarier, C., and Marsh, J. S. (2002). Magma flow inferred from AMS fabrics in a layered mafic sill, Insizwa, South Africa. Tectonophysics 354, 1–23. doi:10.1016/s0040-1951(02)00273-1.
Ferré, E. C. (2002). Theoretical models of intermediate and inverse AMS fabrics. Geophys. Res. Lett. 29, 31-1–31-4. doi:10.1029/2001gl014367.
Hunt, C. B. (1969). Geological history of the Colorado river in the Colorado river region and John Wesley Powell. U.S. Geological Survey Professional Paper 669-C. Reston, VA: United States Geological Survey, 59–130.
Hunt, J. M. (1990). Generation and migration of petroleum from abnormally pressured fluid compartments (1). AAPG (Am. Assoc. Pet. Geol.) Bull. 74, 1–12.
Jelínek, V. (1978). Statistical processing of anisotropy of magnetic susceptibility measured on groups of specimens. Studia Geophys. Geod. 22 (1), 50–62. doi:10.1007/BF01613632.
Just, J., Kontny, A., De Wall, H., Hirt, A. M., and Martín-Hernández, F., (2004). Development of magnetic fabrics during hydrothermal alteration in the Soultz-sous-Forets granite from the EPS-1 borehole, Upper Rhine Graben, Geolo. Soc., London, Special Publications 238, 509–526. doi:10.1144/gsl.sp.2004.238.01.26.
Kelley, V. C. (1958). “Tectonics of the region of the Paradox Basin,” in Guidebook to the Geology of the Paradox Basin: intermountain association of Petroleum Geologists. Editors A. F., Sanborn (Salt Lake City, UT: Intermountain Association of Petroleum Geologists (U.S.)), 31–38.
Kluth, C. F., and Coney, P. J. (1981). Plate tectonics of the ancestral Rocky Mountains. Geol. 9, 10–15. doi:10.1130/0091-7613(1981)9<10:ptotar>2.0.co;2.
Lagroix, F., and Banerjee, S. K. (2002). Paleowind directions from the magnetic fabric of loess profiles in central Alaska. Earth Planet Sci. Lett. 195, 99–112. doi:10.1016/s0012-821x(01)00564-7.
Li, S., Deng, C., Paterson, G. A., Yao, H., Huang, S., Liu, C., et al. (2014). Tectonic and sedimentary evolution of the late Miocene–Pleistocene Dali Basin in the southeast margin of the Tibetan Plateau: Evidences from anisotropy of magnetic susceptibility and rock magnetic data. Tectonophysics 629, 362–377. doi:10.1016/j.tecto.2014.05.035.
Marshak, S., Karlstrom, K., and Timmons, J. M. (2000). Inversion of Proterozoic extensional faults: An explanation for the pattern of Laramide and Ancestral Rockies intracratonic deformation. United States, Geolo. 28, 735–738. doi:10.1130/0091-7613(2000)28<735:iopefa>2.0.co;2.
Martin-Hernandez, F., and García-Hernández, M. M. (2010). Magnetic properties and anisotropy constant of goethite single crystals at saturating high fields. Geophys. J. Int. 181 (2), 756–761. doi:10.1111/j.1365-246X.2010.04566.x.
Massei, N., Lacroix, M., Wang, H. Q., and Dupont, J.-P. (2002). Transport of particulate material and dissolved tracer in a highly permeable porous medium: comparison of the transfer parameters. J. Contam. Hydrol. 57, 21–39. doi:10.1016/s0169-7722(01)00216-9.
McFadden, P. L., and McElhinny, M. W. (1990). Classification of the reversal test in palaeomagnetism. Geophys. J. Int. 103, 725–729. doi:10.1111/j.1365-246x.1990.tb05683.x.
Musgrove, M., and Banner, J. L. (1993). Regional ground-water mixing and the origin of saline fluids: midcontinent, United States. Science 259, 1877–1882. doi:10.1126/science.259.5103.1877.
Nuccio, V. F., and Condon, S. M. (1996). Burial and thermal history of the Paradox Basin, Utah and Colorado, and petroleum potential of the Middle Pennsylvanian Paradox Basin, U.S. Geol. Survey Bulletin 2000-O. Boston, MA: U.S. Government Printing Office, 57–76.
Oliver, J. (1986). Fluids expelled tectonically from orogenic belts: Their role in hydrocarbon migration and other geologic phenomena. Geol. 14, 99–102. doi:10.1130/0091-7613(1986)14<99:fetfob>2.0.co;2.
Parés, J. M., Hassold, N. J. C., Rea, D. K., and van der Pluijm, B. A. (2007). Paleocurrent directions from paleomagnetic reorientation of magnetic fabrics in deep-sea sediments at the Antarctic Peninsula Pacific margin (ODP Sites 1095, 1101). Mar. Geol. 242, 261–269. doi:10.1016/j.margeo.2007.04.002.
Parés, J. M., Miguens, L., and Saiz, C. (2016). Characterizing pore fabric in sandstones with magnetic anisotropy methods: Initial results. J. Petrol. Sci. Eng. 143, 113–120. doi:10.1016/j.petrol.2016.02.028.
Parry, W. T., Chan, M. A., and Beitler, B. (2004). Chemical bleaching indicates episodes of fluid flow in deformation bands in sandstone. AAPG Bulletin 88, 175–191. doi:10.1306/09090303034.
Pederson, J. L., Mackley, R. D., and Eddleman, J. L. (2002). Colorado Plateau uplift and erosion evaluated using GIS. GSA Today (Geol. Soc. Am.) 12, 4–10. doi:10.1130/1052-5173(2002)012<0004:cpuaee>2.0.co;2.
Pfleiderer, S., and Halls, H. C. (1993). Magnetic pore fabric analysis: Verification through image autocorrelation. J. Geophys. Res. 98, 4311–4316. doi:10.1029/92jb01851.
Pfleiderer, S., and Halls, H. C. (1990). Magnetic susceptibility anisotropy of rocks saturated with ferrofluid: a new method to study pore fabric? Phys. Earth Planet. In. 65, 158–164. doi:10.1016/0031-9201(90)90083-a.
Potter, S. L., and Chan, M. A. (2011). Joint controlled fluid flow patterns and iron mass transfer in Jurassic Navajo Sandstone. Geofluids 11, 184–198. doi:10.1111/j.1468-8123.2011.00329.x.
Potter-McIntyre, S. L., Chan, M. A., and McPherson, B. J. (2014). Concretion formation in volcaniclastic host rocks: evaluating the role of organics, mineralogy, and geochemistry on early diagenesis. J. Sediment. Res. 84, 875–892. doi:10.2110/jsr.2014.58.
Rønnevik, C., Ksienzyk, A. K., Fossen, H., and Jacobs, J. (2017). Thermal evolution and exhumation history of the Uncompahgre Plateau (northeastern Colorado Plateau), based on apatite fission track and (U-Th)-He thermochronology and zircon U-Pb dating Geosphere 13, 518–537. doi:10.1130/GES01415.1.
Robion, P., David, C., Dautriat, J., Colombier, J.-C., Zinsmeister, L., and Collin, P.-Y. (2014). Pore fabric geometry inferred from magnetic and acoustic anisotropies in rocks with various mineralogy, permeability and porosity. Tectonophysics 629, 109–122. doi:10.1016/j.tecto.2014.03.029.
Robion, P., Grelaud, S., and Frizon de Lamotte, D. (2007). Pre-folding magnetic fabrics in fold-and-thrust belts: Why the apparent internal deformation of the sedimentary rocks from the Minervois basin (NE-Pyrenees, France) is so high compared to the Potwar basin (SW-Himalaya, Pakistan)? Sediment. Geol. 196, 181–200. doi:10.1016/j.sedgeo.2006.08.007.
Rochette, P., Jackson, M., and Aubourg, C. (1992). Rock magnetism and the interpretation of anisotropy of magnetic susceptibility. Rev. Geophys. 30, 209–226. doi:10.1029/92rg00733.
Saint-Bezar, B., Hebert, R. L., Aubourg, C., Robion, P., Swennen, R., and de Lamotte, D. F. (2002). Magnetic fabric and petrographic investigation of hematite-bearing sandstones within ramp-related folds: examples from the South Atlas Front (Morocco). J. Struct. Geol. 24, 1507–1520. doi:10.1016/s0191-8141(01)00140-7.
Schieber, J., and Ellwood, B. B. (1993). Determination of basinwide paleocurrent patterns in a shale succession from anisotropy of magnetic susceptibility (AMS); a case study of the mid-Proterozoic Newland Formation, Montana. J. Sediment. Res. 63, 874–880.
Sizaret, S., Chen, Y., Barbanson, L., Henry, B., Camps, P., and Marcoux, E. (2006). Crystallization in flow–I. Palaeocirculation track by texture analysis and magnetic fabrics. Geophys. J. Int. 167, 605–612. doi:10.1111/j.1365-246x.2006.03106.x.
Sizaret, S., Chen, Y., Chauvet, A., Marcoux, E., and Touray, J. C. (2003). Magnetic fabrics and fluid flow directions in hydrothermal systems. A case study in the Chaillac Ba–F–Fe deposits (France). Earth Planet Sci. Lett. 206, 555–570. doi:10.1016/s0012-821x(02)01112-3.
Tarling, D. H., and Hrouda, F. (1993). The Magnetic anisotropy of rocks. Berlin, Germany: Springer, 218.
Ungerer, P., Burrus, J., Doligez, B., Chenet, P., and Bessis, F. (1990). Basin evaluation by integrated two-dimensional modeling of heat transfer, fluid flow, hydrocarbon generation, and migration (1). AAPG (Am. Assoc. Pet. Geol.) Bull. 74, 309–335.
Wilkinson, J. J. (2001). Fluid inclusions in hydrothermal ore deposits. Lithos 55, 229–272. doi:10.1016/s0024-4937(00)00047-5.
Keywords: anisotropy of magnetic susceptibility, fluid flow, Jurassic, Uncompahgre uplift, central Colorado, sediment
Citation: Ejembi JI, Ferré EC, Satolli S and Friedman SA (2020) Post-Depositional Fluid Flow in Jurassic Sandstones of the Uncompahgre Uplift: Insights From Magnetic Fabrics. Front. Earth Sci. 8:601415. doi: 10.3389/feart.2020.601415
Received: 31 August 2020; Accepted: 11 November 2020;
Published: 07 December 2020.
Edited by:
Yohan Guyodo, UMR7154 Institut de Physique du Globe de Paris (IPGP), FranceReviewed by:
Martin Chadima, Academy of Sciences of the Czech Republic (ASCR), CzechiaCopyright © 2020 Ejembi, Ferre, Satolli and Friedman. This is an open-access article distributed under the terms of the Creative Commons Attribution License (CC BY). The use, distribution or reproduction in other forums is permitted, provided the original author(s) and the copyright owner(s) are credited and that the original publication in this journal is cited, in accordance with accepted academic practice. No use, distribution or reproduction is permitted which does not comply with these terms.
*Correspondence: John I. Ejembi, aWRva29qakBnbWFpbC5jb20=
Disclaimer: All claims expressed in this article are solely those of the authors and do not necessarily represent those of their affiliated organizations, or those of the publisher, the editors and the reviewers. Any product that may be evaluated in this article or claim that may be made by its manufacturer is not guaranteed or endorsed by the publisher.
Research integrity at Frontiers
Learn more about the work of our research integrity team to safeguard the quality of each article we publish.