
94% of researchers rate our articles as excellent or good
Learn more about the work of our research integrity team to safeguard the quality of each article we publish.
Find out more
ORIGINAL RESEARCH article
Front. Earth Sci. , 20 January 2021
Sec. Structural Geology and Tectonics
Volume 8 - 2020 | https://doi.org/10.3389/feart.2020.600729
This article is part of the Research Topic Unveiling Active Faults: Multiscale Perspectives and Alternative Approaches Addressing the Seismic Hazard Challenge View all 17 articles
 Timothy A. Stahl1*
 Nathan A. Niemi2
 Jaime E. Delano1
 Franklin D. Wolfe3
 Michael P. Bunds4
 Andrew Howell1,5
The Basin and Range province in the western United States hosts numerous low-slip-rate normal faults with diffuse and subtle surface expressions. Legacy aerial photographs, widely available across the region, can be used to generate high-resolution digital elevation models of these previously uncharacterized fault systems. Here, we test the limits and utility of aerial photograph-derived elevation products on the Drum Mountains fault zone—a virtually unstudied and enigmatic fault system in the eastern Basin and Range province of central Utah. We evaluate a new 2-m digital surface model produced from aerial photographs against other remotely sensed and field survey data and assess the various factors that contribute to noise, artifacts, and distortions. Despite some challenges, the new elevation model captures the complex array of cross-cutting fault scarps well. We demonstrate that the fault zone has variable net east- or west-down sense of displacement across a c. 8-km-wide zone of antithetic and synthetic traces. Optically stimulated luminescence ages and scarp profiles are used to constrain net extension rates across two transects and reveal that the Drum Mountains fault zone has average extension rates of c. 0.1–0.4 mm yr−1 over the last c. 35 ka. These rates are both faster than previously estimated and faster than most other faults in the region, and could be an order of magnitude higher if steep faults at the surface sole into a detachment at depth. Several models have been proposed for local and regional faulting at depth, but our data show that the offsets, rates, and geometries of faulting can be generated by the reactivation of pre-existing, cross-cutting faults in a structurally complex zone between other fault systems. This study highlights how legacy aerial-photograph-derived elevation products, in lieu of other high-resolution topographic datasets, can be used to study active faults, especially in remote regions where diffuse deformation would otherwise remain undetected.
Photogrammetric techniques are commonly used to create dense point clouds and high-resolution digital surface models (DSMs) of faulted landscapes. Unmanned Aerial Vehicle (UAV)-based photo surveys are widely used because they can capture subtle geomorphic features and resolve cm-scale displacements on faults using Structure-from-Motion (SfM) algorithms (Bemis et al., 2014; Johnson et al., 2014; DuRoss et al., 2019). While these techniques are revolutionary in their ability to capture low-cost elevation data along faults (e.g., in comparison to lidar; Meigs, 2013), they are typically restricted to small spatial extents in regions with sparse vegetation, and are limited by access to remote or protected areas for piloting. These factors can limit the usefulness of UAV surveys for active fault studies in regions of subtle or diffuse deformation.
Optical satellite and aerial imagery present the opportunity to create c. 1-m-scale resolution DSMs remotely and over larger extents than UAV-derived data. Three-dimensional displacements in recent earthquakes have been resolved using pre- and post-event satellite (Zhou et al., 2015; Zhou et al., 2018; Barnhart et al., 2019; Zinke et al., 2019) and aerial imagery (Milliner et al., 2015; Lajoie et al., 2020; Howell et al., 2020). There are also global satellite-imagery-derived DSMs with 0.5–5 m resolution (e.g., AW3D from the Japan Aerospace Exploration Agency) and sub-meter aerial-photo-derived DSMs of the entire United States (e.g., HxGN content program: https://hxgncontent.com/coverage-map) that can be used to characterize active faults, but the expense of obtaining substantial data coverage may preclude the use of such products. In the western United States, legacy aerial photographs collected over the last c. 80 years present additional opportunities to stack multiple generations of data or create “time-stamped” DSMs to quantify deformation in historical earthquakes (Milliner et al., 2015; Lajoie et al., 2020; Lu et al., 2020). However, there have been few studies assessing the reliability and utility of these elevation products in active fault studies.
Within the Basin and Range province (Figure 1), active faults have variable surface expressions ranging from multi-meter, range-bounding fault scarps to <1-m-high scarps and fissures on basin floors. Recent discussion in balancing the extensional budget across the Basin and Range has revealed that while identified active faults can account for most of the observed deformation (using preferred values of fault dip; e.g., Koehler and Wesnousky, 2011), geologic rates might underestimate GPS-derived rates by 21–46% (Personius et al., 2017). While some of this permanent strain may be “hidden” in off-fault deformation or dike intrusions at depth (e.g., Athens et al., 2016; Personius et al., 2017), we propose that at least some of this deficit may be related to inadequate resolution of elevation datasets for detecting subtle deformation outside of, or even within, mapped fault zones (e.g., Shelef and Oskin, 2010). This issue is salient in the Drum Mountains fault zone of central Utah, USA, where assigned geologic slip rates of 0.01–0.2 mm yr−1 conflict with a regional moment rate deficit and 2 mm yr−1 slip rates estimated from GPS velocity gradients (Thatcher et al., 1999; WGUEP, 2016).
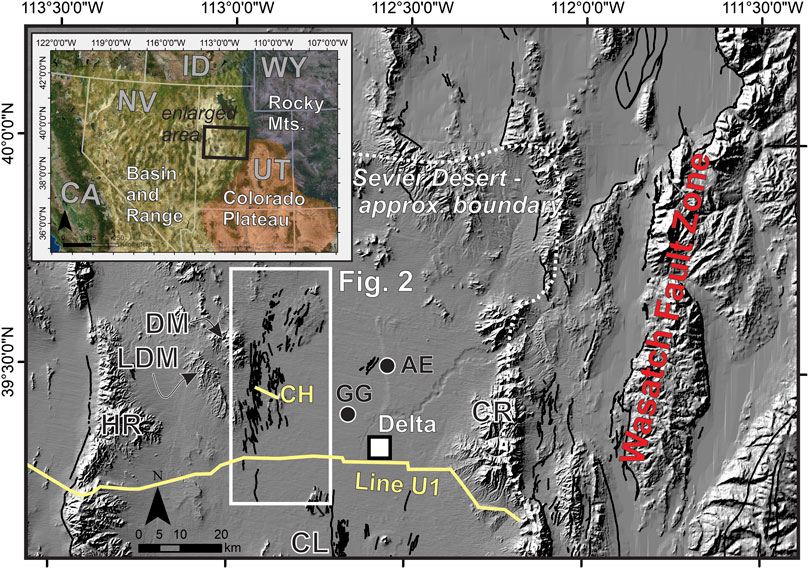
FIGURE 1. Location of the Drum Mountains and Crater Bench fault zones within the Sevier Desert of central Utah (UT), USA. The Sevier Desert is positioned in the eastern-most Basin and Range province (inset), where Quaternary normal faults (black lines) accommodate extension. The Wasatch fault zone accommodates the majority of the c. 4 mm yr−1 westward motion of the Basin and Range relative to the Colorado Plateau from continuous GPS measurements. Extension rates of Quaternary faults near Delta, Utah, are <1 mm yr−1 and < 0.1 mm yr−1 to the west in the House Range (HR) (Stahl et al., 2020). Seismic lines of Allmendinger et al. (1983) and Crone and Harding (1984), referred to in text, are shown as “Line U1” and “CH”, respectively. DM, Drum Mountains; LDM, Little Drum Mountains; HR, House Range; CR, Canyon Range; CL, Clear Lake fault zone; AE, Argonaut Energy well; GG, Gulf Gronning well.
This study uses high-resolution DSMs to investigate the tectonics of the Drum Mountains fault zone (hereafter DMFZ) in Utah, and consequently has two main focuses. First, we map faults and estimate vertical separations across deformed alluvial fans using two different photogrammetry-derived elevation products—a 5-m filtered digital elevation model (DEM) and a 2-m DSM derived from legacy aerial photographs. We validate these datasets using real-time kinematic (RTK) GPS/GNSS and terrestrial lidar scanning (TLS) data and assess their utility for fault mapping. Sparse vegetation, low-relief terrain, and scarps with vertical separations spanning three orders of magnitude make this location an ideal test case for evaluating the limits and utility of legacy aerial photographs in active fault studies. Second, we combine our remote fault maps and scarp profiles with field mapping and optically stimulated luminescence (OSL) dates to present a simple structural model and estimate time-integrated slip rates over the last c. 35 kyr for the DMFZ. Our results highlight that a significant portion of permanent strain in the Basin and Range can be accommodated by many faults with small offsets. The techniques and findings we present here could be applied throughout the Basin and Range, or other arid environments, to capture the full contribution of faults to continental deformation.
The DMFZ is located near the eastern margin of the Basin and Range province in central Utah (Figure 1). Here, the Utah-Nevada border region (Figure 1) is moving westward at c. 4 mm yr−1 relative to a quasi-stable Colorado Plateau (as measured by GPS), with c. 80% of this extension accommodated by slip on the southern Wasatch fault (Bennett et al., 2003; Hammond and Thatcher, 2004; Niemi et al., 2004; Stahl and Niemi, 2017). Near the southern terminus of the Wasatch fault, within the Sevier Desert of central Utah (Figure 1), the spatial distribution of extension becomes more complex. An array of range-bounding and intrabasin normal faults with <1 mm yr−1 slip rates contribute to the extensional budget in this region, in addition to a minor contribution from local magmatism (Stahl and Niemi, 2017; Stahl et al., 2020). The Sevier Desert has been seismically quiescent over the last c. 150 years with no > M4 earthquakes and few other instrumentally recorded events (Pankow et al., 2020).
Three models have been proposed for the origin of active faults in the Sevier Desert. Following the collection of seismic reflection data in the 1970s and 1980s (McDonald, 1976; Allmendinger et al., 1983) several authors proposed that faults expressed at the surface sole into a prominent seismic reflector interpreted as being a regional low-angle detachment called the Sevier Desert detachment (Allmendinger, 1983; Wernicke et al., 1985; Planke and Smith, 1991; Coogan and DeCelles, 1996). If this is the case, high-angle normal faults at the surface would be kinematically linked to slip on the active detachment at depth (e.g., Niemi et al., 2004). Near the Drum Mountains (Figures 1, 2), another reflector was interpreted as a folded, or “domed,” detachment called the House Range detachment (Allmendinger et al., 1983; Wernicke et al., 1985; Hecker, 1993). The House Range detachment changes from shallowly west-dipping to shallowly east-dipping, but is interpreted to be nearly horizontal under the DMFZ (Wernicke et al., 1985; Royse, 1993). In a regional reconstruction, DeCelles and Coogan (2006) interpreted the domed reflector as being related to a duplex on the Sevier-aged (Cretaceous to Eocene) Canyon Range thrust. The relationship of the DMFZ to these various geometries and levels of detachments remains unclear.
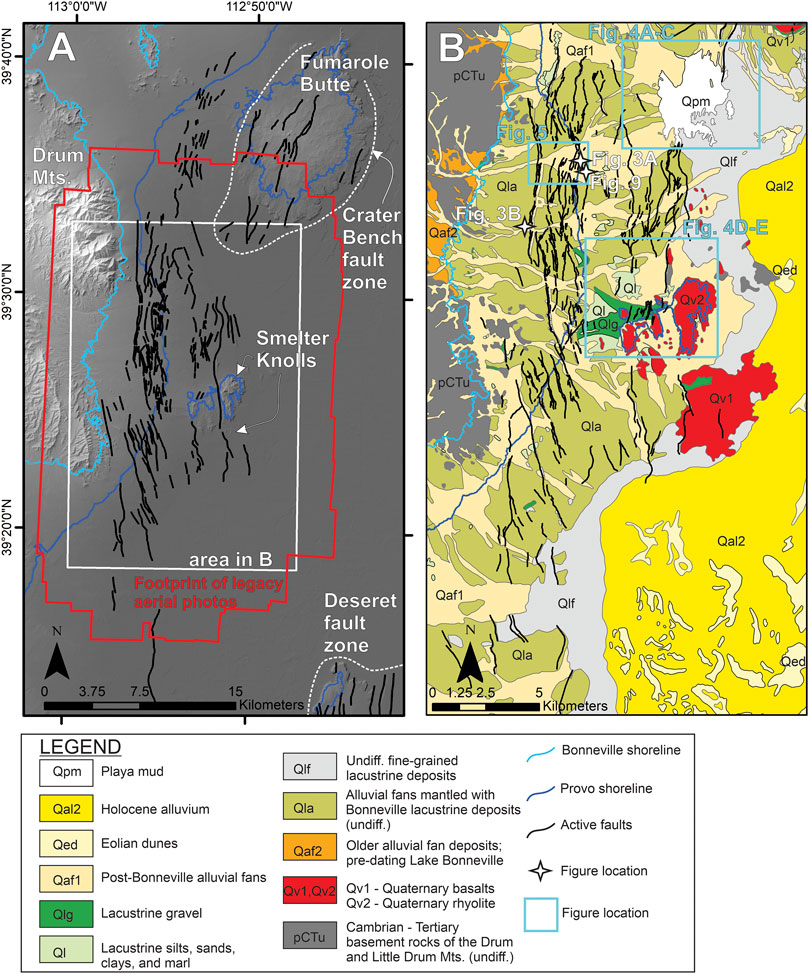
FIGURE 2. Maps of the Drum Mountains fault zone and surrounding faults. (A) Hillshaded elevation model with Quaternary faults as mapped in the USGS Quaternary Fault and Fold database (USGS, 2020) and the reconstructed elevations of the Bonneville and Provo shorelines (note, these do not necessarily represent locations of landforms). The footprint of the legacy aerial photographs used in this study is shown in red. (B) Simplified geologic map (modified after Hintze and Davis, 2002) of the primary study area with fault traces mapped in this study. The locations of subsequent figures are shown in outlines and stars.
The second model relates surface faulting to salt tectonics, on the basis of thick evaporite units (sometimes exceeding 1 km thickness) observed in regional wells and seismic reflection lines with “pull-up” anticlines interpreted as salt domes (Anders et al., 1998; Wills et al., 2005). Proponents of this model also argue that the reflector previously interpreted as the Sevier Desert detachment is at least in part an unconformity displaced by high-angle faults traceable to the surface (e.g., Smithson and Johnson, 1989). If recent faulting is related solely to salt tectonics, significant tectonic extension and moment deficits within the eastern Basin and Range at this latitude would remain unaccounted for (WGUEP, 2016).
The third model proposes that late Pleistocene and Holocene faulting in the eastern Sevier Desert is associated with coeval volcanism, subsidence, and dike-injection (Wannamaker et al., 2008; Stahl and Niemi, 2017; Stahl et al., 2020). This model was put forward on the basis of (i) spatial coincidence of faults with volcanic centers, high-heat flow, and near-vertical low resistivity anomalies that extend to depths below the Sevier Desert detachment; (ii) temporal coincidence of some faulting events with the volcanism; (iii) surface expression of faulting and far-field displacements consistent with dike-induced faulting; and (iv) adequate elastic dislocation model fit to GPS velocities with a purely tensile dislocation located at the zone of recent volcanism (Stahl and Niemi, 2017). This model precludes post-Pliocene extension on the easternmost portions of the Sevier Desert detachment, but does not rule out the influence of saline fluids or salt mobility on recent surface faulting.
Late Pleistocene and Holocene alluvial fans, volcanic edifices, and lacustrine features in the Sevier Desert are important markers for measuring fault deformation. Landforms associated with Pleistocene Lake Bonneville (and subsequent lakes formed in sub-basins after the Bonneville flood; Oviatt, 2015) provide absolute and relative age control across most of western Utah. There are numerous studies that review the geomorphological and sedimentological legacy of Pleistocene Lake Bonneville (e.g., Oviatt, 2015; Chen and Maloof, 2017) and later lakes. Below, we provide an overview of the landforms relevant to assessing recent activity in the DMFZ.
Shoreline features such as wave cut benches and depositional gravel bars, the most prominent of which formed during the Bonneville (c. 18.5 ka) and Provo (c. 15–18.5) highstands (Oviatt, 2015), are present around the Sevier Desert. The Bonneville and Provo shoreline elevations, formed during highstands of the same name, represent originally horizontal datums that have been deformed by isostatic rebound, faulting, volcanism, and/or other mechanisms of local subsidence (Currey, 1983; Chen and Maloof, 2017; Stahl et al., 2020). Between these two shorelines, more subtle depositional shorelines mark the rise of Lake Bonneville between about 30 and 20 ka (e.g., Oviatt, 2015). These transgressive shorelines are best-preserved on pre-Lake Bonneville alluvial fan surfaces (Figure 2) between the elevations of the Provo and Bonneville shorelines.
In the Drum Mountains region, alluvial fans that post-date the Bonneville shoreline (Unit Qaf1; Figure 2) are marked by a lack of lacustrine sedimentary mantle, by sharper bar and swale topography, and by their inset positions within older, higher fan surfaces (Oviatt, 1989; Hintze and Davis, 2002). Both pre- and post-Bonneville alluvial fans show variable evidence for recent regrading or deposition of fine slope wash and eolian sand. A series of Provo-aged gravel spits (Qlg) ranging in length from 2 to 6 km are present adjacent to volcanic edifices (described below) on the eastern side of the fault zone (Figure 2) (Oviatt, 1989). At scattered locations around the study area, lacustrine silts and sands (Qlf), gravels (Qlg), and marl (Qlm) are exposed at the surface and are variably pre- and post-Provo highstand in age (Figure 2).
Volcanic units that pre- and post-date Lake Bonneville can be useful strain markers for tracking fault deformation (Johnsen et al., 2010; Stahl et al., 2020). Quaternary volcanism was most recently active to the southeast of the DMFZ in the Ice Springs Subfield of the Black Rock Desert volcanic field (nomenclature of Johnsen et al., 2010). Within the DMFZ, the Fumarole Butte subfield comprises ashfall, lava flows, and tuffs ranging in composition from basalt to rhyolite (Peterson and Nash, 1980; Turley and Nash, 1980). The field has been active since c. 6 Ma. The only known Quaternary units in the Fumarole Butte subfield are the basaltic andesite of Fumarole Butte (c. 880 ± 100 ka; Peterson and Nash, 1980) (Figure 1), the rhyolite of Smelter Knolls (310 ± 80 ka; Turley and Nash, 1980), and a basaltic ash possibly erupted from a maar near Smelter Knolls (c. 24 ka; Oviatt and Nash, 2020).
The DMFZ is a maximum 8-km-wide zone of north and south-trending fault scarps on the eastern flank of the Little Drum and Drum Mountains (Figures 1, 2). The fault zone extends c. 52 km along strike and comprises over 200 linear km of north-south trending fault scarps. At its southern extent, the zone tapers in width until it is defined by a single west-facing fault scarp (Figure 1). In the north, the fault zone ranges between 2 and 5 km wide; however, many of the scarps are semi-continuous with those of the Crater Bench fault zone (Figure 2) which displaces the c. 880 ka basaltic andesite surface formed by the Fumarole Butte volcano. For the purposes of this study, we consider that these two fault zones (Drum Mountains and Crater Bench) are different in name only.
We focus our study on the central c. 35 km of the fault zone where scarps have formed on a bajada surface consisting of alluvial fans derived from the Little Drum and Drum Mountains. The fans that comprise this bajada, predominantly units Qaf1 and Qla, both pre- and post-date the Bonneville highstand at 18.5 ka (Figure 2) (Oviatt, 1989). In a few locations, gravel bars and tombolos associated with the Provo highstand of Lake Bonneville (c. 15–18 ka) are displaced by several meters. Bucknam and Anderson (1979) estimated some scarps to be early Holocene in age, or close to the age of the Provo shoreline. Individual fault traces vary in length from 100 to 200 m to c. 8 km. Scarps range in height from less than 0.5 to c. 7.5 m (Crone, 1983; Crone and Harding, 1984; Oviatt, 1989). Crone (1983) observed 3.7 m of stratigraphic separation within an enhanced natural exposure on the westernmost fault scarp (Figure 2).
Field reconnaissance (this study) and two 2–3 km-long microseismic reflection profiles (Crone and Harding, 1984) provide some constraints on the fault geometry. Seismic reflection studies of Crone and Harding (1984) (Figure 1) show reflectors with up to 80 m of offset on near-vertical faults that extend to at least 500 m depth. Strong reflectors at c. 200 m depth were interpreted to be the contact between Quaternary alluvium and Tertiary volcanic rocks. Crone and Harding (1984) also interpreted several faults at depth in their sections that are not associated with fault scarps at the surface, as well as a possible intrusion within the gently east-dipping Tertiary volcanic sequence at c. 200 m depth. Unpublished trench data demonstrate that at least some faults dip steeply (c. 75–90°) at the surface (e.g., Figure 3).
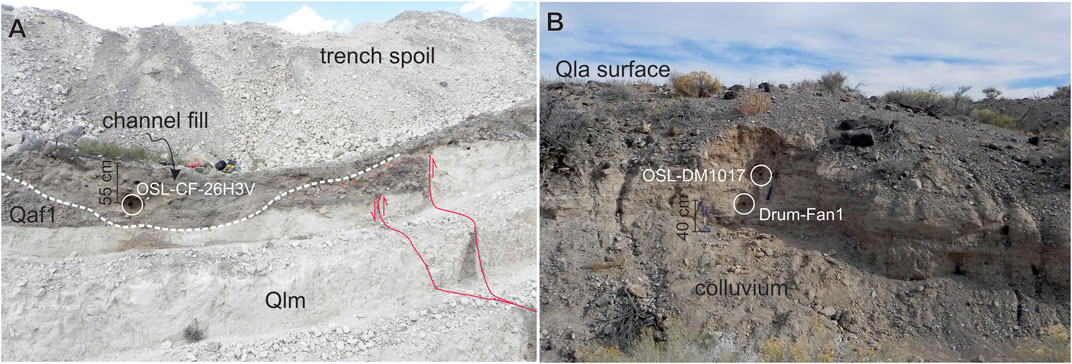
FIGURE 3. Annotated sample locations for optically stimulated luminescence (OSL) samples. (A) Photograph of a paleoseismic trench exposure showing faulting of pre- and post- Lake Bonneville strata. Qlm—lake marl deposited during the transgressive phase of Lake Bonneville (c. 20–30 ka). Qaf1—alluvial fan gravel and sand deposited during and after the overflowing stage of Lake Bonneville/Lake Provo, following the fall of the Bonneville highstand at 18.5 ka to the elevation of the Provo shoreline. Sample OSL-CF-26H3V was collected from silts and sands deposited in a channel on the hanging wall of the fault (red) and gives an indication of the age of youngest and most active deposition within map unit Qaf1. (B) Two samples (OSL-DM1017 and Drum-Fan1) were collected from sand beds within pre-Lake Bonneville alluvial fan sands and gravel (map unit Qla). Refer to Figure 2 for sample locations.
The DMFZ remains enigmatic within the context of the three models for surface faulting in the Sevier Desert. The faults could represent a shallow graben formed above the House Range detachment, which, if active, could drive net down-to-the-west extension and local uplift (e.g., Hecker, 1993). Wernicke et al. (1985), however, concluded that the House Range detachment has been inactive since c. 4 Ma due its domed geometry, interpreted as folding above an active Sevier Desert detachment. Alternatively, the Drum Mountains scarps may be related to recent volcanic subsidence or subsurface dike injections, although evidence for post-Lake Bonneville volcanic activity is absent near the Drum Mountains, and the DMFZ has unequivocally deformed post-Lake Bonneville landforms. Faulting may also be related to salt mobility or dissolution. Though there are no constraints on salt thicknesses or depths in the Tertiary sequence within the DMFZ, the Argonaut Energy well (Figure 1) encountered >1,500 m of halite and minor anhydrite within a graben c. 25 km east of the DMFZ (Lindsey et al., 1981). The Gulf Gronning well (Figure 1), located west of the Argonaut Energy well and c. 20 km east of the DMFZ did not encounter significant amounts of evaporites (McDonald, 1976); thus, any model proposing a salt tectonic influence on deformation within the DMFZ has to reconcile such deformation with the limited known spatial extent of evaporites within the Sevier Desert region.
We used a combination of field and remotely sensed datasets to characterize the DMFZ. Since one of the main objectives of this study was to assess the utility of DSMs produced from historical aerial photographs, three other topographic datasets were collected for comparison. We mapped faults remotely and in the field, but largely relied on previous mapping of late Quaternary surface geology by Hintze and Davis (2002). Alluvial fan surface ages were constrained using OSL dating of map units (Figure 2). We estimated fault separations and extension rates using topographic profiles, near- and shallow-subsurface constraints on fault geometry (e.g., from unpublished trench studies) and additional methods outlined below.
Our baseline dataset is a 5-m resolution DEM publicly distributed by the Utah Automated Geographic Reference Center (AGRC) (data and metadata available at https://gis.utah.gov/data/elevation-and-terrain/). To create this DEM, aerial photography from the National Agriculture Imagery Program (NAIP) was acquired in 2006 using an ADS40 airborne digital sensor. The camera simultaneously captured RGB, panchromatic and multi-spectral imagery at nadir, as well as looking forwards and backwards. On-board differential GPS and an inertial measurement unit were used to compute a navigation solution at 1 s epochs. Using the navigation solution and a camera calibration, location and orientation parameters of the camera (x, y, z and omega, phi, and kappa) were computed for each scan line. Imagery was then resampled to remove the effects of aircraft motion and to generate epipolar stereoimages with 1 m ground sample distance.
The resulting stereophotos have 100% overlap and multiple spectral bands available for aerotriangulation and terrain extraction. X, Y, and Z positions in point clouds were produced using the ISTAR/GPRO-Socet Set Automatic Terrain Extraction process. An auto-correlated DSM surface was then filtered to remove non-ground points (e.g., from vegetation) and a DEM was produced for each flight line at a grid resolution of 5 m. Reported horizontal and vertical accuracies are 3 and 4 m root mean square error (RMSE), respectively. The National Standard for Spatial Data Accuracy values, which define absolute accuracy at the 95% confidence level, are 5.2 m and 9.8 m in the horizontal and vertical, respectively.
We created a DSM of the Drum Mountains from legacy single frame aerial photographs collected by multiple government agencies archived at EarthExplorer (http://earthexplorer.usgs.gov). Single frame aerial images were selected from three flight projects (Table 1) flown in the 1970s by the United States Geological Survey (USGS) and the United States Air Force (USAF). Nominal scales of the aerial images were between 1:20,000 and 1:34,000. Stereo overlap for each of the three flight projects was 60%. The images are all monochrome or infrared single band images. Camera calibration files were available for the USGS flight projects, and included camera and lens information, as well as calibrated lens focal lengths; however, this information was not available for the USAF flight project. No other camera calibration or aircraft orientation data were available for the images. Film negatives from the USGS flight projects were scanned at approximately 1,000 dpi resolution and corrected for scan distortions. Film negatives from the USAF flight project were scanned at approximately 400 dpi resolution and not corrected for distortions introduced by scanning.
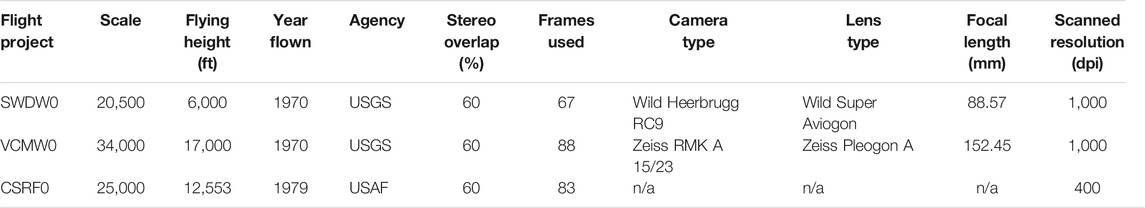
TABLE 1. Details of aerial photograph projects used to produce a 2-m DSM in Agisoft Metashape and LAStools.
Aerial image files were cropped in Adobe Photoshop to remove the negative frame and to standardize image sizes for each flight project. Final images used for DSM construction were c. 8k x 8k pixels for the USGS photographs and c. 2.5k x 2.5k pixels for the USAF photographs. These images were imported into Agisoft Metashape and grouped by flight project into separate Camera Groups. Each Camera Group was assigned the appropriate lens focal length, if known, and all other camera calibration parameters (i.e., interior and exterior orientations) were determined by optimization within the software. Images were aligned in Agisoft Metashape without the use of external tie points on an Intel 6-core i7 CPU with 32 GB of RAM, supplemented by a Tesla K40 GPU. From the aligned images, a dense point cloud was generated using an aggressive depth filtering technique. The resultant point cloud covered c. 800 km2 at a ground resolution of 73.6 cm/pixel. Typical image overlap across the Drum Mountains fault zone was >9 images, and nowhere less than 5 images.
The dense point cloud was georeferenced by identifying matching points on both the legacy aerial imagery and recent (2018) 60-cm color aerial orthophotographs produced by the USDA NAIP program. Coordinates of the matching points were extracted from the Utah 5-m autocorrelated DEM in the NAD83 UTM zone 12N (EPSG:26912) coordinate system using ArcGIS Pro. The X, Y, and Z coordinates of the tie points were then manually entered into Agisoft Metashape. The georeferenced point cloud was exported from Agisoft Metashape in .las format, and was subsequently used to generate a 2-m resolution DSM using the LAStools blast2dem tool as implemented in the LAStools toolbox.
We collected TLS at two locations within the DMFZ. The raw scans show fault detail at the highest possible resolution and are a useful dataset with which to compare the 2- and 5-m models over the limited spatial extent of TLS data collection. Data were collected with a Riegl VZ-1000 scanner. At each site, multiple scans were tied together using fixed-point reflectors georeferenced with RTK GPS/GNSS control at the scan station and a continuously operating base station. We used LAStools blast2dem toolbox to process the merged and aligned point clouds into georeferenced 1-m DSMs. Vegetation was not removed due to the low vegetation cover present at field sites, negligible effect on DSM-based measurements, and the relative difficulty in removing vegetation from ground-based (as opposed to airborne) lidar data.
A Trimble R8 GPS/GNSS receiver was used to survey fault scarps along two transects. The Utah Reference Network base stations were used to provide Virtual Reference Stations and RTK corrections of survey data. Positions were recorded every second to collect a denser assemblage of points on subtle scarps; the resulting average ground spacing distance is 0.6 m. Elevations have accuracies of less than 10 cm (within the topographic profile; these are likely to be slightly higher due to antenna wobble during the traverse) with precisions expected to be less than 10 cm.
Fault scarps were mapped in the field, on aerial photographs, and with the available digital elevation products at a range of scales (Figure 2). In some cases, short topographic disturbances identified in the DSM/DEMs were mapped as “suspected faults” as they were consistent with observations of the smallest scale, 10–50 cm-amplitude faults in the field. To assess patterns in fault orientations, we constructed a rose diagram of mapped fault traces. Strikes were calculated for east- and west-facing scarps (assuming east- and west-dipping fault planes for each, respectively) and trends were calculated for suspected fault scarps. For the latter, the quadrant depends solely on direction of the line we mapped in GIS and the orientations should be taken as symmetric about an E-W axis. Rather than fault frequency, each bin represents the cumulative length of traces with that orientation.
We found fan surfaces and shoreline features mapped by previous authors (Oviatt, 1989; Hintze and Davis, 2002) to be reliable and have not altered them (Figure 2). Three principal surface units are deformed by faulting—Pre-lake Bonneville alluvial fans with lacustrine mantle (Qla), Post-Lake Bonneville alluvial fans (Qaf1), and gravel spits of the Provo shoreline (Qlg) (Figure 2). The ages of these units are discussed in subsequent sections.
We calculated net vertical separations of alluvial fan units in transects across the fault zone. This calculation reflects whether there is net down-to-the-east or down-to-the-west vertical separation. For example, two oppositely-facing scarps, each with the same vertical separation, would sum to have zero net vertical separation. East-west oriented transects were spaced 0.5 km apart and the offset on each fault scarp is measured where the mapped surface trace intersects a transect line. We limited the transects to regions where fault scarps displace young alluvial or pluvial surfaces to avoid large displacements recorded in the c. 900 ka volcanic rocks of Fumarole Butte (Fig. 2).
For the 5-m DEM and 2-m DSM, extracted elevations were taken from a profile swath 30 m wide, 300 m long, and oriented perpendicular to mapped fault traces. We then selected the elevation points that best represented the original up- or down-thrown surfaces and fit a line to the points. These linear fits were projected to the center of the scarp, where we measured the vertical separation and one standard deviation error. East-facing and west-facing scarps were assigned “positive” and “negative” vertical separation values, respectively. As a measure of uncertainty, we combined the standard deviations of elevations on both sides of the fault after detrending elevations by the lines of best fit. The vertical separations were summed along each transect, with uncertainties summed in quadrature.
Measuring vertical separation can have important implications for calculating the true displacement vector depending on the geometry of the displaced geomorphic surface and the interaction with the fault (Mackenzie and Elliott, 2017). The scarps measured here offset alluvial fan or playa surfaces, which do not exceed a 7° slope. Even with the steepest slope angles of 7°, and assuming a reasonable, relatively steep fault dip (>70°), the vertical separation differs from the throw by a maximum of 4.5%. At the resolution of our datasets, this is generally far below the scarp vertical separation measurement error.
The profile technique we used does not capture or incorporate any potential lateral component of slip. While we did not find consistent, measurable instances of lateral displacement within the study area, even small amounts of lateral slip can significantly influence the vertical separation across the fault scarp when the local topographic slope is not parallel to the lateral slip direction (Mackenzie and Elliott, 2017). However, here the scarps face the same direction as the geomorphic surface aspect and offset sub-horizontal surfaces. Thus, the effect of a small horizontal component of slip would have a negligible effect on the measured vertical separation and calculated fault throw values. There has been no strike-slip detected on other faults in the Sevier Desert (Stahl et al., 2020).
We collected three samples for OSL dating—two from a natural exposure of unit Qla and one from an unpublished paleoseismic trench across Qaf1—to constrain (i) the age of near-surface fan deposits for largely intact pre-Bonneville highstand alluvial fans (Qla) and (ii) the age of recent, shallow deposits along fault scarps on post-Bonneville highstand alluvial fans (Qaf1). For the latter, we were interested in using the result as a representative minimum age for unit Qaf1 in one of the more active locations on the fan (see results section below). While the ages of near-surface deposits within these two units are likely to vary widely, we were most concerned with obtaining minimum and maximum bounds for ages of the fan surfaces rather than presenting a detailed chronology for each.
Samples Drum-Fan1 and OSL-DM1017 were collected from the same wash-cut exposure of alluvial fan sands and gravels at c. 2 m depth (Figures 2, 3B). The exposure was cleared of colluvium and pavement cover to 60 cm depth. Both samples were taken from sand lenses dipping in the same direction as the fan surface (Table 2). Sample OSL-CF-26H3V was taken from the hanging wall of a fault exposed in an unpublished trench (Figure 3A). The sample was collected at 55 cm depth from finely bedded silt and sand within channel fill that post-dates the most-recent earthquake on the fault.
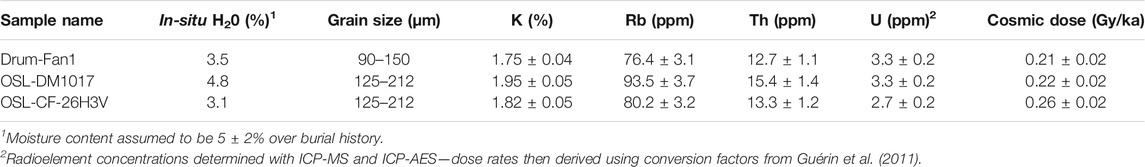
TABLE 2. OSL laboratory and dose rate information.
All samples were processed for single-aliquot quartz OSL at the Utah State University Luminescence Laboratory. Quartz was separated following standard mineral separation procedures to a grain size of c. 90–150 µm. The single-aliquot regenerative dose (SAR) procedure was used to bracket equivalent dose and correct for sensitivity (Murray and Wintle, 2003). We used central age models (Galbraith and Roberts, 2012) for determining equivalent dose as there was no evidence of partial bleaching. Dose rates were calculated from U, Th, K and Rb content, water content, and cosmogenic dose (Aitken and Xie, 1990; Aitken, 1998). OSL ages were then calculated and reported at 2σ error.
We estimated the net extension rate in two transects across the center of the fault zone (Figure 2). At this location, both fan units span the entire width of the fault zone and we can therefore calculate time-integrated extension rates across both pre-Bonneville (Qla) and post-Bonneville fan (Qaf1) units. Topographic profiles across the fault scarps were drawn from the best available data at that site (RTK GNSS and 5-m DEM in all cases). The MCSST toolbox of Wolfe et al. (2020) was used to generate probability distributions of dip-slip and extension rates in a Monte Carlo approach (Thompson et al., 2002).
Dip-slip and extension rates provide two end member scenarios for the true extension rates across the fault zone at depth: (i) in the case that all faults sole into a sub-horizontal detachment, the dip-slip rate summed across all faults at the surface would be equal to the extension rate at depth; and (ii) in the case that all steeply-dipping faults do not become more gently dipping at depth, the extension rate at the surface is representative of the extension rate at depth. In our calculations, we used a uniform distribution of near-surface fault dip between 75 and 90 degrees and a scarp-fault intersection point of 50 ± 10% along the scarp, which is consistent with field observations. Age distributions were generated using the results and rationale in the sections below.
A comparison of the 2-m DSM built with legacy aerial photographs with the other elevation products reveals clear differences and discrepancies (Figures 4, 5). The DSM returns poor or unrealistic elevations near the edges of the model, in areas of high relief (although in our case, those also correspond to the edges of the model), and over light-colored and more featureless surfaces (e.g., playa deposits) (Figures 4A,B,C) (Micheletti et al., 2014). The availability of multiple color bands and 100% photo overlap in production of the 5-m DEM seems to minimize these issues. Our SfM model (2-m DSM) returns the best results on textured surfaces, such as alluvial fans and active washes (e.g., with “unique” features for SfM matching) and features with low to moderate relief (Figures 4D,E). In general, the 2-m DSM is most useful for mapping fault scarps when used in conjunction with the aerial/satellite photography and when scarp heights exceed the 2-m grid resolution of the DSM. Additional vegetation filtering may improve the SfM models to some degree, but is challenging in the absence of spectral information and would likely degrade the resolution of the resultant DSM. Where our four elevation datasets overlap, the 2-m DSM yields results reasonably consistent with, but noisier, than the TLS, RTK, and the 5-m DEM data (Figures 5, 6). Fault scarps with >1 m height can be reliably identified and smaller scarps <1-m-high are shown as breaks in topography; however, these elevation breaks are of similar amplitude to sagebrush heights and therefore difficult to identify reliably. The 5-m DEM and RTK survey provide the least noisy data—the RTK survey points were collected while avoiding vegetation and the DEM in theory should have vegetation filtered out. The unfiltered TLS data are noisier and vegetation coverage at this particular transect means some of the scarps are not imaged well (Figure 6A). The RMSE of detrended data (to adjust for datum differences; Figure 6B) against the 5-m DEM data yielded values of 0.36, 0.70, and 0.48 for the RTK survey, 2-m DSM, and TLS datasets, respectively. Over the scale of the graben in Figure 6, non-linear distortions are present but minimal in the 2-m DSM, as indicated by the good fit to a 1:1 line between the 5-m DEM elevations and other datasets (Figure 6B).
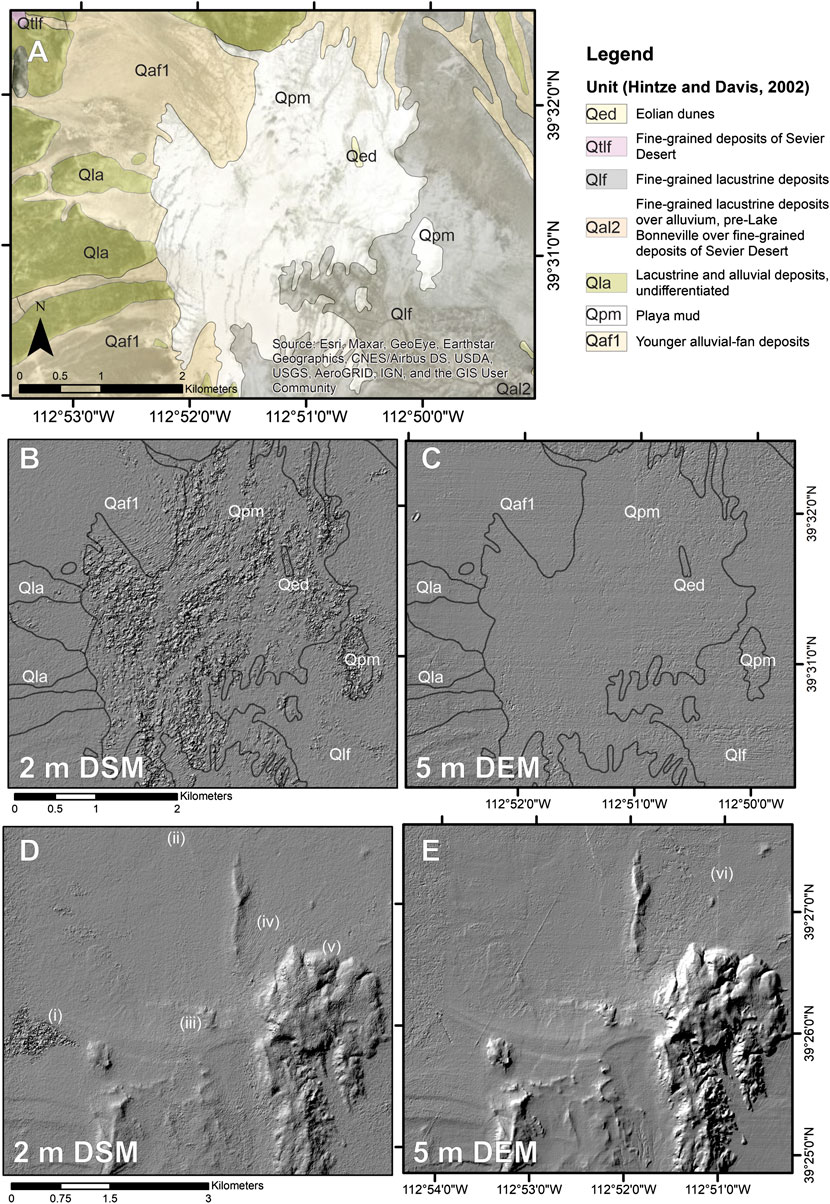
FIGURE 4. A comparison of the 5-m AGRC DEM and 2-m DSM (produced from legacy aerial photographs) in different terrain and map units. (A) Map units from Hintze and Davis (2002) overlain on satellite photography. (B) and (C) demonstrate that the light-colored and reflective unit Qpm (playa mud) generates significant noise and artifacts in the 2-m DSM; color filtering in the processing of the 5-m DEM likely helps remove this effect. Surfaces that may be impacted by frequently occurring geomorphic processes (eolian transport/deposition; playa flooding and resurfacing) are also more likely to decorrelate over the decadal span of legacy aerial photograph collection than over the days or weeks needed to acquire the NAIP imagery. The 2-m DSM performs better in higher relief (D) but is still noisier and less ‘sharp’ relative to the 5-m DEM (E). Roman numerals (i–v) in (D) indicate the locations to compare and contrast to the 5-m DEM in (E). (I) Noise from unit Qpm; (ii) a fault scarp at the limit of detection in the DSM but clearer in the DEM; (iii) a fault scarp displacing a Provo-aged tombolo evident in both DSM and DEM; (iv) a radial fingerprint artifact generated by an area of flat terrain adjacent a ridge of basalt; (v) location of a sharp Provo shoreline bench inscribed into Smelter Knoll (not evident in (D) but visible in (E)); (vi) Shows a seamline artefact in the 5-m DEM not visible in (D). Refer to Figure 2 for locations of A–C and D–E.
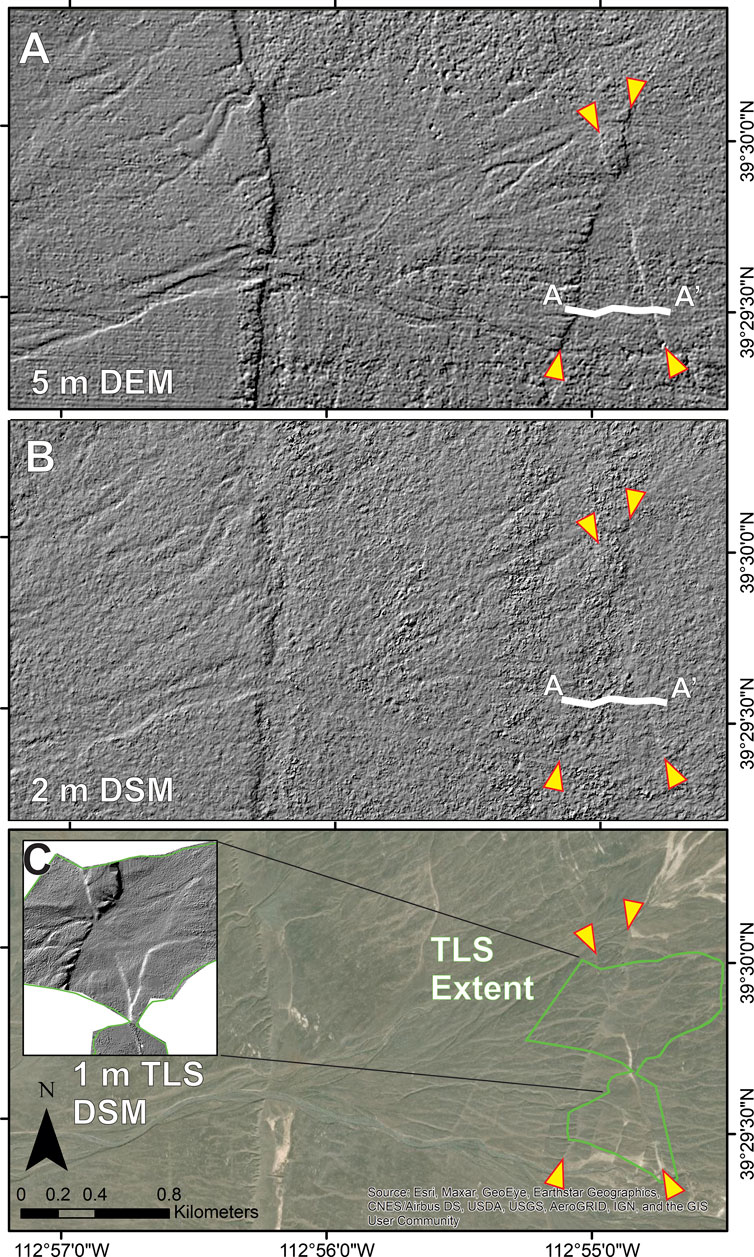
FIGURE 5. A comparison of the 5-m DEM, 2-m DSM, and TLS DSM in a swath from the western-most fault trace (c. 7.5 m vertical separation) in the central part of the DMFZ. The traces of two cross-cutting antithetic faults are indicated by yellow arrows in all figures. Secondary traces within the graben are highlighted by light-colored, fine-grained alluvium in (C). Location of topographic profile A-A’ (Figure 6) shown in white. Scale and coordinates in (C) apply to (A) and (B).
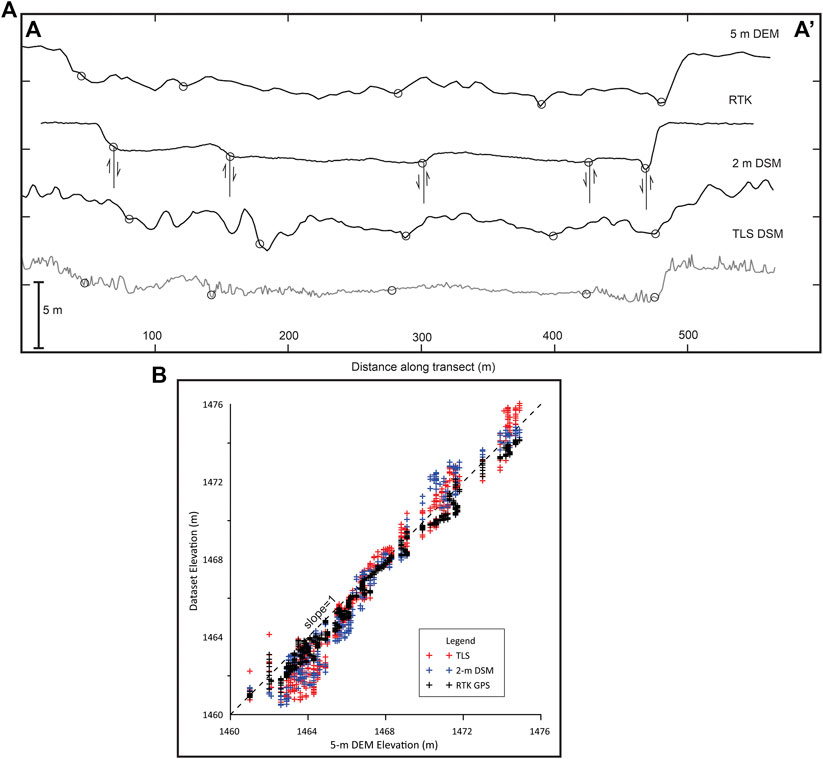
FIGURE 6. (A) Detrended topographic profile A-A’ (Figure 5) from all elevation datasets at the cross-cutting faults shown in Figure 5 and (B) a comparison of unadjusted elevations to elevations in the 5-m DEM. Vertical exaggeration in (A) is 10x. Circles in (A) indicate the locations of mapped fault traces. All datasets roughly follow a trend line with slope=1, indicating negligible non-linear distortions over this small area. TLS and 2-m DSM datasets exhibit larger scatter, which is partially due to the lack of vegetation filtering.
Overall, there are approximately equal length distributions of east- and west-facing scarps throughout the fault zone (Figure 7). Fault traces range in length from c. 20 m to 8 km with a median of 380 m and average of 600 m. There is a slight increase in the cumulative length of west-facing scarps from south to north (Figure 7). The cumulative length of faults we mapped as “suspected” are greater in the southern and northern sections of the fault zone.
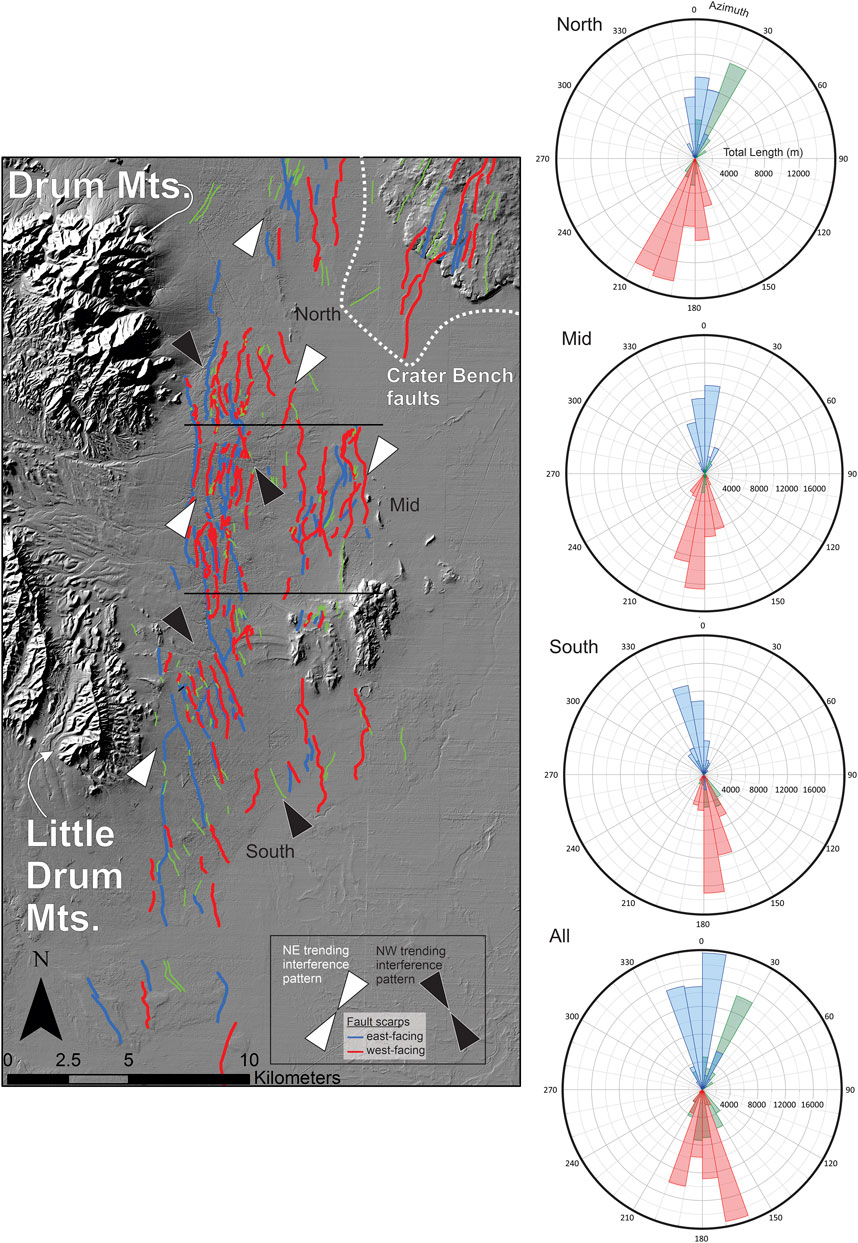
FIGURE 7. Rose diagrams of strikes (for faults with dip directions, blue and red) and trends (for suspected faults, green) of faults/fault traces in the Drum Mountains fault zone. In each, the trends of suspected fault traces should be considered symmetric about the x-axis. East-facing faults (blue) and west-facing faults (red) are assigned strikes based on the dip direction. We arbitrarily created three sections to the DMFZ—North, Mid, and South—based on a qualitative assessment of the fault patterns along strike. For example, the boundary between North and Mid sections was specified based on the apparent “die out” of the eastern branch of faults in the central part of the fault zone. An analysis of all three sections is presented in the bottom diagram. Black and white arrows highlight interference pattern of NW and NE oriented fault sets, respectively. Note that the cumulative lengths of east and west-dipping faults are approximately equal over the fault zone.
There are a few more nuanced patterns to the orientations of mapped faults that could be relevant to interpreting the evolution of the fault zone. In the south, most fault traces follow a NNW (SSE) trend (Figure 7). Both west-facing and suspected scarps, and to a lesser extent east-facing scarps, progressively shift towards the NE (SW) towards the north. In the northernmost section, this is due to the orientation of scarps on Crater Bench. In our mapping, there is a clear cross-cutting pattern of c. 330–340° and 020–030° trending scarps (both east- and west-facing) that overlaps the overall N and NNW trend of the northern and central fault sections (Figure 7).
Trends in summed and net vertical separations over the length of the DMFZ were similar from the 2-m DSM and 5-m DEM (Figure 8). The 1σ uncertainties in net vertical separations derived from the 2-m DSM (shaded region in Figure 8) are everywhere larger than those of the 5-m DEM. In places, uncertainties in the magnitude of vertical separations exceed the measurements themselves, which we consider to be the result of noise, artifacts, and distortions (e.g., Figure 4). Thus, while the 2-m DSM results are noisy and are hindered by data quality near the edges of the model, the agreement between the datasets along much of the fault zone signals that the aerial photo-derived DSM does reliably pick up c. 1–7 m vertical offsets observed in the 5-m DEM.
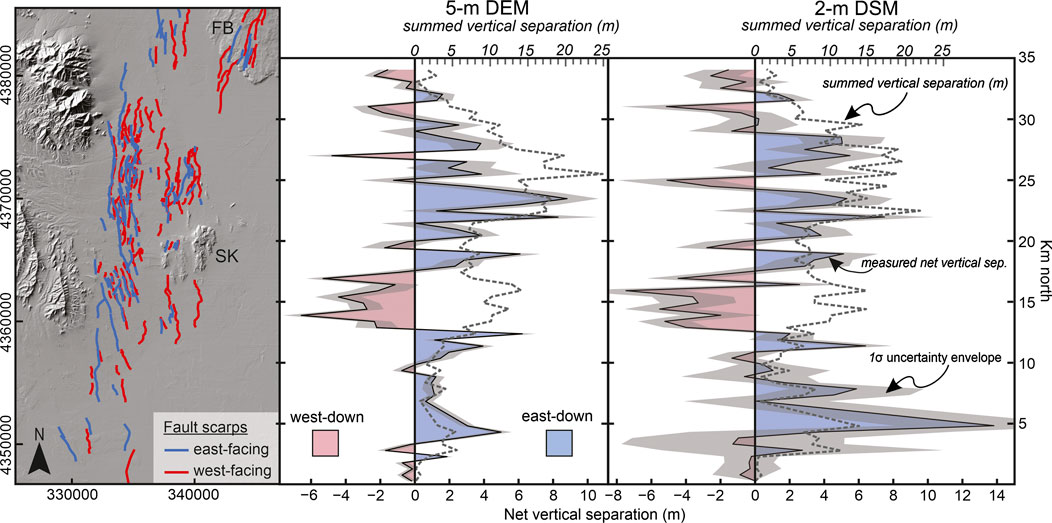
FIGURE 8. Net vertical separations calculated in 500 m-spaced E-W transects in the 5-m DEM and 2-m DSM. In both the map and graphs, blue indicates east-down displacement (positive) and red indicates west-down displacement (negative). Shaded regions indicate the 1σ uncertainty of net separations. The results show a net east-down displacement along most of the fault zone, with a maximum of c. 10 m—which is evident in the 5-m DEM but not the 2-m DSM. Summed vertical displacement irrespective of scarp direction is shown by the grey dashed line (note different scale at top of graphs in grey). FB–Fumarole Butte. SK–Smelter Knolls.
The net vertical separations calculated from the 5-m DEM and 2-m DSM both show that there is a net east-down sense of displacement along most of the fault zone (Figure 8), but that in many places the value is indistinguishable from zero due to uncertainty. In the center of the fault zone (i.e., between 20 and 25 km along-strike), the fault zone has a maximum of c. 7 m net east-down displacement. Here, approximately 30% of the c. 20 m of summed separation results from c. 7.5 m of east-down displacement on the 10 km-long westernmost fault trace (Figure 7). The fault zone has net west-down displacements at its northern and southern tips, at c. 15 km along-strike (with a maximum of 6 m net west-down displacement), and sporadically in between. There is an overall parabolic form to the summed vertical separations (Figure 8).
Ages for pre-Bonneville alluvial fans (Qla) are constrained by two OSL dates near the top of the fan unit and the age of the Bonneville shoreline (c. 18.5 ka). OSL samples DrumFan1 and OSL-DM1017, yielded burial ages of c. 35.8 and 37.2 ka (Tables 2, 3). The sample ages are in reverse stratigraphic order, which is not surprising given the c. 8 ka 2σ age uncertainties. We accept the weighted average of the two ages, 36.5 ± 8.6 ka, as the “maximum age” of the pre-Bonneville alluvial fan surface. This is no doubt a simplification—the ages of alluvial fan surfaces within any map unit will vary. Nevertheless, a maximum surface age of 36 ka is consistent with transgressive Lake Bonneville shorelines that formed on the surface of Qla between 30–18.5 ka. We assign a minimum Qla surface age of 18.5 ka, the age of the Bonneville shoreline (Lifton et al., 2015). As a conservative approach, we use a uniform age distribution between these two constraints for our extension rate calculations.
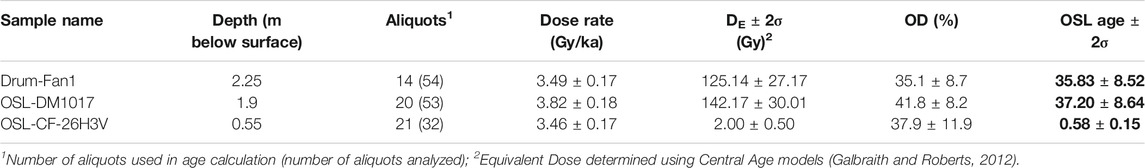
TABLE 3. OSL field, laboratory, and final age information.
The ages of post-Bonneville alluvial fans (Qaf1) are constrained by the age of the Bonneville flood, stratigraphic relationships near the Provo shoreline, and one OSL sample constraining recent fan activity. Sample OSL-CF-26H3V returned an age of 0.58 ± 0.15 ka, indicating relatively recent channel erosion and fill at the base of one of the tallest fault scarps on the post-Bonneville-aged fan surface. This particular location is c. 150 m away from the most active dry wash draining the Drum Mountains and directly along one of its subsidiary channels that flows along the main fault scarp (Figure 5). As such, we anticipate this is one of the most active locations on the Drum Mountains bajada surface, and the luminescence age of c. 600 years simply indicates ongoing but relatively slow rates of resurfacing on the post-Bonneville fan surface.
Stratigraphic relationships at the OSL sample location (Figure 3A) and in an exposure located c. 100 m down-fan (Figures 2, 9) show that post-Bonneville fans (Qaf1) began forming during occupation of the Provo shoreline and are subject to continued deposition. The sharp, erosional contact of fan sediments with underlying Lake Bonneville marl in the trench exposure (located immediately above the elevation of the Provo shoreline; Figure 3A) clearly indicates that subaerial fan gravels postdate the Bonneville highstand shoreline. Near the elevation of the Provo shoreline (Figure 2), an exposure shows Qaf1 fan gravels variably eroded into, or interbedded with lacustrine silts and sands that extend upwards to near the fan surface (Qlf; Figure 9), suggesting significant syn-Provo fan deposition. Pebbly sand-filled krotovina near the contact between Qaf1 and Qlf (Figures 9B,D) demonstrate that there were periods of some stability during initial deposition of Qaf1, whereas backset beds within Qaf1 indicate at least one episode of sheet flooding (Figure 9C). Finer channel fill deposits that cross-cut both Qaf1 and Qlf (Figure 9A), as well as the exposure of channel fill at sample OSL-CF-26H3V, demonstrate that the Qaf1 surface comprises a range of subsurface facies with different ages.
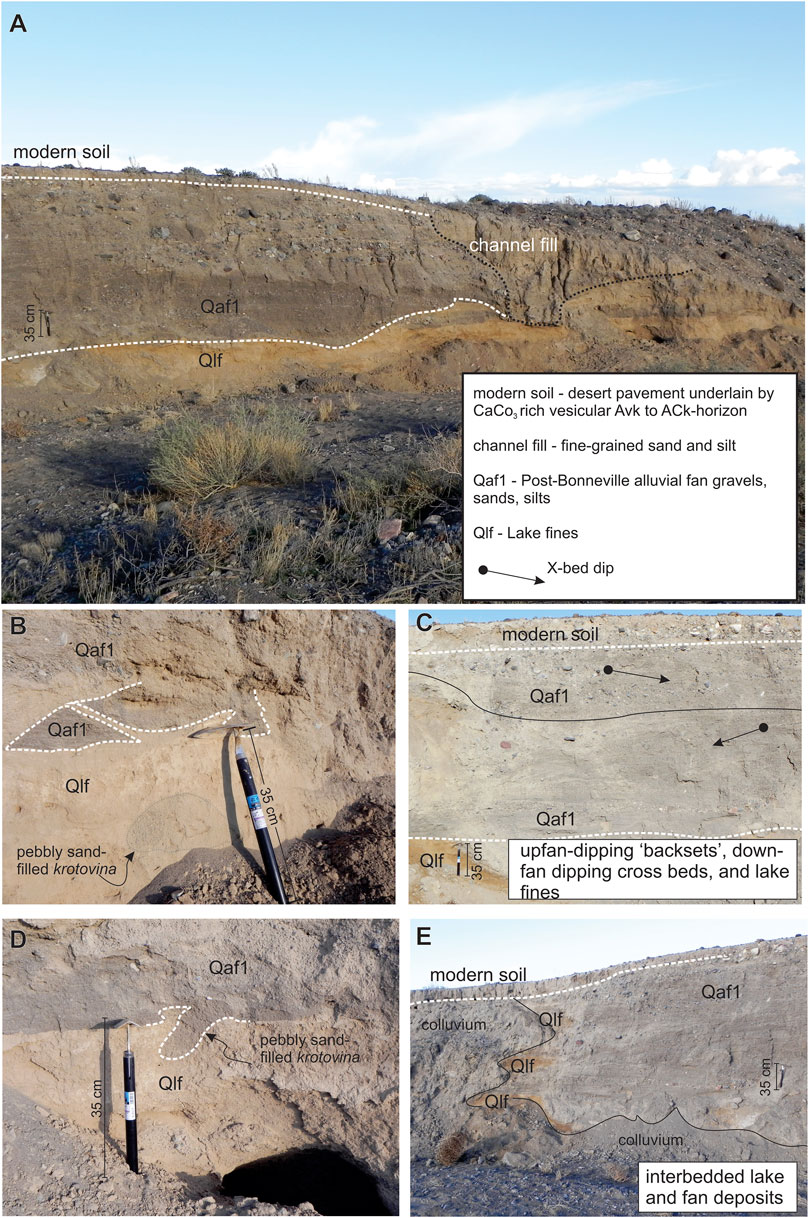
FIGURE 9. Outcrop showing the contact of post-Bonneville alluvial fan (Qaf1) over Provo shoreline–aged lake fines (Qlf) near the elevation of the Provo shoreline (1,460 m) and immediately down-fan of profile A-A' in Figure 5. The relationships in B-E demonstrate that Qaf1 began forming immediately following the fall of the Bonneville shoreline and, at this location, formed relatively rapidly during occupation of the Provo shoreline. In more active locations, post-Provo channels have been incised and filled within the Qaf1 surface (A) and Figure 3). (B) Lenses of Qaf1 sandy gravel are present within Qlf near the contact. (C) Cross-beds within Qaf1 indicate bidirectional flow (arrows; up-fan and down-fan). (D) Possible burrow at the basal contact between Qaf1 and Qlf. (E) Interbeds of Qlf and Qaf1 approaching the modern surface.
To synthesize this information and to account for the range of deposits making up unit Qaf1, we model the Qaf1 surface age as a triangular probability distribution. We assign the highest probability peak to the age of the Provo shoreline abandonment at 15 ka (Miller, 2016), based on our observation that lake fines are interbedded with fan sediments through much of Qaf1 (Figure 9E) and the interpretation that the majority of the Qaf1 unit formed during occupation of the Provo shoreline. We use a maximum age of 18.5 ka which represents the earliest possible time at which post-Bonneville shoreline alluvium could be deposited. We use a minimum age of 0.5 ka based on the age of sample OSL-CF-26H3V and the observation that the Qaf1 surface is in places underlain by very recent channel fill deposits. While highly uncertain, this age range is a conservative approach to assigning an age to a complex and actively forming fan surface.
Extension rates were calculated and summed in two transects across units Qla and Qaf1. (Figure 10). We used elevations from RTK GNSS surveys (where available) supplemented with the 5-m DEM because these datasets both represent “bare Earth” elevations, have the highest accuracies, and follow a 1:1 line (Figure 6B). Transect 1 (Qaf1) contained 11 scarps in the topographic profiles and transect 2 (Qla) contained 13 scarps (Figure 10). The faults comprise both east- and west-facing scarps in all transects (e.g., Figure 10B).
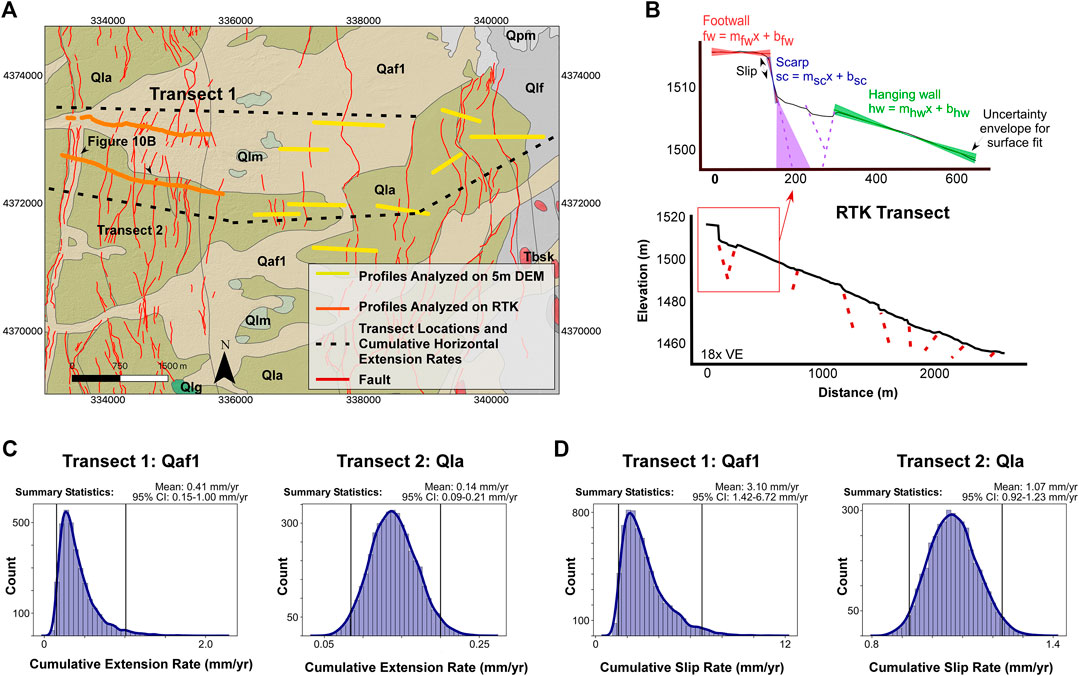
FIGURE 10. Summed extension rates measured across two transects of the DMFZ within units Qaf1 and Qla. (A) Location of the two transect lines, mapped fault scarps, and individual profiles used to construct the elevation profiles along each transect. The profile combines RTK survey (orange lines) and 5-m DEM elevation data (yellow lines); profile locations were chosen as close to the transect lines as possible and are oriented perpendicular to the local scarp trend. (B) An example profile (location indicated in A) from the Qaf1 surface with schematic faults in cross-section and fault scarp components for one scarp profile. (C) Summed extension rates across the two transects in (A) in mm yr−1 for faults with steep dips (75–90°). (D) Summed extension rates across the two transects in (A) resolved onto a 0°-dipping detachment.
In the center of the DMFZ, the results show time-integrated extension rates of
Because there is the possibility that extension on these steeply-dipping faults at the surface is resolved onto a common “master” detachment at depth, extension rates at the surface might underestimate the true extension rate at depth. If, for example, the faults sole into a horizontal House Range detachment at depth, then the cumulative dip-slip rate summed across faults at the surface would be equivalent to the extension rate on the 0°-dipping detachment (e.g., Axen et al., 1999). We calculated these rates to be
With the availability of multiple topographic datasets and field data, the DMFZ presents an excellent test case for evaluating the utility of aerial-photograph-derived elevation products in neotectonic studies. Natural challenges of the area include low relief, diffuse deformation and the lack of fault trace continuity. Our 2-m DSM, derived from applying SfM photogrammetry to legacy aerial photographs, is affected by data artefacts and distortions in areas of limited photo overlap (e.g., near the edges of the model), open flat terrain with reflective surfaces (both of which complicate feature matching during processing) (Figure 4) (Micheletti et al., 2014), and noise from unfilterable, low-amplitude vegetation (e.g., Figure 5B). Despite these challenges, we can generally identify mapped fault scarps with ≥1 m vertical separation and several short traces with <1 m vertical separations in our 2-m DSM. More importantly, the vertical separations we calculate across the fault zone in the 2-m DSM match well with those calculated from the 5-m DEM (Figure 8). In making claims about the utility of the 2-m DSM, it is important to recognize that we had the advantage of field data, recent aerial and satellite imagery, and other high-resolution topographic products to guide our fault mapping—many of the traces could not have been identified using the 2-m DSM alone. Additionally, we recognize that the 5-m DEM provided by the Utah AGRC is a superior surface model due to 100% photo overlap (from photographs taken at three angles at every location), use of a modern digital camera with integrated camera calibration information in the metadata, and multiple spectral bands for processing.
In acknowledging differences between the datasets, it is important to consider how Agisoft Metashape optimizes and computes points in the generation of SfM models. Agisoft employs a mathematical (rather than physics-based) routine to estimate internal and external camera orientation parameters in the absence of that information being provided (e.g., in a camera calibration file) (Agisoft, 2020). The accuracy of those parameters and distortions in the final model will depend on several factors including the amount of overlap in the imagery. Agisoft will then optimize the surface model and camera parameters by minimizing residuals with reference coordinates. Thus, the quality of reference coordinates that are identifiable in the historical photos, availability of camera calibrations, and the details of the acquisition itself all play significant roles in the quality and resolution of the model.
Our results are significant because they highlight some potential limits of using legacy aerial photographs for neotectonic studies. Historical aerial imagery is widely available and easily processed to DSMs through SfM software. The actual resolution, accuracy, and precision of measurements and mapping on DSMs will depend on the factors above. However, in actively deforming terrain, or in the case of using pre- and post-event data to create difference models (e.g., Milliner et al., 2015; Lajoie et al., 2020), the quality of older photographs and the resulting DSMs must be considered in evaluating displacement uncertainties.
The pattern of surface faulting in the DMFZ is unlike that of most range-front normal faults in the Basin and Range province. While the northern Drum Mountains do show a relatively sharp and faceted range front (e.g., Figure 7), the lack of a recent scarp there, with no strong net east-down component on fault scarps stepping away from the range (Figure 8), as well as a subdued range front in the Little Drum Mountains to the south, make it unlikely that the faults deforming the bajada surface have been responsible for the uplift and tilting of the Drum Mountains in the long term (Oviatt, 1989). Dommer (1980) interpreted that most Basin and Range fault-related tilting in the Drum Mountains has been negligible since the Miocene. Despite this observation, there is evidence of recurring motion on the faults in the DMFZ over at least c. 1 Ma (Crone and Harding, 1984) and of several paleoseismic events over the latest Pleistocene and Holocene (Crone, 1983; this study; unpublished trench data).
Interpreting the behavior of the DMFZ requires a more holistic review of the factors that make the fault zone unusual. Cross-cutting relationships indicate that a few fault sets have been active concurrently since the formation of post-Bonneville fan surfaces (Figure 7). As an example, at the location of our TLS survey, NE- and SE-striking faults cross-cut each other, resulting in an along-strike transition from graben in the south to horst in the north between the same two fault scarps (Figure 5C). Faults are steeply dipping to near-vertical in limited outcrop and trench exposures (e.g., Figure 3) and in seismic reflection to c. 500 m depths (Crone and Harding, 1984). Unpublished trench data shows that at least two faults have a significant component of opening (up to 50 cm) to at least 3 m depth, though this could just be due to observed near-surface mechanical stratigraphy contrasts (e.g., Ferrill et al., 2017). There is a net-east-down displacement across much of the fault zone with abrupt, intermittent shifts to net-west down displacement. However, in many places, net-displacement values are indistinguishable from zero within uncertainty (Figure 8). Surface extension rates across the center of the fault zone (Figure 10) range from c. 0.1–0.4 mm yr−1 over the last c. 36 ka, and are among the highest fault extension rates in the eastern Sevier Desert (Stahl et al., 2020). These rates are over an order of magnitude higher than the preferred geologic extension rates, assuming similar fault dips to ours, for the DMFZ (WGUEP, 2017).
Donath (1962) attributed similar patterns and styles of near-vertical normal faulting in the Basin and Range of Oregon to the reactivation of conjugate strike slip faults. Indeed, in the western Basin and Range more broadly, distributed intrabasin faults and mode 1 fractures are common and might be due to the interplay of strike-slip and extensional deformation (e.g., Caskey et al., 2004; Foy et al., 2012). While no unequivocal evidence of strike slip deformation exists in the modern tectonic context of the eastern Basin and Range of central Utah, reactivation of inherited faults could play an important role in guiding the pattern of DMFZ faulting.
Without yet speculating on the underlying mechanism driving extension, we believe the tectonic geomorphology and pattern of interfering surface faults in the DMFZ can be explained by (i) a series of fault-bounded basins and nascent relays between them (Figure 11) and (ii) reactivation of pre-existing failure surfaces observed as bedrock faults within the Drum Mountains. Within this framework, surface faults in the DMFZ accommodate the transfer of displacement between the N-trending Clear Lake-Delta graben and gravity lows to the east (Planke and Smith, 1991) and the NE-trending Crater Bench horst and gravity high to the north (Hardwick and Chapman, 2011) (Figure 11).
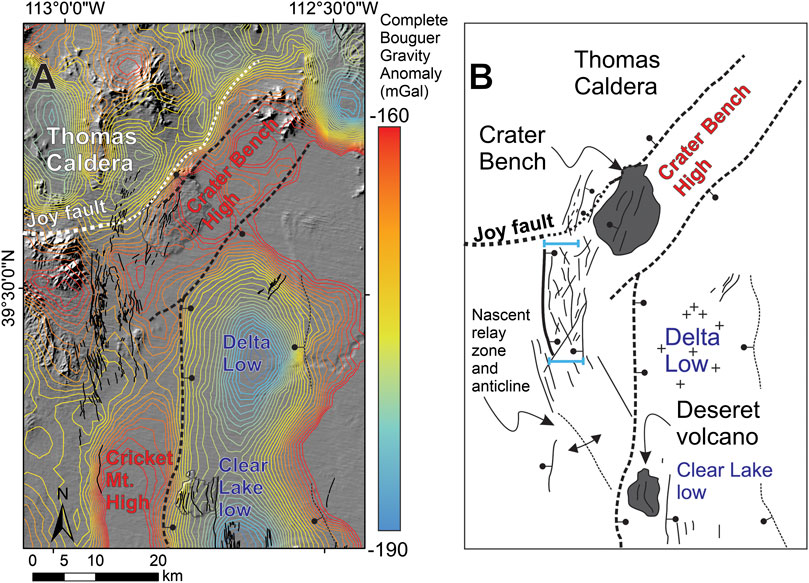
FIGURE 11. (A) Complete Bouguer gravity anomaly map with Quaternary faults and (B) a schematic interpretation of the pattern of faulting (B). The trace of the Joy fault—a caldera collapse fault of Oligocene age (Dommer, 1980)— is shown in white dashed line (thick where mapped and thin where inferred). Light blue lines in (B) demarcate the position and width of a negative gravity anomaly within the DMFZ and bounded by highs of Crater Bench and Drum Mountains to the east and west, respectively. Plus symbols in (B) indicate significant accumulations of evaporites in the subsurface. Our interpretation of the DMFZ is that it accommodates extension between a graben in the eastern Sevier Desert (prominent gravity lows near Delta and Clear Lake) and an obliquely trending horst under Crater Bench (Hardwick and Chapman, 2011). The subtle shifts in fault orientation along the DMFZ can be attributed to the formation of a relay zone and anticline in the south and north, as well as the reactivation of older, predominant fault sets observed in the Drum Mountains (Crittenden, 1961; Dommer, 1980). In the north, the rim of the caldera may also control fault orientations.
Northeast trending, predominantly west-down faults within the eastern DFMZ (Figure 11) are developing as the result of southward propagation of the Crater Bench fault zone above a horst interpreted from the complete Bouguer gravity anomaly Hardwick and Chapman, 2011; Figure 11). A negative gravity anomaly running N-S in the center of the DMFZ (Figure 11) could represent the formation of a nascent graben. We interpret NW-trending faults, particularly those in the south (Figure 7), to be nascent linking structures between the DMFZ and the “western basin-bounding fault” (Planke and Smith, 1991) to the east. This would result in broad surface warping between the DMFZ and basin-bounding fault that could explain the apparent localized uplift inferred at this location between the southern DMFZ and northern Cricket Mountain gravity high (Anderson and Barnhard, 1992; Hecker, 1993) (Figure 11). Similar patterns and orientations of surface folding within fault accommodation zones have been observed elsewhere in the Basin and Range (Egger et al., 2014).
Throughout the DMFZ, NE- and NW-trending faults may be reactivated pre-existing fault sets observed in basement rocks of the Drum Mountains (Crittenden, 1961; Dommer, 1980). The Joy fault (Figure 11), a caldera-collapse fault bounding the northern Drum Mountains, was interpreted by Lindsey (1982) to have influenced the structural style of early Basin and Range extension and the formation of NW-trending normal faults in the northern Drum Mountains. Minor NW-trending traces there could be related to the pre-existing caldera structure, but most surface traces that have been active since formation of the Provo shoreline cut across the underlying Joy fault (Figure 11), indicating the caldera does not exert a primary control on fault zone structure.
The data and model presented above have some bearing on what drives the diffuse deformation in the DMFZ—that is, whether the structural complexity we interpret could be produced by active volcanism, salt tectonics, regional tectonic extension (with or without an underlying detachment), or some combination of these processes. Given the lack of recent volcanism at the surface, but strong evidence for late Pleistocene and Holocene deformation on faults, we discount magmatic input as a driver of extension in the DMFZ. This is highlighted, at least in part, by the few fault scarps that transect the recent playa surface and continue onto Crater Bench, which shows no evidence of volcanic activity in the last c. 900 ka (Peterson and Nash, 1980).
We have no way of testing the role that low angle faulting or passive doming of the House Range Detachment (Allmendinger et al., 1983; Wernicke et al., 1985) might play on active faults at the surface. Assuming that there is a House Range detachment, we could accept the reasoning of Wernicke et al. (1985) that the detachment has likely not been active for the last 4 Ma. If this is the case, it is possible that steep faults of the DMFZ formed as bending moment normal faults above the passively doming detachment, as has been observed elsewhere and in models of low-angle faults (e.g., Parnell-Turner et al., 2017; Little et al., 2019; Mizera et al., 2019). This interpretation would require that the inactive but doming House Range detachment dies out rapidly to the north (cut by the Joy Fault) and to the south (since it is not evident in the Cricket Mountains), in addition to requiring a more recently active Sevier Desert detachment at the longitude of the Drum Mountains. Alternatively, the dome shape of the House Range detachment may be a geometry inherited from the Sevier-age development of this structure as a thrust duplex (DeCelles and Coogan, 2006). If this is the case, the structure could plausibly still be active, with the DMFZ representing the surface expression of low angle normal faulting at depth on this detachment. This model warrants further investigation.
Salt, or saline fluids lubricating faults at depth, may play some role in driving faulting; however, a direct link to salt tectonics is not yet established. The lack of any appreciable evaporite bodies encountered in the Gulf Gronning well (GG; Figure 1) or evidence for salt bodies in the gravity anomaly within the DMFZ (Figure 11), requires an indirect link to the salt body intersected by the Argonaut Energy well and coinciding with the Delta gravity low 25 km to the east (Figures 1, 11). Salt withdrawal from Eocene-Oligocene units underlying the DMFZ and towards the Delta graben is a hypothetical mechanism for surface deformation and may warrant further study; however, we expect that such a mechanism would manifest with a stronger sense of east-down displacement, with strain increasing towards the eastern part of the fault zone, neither of which we observe. Salt withdrawal or dissolution might also be expected to have anomalously fast extension rates (e.g., Gutiérrez et al., 2012a; Gutiérrez et al., 2012b; Guerrero et al., 2015), whereas the rates we observe are compatible with local tectonic extension rates (below).
The simplest model that explains our data is the one in which the complex, broadly distributed faults of the DMFZ represent reactivated, near-vertical faults in Basin and Range extension, situated at the junction of a N-S trending graben and obliquely trending horst (Figure 11). Time-integrated extension rates of 0.1–0.4 mm yr−1, while higher than observed on most faults in the eastern Sevier desert, are actually slightly slower than latest Pleistocene-Holocene extension rates in the Clear Lake and Tabernacle fault zones to the southeast (Stahl et al., 2020). Thus, while an underlying mechanism driving faulting cannot be fully resolved in this study, the interpretation of the DMFZ as the surface expression of recurrent faulting within a nascent and structurally complex graben is sound.
A new 2-m digital surface model (DSM) produced from legacy aerial photographs has been shown to be useful in characterizing the complex and diffuse deformation of the Drum Mountains fault zone. Despite some low-level noise, processing artefacts, and vertical distortions, we can reliably pick most meter-scale offsets across the network of west- and east-dipping faults. Profiles across the faults drawn from RTK GNSS, TLS, 2-m DSM and 5-m DEM data set show general agreement in the precisions of the datasets. Cumulative vertical separation measurements from the 2-m DSM, spaced every 500 m along strike and spanning the entire width of the fault zone, are similar to those measured in a superior quality (but coarser grid spacing) 5-m DEM. Thus, our study highlights that reliable DSMs can be generated from legacy aerial photographs using SfM in low-relief, desert environments. Legacy aerial photographs are available over wide swaths of the USA and globally, and therefore present an opportunity to study active fault systems over the last century, or where no other high-resolution elevation products exist.
The Drum Mountains fault zone exhibits net east-down displacement along most of its length, but this is variable and in many places the signal is indistinguishable from having no net vertical displacement. Extension rates of
Data collected or created in the course of this study can be made available by the authors upon request.
TS performed all field work, mapped faults, performed orientation analysis, and wrote the paper. NN performed field work, created the 2-m aerial photo DSM, and helped write the paper. JD performed the fault separation analysis and helped write the paper. FW performed the extension rate analysis and helped revise the paper. MB helped create the 2-m DSM and helped revise the paper. AH developed and wrote codes used for fault analysis and helped write the paper.
The United States National Science Foundation (NSF) provided funding for this research via a postdoctoral fellowship to TS (EAR 1451466) and Career grant to NN (EAR 1151247). This research was also supported by a New Zealand Earthquake Commission (EQC) grant to TS.
The authors declare that the research was conducted in the absence of any commercial or financial relationships that could be construed as a potential conflict of interest.
We would like to thank the Utah Automated Geographic Reference Center (AGRC) for freely providing the 5-m auto-correlated DEM and metadata. We especially thank the Utah Geological Survey for their support, in particular Steve Bowman, Adam Hiscock, Greg McDonald, and Christian Hardwick for providing their time, expertise, equipment, and data, and for their discussions on the active tectonics of the region. Tammy Rittenour of USU is kindly thanked for processing luminescence samples. TLS surveying and processing support was provided by the GAGE Facility, operated by UNAVCO, Inc., with support from the National Science Foundation and the National Aeronautics and Space Administration under NSF Cooperative Agreement EAR-11261833.
Aitken, M. J. (1998). An Introduction to Optical Dating: The Dating of Quaternary Sediments by the Use of Photon-stimulated Luminescence. New York: Oxford University Press, 267
Aitken, M. J., and Xie, J. (1990). Moisture correction for annual gamma dose. Ancient TL 8 (2), 6–9. Available at: http://ancienttl.org/ATL_08-2_1990/ATL_08-2_Aitken_p6-9.pdf
Agisoft, (2020). Metashape Professional (Version 1.6.0). Available at: http://www.agisoft.com/downloads/installer/ (Accessed October 1, 2020)
Allmendinger, R. W., Sharp, J. W., Von Tish, D., Serpa, L., Brown, L., Kaufman, S., et al. (1983). Cenozoic and Mesozoic structure of the eastern Basin and Range province, Utah, from COCORP seismic-reflection data. Geology 11, 532–536. doi:10.1130/0091-7613(1983)11%3C532:CAMSOT%3E2.0.CO;2
Anders, M. H., Christie-Blick, N., Wills, S., Coogan, J. C., and DeCelles, P. G. (1998). Extensional collapse along the Sevier Desert reflection, northern Sevier Desert basin, western United States: Comment and Reply. Geology 26, 474–475. doi:10.1130/0091-7613(1998)026%3C0474:ECATSD%3E2.3.CO;2
Anderson, R. E., and Barnhard, T. P. (1992). “Neotectonic framework of the central Sevier Valley area, Utah, and its relationship to seismicity,” in Assessment of Regional Earthquake Hazards and Risk Along the Wasatch Front, Utah — U. S. Geol. Surv. Prof.Paper 1500-F, eds. P. L. Gori and W. W. Hays, F1—F48. doi:10.3133/pp1500AJ
Athens, N. D., Glen, J. M. G., Klemperer, S. L., Egger, A. E., and Fontiveros, V. C. (2016). Hidden intrabasin extension: evidence for dike-fault interaction from magnetic, gravity, and seismic reflection data in Surprise Valley, northeastern California. Geosphere 12, 15–25. doi:10.1130/ges01173.1
Axen, G. J., Fletcher, J. M., Cowgill, E., Murphy, M., Kapp, P., Macmillan, I., et al. (1999). Range-front fault scarps of the Sierra El Mayor, Baja California: formed above an active low-angle normal fault? Geology 27, 247–250. doi:10.1130/0091-7613(1999)027%3C0247:RFFSOT%3E2.3.CO;2
Barnhart, W. D., Gold, R. D., Shea, H. N., Peterson, K. E., Briggs, R. W., and Harbor, D. J. (2019). Vertical coseismic offsets derived from high‐resolution stereogrammetric DSM differencing: the 2013 Baluchistan, Pakistan earthquake. J. Geophys. Res. 124, 6039–6055. doi:10.1029/2018jb017107
Bemis, S. P., Micklethwaite, S., Turner, D., James, M. R., Akciz, S., Thiele, S. T., et al. (2014). Ground-based and UAV-based photogrammetry: a multi-scale, high-resolution mapping tool for structural geology and paleoseismology. J. Struct. Geol. 69, 163–178. doi:10.1016/j.jsg.2014.10.007
Bennett, R. A., Wernicke, B. P., Niemi, N. A., Friedrich, A. M., and Davis, J. L. (2003). Contemporary strain rates in the northern Basin and Range province from GPS data. Tectonics 22, 1008. doi:10.1029/2001TC001355
Bucknam, R. C., and Anderson, R. E. (1979). Map of fault scarps on unconsolidated sediments, Delta 1° × 2° quadrangle, Utah. U. S. Geol. Surv.Open-file Report 79-366, 1:250,000. doi:10.3133/ofr79366
Caskey, S. J., Bell, J. W., Ramelli, A. R., and Wesnousky, S. G. (2004). Historic surface faulting and paleoseismicity in the area of the 1954 Rainbow Mountain-Stillwater earthquake sequence, central Nevada. Bull. Seismol. Soc. Am. 94, 1255–1275. doi:10.1785/012003012
Chen, C. Y., and Maloof, A. C. (2017). Revisiting the deformed high shoreline of Lake Bonneville. Quat. Sci. Rev. 159, 169–189. doi:10.1016/j.quascirev.2016.12.019
Coogan, J. C., and DeCelles, P. G. (1996). Extensional collapse along the Sevier Desert reflection, northern Sevier Desert basin, western United States. Geology 24, 933–936. doi:10.1130/0091-7613(1996)024%3C0933:ECATSD%3E2.3.CO;2
Crittenden Jr, M. D., Straczek, J. A., and Roberts, R. J. (1961). Manganese deposits in the Drum Mountains, Juab and Millard counties, Utah. U. S. Geol. Surv. Bull. 1082-H, 493–544. doi:10.3133/b1082H
Crone, A. J. (1983). “Amount of displacement and estimated age of a Holocene surface faulting event, eastern Great Basin, Millard County, Utah,” in Geologic Excursions in Neotectonics and Engineering Geology in Utah: Guidebook - Part IV — Utah Geol. Mineral Surv. Special Studies 62., ed. K. D. Gurgel, 49–55
Crone, A. J., and Harding, S. T. (1984). Relationship of late Quaternary fault scarps to subjacent faults, eastern Great Basin, Utah. Geology 12, 292–295. doi:10.1130/0091-7613(1984)12%3C292:ROLQFS%3E2.0.CO;2
Currey, D. R. (1983). Lake Bonneville; selected features of relevance to neotectonic analysis. U. S. Geol. Surv.Open-file Report 82-1070, 1:500,000. doi:10.3133/ofr821070
DeCelles, P. G., and Coogan, J. C. (2006). Regional structure and kinematic history of the Sevier fold-and-thrust belt, central Utah. Geol. Soc. Am. Bull. 118, 841–864. doi:10.1130/B25759.1
Dommer, M. L. (1980). The geology of the Drum Mountains: Millard and Juab counties, Utah. Brigham Young Univ.Geology Studies 27, 55–72. Available at: http://geology.byu.edu/home/sites/default/files/dommer.pdf
Donath, F. A. (1962). Analysis of basin-range structure, south-central Oregon. Geol. Soc. Am. Bull. 73, 1–16. doi:10.1130/0016-7606(1962)73[1:AOBSSO]2.0.CO;2
DuRoss, C. B., Bunds, M. P., Gold, R. D., Briggs, R. W., Reitman, N. G., Personius, S. F., et al. (2019). Variable normal-fault rupture behavior, northern Lost River fault zone, Idaho, USA. Geosphere 15, 1869–1892. doi:10.1130/GES02096.1
Egger, A. E., Glen, J. M. G., and McPhee, D. K. (2014). Structural controls on geothermal circulation in Surprise Valley, California: a re-evaluation of the Lake City fault zone. Geol. Soc. Am. Bull. 126, 523–531. doi:10.1130/b30785.1
Ferrill, D. A., Morris, A. P., McGinnis, R. N., Smart, K. J., Wigginton, S. S., and Hill, N. J. (2017). Mechanical stratigraphy and normal faulting. J. Struct. Geol. 94, 275–302. doi:10.1016/j.jsg.2016.11.010
Foy, T. A., Frankel, K. L., Lifton, Z. M., Johnson, C. W., and Caffee, M. W. (2012). Distributed extensional deformation in a zone of right-lateral shear: implications for geodetic versus geologic rates of deformation in the eastern California shear zone-Walker Lane. Tectonics 31, TC4008. doi:10.1029/2011tc002930
Galbraith, R. F., and Roberts, R. G. (2012). Statistical aspects of equivalent dose and error calculation and display in OSL dating: an overview and some recommendations. Quat. Geochronol. 11, 1–27. doi:10.1016/j.quageo.2012.04.020
Guérin, G., Mercier, N., and Adamiec, G. (2011). Dose-rate conversion factors: update. Ancient TL 29, 5–8. Available at: http://ancienttl.org/ATL_29-1_2011/ATL_29-1_Guerin_p5-8.pdf
Guerrero, J., Bruhn, R. L., Mccalpin, J. P., Gutiérrez, F., Willis, G., and Mozafari, M. (2015). Salt-dissolution faults versus tectonic faults from the case study of salt collapse in Spanish Valley, SE Utah (USA). Lithosphere 7, 46–58. doi:10.1130/l385.1
Gutiérrez, F., Carbonel, D., Guerrero, J., Mccalpin, J. P., Linares, R., Roqué, C., et al. (2012a). Late Holocene episodic displacement on fault scarps related to interstratal dissolution of evaporites (Teruel Neogene Graben, NE Spain). J. Struct. Geol. 34, 2–19. doi:10.1016/j.jsg.2011.11.006
Gutiérrez, F., Linares, R., Roqué, C., Zarroca, M., Rosell, J., Galve, J. P., et al. (2012b). Investigating gravitational grabens related to lateral spreading and evaporite dissolution subsidence by means of detailed mapping, trenching, and electrical resistivity tomography (Spanish Pyrenees) Lithosphere 4, 331–353. doi:10.1130/l202.1
Hammond, W. C., and Thatcher, W. (2004). Contemporary tectonic deformation of the Basin and Range province, western United States: 10 years of observation with the global positioning system. J. Geophys. Res. 109, B08403. doi:10.1029/2003JB002746
Hardwick, C. L., and Chapman, D. S. (2011). Geophysical delineation of the Crater Bench, Utah, geothermal system. Trans. Geotherm. Resour. Counc. 35, 801–804. Available at: https://geology.utah.gov/docs/geothermal/ngds/supplemental/reports/GRCv35_Hardwick_Chapman.pdf
Hecker, S. (1993). Quaternary tectonics of Utah with emphasis on earthquake-hazard characterization. Utah Geol. Surv. Bull. B-127, 157
Hetzel, R., and Hampel, A. (2005). Slip rate variations on normal faults during glacial-interglacial changes in surface loads. Nature 435, 81–84. doi:10.1038/nature03562
Hintze, L. F., and Davis, F. D. (2002). Geologic map of the Delta 30' × 60' quadrangle and part of the Lynndyl 30' × 60' quadrangle, northeast Millard County and parts of Juab, Sanpete, and Sevier counties, Utah. Utah Geol. Surv. Map M-184, 1:100,000. Available at: https://ugspub.nr.utah.gov/publications/geologicmaps/1-100000/M-206DM_Delta.pdf
Howell, A., Nissen, E., Stahl, T., Clark, K., Kearse, J., Van Dissen, R., et al. (2020). Three‐dimensional surface displacements during the 2016 MW 7.8 Kaikōura earthquake (New Zealand) from photogrammetry‐derived point clouds. J. Geophys. Res. 125, e2019JB018739. doi:10.1029/2019jb018739
Johnsen, R. L., Smith, E. I., and Biek, R. F. (2010). “Subalkaline volcanism in the Black Rock Desert and Markagunt Plateau volcanic fields of south-central Utah,” in Geology of south-central Utah. Utah Geol. Assoc. Publ. 39., Editors, S. M. Carney, D. E. Tabet, and C. L. Johnson, 109–150
Johnson, K., Nissen, E., Saripalli, S., Arrowsmith, J. R., McGarey, P., Scharer, K., et al. (2014). Rapid mapping of ultrafine fault zone topography with structure from motion. Geosphere 10, 969–986. doi:10.1130/GES01017.1
Koehler, R. D., and Wesnousky, S. G. (2011). Late Pleistocene regional extension rate derived from earthquake geology of late Quaternary faults across the Great Basin, Nevada, between 38.5°N and 40°N latitude. Geol. Soc. Am. Bull. 123, 631–650. doi:10.1130/b30111.1
Lajoie, L. J., Nissen, E., Johnson, K. L., and Lajoie, K. R. (2020). Submeter resolution surface rupture topography from legacy aerial photographs—a test case from the 1992 Landers earthquake. Earth Space Sci. 7, e2019EA000651. doi:10.1029/2019ea000651
Lifton, N., Caffee, M., Finkel, R., Marrero, S., Nishiizumi, K., Phillips, F. M., et al. (2015). In situ cosmogenic nuclide production rate calibration for the CRONUS-Earth project from Lake Bonneville, Utah, shoreline features. Quat. Geochronol. 26, 56–69. doi:10.1016/j.quageo.2014.11.002
Lindsey, D. A. (1982). Tertiary volcanic rocks and uranium in the Thomas Range and northern Drum Mountains, Juab County, Utah. U. S. Geol. Surv. Prof. Paper. 1221, 1–71, doi:10.3133/pp1221
Lindsey, D. A., Glanzman, R. K., Naeser, C. W., and Nichols, D. J. (1981). Upper Oligocene evaporites in basin fill of Sevier Desert region, western Utah. Am. Assoc. Petrol. Geol. Bull. 65, 251–260. doi:10.1306/2F9197B5-16CE-11D7-8645000102C1865D
Little, T. A., Webber, S. M., Mizera, M., Boulton, C., Oesterle, J., Ellis, S., et al. (2019). Evolution of a rapidly slipping, active low-angle normal fault, Suckling-Dayman metamorphic core complex, SE Papua New Guinea. Geol. Soc. Am. Bull. 131, 1333–1363. doi:10.1130/b35051.1
Lu, L., Zhou, Y., and Walker, R. T. (2020). Using historical aerial photographs to measure earthquake deformation: testing the effects of scan resolution. Rem. Sens. Environ. 252, 112118. doi:10.1016/j.rse.2020.112118
Mackenzie, D., and Elliott, A. (2017). Untangling tectonic slip from the potentially misleading effects of landform geometry. Geosphere 13, 1310–1328. doi:10.1130/GES01386.1
McDonald, R. E. (1976). “Tertiary tectonics and sedimentary rocks along the transition: Basin and Range province to plateau and thrust belt province, Utah,” in Symposium on Geology of the Cordilleran Hingeline, Editor J. G. Hill (Denver: Rocky Mountain Assoc. of Geologists), 281–317
Meigs, A. (2013). Active tectonics and the LiDAR revolution. Lithosphere 5, 226–229. doi:10.1130/rf.l004.1
Micheletti, N., Chandler, J. H., and Lane, S. N. (2014). Investigating the geomorphological potential of freely available and accessible structure-from-motion photogrammetry using a smartphone. Earth Surf. Process. Landforms 40, 473–486. doi:10.1002/esp.3648
Miller, D. M. (2016). “The Provo shoreline of Lake Bonneville,” in Developments in Earth Surface Processes. Editors C. G. Oviatt, and J. F. Shroder, Jr. (Elsevier), 127–144. doi:10.1016/B978-0-444-63590-7.00007-X
Milliner, C. W. D., Dolan, J. F., Hollingsworth, J., Leprince, S., Ayoub, F., and Sammis, C. G. (2015). Quantifying near-field and off-fault deformation patterns of the 1992 MW 7.3 Landers earthquake. Geochem. Geophys. Geosyst. 16, 1577–1598. doi:10.1002/2014gc005693
Mizera, M., Little, T. A., Biemiller, J., Ellis, S., Webber, S., and Norton, K. P. (2019). Structural and geomorphic evidence for rolling‐hinge style deformation of an active continental low‐angle normal fault, SE Papua New Guinea. Tectonics 38, 1556–1583. doi:10.1029/2018tc005167
Murray, A. S., and Wintle, A. G. (2003). The single aliquot regenerative dose protocol: potential for improvements in reliability. Radiat. Meas. 37, 377–381. doi:10.1016/s1350-4487(03)00053-2
Niemi, N. A., Wernicke, B. P., Friedrich, A. M., Simons, M., Bennett, R. A., and Davis, J. L. (2004). BARGEN continuous GPS data across the eastern Basin and Range province, and implications for fault system dynamics. Geophys. J. Int. 159, 842–862. doi:10.1111/j.1365-246x.2004.02454.x
Oviatt, C. G. (2015). Chronology of Lake Bonneville, 30,000 to 10,000 yr B.P. Quat. Sci. Rev. 110, 166–171. doi:10.1016/j.quascirev.2014.12.016
Oviatt, C. G. (1989). Quaternary geology of part of the Sevier Desert, Millard County, Utah. Utah Geol. Surv. 70, 46. Available at: https://digitallibrary.utah.gov/awweb/awarchive?type=file&item=31088
Oviatt, C. G., and Nash, B. P. (2014). The Pony Express basaltic ash: a stratigraphic marker in Lake Bonneville sediments, Utah. Utah Geol. Surv. Misc. Publ. 14, 1–10
Pankow, K. L., Stickney, M., Ben-Horin, J. Y., Litherland, M., Payne, S., Koper, K. D., et al. (2020). Regional seismic network monitoring in the eastern Intermountain West. Seismol Res. Lett. 91, 631–646. doi:10.1785/0220190209
Parnell-Turner, R., Sohn, R. A., Peirce, C., Reston, T. J., Macleod, C. J., Searle, R. C., et al. (2017). Oceanic detachment faults generate compression in extension. Geology 45, 923–926. doi:10.1130/g39232.1
Personius, S. F., Briggs, R. W., Maharrey, J. Z., Angster, S. J., and Mahan, S. A. (2017). A paleoseismic transect across the northwestern Basin and Range Province, northwestern Nevada and northeastern California, USA. Geosphere 13, 782–810. doi:10.1130/ges01380.1
Peterson, J. B., and Nash, W. P. (1980). Geology and petrology of the Fumarole Butte volcanic complex, Utah. Studies in Late Cenozoic Volcanism in West‐Central Utah. Utah Geol. Min. Surv. Spec. Studies 52, 34‐58. Available at: https://ugspub.nr.utah.gov/publications/special_studies/SS-52.pdf
Planke, S., and Smith, R. B. (1991). Cenozoic extension and evolution of the Sevier Desert Basin, Utah, from seismic reflection, gravity, and well log data. Tectonics 10, 345–365. doi:10.1029/90tc01948
Royse, F. (1993). Case of the phantom foredeep: early Cretaceous in west-central Utah. Geology 21, 133–136. doi:10.1130/0091-7613(1993)021%3C0133:COTPFE%3E2.3.CO;2
Shelef, E., and Oskin, M. (2010). Deformation processes adjacent to active faults: examples from eastern California. J. Geophys. Res. 115, B05308. doi:10.1029/2009JB006289
Smithson, S. B., and Johnson, R. A. (1989). “Crustal structure of the western U.S. based on reflection seismology,” in Geophysical Framework of the Continental United States — Geol. Soc. Am. Memoirs 172, Editors L. C. Pakiser and W. D. Mooney (Boulder, CO: Geological Society of America), 577–612. doi:10.1130/MEM172-p577
Stahl, T., and Niemi, N. A. (2017). Late Quaternary faulting in the Sevier Desert driven by magmatism. Nature Sci. Rep. 7, 44372. doi:10.1038/srep44372
Stahl, T. A., Niemi, N. A., Bunds, M. P., Andreini, J., and Wells, J. D. (2020). Paleoseismic patterns of Quaternary tectonic and magmatic surface deformation in the eastern Basin and Range, USA. Geosphere 16, 435–455. doi:10.1130/ges02156.1
Thatcher, W., Foulger, G. R., Julian, B. R., Svarc, J., Quilty, E., and Bawden, G. W. (1999). Present-day deformation across the Basin and Range province, western United States. Science 283, 1714–1718. doi:10.1126/science.283.5408.1714
Thompson, S. C., Weldon, R. J., Rubin, C. M., Abdrakhmatov, K., Molnar, P., and Berger, G. W. (2002). Late Quaternary slip rates across the central Tien Shan, Kyrgyzstan, central Asia. J. Geophys. Res. 107, 2203. doi:10.1029/2001JB000596
Turley, C. H., and Nash, W. P. (1980). Petrology of late Tertiary and Quaternary volcanism in western Juab and Millard counties. Utah Geol. Min. Surv. Spec. Studies 52, 1–33. Available at: https://ugspub.nr.utah.gov/publications/special_studies/SS-52.pdf
U.S. Geological Survey and Utah Geological Survey (2020). Quaternary fault and fold database for the United States. Available at: https://www.usgs.gov/natural-hazards/earthquake-hazards/faults (Accessed October 21 2020)
Wannamaker, P. E., Hasterok, D. P., Johnston, J. M., Stodt, J. A., Hall, D. B., Sodergren, T. L., et al. (2008). Lithospheric dismemberment and magmatic processes of the Great Basin-Colorado Plateau transition, Utah, implied from magnetotellurics. Geochem. Geophys. Geosyst. 9, 5. doi:10.1029/2007GC001886
Wernicke, B., Walker, J. D., and Beaufait, M. S. (1985). Structural discordance between Neogene detachments and frontal Sevier thrusts, central Mormon Mountains, southern Nevada. Tectonics 4, 213–246. doi:10.1029/tc004i002p00213
Wills, S., Anders, M. H., and Christie-Blick, N. (2005). Pattern of Mesozoic thrust surfaces and Tertiary normal faults in the Sevier Desert subsurface, west-central Utah. Am. J. Sci. 305, 42–100. doi:10.2475/ajs.305.1.42
Wolfe, F. D., Stahl, T. A., Villamor, P., and Lukovic, B. (2020). Short communication: a semiautomated method for bulk fault slip analysis from topographic scarp profiles. Earth Surf. Dynam. 8, 211–219. doi:10.5194/esurf-8-211-2020
Working Group on Utah Earthquake Probabilities (WGUEP) (2016). Earthquake probabilities for the Wasatch front region in Utah, Idaho, and Wyoming. Utah Geol. Surv. Misc. Publ. 16–3418. Available at: https://ugspub.nr.utah.gov/publications/misc_pubs/mp-16-3/mp-16-3.pdf
Zhou, Y., Parsons, B., Elliott, J. R., Barisin, I., and Walker, R. T. (2015). Assessing the ability of Pleiades stereo imagery to determine height changes in earthquakes: a case study for the El Mayor‐Cucapah epicentral area. J. Geophys. Res. 120, 8793–8808. doi:10.1002/2015jb012358
Zhou, Y., Parsons, B. E., and Walker, R. T. (2018). Characterizing complex surface ruptures in the 2013 MW 7.7 Balochistan earthquake using three-dimensional displacements. J. Geophys. Res. 123 191–110. doi:10.1029/2018jb016043
Zinke, R., Hollingsworth, J., Dolan, J. F., and Van Dissen, R. (2019). Three‐dimensional surface deformation in the 2016 MW 7.8 Kaikōura, New Zealand, earthquake from optical image correlation: implications for strain localization and long‐term evolution of the Pacific‐Australian plate boundary. Geochem. Geophys. Geosyst. 20, 1609–1628. doi:10.1029/2018gc007951
Keywords: drum mountains fault zone, photogrammetry, legacy aerial photographs, eastern basin and range, Utah
Citation: Stahl TA, Niemi NA, Delano JE, Wolfe FD, Bunds MP and Howell A (2021) Diffuse Tectonic Deformation in the Drum Mountains Fault Zone, Utah, USA: Testing the Utility of Legacy Aerial Photograph-Derived Topography. Front. Earth Sci. 8:600729. doi: 10.3389/feart.2020.600729
Received: 31 August 2020; Accepted: 09 November 2020;
Published: 20 January 2021.
Edited by:
Michele M. C. Carafa, Istituto Nazionale di Geofisica e Vulcanologia (INGV), ItalyReviewed by:
Peter Bird, UCLA Department of Earth, Planetary, and Space Sciences, United StatesCopyright © 2021 Stahl, Niemi, Delano, Wolfe, Bunds and Howell. This is an open-access article distributed under the terms of the Creative Commons Attribution License (CC BY). The use, distribution or reproduction in other forums is permitted, provided the original author(s) and the copyright owner(s) are credited and that the original publication in this journal is cited, in accordance with accepted academic practice. No use, distribution or reproduction is permitted which does not comply with these terms.
*Correspondence: Timothy A. Stahl, dGltb3RoeS5zdGFobEBjYW50ZXJidXJ5LmFjLm56
Disclaimer: All claims expressed in this article are solely those of the authors and do not necessarily represent those of their affiliated organizations, or those of the publisher, the editors and the reviewers. Any product that may be evaluated in this article or claim that may be made by its manufacturer is not guaranteed or endorsed by the publisher.
Research integrity at Frontiers
Learn more about the work of our research integrity team to safeguard the quality of each article we publish.