 Raquel Martín-Banda
 Juan Miguel Insua-Arévalo
 Julián García-Mayordomo
- 1Department of Geoscientific Research and Prospective, Instituto Geológico y Minero de España, Madrid, Spain
- 2Department of Geodynamics, Stratigraphy and Paleontology, Complutense University of Madrid, Madrid, Spain
Fault slip rate variability over time is a crucial aspect for understanding how single faults interact among each other in fault systems. Several studies worldwide evidence the occurrence of high activity periods with clustering of events and synchronization among faults, followed by long periods of low activity (super-cycles). The increasing gathering of evidence of these phenomena is making fault hazard models quickly evolving and challenging seismic hazard assessment. However, in moderately active fault systems, a determination of fault slip rates can present large uncertainties, that have to be carefully considered when slip rate histories are determined. In this work, we estimate the variation of slip rate in the last ∼210 ky of the NE segment of the left-lateral reverse Carrascoy Fault, one of the main faults forming the Eastern Betic Shear Zone in SE Spain. We study two selected field sites where we have been able to measure offsets and date the sediments along with uncertainties. The first site shows a progressive discordance drawn by different calcretes developed on alluvial deposits. The vertical throw is calculated by modeling the growth of the discordance. The vertical slip rates are estimated dating the deformed calcretes by Uranium Series and by comparing them with a complete regional calcrete dates database compiled from the literature. On the second site, we analyze the geomorphology of different Upper Pleistocene alluvial fans, where three incised channels are offset by the fault, providing the net slip for the last ∼124 ky. We discuss the influence of different factors on the estimate of net slip rates using data from different sources. This analysis highlights the importance of determining an accurate fault geometry and how local data can provide misleading deformation rates. Our results suggest the existence of long periods of low activity disturbed by short high activity periods. Such a pattern of activity along time is defined for the first time in the Eastern Betic Shear Zone, with interesting implications in the seismogenic behavior of the rest of the slow faults within the region.
Highlights
• Fault geometry controls the distribution of the slip vector components.
• The Carrascoy Fault is one of the main structures of the Eastern Betic Shear Zone, an active slow fault system (<5 m/ky).
• The NE segment of the Carrascoy Fault is a left-lateral fault with variable reverse component.
• The slow Carrascoy Fault shows seismic supercycles formed by a long phase with low slip rates and a short phase with higher slip rates.
• Calcrete formation correlates with the Alborán Sea interstadials of the last 210 ky.
Introduction
The identification of seismogenic faults and the characterization of their activity during the Late Quaternary is essential to address properly the seismic hazard at any site or region, (e.g. Stirling et al., 2012; Field et al., 2014; Woessner et al., 2015; Valentini et al., 2017; Pace et al., 2018). Slip rate determination is crucial for that purpose. In slow fault systems (slip rate <5 mm/y), e.g., the Dzhungarian fault (Campbell et al., 2013) or the Dead Sea Fault (Lu et al., 2020), the poor surface expression of the faults and long earthquake recurrence intervals implicates greater uncertainties in event identification and dating (García-Mayordomo et al., 2017).
Slow faults studies are mainly located in intraplate geodynamic setting, where geomorphological, geophysical and paleosismological studies are commonly combined, (e.g.: the 1928 Chirpan earthquake M 6.8 in southern Bulgaria, Vanneste et al., 2006; the large paleo-earthquakes in the Roer Graben, Camelbeeck and Meghraoui, 1998). Slip rates measured from different sources over different timescales on a slow fault usually show inconsistencies, (e.g. Oskin et al., 2008; Cowgill et al., 2009), either because recurrence intervals are large or deformation is distributed over many segments and faults (Faure Walker et al., 2010), indicating spatial and temporal variations in fault activity (Dolan et al., 2007) or the existence of seismic short cycles within large cycles, (e.g. Sieh et al., 2008; Benedetti et al., 2013). These discrepancies are also observed in the Eastern Betic Shear Zone, (e.g. Ferrater, 2016; Ferrater et al., 2017), a set of NE-SW active slow faults with long seismic loading cycles, which absorbs part of the convergence between the Nubian and Eurasian plates (5–6 mm/a) in the western Mediterranean under a transpressive regime, (e.g. DeMets et al., 2015) (Figure 1). The intense human activity in this region together with the uncertainties inherent in a slow fault makes it difficult to preserve a continuous record of slip rates over long periods of time (10–100 ky) and, consequently, to characterize their seismogenic behavior.
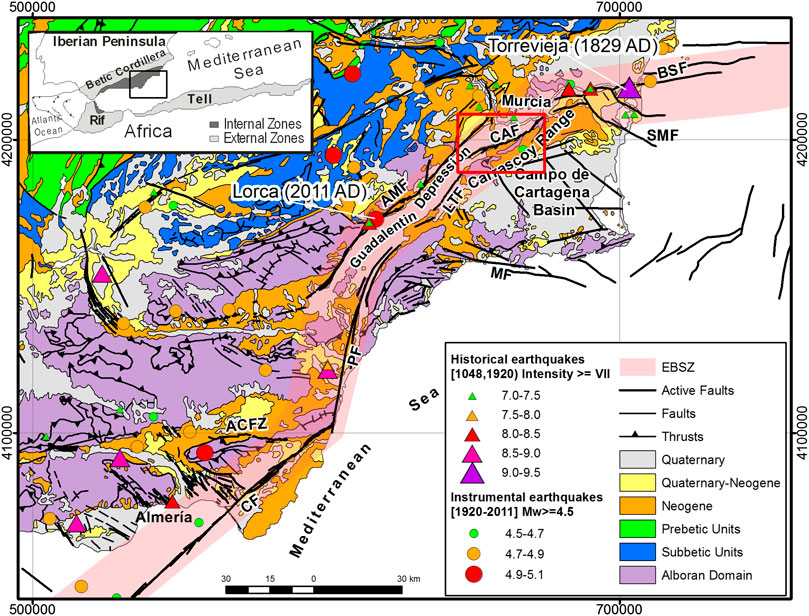
FIGURE 1. Geological setting of the Carrascoy Fault. EBSZ: Eastern Betic Shear Zone; SMF: San Miguel de Salinas Fault; BSF: Bajo Segura Fault; CAF: Carrascoy Fault; LTF: Los Tollos Fault; AMF: Alhama de Murcia Fault; PF: Palomares Fault; CF. Carboneras Fault; ACFZ: Alpujarrides Corridor Fault Zone; MF: Las Moreras - Escarpe de Mazarrón Fault. Geological mapping carried out from Continuous Digital Geological Map at scale 1:50.000 of the Internal Zones of the Betic Cordillera (Marín-Lechado et al., 2011). Fault traces are from an updated version of QAFI database (García-Mayordomo et al., 2012; IGME, 2012). Earthquake data corresponds to a declustered version of the Spanish national seismic catalog (IGN-UPM, 2013). The white lines show the identification of major earthquakes cited in the text. Location of the Carrascoy Fault and Figure 2A (red square).
Here we present the variation of the net slip rate for the last 210 ky of the NE Segment of the Carrascoy Fault, estimated from the study of two sites (Figure 2): 1) a progressive discordance drawn by different datable calcretes developed in alluvial deposits in Los Ramos site, and 2) geomorphic evidence of several alluvial fans offset by the fault in Torreagüera site.
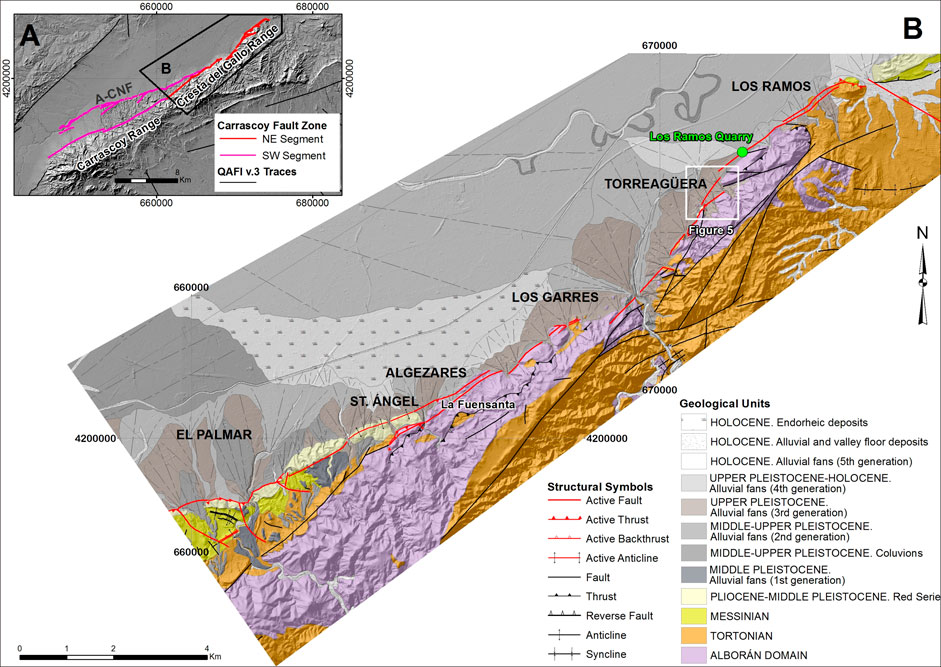
FIGURE 2. (A) The Carrascoy Fault Zone defined in Martín-Banda et al. (2015): SW Segment in pink color (A-CNF: Algezares-Casas Nuevas Fault) and NE Segment in red color. (B) Detailed geological cartography of the NE Segment of the Carrascoy Fault marked in Figure A by the black polygon. Location of the Los Ramos quarry (green circle) and the Torreagüera alluvial fans (white square) are shown.
The Carrascoy Fault
The Eastern Betic Shear Zone is a 450 km large crustal structure (Banda and Ansorge, 1980) with sigmoidal morphology that extends from the Alboran Sea offshore to the NE of Murcia crossing the Internal Zones of the Betic Cordillera. It is a set of left-lateral faults with some reverse component, which progressively predominates toward NE and it is composed by the Carboneras, Palomares, Alhama de Murcia, Los Tollos, Carrascoy and the Bajo Segura faults, from south to north, (e.g. Bousquet, 1979; Silva et al., 1993). Catastrophic earthquakes have been related to these morphogenetic faults such as the 1829 Torrevieja earthquake (Mw 6.8, IEMS98 IX-X) associated with the Bajo Segura Fault, or the May 11, 2011 Lorca earthquake (Mw 5.2, IEMS98 VII) generated by the Alhama de Murcia Fault, (e.g.: García-Mayordomo and Álvarez-Gómez, 2006; Vissers and Meijninger, 2011; Alfaro et al., 2012; Martínez-Díaz et al., 2012; IGN-UPM, 2013) (Figure 1).
The current kinematics of the Eastern Betic Range, where the Eastern Betic Shear Zone is localized, is the result of a rotation of the direction of regional shortening from NW-SE and SW-NE, between the Burdigalian and the Lower Tortonian (Martínez-Martínez and Azañón, 1997; Rodríguez-Fernández et al., 2012), to NNW-SSE, at the end of the Messinian or beginning of the Pliocene (Ott D’Estevou and Montenat, 1985). This rotation caused the tectonic inversion of the marine Neogene basins of Lorca, Fortuna, Mazarrón and Vera and the generation of new sedimentary depressions in previously elevated areas such as ther current Guadalentín Depression (De Larouzière et al., 1987; Montenat et al., 1987; Vissers and Meijininger, 2011). There is a set of faults with inherited orientations and a current NE-SW direction of regional shortening from GPS data consistent with the current direction of convergence between the Eurasian and Nubian plates (Khazaradze et al., 2008; Echeverria et al., 2011).
There are numerous studies focused on the Quaternary activity of the Eastern Betic Shear Zone, (e.g. Bousquet, 1979; Sanz de Galdeano, 1983; Boccaletti et al., 1987; Montenat et al., 1987; Vegas et al., 1987; Masana et al., 2010; Buontempo and Wuestefeld, 2013), as well as on each of its faults: Carboneras Fault, (e.g.: Bousquet and Philip, 1976; Bousquet et al., 1975; Keller et al., 1995; Gràcia et al., 2006; Moreno et al., 2007; Rutter et al., 2012), Palomares Fault, (e.g.: Booth-Rea et al., 2003, 2004), Alhama de Murcia Fault (Silva, 1994; Silva et al., 1997; Martínez-Díaz, 1998), Los Tollos Fault (Silva, 1994; Leyva Cabello et al., 2010; Insua-Arévalo et al., 2012); Carrascoy Fault (Sanz de Galdeano, 1983; Silva, 1994; Amores et al., 2002; Calmel-Ávila et al., 2009; Leyva et al., 2010; Jerez et al., 2015) and Bajo Segura Fault (Catafau, 1994; Alfaro et al., 2002).
However, from the paleoseismological point of view, the works published so far are mainly focused on some faults of the Eastern Betic Shear Zone, such as: the Carboneras Fault, (e.g. Bell et al., 1997; Moreno et al., 2008; Masana et al., 2010; Moreno, 2011; Moreno et al., 2015; Moreno et al., 2016; López et al., 2018), the southern segments of the Alhama de Murcia Fault, (e.g. Hernández-Enrile and Martínez-Díaz, 2001; Martínez-Díaz et al., 2012; Ortuño et al., 2012; Ferrater, 2016; Ferrater et al., 2017; Martínez-Díaz et al., 2018) and the Bajo Segura Fault, (e.g. Alfaro, 1995; García-Mayordomo and Álvarez-Gómez, 2006; Alfaro et al., 2012; Perea et al., 2012). The results of these studies confirm the capacity of these faults to produce morphogenic earthquakes with Mw greater than 6.0 and recurrence intervals of a few thousand years (García-Mayordomo et al., 2012). In relation to the less studied faults, there are some works that preliminarily evaluated the seismic potential of the Carrascoy Fault (Amores et al., 2001; García-Mayordomo and Álvarez-Gómez, 2006) and recent paleoseismological studies in Carrascoy and Palomares faults (Martín-Banda et al., 2015; Roquero et al., 2019).
The Carrascoy Fault is a large reverse left-lateral structure that controls the northern edge of the Carrascoy Range (Silva, 1994; Sanz de Galdeano et al., 1998) (Figure 2). Martín-Banda et al. (2015) distinguished two overlapped segments, SW and NE, dating to ∼220 ka, when the SW segment started to develop a fold-and-thrust belt with the growth of a new mountain front towards the foreland, the Algezares-Casas Nuevas Fault. This new front presents an asymmetrical growth from the NE to the SW with a slip rate of 0.37 ± 0.08 m/ky, as well as the simultaneous lock on the surface of the reverse left-lateral strand, which previously controlled the main relief of the range. The Algezares-Casas Nuevas Fault merges at the surface with the NE segment of the left-lateral strand prolongation to the northeast in a linkage zone between the El Palmar and Algezares villages, where rupture styles of both segments are superimposed. From here, the NE segment extends in a N50E trend for 16 km until the Los Ramos village and forms a narrow fault zone that controls the conspicuous and sharp mountain front of the Cresta del Gallo Range (Figure 2). We deem that the complexity of the tectonic structure of the Carrascoy Fault and the proximity to the metropolitan area of the city of Murcia make the determination of slip rate of its NE segment highly needed.
Data and Methods
The net slip rate (NSR) of a fault for a given time period may be calculated from its vertical slip rate (VSR), fault dip (β), and strike slip rate (SSR):
To determine SSR and VSR it is necessary to measure the vertical and lateral displacement experienced by the fault and the age of the deformed markers. The VSR for the NE segment of the Carrascoy Fault, including its variation in time, has been determined mainly by analyzing a progressive discordance in a quarry located at Los Ramos village (Figure 2). The SSR has been estimated by studying the lateral offsets of several channels incised on alluvial fans near the neighboring Torreagüera village (Figure 2).
Measurements of Displacement
Progressive Discordance
An abandoned quarry near the Los Ramos village exposes a progressive discordance defined by six alluvial-colluvial syntectonic units with 15° depositional slope (Figure 3A). Five of the alluvial units have developed pedogenic calcretes, which are crucial for dating purposes. The strike of the sedimentary layers varies between N070E and N057E with NW dip progressively decreasing towards the top in a rotational offlap-onlap relationship. The poles of these syntectonic stratigraphic horizons are contained in a N153E/85SW plane whose pole 063/05 (trend and plunge, respectively) marks the rotational axis of the layers (Figure 3B). This geometry is interpreted as a fault-propagation fold growth sequence (Figure 4). The fault responsible of the observed deformation does not crop out in the studied talus, but in another quarry wall located several meters eastwards (Figures 4A–4C). There, the fault shows a strike of N054E dipping 85° towards SE, consistent with the rotational axis of the proposed deformational model. No striae marks have been observed. The location of the structure in the proximal zone of the alluvial-colluvial deposits does not favor the preservation of its complete geometry due to the erosion of the anticline of the uplifted part. Thus, a limb rotation growth model (Erslev, 1991; Hardy and Poblet, 1994; Erslev and Mayborn, 1997; Storti and Poblet, 1997) has been assumed for the fault-propagation fold. Measuring the angles between every two deformational markers (sedimentary units and calcretes, Figure 3B) has allowed us to estimate the vertical slip and its variations over time, assuming that they all were originated on an equal inclination surface.
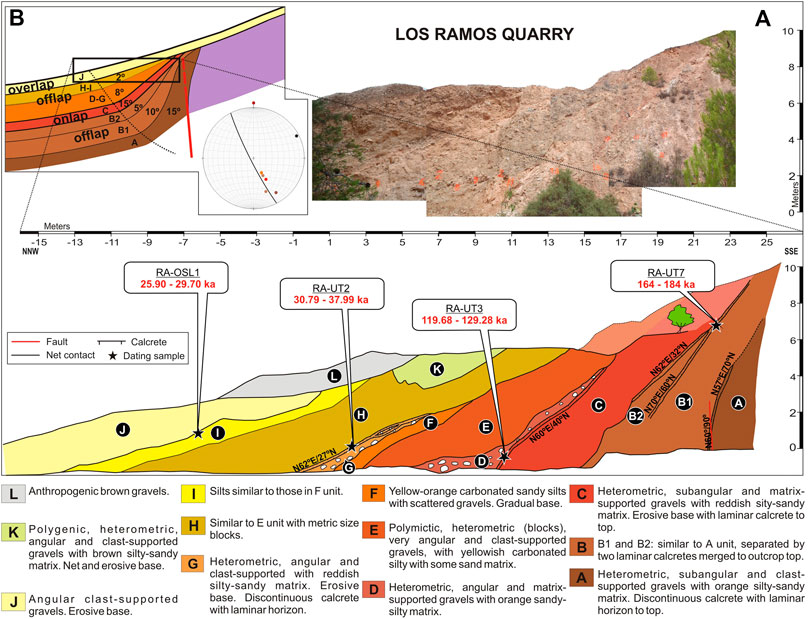
FIGURE 3. (A) Photographs and log of the Los Ramos quarry outcrop. (B) Scheme of the progressive discordance, identifying depositional phases and rotation angles of the limb of the propagation fold. Stereographic projection with the poles of the stratification (stratigraphic markers colours on figure A) and the rotational axis of the layer (or the plane containing the poles of the stratification).
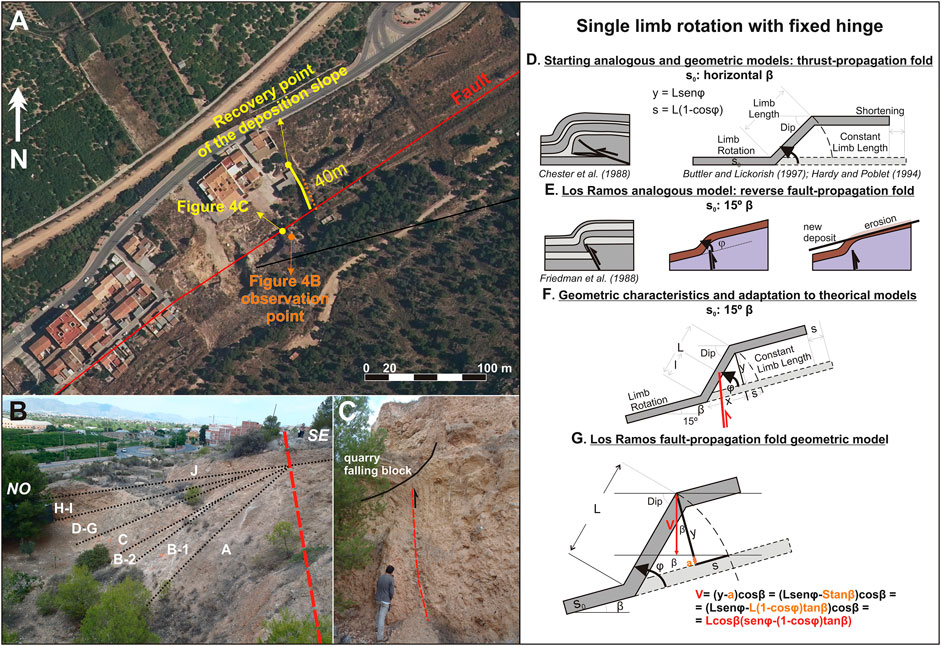
FIGURE 4. (A) Aerial photograph of the Los Ramos quarry. Location of the studied outcrop and the fault. (B) Photograph of the studied outcrop with the scheme of the progressive discordance. (C) Photograph of the fault on the SE wall. (D) Graphic representation of the analogous and geometric models for detachment and thrust-propagation folds (β: depositional dip; y: vertical slip; s: horizontal shortening; L: limb length; φ: rotation angle). (E) Analogous model for inverse fault-propagation folds to which the progressive discordance adjusts and diagram of formation. (F) Geometrical characteristics of the Los Ramos propagation fold and its adaptation to the theoretical geometrical models (l: length of the synclinal part of the limb; x: horizontal slip). (G) Geometrical model of the Los Ramos propagation fold (V: vertical component of the net slip of the fault; a: vertical component of the depositional dip).
To quantify the fault-propagation fold deformation related to this discordance in terms of lifting or fault vertical slip a geometric modeling of the fold has been carried on. We have considered as starting geometric growth models those proposed by Hardy and Poblet (1994) and Butler and Lickorish (1997), based on simple limb-rotation with fixed hinge and constant limb length, both equivalent to the analogous model for thrusts of Chester et al. (1988). Despite its good fit with the geometric simple limb-rotation models, the Los Ramos outcrop shows some peculiarities that must be considered (Figure 4):
1) In theoretical models, the vertical slip (y) and the horizontal shortening (s) depend on the limb length (L) and the rotation angle (φ). These models are based on horizontal pre-deformational layers (Figure 4A). However, the depositional slope of alluvial-colluvial deposits at the Los Ramos outcrop shows 15° dip to the NW, which must be considered in the construction of the model (Figure 4B).
2) In addition, the starting models are based on thrust-propagation folds. In them, the estimation of the vertical slip (y) does not depend on fault’s structural position and its dip (Figure 4D). However, the studied fold at the Los Ramos outcrop is a high-dip reverse fault-propagation fold, where the fault’s structural position is crucial in determining limb length (L), one of the parameters that control the vertical slip (y) in theoretical models. According to the analogous reverse fault model of Friedman et al. (1980), the fault would be located at the point of inflection between the synclinal and anticlinal part of the limb (Figure 4E). Thus, the length of the synclinal part of the limb (L) is estimated from the position of the fault and the recovery point of the deposition slope in the synclinal part of the limb (unit I) (Figures 4A and 4F), while the length of the anticlinal part of the limb, eroded with each new deposition sequence, is unknown (Figures 4B and 4E). Assuming a symmetrical fold geometry, the length of the limb (L) may be calculated as twice the value of l (Figure 4F).
3) Finally, given the high dip of the fault (85° to the SE), we assumed the vertical slip due to folding equivalent to the vertical slip due to faulting (90° dip). So can be calculated the vertical component of the net slip of the fault (V) from the limb length (L), rotation angle (φ) and depositional dip (β) (Figure 4G).
Offset Channels
The Torreagüera site is located 700 m SW of the Los Ramos site along the fault trace (Figure 2). Three coalescing alluvial fans with thick calcretes on top present their main alluvial channels incised (Figure 5). The channels show aligned lateral offsets following two overlapping fault strands trending N035E (northern fault) and N056E (southern fault). The offset channels point out left-lateral slip at the northern fault, and right-lateral slip at the southern one, setting a northeastward displacement of the central block bounded by those faults.
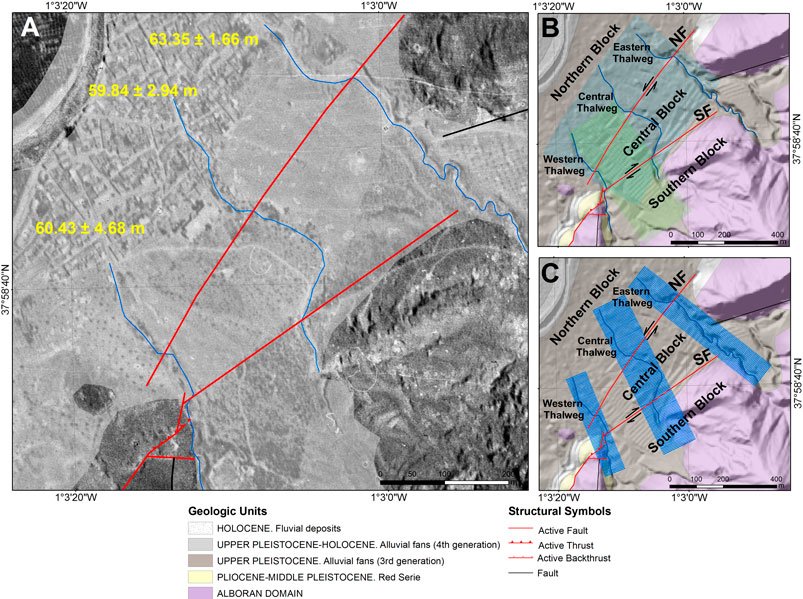
FIGURE 5. (A) Map showing the displaced elements and theirs rectifications on the fault traces interpreted on the aerial photograph obtained during the year 1945 (black lines: channel edges; blue lines: thalwegs; white dotted lines: channel edge trend rectifications; white dashed lines: channel edge rectifications; yellow dotted lines: thalweg trend rectifications; yellow dashed lines: thalweg rectifications). Lateral displacement measurements. (B) Location of the swath profiles perpendicular to the fault traces (blue lines: perpendicular to the northern fault -NF- and green lines: perpendicular to the southern fault -SF). The thalwegs of the displaced channels are marked in dark blue. (C) Location of the swath profiles longitudinal to the thalwegs.
The lateral offset has been calculated by measuring the distance between homologous points on both sides of the fault trace related to morphological elements of the channel i.e.,: margins and thalweg (Zielke et al., 2015) (Figure 5A). To compare the values obtained in each channel and to estimate the fault lateral offset, we followed the methodology proposed by Ferrater (2016) based on the weighting of the quality of the measurements. Unlike Ferrater (2016), we considered the meander curvature rectification in all cases, although it coincides with the channel general trend, obtaining always 12 offset measurements. The channel offset is obtained by calculating the mean and standard deviation of a sample formed by 12 measurements (Figure 5A).
Besides, lateral offset, vertical slip has been also estimated at the Torreagüera site. Topographic swath profiles have been done to calculate statistical distributions of topographic profiles set perpendicularly to a defined baseline, stacking topographic heights along parallel, regularly spaced lines. The swath profile plugin of the QGIS software has been used to carry out this analysis. The altitude data (m.a.s.l.) has been taken from DEM (Digital Elevation Model), from the Instituto Geográfico Nacional (vertical accuracy <20 cm and horizontal point spacing of 1.4 m). We have used a 5 m parallel line spacing with data collection every 10 m along each line. Faults traces have been used as baselines to estimate the vertical slip on the alluvial fans surface, taking care not to include altitude data of the surrounding reliefs in the profiles. The software requires defining a profile length equal to each side of the baseline. Therefore, we chose the part of the fault trace that allows focusing the profiles only on the surface of the alluvial fans. The vertical slips of both faults can be identified in both profiles, but as they are not parallel structures, the correct measurement of the displacement must be done on the perpendicular profile corresponding to its trace (Figure 5B). In addition, swath profiles longitudinal to the thalwegs of the offset channels have been done by using a perpendicular line to each channel trend as baseline (Figure 5C).
Dating Methods
We used Optically Stimulated Luminescence (OSL) and Uranium Series method for dating the sediments and calcretes, respectively. OSL has been used for dating the only silty layer (unit I) found at the Los Ramos site (RA-OSL1), while the Uranium Series method has been used for dating the calcretes (Figure 3, Table 1). Three out of the five calcretes at the Los Ramos site have been dated: unit B1 (RA-UT7), unit C (RA-UT3) and unit G (RA-UT2). The other two calcretes (Unit A and B2) showed high clayey material because, after their formation, calcretes behave as an open system, exposed to erosion and dissolution, making Uranium Series dating unreliable. To determine the ages of these two calcrete levels, as well as the age of the uppermost calcrete of the Torreagüera alluvial fans (which marks the channels incision age), a relative dating method has been developed by creating a calcrete dates database including previously dated calcretes in the region and their correlation with climatic indicators.
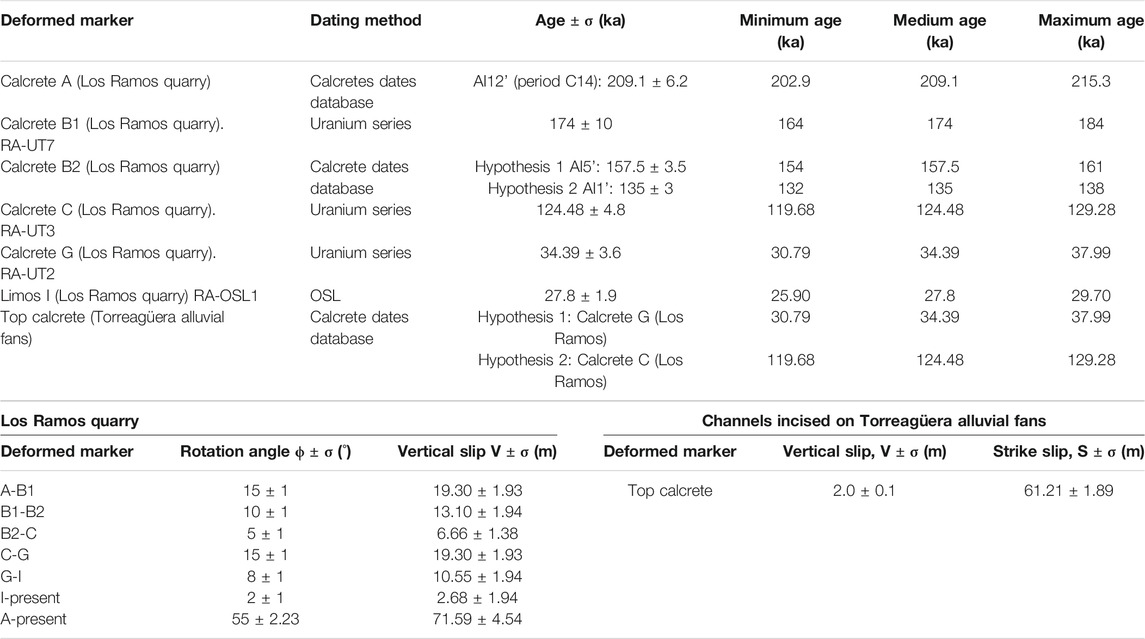
TABLE 1. Summary of the deformed marked on the Los Ramos quarry and Torreagüera alluvial fans, dating methods used, ages obtained and theirs uncertainty ranges. Rotation angles (φ) measured between deformed markers on the Los Ramos quarry and vertical offsets (V) estimated. Vertical (V) and strike (S) displacements measured in the channels incised on Torreagüera alluvial fans.
Calcretes Age Database of SE Spain
The morphological characteristics and properties of paleosoils are often used as paleoclimatic indicators. Correlation of different soil horizons with marine oxygen isotopic stages (OIS or MIS) is often used to establish the geochronology of the deformed and faulted soils in order to estimate deformation rates (Keller and Pinter, 1996; Van der Woerd et al., 2002; Ferry et al., 2007; Chevalier et al., 2012; Moulin et al., 2014). The lack of a detailed and continuous record of continental paleoenvironmental changes in SE Spain for the last 220 ky requires the comparison of these periods with marine isotopic patterns (Candy and Black, 2009; Moreno et al., 2015; Ferrater, 2016; Roquero et al., 2019).
Candy and Black (2009) correlate the formation of carbonate pedogenic horizons in SE Spain with warm MISs from the systematic dating of calcretes by Uranium Series in the Sorbas Basin (Almería). They observed that the age distribution of the calcrete main peaks correlate with the warm MIS1 (the last 12 ky) and MIS5 (130–75 ka) and suggested that the abundance of vegetation may favour sedimentary stability and, therefore, the development of pedogenic carbonate during the interglacial stages. In contrast, the scarce vegetation during glacial stages (cold and dry) may promote soil erosion, the instability of the landscape and incision and aggradation of the channels, which may be also favoured by the periods of glacial-interglacial transition. Moreno et al. (2015) and Ferrater (2016) reach these same conclusions dating sediments and calcretes sampled around the Carboneras and Alhama de Murcia faults, respectively. However, the ages obtained in our study show the formation of calcretes in the warm MIS3 (59–26 ka) (RA-UT2) and MIS5 (RA-UT3), but also during the cold MIS6 (185–130 ka), as some peaks identified in the age frequency curve of the Sorbas Basin calcretes (Candy and Black, 2009).
In order to shed some light on this correlation and also to estimate a relative age for the calcretes that could not be dated by the Uranium Series method (Unit A and B2; Figure 3), a database of published numerical ages of regional calcretes has been compiled (Supplementary Table S1): 1) Sorbas Basin, except for those results with high uncertainties and even higher than the measurement (Ranks 1, 3, 8, 22 and 24 of Table 1 in Candy and Black, 2009), 2) Carboneras Fault area (Moreno et al., 2015) and, 3) Alhama de Murcia Fault area (Ferrater, 2016), as well as those presented in the present study (4). A frequency distribution curve has been made from the age ranges (age ± 1σ) of all the data collected in the database, assuming a discrete uniform probability distribution. The main peaks represent the most likely periods of calcrete formation in SE Spain.
Estimating the Uncertainties
Uncertainty in the resulting slip rates, one of the main seismogenic parameters required to include active faults in modern seismic hazard studies, is typically treated as epistemic and quantified through the propagation of the measurement errors in both offset and time, (e.g. Bird, 2007; Zechar et al., 2009).
Uncertainties or errors in measurements made in the field are due to limitations or error in the accuracy of the measuring instrument. We assumed that the field measurement error is the minimum measurement unit of the instrument used (±1 cm or ±1° for each measurement made on the quarry wall, and ±1 m for measurements made in a GIS software). The age values provided by the laboratory are expressed by the mean value of all the instrumental measurements made ±1 or 2 standard deviations (σ), which indicates the dispersion of the measurement set, including also the precision error of the measuring instruments and the error propagation of the variables included in the mathematical functions used in the estimate.
When there is more than one variable with a normal distribution and they are correlated in a linear function, the standard deviation of the function will depend on the standard deviation of each correlated variable in the function. The error propagation allows the precise determination of the results of mathematical operations with variables whose values are derived from experimental measurements. In this way, the calculation of error propagation has been applied to all estimates needed to obtain fault-slip rates (Supplementary Table S2), considering in all cases ±1 standard deviation of each variable.
Results
Estimating the Vertical Slip in Los Ramos Quarry
The progressive discordance of the Los Ramos quarry forms a rotational offlap-onlap relationship between units A and J: unit C is overlain units A-B2 in offlap, and units G-I again lie in offlap above unit C, followed by unit J in overlap on top of the sedimentary set (Figures 3 and 4). From the modeling proposed for the fault-propagation fold responsible for this geometric arrangement vertical slip (V) has been calculated for the periods defined by the different sedimentary markers (Table 1).
The vertical slips value obtained (Table 1) must be considered on the lower range, because the geometric model does not include deformations by dragging.
Estimating Net Slip on the Torreagüera Alluvial Channels
The analysis of the statistical values (minimum, maximum, mean, mode and standard deviation) obtained from the swath profiles made on the surface of the Torreagüera alluvial fans reveals that the mode value represents the most frequent height for each point of the profile and, therefore, the altitude value closest to the original surface of the alluvial fans. In addition, the minimum values of swath profiles made longitudinally to the channels have been taken to identify their respective thalwegs or depocenters.
Altitude values are usually well adjusted to a regression of exponential type. Therefore, the vertical slip has been estimated by comparing trend or exponential regression lines of the profiles on each side of the faults (Figure 6). In the swath profiles made on the surfaces of the alluvial fans, we identified an uplifted central block limited by both fault strands in a pop-up like structure. The vertical offset quantified for this central block is 2.0 ± 0.1 m in each profile (Figure 6A). In addition, we made swath profiles longitudinal to the channel thalwegs (Figure 5C). The western thalweg profile reveals an uplift of the central block of 2.0 ± 0.1 m with respect to the northern block and of 2.5 ± 0.1 m with respect to the southern block (Figure 6B). The central thalweg also records a 2.0 ± 0.1 m slip of the central block with respect to the northern block, while the vertical slip is insignificant with respect to the southern block (Figure 6C). Finally, the southern fault does not affect the eastern thalweg (Figure 5) and no vertical slip has been identified around the northern fault (Figure 6D). These results indicate that both faults form a pop-up structure, which loses vertical component towards the northeast. The average value of the vertical component of this structure may be quantified at 2.0 ± 0.1 m.
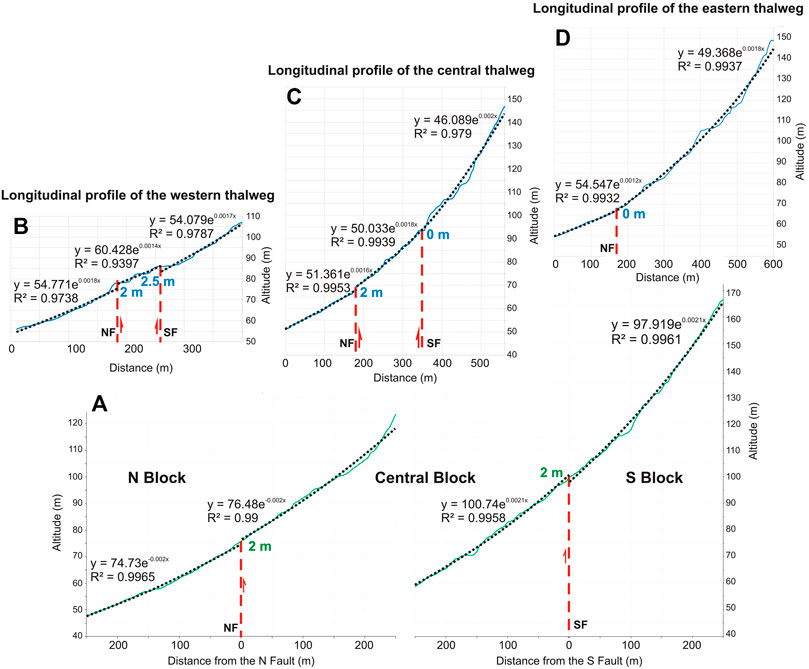
FIGURE 6. (A): Topographic profile of the mode value (swath profiles perpendicular to the traces of the faults). The dashed lines represent the trend lines (exponential regression with its corresponding function and constant) of the profile on both side of the faults. (B), (C) and (D): Topographic profiles of the minimum values (swath profiles longitudinal to the western, central and eastern thalwegs, respectively). The dashed line is the trend lines (exponential regression with its corresponding function and constant) of the profile on both side faults. Altitude measured in m. a. s l.
To estimate the strike displacement to northeast of this structure, homologous points have been identified on each side of the central block for the western and central thalwegs, and on both sides of the northern branch for the eastern thalwegs. The average lateral offsets measured on each thalweg are 60.43 ± 4.68 m, 59.84 ± 2.94 m and 63.35 ± 1.66 m, from southwest to northeast (Figure 5A). The analysis of objective and subjective qualities (Ferrater, 2016) of the three measurements indicates that are comparable and similar. Therefore, the offset of the northern fault is established from the average of all the measurements made on the three offsets (36 measurements). The uncertainty of measurement has been determined by calculating the mean standard error of the sample (
With a vertical and along-strike slip of 2.0 ± 0.1 m and 61.21 ± 1.89 m, respectively (Table 1), the NE Segment of the Carrascoy Fault slip vector shows a clear dominant strike component in Torreagüera alluvial fans.
Dating the Deformed Units
The ages obtained by numerical dating methods for the upper calcretes of units B1 (RA-UT7: 164–184 ka), C (RA-UT3: 119.68–129.28 ka) and G (RA-UT2: 30.79–37.99 ka) (Uranium Series) and for the unit I silts (RA-OSL1: 25.90–29.70 ka) (OSL) from the Los Ramos quarry (Figure 3, Table 1) date the first depositional phase with offlap geometry (units A-B2) to the Middle Pleistocene, the onlap second phase (unit C) between the Middle Pleistocene and the Upper-Middle Pleistocene limit, and the offlap third phase (units D-I) after this limit to the top of the Upper Pleistocene.
The analysis of the calcretes age database of Spain SE may approximate the age of the non-numerically dated calcretes of the Ramos quarry (A and B2) as well as of the fluvial incision at Torreagüera. The frequency distribution curve of the ages of the calcretes displays 14 peaks or maximum frequency ranges for the last 220 ky (MIS1-MIS7) (Figure 7). The peaks are interpreted as the most likely periods of calcrete formation (C1-C14) in SE Spain (Almería and Murcia), although we expect there should be more ranges that were not included in this database because not all the existing calcretes have been dated. Comparing these peaks with global and regional marine patterns, like Benthic δ18O and Planktonic δ18O curves (Von Grafenstein et al., 1999; Lisiecki and Raymo, 2005), respectively, reveals the development of calcretes during all isotopic stages between MIS1 and MIS7, whether cold or warm. However, the comparison of the age of calcrete formation with the regional sea surface paleotemperature curve for the last and penultimate glacial-interglacial cycles (Martrat et al., 2004) provides a good correlation with millennial interstadials warm events identified in the Alborán Sea (Figure 8).
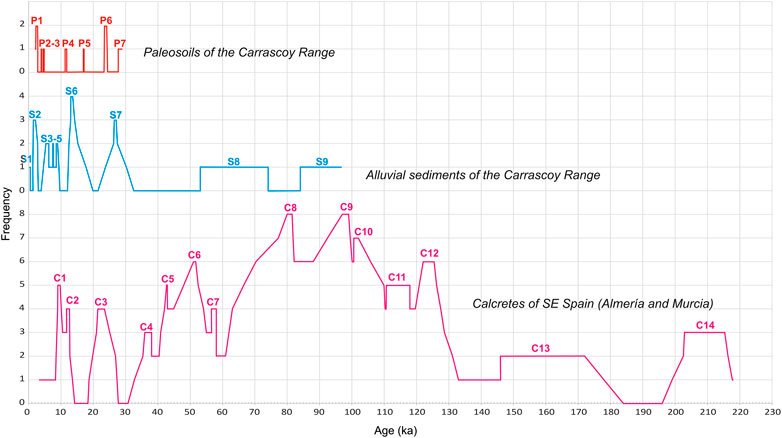
FIGURE 7. Frequency distribution of the geochronology of the SE Spain calcretes obtained by the U-Series method and published (pink line). The period of maximum frequency are interpreted as calcrete formation periods (C1-C14). Frequency distribution of the ages of the sediments (blue line) sampled along the Carrascoy Range and analyzed by OSL and 14C-AMS. Sedimentation periods (S1-S9). Frequency distribution of the ages of the paleosoils (red line) sampled along the Carrascoy Range and analyzed by 14C-AMS. Periods of formation of paleosoils (P1-P7).
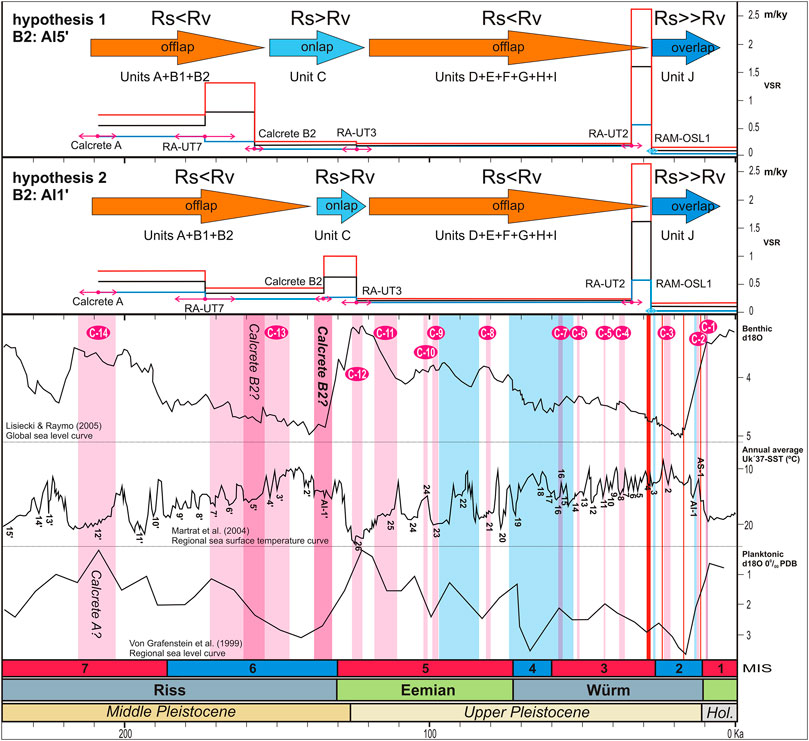
FIGURE 8. Comparison of vertical slip rates (m/ky) (minimum values: blue line; mean values: black line; maximum values: red line) for the two hypotheses of the calcrete B2 age with the outcrop geometry (phase one: offlap (Rs < Rv), phase two: onlap (Rs > Rv), phase three: offlap (Rs < Rv) and phase four: overlap (Rs >> Rv), where Rs: sedimentation rate and Rv: vertical slip rate), the calcrete formation periods of the Spain SE (pink stripes, C1-C14), deposition and paleosoil formation periods around the Carrascoy Fault (blue and red stripes, respectively) and the paleoclimatic marine patterns.
Climate variations on a millennial scale have been documented during the last glacial in Greenland’s ice by Dansgaard et al. (1993), Grootes et al. (1993), and Andersen et al. (2004). These authors defined the Dansgaard/Oeschger (D/O) cycles or sequences of rapid warming (interstadials) and cooling (stadials) events observed in the Greenland profiles δ18O. Martrat et al. (2004) also identified Western Mediterranean sea surface temperature oscillations following a stadial-interstadial pattern from a continuous high-resolution alkenone record spanning the last 250 ky.
The 75% of the ages of the calcretes are correlated with the Holocene period and Alborán interstadials (AI2, 8, 11, 13, 21, 23, 25, 26, and AI3′-7′, 12′ for the last and penultimate climate cycles, respectively), except periods C2, C7 and C10 that correspond to the Alborán stadials (AS1, 16, 24, respectively) (Figure 8). It should also be noted that the period C13 includes several stadial-interstadial cycles due to the few overlapping age clusters (#2 samples) and the high uncertainty of these data.
To calibrate the results obtained from the ages of the calcretes, the numerical ages of sediments and paleosoils have also been incorporated into this correlation (Figure 7). They are deposits and clayey horizons (Bt) related to the Carrascoy Fault, whose numerical ages have been obtained by OSL and Radiocarbon Accelerator Mass Spectrometry (AMS) methods published in previous works (Insua-Arévalo et al., 2015; Martín-Banda et al., 2015; Martín-Banda et al., 2016).
The ages of alluvial sediments (S1-S9) and paleosoils (P1-P7) of the Carrascoy Range as well as regional calcretes (C1-C14) are well correlated (Figure 7). No overlaps between the different periods are observed, except for period C7 that is included within a large sedimentation stage (S8) (Figures 7 and 8). Although some periods of sedimentation are longer (S8 and S9), spanning several stadial-interstadial cycles, they are characterized by maximum cold events and minimum warm events. The comparison of the ages of sediments with the regional paleotemperature curve reveals a good correlation between the periods of sedimentation and the Alborán stadials (AS), while the age of the paleosoils, as well as the age of the calcretes, usually corresponds to the Alborán interstadials (Figure 8).
These results are consistent with conclusions of previous studies (Candy and Black, 2009; Boixadera et al., 2015; Moreno et al., 2015; Ferrater, 2016) suggesting that landscape stability and periods of calcrete formation in the Mediterranean region may be correlated with interglacial stages, and periods of fluvial incision and alluvial aggradation may be related to glacial stages and glacial-interglacial transition periods. In addition, the regional calcrete dates database has reduced the intrinsic uncertainty of the Uranium Series method which may be greater than 10 ky, depending on the sample. When many samples overlap the uncertainty is significantly reduced at intervals of several ky and even less than 1 ky, which allows us to refine the correlation between calcrete formation and fluvial incision processes with millennial warm and cold events, respectively.
Discussion
Calcretes Age Database: Age of the Calcretes A and B2 and the Fluvial Incision
Based on the correlation between periods of calcrete formation and interglacial stages, the ages of calcretes A and B2 in the Los Ramos Quarry and the fluvial incision at Torregüera could be determined. The formation of calcrete A predates calcrete B1 (RA-UT7: 174 ± 10, Figure 3) i.e., the period C13 (146–172 ka). Therefore, it may correspond to an earlier interstadial (Figure 8): 1) to an interstadial between periods C13 and C14 (AI3′ to AI12′); 2) to the period C14 (202.9–215.3 ka); or 3) to an interstadial prior to period C14 (AI13′-AI15′). The age distribution curve of the calcretes does not show data between 183 and 196 ka (AI11′). This may indicate that the database could be incomplete and may point that not all calcretes in the region have been dated. Therefore, based on the available data, the most frequent ages of the pre-B1 calcrete correspond to period C14 (202.9–215.3 ka), being the most likely age range for the calcrete A (Table 1).
Calcrete B2 is younger than calcrete B1 and older than calcrete C (RA-UT3: 124.48 ± 4.8 ka, Figure 3) attributed to the period C12 (122–125.4 ka). The age of calcrete B1 is at the lower end of period C13. Therefore, calcrete B2 may have been developed during any interstadial younger than the age of calcrete B1 (AI1′-AI5′). Accordingly, two hypotheses may be established, it formed during (Figure 8, Table 1): 1) AI5’ (154–161 ka), the largest interstadial of period C13 above calcrete B1, and 2) AI1’ (132–138 ka), the most marked interstadial between periods C12 and C13.
The Torreagüera alluvial fans have been assigned by geomorphological correlation to the third generation alluvial fans in this sector of the Guadalentín Depression and deposited during the Upper Pleistocene (Figure 2) (Silva, 1994; Leyva et al., 2010). Due to the proximity of these alluvial fans to the Los Ramos quarry, their top calcrete could correspond to any one dated in the quarry belonging to the Upper Pleistocene (Table 1): the calcrete G (RA-UT2: 34.39 ± 3.6 ka, C4 period: 36–37.99 ka) and the calcrete C (RA-UTE3: 124.48 ± 4.8 ka, C12 period: 122–125.4 ka). Although they could also correspond to any of the periods of calcretes formation identified between both or even be more recent than the calcrete G (periods C3: 21.4–23.4 ka and C2: 11.77–12.81 ka), the similarity of the carbonation profile of Torregüera with the calcretes C and G and the lack of carbonate after unit I (27.8 ± 1.9 ka) in Los Ramos support the correlation of the Torreagüera calcrete with the calcrete G or C (Figure 8). The latter is located in the limit of the Middle-Upper Pleistocene, a period consistent with the penultimate glacial-interglacial transition, where the regional fluvial incision would be favourable.
Variation of the VSR in Los Ramos Quarry for the Last ∼210 ka
Once the vertical cumulative offset between the different stratigraphic markers of the progressive discordance in the Los Ramos quarry and their ages is estimated, we are able to estimate the VSR variation of the NE Segment of the Carrascoy Fault for the last ∼210 ka, assuming that the oldest deformed marker (calcrete A) was developed during the C14 period (AI12’). Considering a vertical cumulative offset of 71.59 ± 4.54 m for the last 210 ka (Table 1) the resulting VSR is 0.34 ± 0.02 m/ky (Table 2), equivalent to that estimated for the same period of time in the SW Segment of the Carrascoy Fault (0.37 ± 0.08 m/ky) (Martín-Banda et al., 2015).
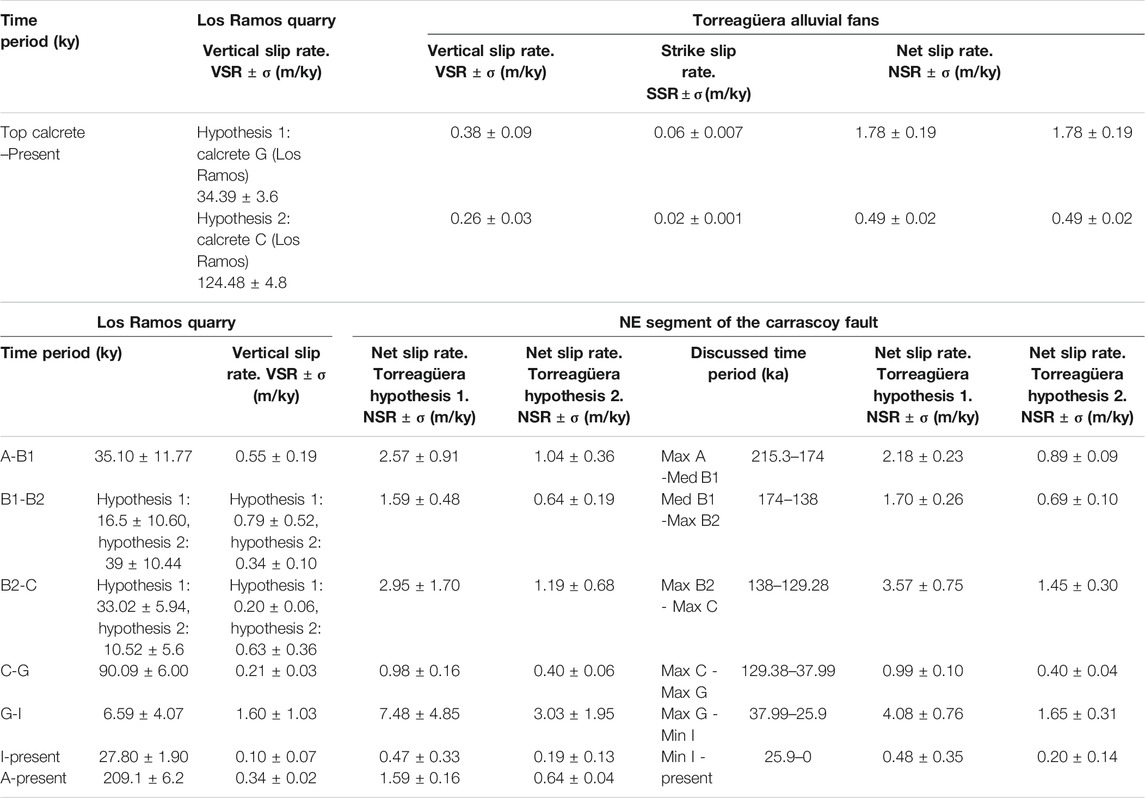
TABLE 2. Summary of the net slip rates estimated in the Torreagüera alluvial fans for the different hypothesis of the top calcrete age (hypothesis 1: calcrete G and hypothesis 2: calcrete C of the Los Ramos quarry). Vertical slip rates estimated in the Los Ramos quarry for these periods. Summary of the vertical slip rate variation estimated in the Los Ramos quarry. Summary of the net slip rate variation calculated for the NE Segment of the Carrascoy Fault based on the two hypothesis of the top calcrete age of the Torreagüera alluvial fans, considering the medium value of the sample ages (black numbers) and the maximum calcrete ages and minimum sediment age (green numbers and columns).
Whether by numerical or relative dating methods, the ages of all the deformed markers have been determined, except for the calcrete B2, which could be correlated with two interstadial (AI5’: 154–161 ka and AI1’: 132–138 ka). The evolution of the VSR for the last ∼210 ka is different depending on the hypothesis of the calcrete B2 age considered (Figure 8, Table 2). The VSR for the period A-B1 is 0.55 ± 0.19 m/ky. Hypothesis one assumes that the calcrete B2 was formed during AI5′, which provides a VSR of 0.79 ± 0.52 m/ky during the period B1-B2 and then decreases to 0.20 ± 0.06 m/ky until the formation of calcrete C (Middle-Upper Pleistocene limit). This last VSR remains similar during most of the Upper Pleistocene (0.21 ± 0.03 m/ky). Even though, this happens if we consider the maximum and medium values of the age range (red and black lines -hypothesis 1, Figure 8), while the minimum values (blue line -hypothesis 1, Figure 8) indicate a decrease of the VSR between the periods A-B1 and B1-B2, weakening the credibility of this hypothesis. On the other hand, hypothesis two considers that calcrete B2 was formed during interstadial AI1’. The results show that the VSR during period B1-B2 decreases (0.34 ± 0.10 m/ky) and afterwards, increases (0.63 ± 0.36 m/ky) until the development of calcrete C for the whole age range of the calcretes (red, black and blue lines -hypothesis 2, Figure 8), providing greater consistency to this hypothesis.
The variation of the VSR of both hypothesis has been compared with the geometry of the progressive discordance (rotational offlap-onlap) and the regional paleoclimate (Figure 8). Offlap geometries indicate lower sedimentation rates than uplift rates and, conversely, onlap geometries imply higher sedimentation rates than uplift rates (Suppe et al., 1992; Ford et al., 1997; Poblet et al., 1997; Storti and Poblet, 1997). In hypothesis 1, the increase in the VSR between markers A and B2 and the significant loss in thickness of the sedimentary bodies is coherent with the first offlap phase, as well as the following decrease in the VSR between markers B2 and C and increase in thickness of the unit C with the second onlap phase. However, the first increase in the VSR is only observed in the maximum and medium values of the range. The minimum values of the VSR decreases between markers B1 and B2. In hypothesis 2, the first offlap phase A-B2 occurs with a decrease in the VSR, but the drop in sedimentation appears to be greater than the decrease in VSR, which falls from 0.55 ± 0.19 m/ky to 0.34 ± 0.10 m/ky during this period. Later, although the VSR increases to 0.63 ± 0.36 m/ky, in this hypothesis it also coincides with the penultimate glacial-interglacial transition, a period of maximum sedimentation at the SE Spain (Candy and Black, 2009; Boixadera et al., 2015; Moreno et al., 2015; Ferrater, 2016), which could explain the onlap of unit C. The next offlap occurs with a drop in the VSR (0.21 ± 0.03 m/ky), but also during the warm MIS5, with a prolific development of calcretes and scarce sedimentation, supporting this geometry and giving consistency to hypothesis 2.
Estimating the NSR in the Torreagüera Alluvial Fans
The NSR of the NE segment of the Carrascoy Fault is estimated using the vertical and strike slips obtained in Torreagüera alluvial fans (Figure 5), as well as the age of the fluvial incision and the fault dip. Considering the age of the fluvial incision at Torreagüera during the penultimate glacial-interglacial transition, after the formation of calcrete C (124.48 ± 4.8 ka), the NSR obtained is 0.49 ± 0.02 m/ky (Table 2). Otherwise if the incision is correlated with the calcrete G (34.39 ± 3.6 ka), the resulting NSR is 1.78 ± 0.20 m/ky (Table 2), which is consistent with the SSR of 1.7–1.6 m/ky for the last 200 ky estimated in the Goñar-Lorca Segment of the Alhama de Murcia Fault (Ferrater, 2016) and with the VSR of 0.16–0.22 m/ky for the last 47–63 ky, distributed in all traces of its southern termination (Ortuño et al., 2012). These similar rates may support that the age of fluvial incision would postdate the development of the calcrete G, and, then, not correlated to the penultimate glacial-interglacial transition. However, the comparison of the NSR obtained in Torreagüera for two possible incision ages with those that would be obtained in the Los Ramos quarry for these ages (calcretes C and G) could shed light on the likely incision age as well as the NSR of the NE Segment of the Carrascoy Fault for this time.
Dependence of the Net Displacement Vector on the Geometric Characteristics of the Fault
The NE Segment of the Carrascoy Fault is a left-lateral fault dipping ∼85° to SE with variable reverse component depending on its orientation (Figure 2). At the Los Ramos quarry, with a N054E strike, the fault shows a progressive discordance, while in Torreagüera, with a N035E direction, it shows a clear dominance of the strike-slip component by lateral offsetting of incised fluvial channels. Therefore, the fault geometry strongly controls the spatial redistribution of strain when rupture occurs and its interaction with other adjacent structures (Cowie et al., 2012). On pre-existing reactivated faults, as the faults of the Eastern Betic Shear Zone, their current slip vector may differ along trace depending on their structural features i.e.,: fault strike, dip and length, as well as the relief or the rheology of the deformed materials.
However, the amount of net slip registered by a fault segment must be relatively constant along its entire trace during a certain time interval, (e.g. Choi et al., 2012). This implies that the slip vector also remains constant in time each fault section, as long as the regional stress field does not vary. Considering that the maximum horizontal shortening NNW-SSE has remained constant since Upper Miocene (Martínez-Díaz, 2002), the amount of NSR of the fault estimated in Torreagüera should be similar as that recorded in Los Ramos quarry during the same period of time.
The NSR may be estimated knowing the VSR together with the dip (β) of the fault and its slip vector rake (θ):
The NSR in Torreagüera has been calculated for two possible fluvial incision ages (Table 2): 1) 1.78 ± 0.20 m/ky considering the age of the calcrete G (RA-UT2: 34.39 ± 3.6 ka); and 2) 0.49 ± 0.02 m/ky when using the age of the calcrete C (RA-UT3: 124.48 ± 4.8 ka), whose formation occurs during the penultimate period of glacial-interglacial transition. With a vertical offset estimated of 2.0 ± 0.1 m (Table 1), the calculated VSR for both hypothesis is 0.06 ± 0.01 and 0.02 ± 0.01 m/ky (Table 2), and the resulting slip vectors rake is 1.9° and 2.4°, respectively, indicating pure left-lateral kinematics in both cases (61.21 ± 1.89 m along-strike offset, Table 1). However, the VSR calculated at Los Ramos quarry for both ages is 0.38 ± 0.09 and 0.26 ± 0.03 m/ky (Table 2) and the rakes of the slip vectors are 12.4° and 32°, respectively. The first rake indicates a slip vector close to pure left-lateral, while the 32° rake suggests a reverse left-lateral slip vector consistent with the deformation observed at the outcrop (a progressive discordance). The variation of the NSR obtained in the Los Ramos quarry for the last 210 ka, considering the age of the calcrete G (12.4° rake), shows periods with average NSR values higher than 2 m/ky and even 7 m/ky (Table 2). These values have been obtained taking into account the periods between medium age of every sample, as well as from the maximum calcrete ages and minimum sediment age. Since the convergence rate between the Eurasian and African plates is 4–6 mm/y (Argus et al., 2011; Serpelloni et al., 2007), these NSR values are not realistic for a fault within the Eastern Betic Shear Zone. However, if we consider the age the calcrete C as the incision age (32° rake), the average NSR values for all periods is less than 2 m/ky from the maximum calcrete ages and minimum sediment age, as we will discuss in the next section (Table 2). Therefore, the fluvial incision on the alluvial fans of Torreagüera occurred after 124.48 ± 4.8 ka (calcrete C) based on: 1) the correlation of the formation of calcrete C with the penultimate glacial-interglacial transition, favorable period for regional fluvial incision (Candy and Black, 2009; Boixadera et al., 2015; Moreno et al., 2015); 2) the correlation of the slip vector with the observed deformations; and 3) the NSR variation estimated in Los Ramos quarry.
NSR Variations on the NE Segment of the Carrascoy Fault for the Last 210 ky: Seismic Supercycles
Once we know the age of the fluvial incision at Torreagüera and the deformed markers at the Los Ramos quarry, as well as the slip vector in each place, we could estimate the NSR variation on the NE Segment of the Carrascoy Fault for the last 210 ka. This variation shows long periods of time (75–90 ky) with low slip rates (<1 m/ky), followed by short intervals (∼10ky) with high slip rates (>1 m/ky) (Figure 9, Table 2). This indicates a non-stationary seismic behavior with sudden accelerations during the last 210 ky, suggesting a cyclical seismic pattern.
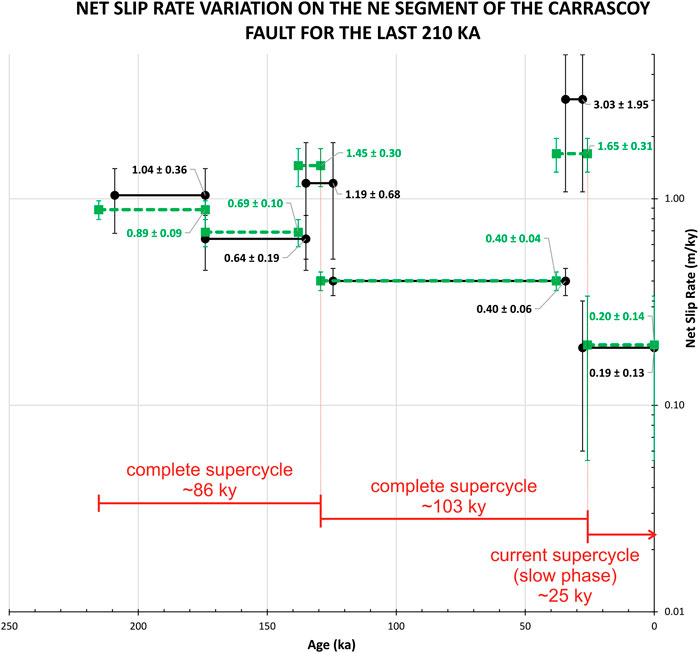
FIGURE 9. Net slip rate variation (m/ky) on the NE Segment of the Carrascoy Fault for the last ∼210 ka obtained considering the average age of the samples (black horizontal lines) and the maximum calcrete ages and minimum sediment age (green horizontal lines). Vertical bars: uncertainty range of the net slip rates estimated (±1 standard deviation in both cases). Supercycles interpreted (red horizontal lines).
Given that the estimated NSR between periods A-B1 (1.04 ± 0.36 m/ky) and B1-B2 (0.64 ± 0.19 m/ky) show the overlap of their uncertainty ranges, the first long and slow phase observed (0.84 ± 0.20 m/ky) extends between the formation of calcretes A and B2 (74.1 ± 15.73 ky). This phase with slip rates less than 1 m/ky is followed by a shorter and more rapid phase between the development of the calcrete B2 and C (10.52 ± 5.66 ky) with slip rates of 1.19 ± 0.68 m/ky. A new slow phase (0.4 ± 0.06 m/ky) with a long duration (90.09 ± 6 ky) is observed between the formation of the calcretes C and G, followed by a faster and shorter phase between the development of the calcrete G and the silty deposits of unit I (6.59 ± 4.07 ky) with a NSR of 3.03 ± 1.95 m/ky. Finally, a current phase seems to be in progress with the lowest values of NSR (0.19 ± 0.13 m/ky). All these NSR values are represented in Figure 9 by black horizontal lines. The vertical lines located in its extremes show the range of error of these estimates.
The average and maximum range of the NSR of the last identified rapid phase (3.03 and 4.98 m/ky) are unlikely values for the Eastern Betic Shear Zone and may be overestimated due to the comparisson of ages of two elements with different geological significances. The age of the calcretes implies a maximum age of displaced unit, since they are equilibrium surfaces originating after the deposit. In contrast, OLS dates may provide minimum ages of the deformated surface, since the sediments deposited before the surface stabilization. Therefore, the NSR has been recalculated considering the maximum age of all the calcretes and the minimum age of the silts of the unit I (green dashed horizontal lines in Figure 9 and green columns in Table 2). The calcrete B1 is an exception, where the average value has been considered because it coincides with the maximum age of period C13 to which it belongs (Figure 8). The maximum age of the calcrete C, correlated with the top calcrete of the alluvial fans of Torregüera is more accurate, since it is before the limit of Middle-Upper Pleistocene, when the fluvial incision that postdates the development of this calcrete takes place. The NSR variation obtained for these ages shows the same cyclical behavior previously discussed. However, there are some differences: 1) closest NSR values in the periods A-B1 and B1-B2; 2) NSR differences between the first slow phase (0.79 ± 0.14 m/ky) and the first rapid phase (1.45 ± 0.3 m/ky) more marked; and 3) an NSR of 1.65 ± 0.31 m/ky in the last rapid phase, credible for the Eastern Betic Shear Zone.
Therefore, large supercycles, in the sense of the cycles defined by Sieh et al. (2008), are observed in this slow-slip fault, formed by a long phase with low slip rates, followed by a short phase with higher slip rates. At least, two complete cycles are observed for the last 210 ka (Figure 9). The last of ∼103 ky (from ∼129 to ∼26 ka), consisting in a long period of ∼91 ky with NSR values 0.40 ± 0.04 m/ky followed by a short period of ∼12 ky with a NSR of 1.65 ± 0.31 m/ky. Regarding the lasting of this complete supercycle, other possible complete previous one of ∼86 ky (from ∼215 to 129 ky) has been identified. It shows a similar pattern: a long period of ∼77 ky with higher NSR values (0.79 ± 0.14 m/ky) than those of the subsequent complete supercycle, and a short period of ∼9 ky with a slightly lower NSR (1.45 ± 0.30 m/ky).
Regarding the variation of the NSR values during the periods with slow slip rates, along the last 210 ka, we can observe a tendency to a decrease. Nevertheless, the only two complete observed supercycles suggests a pattern in which the lower the NSR values during the long period, the higher the NSR values at the end of the supercycle. Rates of the short phase are higher when rates of the short phase are lower and its duration is longer. The supercycles duration seems to increase over time. According to this pattern, the current phase, with the lowest NSR (0.20 ± 0.14 m/ky) registered for the study time period, could be part of a supercycle with a longer period with slow slip rate, or at least similar, to the long period of the last complete supercycle (∼91 ky). Likewise, a following short period with higher NSR than 1.65 ± 0.31 m/ky could occur during the next 75 ky. However, in areas of crustal deformation where there are several slow-motion active faults, the NSR of a fault may vary spontaneously about mean NSR by stress transfer to adjacent faults with the occurrence of an earthquake, (e.g. Cowie 1998; Robinson et al., 2009), changing the seismic cycle of the involved faults.
Implications of the Obtained Results within the Eastern Betic Shear Zone
The recorded NSR variations for the last 210 ka in the NE Segment of the Carrascoy Fault may be related to interactions with other faults of the Eastern Betic Shear Zone. The comparison of slip rates obtained in the NE Segment of the Carrascoy Fault with those estimated in other faults of the Eastern Betic Shear Zone (Figure 10) could reveal similar seismogenic patterns and possible synchronies between different faults.
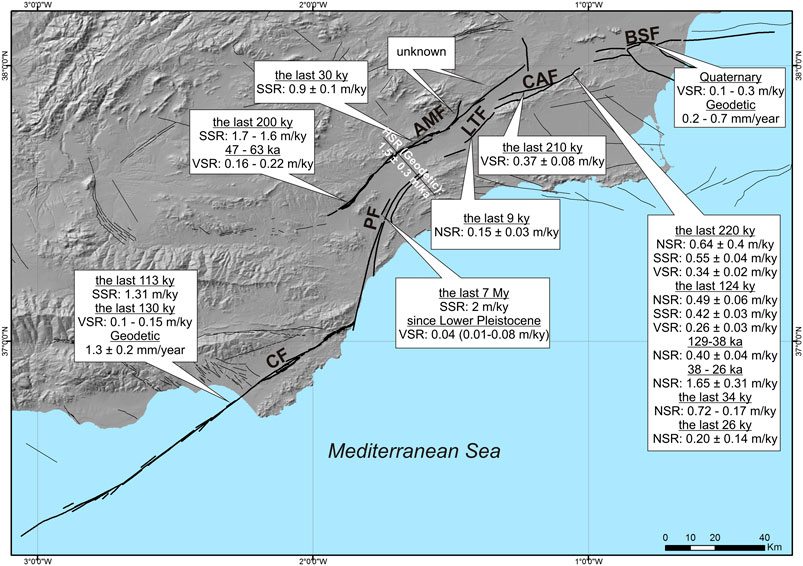
FIGURE 10. Summary of slip rate values available for faults belonging to the Eastern Betic Shear Zone with indication of the time interval (modified from Ferrater, 2016). NSR: net slip rate. SSR: strike slip rate. VSR: vertical slip rate. CF: Carboneras Fault (Moreno, 2011; Moreno et al., 2015; Echeverría et al., 2015). PF: Palomares Fault (Weijermars, 1987; Booth-Rea et al., 2003; García-Mayordomo, 2005). AMF: Alhama de Murcia Fault (Ortuño et al., 2012; Ferrater, 2016). LTF: Los Tollos Fault (Insua-Arévalo et al., 2015). CAF: SO (Martín-Banda et al., 2015). BSF: Bajo Segura Fault (Alfaro et al., 2012; Borque et al., 2019). HSR (Geodetic) blank: horizontal slip rate of the set Alhama de Murcia Fault and Palomares Fault (Echeverria et al., 2013).
The comparison of NSR values obtained from other sources over different timescales usually presents discrepancies, (e.g. Oskin et al., 2008; Cowgill et al., 2009). From the morphotectonic and 3D-trenches paleoseismological analyses, SSR of 1.6–1.7 m/ky and 0.9 ± 0.1 m/ky have been obtained in the Goñar-Lorca and Lorca-Totana segments of the Alhama de Murcia Fault for the last ∼200 ka and ∼30 ka, respectively (Ferrater, 2016). The SSR value for the last ∼30 ka seems consistent with recent geodetic data that suggest a SSR for the set of Alhama de Murcia and Palomares faults of 1.5 ± 0.2 mm/y (Echeverria et al., 2013), of which one third may be absorbed by the Palomares Fault (Ferrater, 2016). This rate for the Palomares Fault is lower than the 2 mm/y estimated for the last 7 Ma by Weijermars (1987), based on the slip inferred from geological materials located along its trace. Likewise, it is much higher than the rate of 0.04–0.10 m/ky discussed by García-Mayordomo (2005) from vertical displacements measured in alluvial deposits (Thyrrenian terraces) (Booth-Rea et al., 2003). In any case, for the geodetic data to be consistent with those of Weijermars (1987), the Palomares Fault slip rate may have decreased over time, supported by the tectonic inversion that experienced the region around 5 Ma (Messinian) (Ott D’Estevou and Montenat, 1985).
It can be seen, therefore, that the long-period rates are higher than recent shorter-periods rates (Ferrater, 2016). However, for the Carboneras Fault, Moreno et al. (2015) calculated a SSR of 1.31 m/ky for the last 1,000 years in trenches dug onshore, and 1.3 m/ky for the last 130 ky, 1.8 My or 3.6 My from offset submarine channels. These estimates are consistent with the 1.3 ± 0.2 mm/yr geodetic rate obtained in the area by Echeverria et al. (2015). On the other hand, the NSR obtained in the NE Segment of the Carrascoy Fault for the last 34.39 ± 3.6 ka is 0.72 ± 0.17 m/ky, similar to the NSR of 0.64 ± 0.04 m/ka calculated for the last 210 ka also in the NE Segment and to the SSR of 0.9 ± 0.1 m/ky of the Lorca-Totana Segment of the Alhama de Murcia Fault for the last 30 ka, if we assume that the contribution of the vertical component to the net slip of this last segment is not significant. The similarity of rates estimated in the NE Segment and in Lorca-Totana Segment of the Alhama de Murcia Fault could indicate the occurrence of composite maximum earthquakes in both segments during the last ∼30 ka. The SSR estimated in the Alhama of Murcia for the last 200 ka could represent the average rate of similar cycles to those identified in the Carrascoy Fault.
Estimated NSR in southwestern faults of the Eastern Betic Shear Zone are higher and with a clear domain of the lateral component than those in the northeastern faults, which show a progressive increase in the vertical component to the NE depending on their trends. The estimated NSR by Insua-Arévalo et al. (2015) in the Los Tollos Fault is of 0.15 ± 0.03 m/ky for the last ∼9 ky with a rake of 15°SW. The rake of the slip vector of the faults is higher when the strike of the faults planes becomes E-W. Thus, the obtained NSR in the NE Segment of the Carrascoy Fault of 0.64 ± 0.04 m/ky for the last ∼210 ky is distributed in 0.55 ± 0.04 m/ky of lateral component, lower than that estimated in the Goñar-Lorca Segment of Alhama de Murcia Fault for the last 200 ka by Ferrater (2016), and in a vertical component of 0.34 ± 0.02 m/ky higher than estimated by Ortuño et al. (2012) for the same segment (0.16–0.22 m/ky) during the last 47–63 ky. However, the vertical component estimated in the NE Segment is consistent to that calculated by Martín-Banda et al. (2015) in the SW Segment of the Carrascoy Fault of 0.37 ± 0.08 m/ky for the last 210 ka. In this segment, the continuous and differential folding of the Carrascoy Range and the generation of a recent forward reverse strand indicate a clear domain of the vertical component.
The northernmost segments of the Alhama de Murcia Fault have a low geomorphological expression indicating that their Quaternary activity decreases towards the NE, and may be transferred to the Carrascoy Fault in this sector (Martínez-Díaz et al., 2012). However, considering that the slip rate values obtained in the Carrascoy Fault are lower than those from the southernmost faults, a distribution of the deformation between northern segments of Alhama de Murcia and Carrascoy faults could also be interpreted.
Finally, the lowest slip rates of the Eastern Betic Shear Zone are registered in its northernmost end, represented by the Bajo Segura Fault, where Alfaro et al. (2012) have calculated a VSR of 0.1–0.3 m/ky for the whole Quaternary. However, recently published geodetic data reveal a maximum shortening rate (NNW-SSE) that varies progressively from 0.2 to 0.7 mm/yr from W to E along the Bajo Segura Fault. Part of this deformation may be accommodated in the External Betic and Cartagena Basin, as well as in its offshore region (Borque et al., 2019).
The comparison of the slip rates of the faults of the Eastern Betic Shear Zone suggest that the deformation absorbed by the shear zone during the last ∼210 ky and the dominance of the lateral component decrease progressively towards the NE. This is due to the increase of the distribution of the deformation among a larger number of faults and segments. The number of faults absorbing the deformation also seems to affect slip rate values at different timescales. The Carboneras Fault, the only fault at the SW tip of the Eastern Betic Shear Zone, with a constant SSR for the last 3.6 My suggests this.
Recent magnitude-frequency models (Gómez-Novell et al., 2020), transfer of Coulomb stress models (Álvarez-Gómez et al., 2018) and earthquake simulators (Herrero-Barrero et al., 2019) reveal the possibility to occur simultaneous ruptures of different Eastern Betic Shear Zone faults, as long as their seismic cycles are synchronized at the time of rupture. In addition, the small gap (<3–4 km) between the Carrascoy Fault and Bajo Segura Fault may not act as rupture barriers and allow the propagation of the rupture from one fault system to the other, as supported by different studies (Boncio et al., 2004; Field et al., 2014; Biasi and Wesnousky, 2016).
Future studies at the Eastern Betic Shear Zone should be aimed at obtaining as much geological and paleoseismic data as possible from the least studied segments (the Palomares Fault and northern segments of the Alhama de Murcia Fault), as well as analyzing possible supercycles of shear zone faults. Recently, Salditch et al. (2020) proposed a model to simulate supercycles in a paleoseismic fault record (Long-Term Fault Memory, LTFM), applicable to complex fault systems, as well as for different geodynamic contexts, which could shed light on this field.
Conclusions
A detailed morphotectonic analysis of offset channels incised on alluvial fans, together with the reconstruction of a fault-propagation fold, have been used for estimating recent slip episodes in the NE Segment of the Carrascoy Fault, one of the main faults of the Eastern Betic Shear Zone.
The good correlation between periods of calcrete formation inferred from a regional database of calcrete dates compiled for this work and interstadials (millennial warm events) identified in the Alborán Sea for the last 250 ky, allowed us to date in relative terms the top calcrete on which the offset channels are incised, as well as some calcretes forming a progressive discordance related to a fault-propagation fold.
A net slip rate of 0.49 ± 0.02 m/ky has been obtained for the NE Segment of the Carrascoy Fault since the fluvial incision age (after 124.48 ± 4.8 ka; Middle-Upper Pleistocene limit), as well as the variation of the vertical slip rate for the last 210 ky.
The different deformation styles observed along the NE Segment of the Carrascoy Fault trace reveal the control that fault geometry plays in the distribution of slip vector components. However, assuming that the accumulated net slip registered during a given time interval at very close sites should be similar, we estimated the variation of the net slip rate for the last 210 ky. The estimated variation of the net slip rate indicates a pattern of cyclic seismic behavior of the NE segment of the Carrascoy Fault: large supercycles, formed by a long phase (70–90 ky) with low slip rates (<1 m/ky), followed by a short phase (∼10 ky) with higher slip rates (>1 m/ky). Two observed complete supercycles have allowed us to infer: 1) the duration of supercycles increases with time, and 2) the slip rates of the short phase are higher when the slip rate of the precedent long phase is lower.
The short periods with higher slip rates identified in the NE segment of the Carrascoy Fault could be an effect of stress transfer due to earthquake events occurred in adjacent faults. The unavailability of such a continuous slip rate record for other faults of the Eastern Betic Shear Zone precludes any interpretation of possible synchronization among faults.
The comparison of slip rates along the Eastern Betic Shear Zone suggests that the lateral component of the slip vector progressively loses dominance from southwest to northeast. Furthermore, the slip rate of the Carboneras Fault, in the southwestern part, remains stationary, while in the faults of the northeastern part it varies over time. These variations seem to be controlled by the distribution of the deformation among a larger number of faults towards the northeast.
Data Availability Statement
The original contributions presented in the study are included in the article/Supplementary Material, further inquiries can be directed to the corresponding author.
Author Contributions
RM-B: preparation of the paper based on one of the main chapters of my doctoral thesis that will be defended at the end of this September. JMI-A and JG-M: direction and review of the structure, approach and content of the paper.
Funding
This work was supported by SISMOGEN (IGME, 2279), FASEGEO (CGL2009-09726) and QUAKESTEP (CGL2017-83931-C3-1P) research projects and a technical assistance of the Civil Protection Service of Murcia.
Conflict of Interest
The authors declare that the research was conducted in the absence of any commercial or financial relationships that could be construed as a potential conflict of interest.
The reviewer HP declared a shared affiliation with several of the authors, JMI-A and RM-B, to the handling editor at time of review.
Acknowledgments
We would like to acknowledge the comments and suggestions of Hector Perea, Umberto Fracassi and R. Jayangonda Perumal.
Supplementary Material
The Supplementary Material for this article can be found online at: https://www.frontiersin.org/articles/10.3389/feart.2020.599608/full#supplementary-material.
References
Alfaro, P. (1995). Neotectónica en la Cuenca del Bajo Segura (Extremo oriental de la Cordillera Bética). (Alicante, Spain: University of Alicante).
Alfaro, P., Andreu, J. M., Andreu, J. M., Estévez, A., Soria, J. M., and Teixidó, T. (2002). Quaternary deformation of the Bajo Segura blind Fault (eastern Betic Cordillera, Spain) revealed by high-resolution reflection profiling. Geol. Mag. 139, 331–341. doi:10.1017/s0016756802006568
Alfaro, P., Bartolome, R., Borque, M. J., Estévez, A., García-Mayordomo, J., García-Tortosa, F. J., et al. (2012). The bajo Segura Fault zone: active blind thrusting in the eastern betic cordillera (SE Spain). J. Iber. Geol. 38, 271–284. doi:10.5209/rev_jige.2012.v38.n1.39217
Álvarez-Gómez, J. A., Insua-Arévalo, J. M., Herrero Barbero, P., Martínez-Díaz, J. J., Cánora-Catalán, C., Alonso-Henar, J., et al. (2018). Potencial de encadenamiento de roturas sísmicas en la Zona de Cizalla de las Béticas Orientales por transferencia de esfuerzos de Coulomb. Volumen de Resúmenes de la III Reunión Ibérica sobre Fallas Activas y Paleosismología, Proceedings of Iberfault, Alicante, Spain, June 11-15 2018, 157–159.
Amores, R., Hernández-Henrile, J. L., and Martínez-Díaz, J. J. (2001). Sobre los factores relacionados con la evaluación de la peligrosidad sísmica en la Región de Murcia. Proceedings of 2° congreso iberoamericano de Ingeniería sísmica, 1–13. Abstract retrieved from Asociación Española de Ingeniería Sísmica (http://www.aeis-sismica.es/aibis/114.0.pdf).
Amores, R., Hernández-Henrile, J. L., and Martínez-Díaz, J. J. (2002). Estudio gravimétrico previo aplicado a la identificación de fallas ocultas como fuentes sismogénicas en la Depresión del Guadalentín (Región de Murcia). Geogaceta 32, 307–310. http://hdl.handle.net/10272/9318.
Andersen, K. K., Azuma, N., Barnola, J. M., Bigler, M., Biscaye, P., Caillon, N., et al. (2004). High-resolution record of Northern Hemisphere climate extending into the last interglacial period. Nature 431 (7005), 147–151. doi:10.1038/nature02805
Argus, D. F., Gordon, R. G., and DeMets, C. (2011). Geologically current motion of 56 plates relative to the no-net-rotation reference frame. G-cubed 12, 1–13. doi:10.1029/2011GC003751
Banda, E., and Ansorge, J. (1980). Crustal structure under the central and eastern part of the Betic Cordillera. Geophys. J. Int. 63, 515–532. doi:10.1111/j.1365-246x.1980.tb02635.x
Bell, J. W., Amelung, F., and King, G. C. P. (1997). Preliminary late quaternary slip history of the Carboneras fault, Southeastern Spain. J. Geodyn. 24 (1-4), 51–66. doi:10.1016/s0264-3707(96)00029-4
Benedetti, L., Manighetti, I., Gaudemer, Y., Finkel, R., Malavieille, J., Pou, K., et al. (2013). Earthquake synchrony and clustering on Fucino faults (Central Italy) as revealed from in situ36Cl exposure dating. J. Geophys. Res. Solid Earth 118, 4948–4974. doi:10.1002/jgrb.50299
Biasi, G. P., and Wesnousky, S. G. (2016). Steps and gaps in ground ruptures: empirical bounds on rupture propagation. Bull. Seismol. Soc. Am. 106 (3), 1110–1124. doi:10.1785/0120150175
Bird, P. (2007). Uncertainties in long-term geologic offset rates of faults: general principles illustrated with data from California and other western states. Geosphere 3, 577–595. doi:10.1130/ges00127.1
Boccaletti, M., Gelati, R., López-Garrido, A. C., Papani, G., Rodríguez-Fernández, J., and Sanz de Galdeano, C. (1987). Neogene-Quaternary sedimentary-tectonic evolution of the betic cordillera. Acta Naturalia de I’Ateneo Parmense 23 (41), 179–200.
Boixadera, J., Poch, R. M., Lowick, S. E., and Balasch, J. C. (2015). Loess and soils in the eastern ebro basin. Quat. Int. 376, 114–133. doi:10.1016/j.quaint.2014.07.046
Boncio, P., Lavecchia, G., and Pace, B. (2004). Defining a model of 3D seismogenic sources for Seismic Hazard Assessment applications: the case of central Apennines (Italy). J. Seismol. 8, 407–425. doi:10.1023/b:jose.0000038449.78801.05
Booth-Rea, G., Azañón, J. M., Garcı́a-Dueñas, V., and Augier, R. (2003). Uppermost tortonian to quaternary depocentre migration related with segmentation of the strike-slip Palomares fault zone, Vera basin (SE Spain). Compt. Rendus Geosci. 335, 751–761. doi:10.1016/s1631-0713(03)00121-4
Booth-Rea, G., Azañón, J.-M., Azor, A., and Garcı́a-Dueñas, V. (2004). Influence of strike-slip fault segmentation on drainage evolution and topography. A case study: the Palomares Fault Zone (southeastern Betics, Spain). J. Struct. Geol. 26, 1615–1632. doi:10.1016/j.jsg.2004.01.007
Borque, M. J., Sánchez‐Alzola, A., Martin‐Rojas, I., Alfaro, P., Molina, S., Rosa‐Cintas, S., et al. (2019). How much Nubia‐Eurasia convergence is accommodated by the NE end of the eastern betic shear zone (SE Spain)? Constraints from GPS velocities. Tectonics 38, 1824–1839. doi:10.1029/2018tc004970
Bousquet, J. C., Cadet, J. P., and Montenat, C. (1975). Quelques observations sur le jeu quaternaire de l’accident de Carboneras (Arc de Gibraltar, Cordillères Bétiques orientales). 3èmeRéunion annuelle des Sciences de la Terre. Montpellier, France: Société géologique de France.
Bousquet, J.-C. (1979). Quaternary strike-slip faults in southeastern Spain. Tectonophysics 52, 277–286. doi:10.1016/0040-1951(79)90232-4
Bousquet, J. C., and Philip, H. (1976). Observations tectoniques et microtectoniques sur la distension Plio-Pléistocène ancien dans l’Est des Cordillères Bétiques (Espagne Méridionale). Cuad. Geol. Iber. 7, 57–67.
Buontempo, L., and Wuestefeld, A. (2013). Complex fault structure interactions of crustal shear zones revealed by seismic anisotropy: an example in the eastern betic cordillera (Spain). Terra. Nova 25 (1), 57–64. doi:10.1111/ter.12005
Butler, R. W. H., and Lickorish, W. H. (1997). Using high-resolution stratigraphy to date fold and thrust activity: examples from the Neogene of south-central Sicily. J. Geol. Soc. 154, 633–643. doi:10.1144/gsjgs.154.4.0633
Calmel-Ávila, M., Silva, P. G., Bardají, T., Goy, J. L., and Zazo, C. (2009). “Drainage system inversion in the guadalentín depression during the late Pleistocene-Holocene (Murcia, Spain),” in Advances in studies on desertification. Editors (Murcia, Spain: Servicio de Publicaciones Universidad de Murcia), 461–464.
Camelbeeck, T., and Meghraoui, M. (1998). Geological and geophysical evidence for large palaeo-earthquakes with surface faulting in the Roer Graben (northwest Europe). Geophys. J. Int. 132, 347–362. doi:10.1046/j.1365-246x.1998.00428.x
Campbell, G. E., Walker, R. T., Abdrakhmatov, K., Schwenninger, J., Jackson, J., Elliott, J. R., et al. (2013). The Dzhungarian fault: late Quaternary tectonics and slip rate of a major right-lateral strike-slip fault in the northern Tien Shan region. J. Geophys. Res. Solid Earth. 118 (10), 5681–5698. doi:10.1002/jgrb.50367
Candy, I., and Black, S. (2009). The timing of Quaternary calcrete development in semi-arid southeast Spian: investigating the role of climate on calcrete genesis. Sediment. Geol. 218 (1-4), 6–15. doi:10.1016/j.sedgeo.2009.03.005
Catafau, E. (1994). Mapa geológico de la Plataforma continental Española y Zonas Adyacentes 1:200.000. Madrid, Spain: ITGE.
Chester, J. S., Spang, J. H., and Logan, J. M. (1988). “Comparison of thrust fault models to basementcored folds in the Rocky Mountain foreland,” in In: interaction of the rocky mountain foreland and the cordilleran thrust belt. Editors C. J. Schmidt, and W. J. PerryJr (CO, United States: Geological Society of America Memoir), 65–74.
Chevalier, M.-L., Tapponnier, P., Van der Woerd, J., Ryerson, F. J., Finkel, R. C., and Li, H. (2012). Spatially constant slip rate along the southern segment of the Karakorum fault since 200ka. Tectonophysics 530-531, 152–179. doi:10.1016/j.tecto.2011.12.014
Choi, J.-H., Jin, K., Enkhbayar, D., Davvasambuu, B., Bayasgalan, A., and Kim, Y.-S. (2012). Rupture propagation inferred from damage patterns, slip distribution, and segmentation of the 1957 MW8.1 Gobi-Altay earthquake rupture along the Bogd fault, Mongolia. J. Geophys. Res. 117. doi:10.1029/2011JB008676
Cowgill, E., Gold, R. D., Xuanhua, C., Xiao-Feng, W., Arrowsmith, J. R., and Southon, J. (2009). Low Quaternary slip rate reconciles geodetic and geologic rates along the Altyn Tagh fault, northwestern Tibet, 37, 647–650. doi:10.1130/g25623a.1
Cowie, P. A. (1998). A healing-reloading feedback control on the growth rate of seismogenic faults. J. Struct. Geol. 20, 1075–1087. doi:10.1016/s0191-8141(98)00034-0
Cowie, P. A., Roberts, G. P., Bull, J. M., and Visini, F. (2012). Relationships between fault geometry, slip rate variability and earthquake recurrence in extensional settings. Geophys. J. Int. 189, 143. doi:10.1111/j.1365-246X.2012.05378.x
Dansgaard, W., Johnsen, S. J., Clausen, H. B., Dahl-Jensen, D., Gundestrup, N. S., Hammer, C. U., et al. (1993). Evidence for general instability of past climate from a 250-kyr ice-core record. Nature 364, 218–220. doi:10.1038/364218a0
De Larouzière, F., Montenat, C., Ott O’Estevou, P., and Griveaud, P. (1987). Evolution simultanée des basin néogènes en compression et en extension dans un couloir de décrochement: Hinojar et Malarron (Sud Est de l’Espagn). Bulletin–Centres de Recherches ExpIoration–Production EIf-Aquitaine. 11, 23–38.
DeMets, C., Iaffaldano, G., and Merkouriev, S. (2015). High-resolution Neogene and quaternary estimates of Nubia-Eurasia-north America plate motion. Geophys. J. Int. 203, 416–427. doi:10.1093/gji/ggv277
Dolan, J. F., Bowman, D. D., and Sammis, C. G. (2007). Long-range and long-term fault interactions in Southern California. Geol. 35, 855. doi:10.1130/G23789A.1
Echeverria, A., Khazaradze, G., Garate, J., Asensio, A., Masana, E., and Suriñach, E. (2011). Present-day GPS crustal deformation rates in the Eastern Betics (SE Spain). Abstract retrieved from Meeting Organizer in Copernicus Office. (Accession No. EGU2011-8005).
Echeverria, A., Khazaradze, G., Asensio, E., Gárate, J., Dávila, J. M., and Suriñach, E. (2013). Crustal deformation in eastern Betics from CuaTeNeo GPS network. Tectonophysics. 608, 600–612. doi:10.1016/j.tecto.2013.08.020
Echeverria, A., Khazaradze, G., Asensio, E., and Masana, E. (2015). Geodetic evidence for continuing tectonic activity of the Carboneras fault (SE Spain). Tectonophysics. 663, 302–309. doi:10.1016/j.tecto.2015.08.009
Erslev, E. A. (1991). Trishear fault-propagation folding. Geol. 19 (6), 617–620. doi:10.1130/0091-7613(1991)019<0617:tfpf>2.3.co;2
Erslev, E. A., and Mayborn, K. R. (1997). Multiple geometries and modes of fault-propagation folding in the Canadian thrust belt. J. Struct. Geol. 19 (3-4), 321–335. doi:10.1016/s0191-8141(97)83027-1
Faure Walker, J. P., Roberts, G. P., Sammonds, P. R., and Cowie, P. (2010). Comparison of earthquake strains over 102and 104year timescales: insights into variability in the seismic cycle in the central Apennines, Italy. J. Geophys. Res. 115, 1–26. doi:10.1029/2009JB006462
Ferrater, M. (2016). Velocitat de desplaçament de la falla d’Alhama de Murcia (Bètiques Orientals); implicacions en el seu potencial sísmic. (Barcelona, Spain: University of Barcelona).
Ferrater, M., Ortuño, M., Masana, E., Martínez-Díaz, J. J., Pallàs, R., Perea, H., et al. (2017). Lateral slip rate of Alhama de Murcia fault (SE Iberian Peninsula) based on a morphotectonic analysis: comparison with paleoseismological data. Quat. Int. 451, 87–100. doi:10.1016/j.quaint.2017.02.018
Ferry, M., Meghraoui, M., Karaki, N. A., Al-Taj, M., Amoush, H., Al-Dhaisat, S., et al. (2007). A 48-kyr-long slip rate history for the Jordan Valley segment of the Dead Sea Fault. Earth Planet Sci. Lett. 260, 394–406. doi:10.1016/j.epsl.2007.05.049
Field, E. H., Arrowsmith, R. J., Biasi, G. P., Bird, P., Dawson, T. E., Felzer, K. R., et al. 2014). Uniform California earthquake rupture forecast, version 3 (UCERF3)--The time-independent model. Bull. Seismol. Soc. Am. 104, 1122–1180. doi:10.1785/0120130164
Ford, M., Williams, E. A., Artoni, A., Vergés, J., and Hardy, S. (1997). Progressive evolution of a fault-related fold pair from growth strata geometries, Sant Llorenç de Morunys, SE Pyrenees. J. Struct. Geol. 19 (3-4), 413–441. doi:10.1016/s0191-8141(96)00116-2
Friedman, M., Hugman, R. H. H., and Handin, J. (1980). Experimental folding of rocks under confining pressure, Part VIII-Forced folding of unconsolidated sand and of lubricated layers of limestone and sandstone. Geol. Soc. Am. Bull. 91 (5), 307–312. doi:10.1130/0016-7606(1980)91<307:eforuc>2.0.co;2
García-Mayordomo, J., and Álvarez-Gómez, J. A. (2006). Estimación del terremoto máximo posible y su intervalo de recurrencia en la Falla de Carrascoy (Murcia) para su implementación en el cálculo de la peligrosidad sísmica de la región. Geogaceta. 39, 51–54. http://hdl.handle.net/10272/8657
García-Mayordomo, J. (2005). Caracterización y Análisis de la Peligrosidad Sísmica en el Sureste de España. (Madrid, Spain: Universidad Complutense de Madrid.
García-Mayordomo, J., Insua-Arévalo, J. M., Martínez-Díaz, J. J., Jiménez-Díaz, A., Martín-Banda, R., Martín-Alfageme, S., et al. (2012). The quaternary active faults database of Iberia (QAFI v.2.0) and QAFI Compilers Working Group. J. Iber. Geol. 38 (1), 285–302. doi:10.5209/rev_jige.2012.v38.n1.39219
García-Mayordomo, J., Martín-Banda, R., Insua-Arévalo, J. M., Álvarez-Gómez, J. A., Martínez-Díaz, J. J., and Cabral, J. (2017). Active fault databases: building a bridge between earthquake geologists and seismic hazard practitioners, the case of the QAFI v.3 database. Nat. Hazards Earth Syst. Sci. 17, 1447–1459. doi:10.5194/nhess-2017-128
Gómez-Novell, O., Chartier, T., García-Mayordomo, J., Ortuño, M., Masana, E., Insua-Arévalo, J. M., et al. (2020). Modelling earthquake rupture rates in fault systems for seismic hazard assessment: the Eastern Betics Shear Zone. Eng. Geol. 265, 105452. doi:10.1016/j.enggeo.2019.105452
Gràcia, E., Pallàs, R., Soto, J. I., Comas, M., Moreno, X., Masana, E., et al. (2006). Active faulting offshore SE Spain (Alboran Sea): implications for earthquake hazard assessment in the southern Iberian margin. Earth Planet Sci. Lett. 241, 734–749. doi:10.1016/j.epsl.2005.11.009
Grootes, P. M., Stuiver, M., White, J. W. C., Johnsen, S., and Jouzel, J. (1993). Comparison of oxygen isotope records from the GISP2 and GRIP Greenland ice cores. Nature 366, 552–554. doi:10.1038/366552a0
Hardy, S., and Poblet, J. (1994). Geometric and numerical model of progressive limb rotation in detachment folds. Geology 22 (4), 371–374. doi:10.1130/0091-7613(1994)022<0371:ganmop>2.3.co;2
Hernández-Enrile, J. L., and Martínez-Díaz, J. J. (2001). Using travertine deformations to characterize paleoseismic activity along an active oblique-slip fault: the Alhama de Murcia fault (Betic Cordillera, Spain). Acta Geol. Hisp. 36 (3-4), 297–313. https://www.raco.cat/index.php/ActaGeologica/article/view/75650/107107
Herrero-Barrero, P., Álvarez-Gómez, J. A., Alonso-Henar, J., and Martínez-Díaz, J. J. (2019). Characterizing seismic rupture scenarios for the Esastern Betic Shear Zone, Spain, using physics-based aerthquake simulations: a preliminar approach. Washington, D.C., United States: American Geophysical Union. Abstract retrieved from Abstracts in Astrophysics Data System (Accession No. 2019AGUFM.T13H0327A)
IGME (2012). QAFI: quaternary active faults database of iberia. Accessed 2020/07/07, available at: http://www.igme.es/infoigme/aplicaciones/QAFI/.
IGN-UPM (2013). Actualización de Mapas de Peligrosidad sísmica de España 2012. Madrid, Spain: Centro Nacional de Información Geográfica.
Insua-Arévalo, J. M., García-Mayordomo, J., Salazar, A., Rodríguez-Escudero, E., Martínez- Díaz, J. J., Álvarez-Gómez, J. A., et al. (2012). Actividad holocena y pleistocena de la falla de Carrascoy, Murcia. Resultados preliminares de un análisis paleosísmico. Geotemas 13, 1511–1514.
Insua-Arévalo, J. M., García-Mayordomo, J., Salazar, A., Rodríguez-Escudero, E., Martín-Banda, R., Álvarez-Gómez, J. A., et al. (2015). Paleoseismological evidence of Holocene activity of the los Tollos Fault (Murcia, SE Spain): a lately formed quaternary tectonic feature of the eastern betic shear zone. J. Iber. Geol. 41 (3), 333–350. doi:10.5209/rev_JIGE.2015.v41.n3.49948
Jerez, F., Leyva, F., García-Tortosa, F. J., and Cabra, P. (2015). Geological Map of Spain, sheet 933-Alcantarilla, scale 1:50.00. Madrid, Spain: IGME.
Keller, E. A., and Pinter, N. (1996). Active tectonics: earthquakes, uplift, and landscape. NY, United States: Prentice-Hall.
Keller, J. V. A., Hall, S. H., Dart, C. J., and McClay, K. R. (1995). The geometry and evolution of a transpressional strike-slip system: the Carboneras Fault, SE Spain. J. Geol. Soc. 152, 339–351. doi:10.1144/gsjgs.152.2.0339
Khazaradze, G., Gárate, J., Suriñach, E., Davila, J. M., and Asensio, E. (2008). Crustal deformation in south-eastern Betics from CuaTeNeo GPS network. Geotemas 10, 1023–1026.
Leyva Cabello, F., Silva Barroso, P. G., and García Tortosa, F. J. (2010). Cartografía Geológica de la hoja 954 Totana, Mapa Geológico Digital de España E. 1:50.000, 20. Madrid, United States: Instituto Geológico y Minero de España. doi:10.1029/2004PA001071
Leyva, F., Sanz de Galdeano, C., García-Tortosa and, F. J., and Silva, P. G. (2010). Mapa geológico y memoria. En Mapa Geológico de España, hoja 934-Murcia, escala 1:50.000. Madrid, Spain: Instituto Geológico y Minero de España.
Lisiecki, L. E., and Raymo, M. E. (2005). A Pliocene-Pleistocene stack of 57 globally distributed benthic δ18O records, Paleoceanography 20, 1–17. doi:10.1029/2004PA001071
López, R., Masana, E., Khazaradze, G., Gomez-Novell, O., Pallàs, R., Ortuño, M., et al. (2018). Carboneras fault (SE Iberia): first paleoseismic 3D trenching results at the southeastern trace and prospects. Proceedings of Iberfault Volumen de Resúmenes de la III Reunión Ibérica sobre Fallas Activas y Paleosismología. Alicante, Spain, June 11-15 2018, 63–66.
Lu, Y., Wetzler, N., Waldmann, N., Agnon, A., Biasi, G. P., and Marco, S. (2020). A 220,000-year-long continuous large earthquake record on a slow-slipping plate boundary. Sci Adv. 6 (48), eaba4170. doi:10.1126/sciadv.aba4170
Marín-Lechado, C., Roldán-García, F. J., Pineda-Velasco, A., Martínez-Zubieta, P., Rodero-Pérez, J., and Díaz-Pinto, G. (2011). “Mapa Geológico Digital continuo E. 1: 50.000, Zonas internas de las Cordilleras Béticas (Zona-2100),” in GEODE: geológico digital continuo de España (on line), sistema de Información geológica continua: SIGECO. Editor J. Navas Accessed 2020/07/07, available at: http://cuarzo.igme.es/sigeco/default.htm.
Martín-Banda, R., García-Mayordomo, J., Insua-Arévalo, J. M., Salazar, Á. E., Rodríguez-Escudero, E., Álvarez-Gómez, J. A., et al. (2015). New insights on the seismogenic potential of the eastern betic shear zone (SE Iberia): quaternary activity and paleoseismicity of the SW segment of the Carrascoy fault zone. Tectonics 35, 55. doi:10.1002/2015TC003997
Martín-Banda, R., Insua-Arevalo, J. M., García-Mayordomo, J., Salazar, A., and Crespo-Martín, C. (2016). Nuevos eventos deformacionales registrados en el Segmento SO de la Falla de Carrascoy (Murcia, España): Implicaciones en el modelo de crecimiento. Geotemas 16, 523–526.
Martínez-Díaz, J. J. (1998). Neotectónica y Tectónica Activa del Sector Centro-Occidental de la Región de Murcia y Sur de Almería (Cordillera Bética – España). (Madrid, Spain: Universidad Complutense de Madrid)
Martínez-Díaz, J. J. (2002). Stress field variation related to fault interaction in a reverse oblique-slip fault: the Alhama de Murcia fault, Betic Cordillera, Spain. Tectonophysics 356, 291–305. doi:10.1016/S0040-1951(02)00400-6
Martínez-Díaz, J. J., Masana, E., and Ortuño, M. (2012). Active tectonics of the Alhama de Murcia fault, betic cordillera, Spain. J. Iber. Geol. 38 (1), 253–270. doi:10.5209/rev_jige.2012.v38.n1.39218
Martínez-Díaz, J. J., Alonso-Henar, J., Insua-Arévalo, J. M., Canora, C., García-Mayordomo, J., Rodríguez-Escudero, E., et al. (2018). Geological evidences of surface rupture related to a seventeenth century destructive earthquake in Betic Cordillera (SE Spain): constraining the seismic hazard of the Alhama de Murcia fault. J. Iber. Geol. 45, 73. doi:10.1007/s41513-018-0082-2
Martínez-Martínez, J. M., and Azañón, J. M. (1997). Mode of extensional tectonics in the southeastern Betics (SE Spain): implications for the tectonic evolution of the peri-Alborán orogenic system. Tectonics 16, 205–225. doi:10.1029/97tc00157
Martrat, B., Grimalt, J. O., López-Martínez, C., Cacho, I., Sierro, F. J., Flores, J. A., et al. (2004). Abrupt temperature changes in the Western Mediterranean over the past 250,000 years. Science 306 (5702), 1762–1765. doi:10.1126/science.1101706
Masana, E., Gràcia, E., Moreno, X., Bartolomé, R., and Dañobeitia, J. J. (2010). Characterizing the seismic potential of the eastern betics shear zone (EBSZ), a major source of earthquakes in southeastern Iberia. Proceedings of Iberfault Volumen de Resúmenes de la III Reunión Ibérica sobre Fallas Activas y Paleosismología, Guadalajara, Spain, October 27-29 2010. Sigüenza), 101–104.
Montenat, C., Ott D’Estevou, P., and Masse, P. (1987). Tectonic-sedimentarv characters of the betics Neogene basins evolving in a crustal transcurrent shear zone (SE Spain). Bulletin des Centres Recherches ExpIaration - Production EIf-Aquitaine. 11, 1–22.
Moreno, X., Masana, E., Gràcia, E., Pallàs, R., Ruano, P., Coll, M., et al. (2007). Primeras evidencias de paleoterremotos en la falla de Carboneras: estudio paleosismológico en el segmento de La Serrata. Geogaceta 41, 135–138.
Moreno, X., Masana, E., Gràcia, E., Bartolomé, R., and Piqué-Serra, O. (2008). Estudio paleosismológico de la Falla de Carboneras: evidencias tierra-mar de actividad tectónica reciente. Geotemas 10, 11035–11038.
Moreno, X. (2011). Neotectonic and paleoseismic onshore-offshore integrated study of the Carboneras Fault (eastern betics, SE Iberia). Barcelona, Spain: University of Barcelona.
Moreno, X., Masana, E., Pallàs, R., Gràcia, E., Rodés, Á., and Bordonau, J. (2015). Quaternary tectonic activity of the Carboneras Fault in the La Serrata range (SE Iberia): geomorphological and chronological constraints. Tectonophysics 663, 78–94. doi:10.1016/j.tecto.2015.08.016
Moreno, X., Gràcia, E., Bartolomé, R., Martínez-Loriente, S., Perea, H., de la Peña, L. G., et al. (2016). Seismostratigraphy and tectonic architecture of the Carboneras Fault offshore based on multiscale seismic imaging: implications for the Neogene evolution of the NE Alboran Sea. Tectonophysics 689, 115–132. doi:10.1016/j.tecto.2016.02.018
Moulin, A., Benedetti, L., Gosar, A., Rupnik, P. J., Rizza, M., Bourlès, D., et al. (2014). Determining the present-day kinematics of the Idrija fault (Slovenia) from airborne LiDAR topography. Tectonophysics 628, 188–205. doi:10.1016/j.tecto.2014.04.043
Ortuño, M., Masana, E., García-Meléndez, E., Martínez-Díaz, J. J., Štěpančíková, P., Cunha, P., et al. (2012). An exceptionally long paleoseismic record of a slow-moving fault: the Alhama de Murcia Fault (Eastern Betic Shear Zone, Spain). Geol. Soc. Am. Bull. 124 (9-10), 1474–1494. doi:10.1130/b30558.1
Oskin, M., Perg, L., Shelef, E., Strane, M., Gurney, E., Singer, B., et al. (2008). Elevated shear zone loading rate during an earthquake cluster in eastern California. Geol. 36, 507–510.doi:10.1130/g24814a.1
Ott D’Estevou, P., and Montenat, C. (1985). Evolution structurale de la zone bétique orientale (Espagne) du Tortonien à I’Holocène. C. R. Acad. Sci. 300 (II), 363–368.
Pace, B., Visini, F., Scotti, O., and Peruzza, L. (2018). Preface: linking faults to seismic hazard assessment in Europe. Nat. Hazards Earth Syst. Sci. 18, 1349–1350. doi:10.5194/nhess-18-1349-2018
Perea, H., Gràcia, E., Alfaro, P., Bartolomé, R., Lo Iacono, C., Moreno, X., et al. (2012). Quaternary active tectonic structures in the offshore bajo Segura basin (SE Iberian Peninsula - Mediterranean sea). Nat. Hazards Earth Syst. Sci. 12, 3151–3168. doi:10.5194/nhess-12-3151-2012
Poblet, J., McClay, K., Storti, F., and Muñoz, J. A. (1997). Geometries of syntectonic sediments associated with single-layer detachment folds. J. Struct. Geol. 19 (3–4), 369–381. doi:10.1016/s0191-8141(96)00113-7
Robinson, R., Nicol, A., Walsh, J. J., and Villamor, P. (2009). Features of earthquake occurrence in a complex normal fault network: results from a synthetic seismicity model of the Taupo Rift, New Zealand. J. Geophys. Res. 114, B12. doi:10.1029/2008JB006231
Rodríguez-Fernández, J., Azor, A., and Azañón, J. M. (2012). “The Betic intramontane basins (SE Spain): stratigraphy, subsidence, and tectonic history,” in Tectonics of sedimentary basins: recent advances. Editors C. Busby, and A. Azor (NJ, United States: Blackwell Publishing Ltd), 461–479.
Roquero, E., Silva, P. G., Rodríguez-Pascua, M. A., Bardají, T., Elez, J., Carrasco-García, P., et al. (2019). Analysis of faulted fan surfaces and paleosols in the Palomares fault zone (betic cordillera, SE Spain): paleoclimatic and paleoseismic implications. Geomorphology 342, 88–102. doi:10.1016/j.geomorph.2019.06.003
Rutter, E. H., Faulkner, D. R., and Burgess, R. (2012). Structure and geological history of the Carboneras Fault Zone, SE Spain: part of a stretching transform fault system. J. Struct. Geol. 45, 68–86. doi:10.1016/j.jsg.2012.08.009
Salditch, L., Stein, S., Neely, J., Spencer, B. D., Brooks, E. M., Agnon, A., et al. (2020). Earthquake supercycles and long-Term Fault memory. Tectonophysics 774, 228289. doi:10.1016/j.tecto.2019.228289
Sanz de Galdeano, C. (1983). Los accidentes y fracturas principales de las Cordilleras Béticas. Estud. Geol. 43, 435–443.
Sanz de Galdeano, C., López-Garrido, A. C., and García-Tortosa, F. J. (1998). Nuevos datos para la estimación de los valores de levantamiento desde el Tortoniense Superior a la actualidad en la parte centro-Occidental de la Sierra de Carrascoy (provincia de Murcia). Geogaceta 23, 139–142.
Serpelloni, E., Vannucci, G., Pondrelli, S., Argnani, A., Casula, G., Anzidei, M., et al. (2007). Kinematics of the western Africa-Eurasia plate boundary from focal mechanisms and GPS data. Geophys. J. Int. 169 (3), 1180–1200.
Sieh, K., Natawidjaja, D. H., Meltzner, A. J., Shen, C. C., Cheng, H., Li, K. S., et al. (2008). Earthquake supercycles inferred from sea-level changes recorded in the corals of West Sumatra. Science 322, 1674–1678. doi:10.1126/science.1163589
Silva, P. G., Goy, J. L., Somoza, L., Zazo, C., and Bardají, T. (1993). Landscape response to strike-slip faulting linked to collisional settings: quaternary tectonics and basin formation in the Eastern Betics, southeastern Spain. Tectonophysics. 224, 289–303. doi:10.1016/0040-1951(93)90034-h
Silva, P. G. (1994). Evolución Geodinámica de la depresión del Guadalentín (Murcia) desde el Mioceno Superior hasta la actualidad: Neotectónica y Geomorfología. Madrid, Spain: Universidad Complutense de Madrid.
Silva, P. G., Goy, J., Zazo, C., J., , and Lario, T. (1997). Paleoseismic indications along “aseismic” fault segments in the guadalentín depression (SE Spain). J. Geodyn. 24, 105–115. doi:10.1016/s0264-3707(97)00011-2
Stirling, M., McVerry, G., Gerstenberger, M., Litchfield, N., Van Dissen, R., Berryman, K., et al. (2012). National seismic hazard model for New Zealand: 2010 update. Bull. Seismol. Soc. Am. 102, 1514–1542. doi:10.1785/0120110170
Storti, F., and Poblet, J. (1997). Growth stratal architectures associated to decollement folds and fault-propagation folds. Inferences on fold kinematics. Tectonophysics 282, 353–373. doi:10.1016/s0040-1951(97)00230-8
Suppe, J., Chou, G. T., and Hook, S. C. (1992). “Rates of folding and faulting determined from growth strata,” in Thrust tectonics. Editor K. R. McClay (London, United Kingdom:Chapman & Hall), 105–121.
Valentini, A., Visini, F., and Pace, B. (2017). Integrating faults and past earthquakes into a probabilistic seismic hazard model for peninsular Italy. Nat. Hazards Earth Syst. Sci. 17, 2017–2039 .doi:10.5194/nhess-17-2017-2017
Van der Woerd, J., Tapponnier, P., Ryerson, F. J., Meriaux, A.-S., Meyer, B., Gaudemer, Y., et al. (2002). Uniform postglacial slip-rate along the central 600 km of the Kunlun Fault (Tibet), from 26Al, 10Be, and 14C dating of riser offsets, and climatic origin of the regional morphology. Geophys. J. Int. 148, 356–388. doi:10.1046/j.1365-246x.2002.01556.x
Vanneste, K., Radulov, A., De Martini, P., Nikolov, G., Petermans, T., Verbeeck, K., et al. (2006). Paleoseismologic investigation of the fault rupture of the 14 April 1928 Chirpan earthquake (M6.8), southern Bulgaria. J. Geophys. Res. 111, B01303, 1–16. doi:10.1029/2005JB003814
Vegas, R., Barranco, L. M., and Vázquez, J. T. (1987). Tectónica de bloques en el SE de España: aplicación de la teledetección a un límite de placas de tipo intracontinental. Geogaceta. 3, 17–19.
Vissers, R. L. M., and Meijninger, B. M. L. (2011). The 11 May 2011 earthquake at Lorca (SE Spain) viewed in a structural-tectonic context. Solid Earth. 2, 199–204. doi:10.5194/se-2-199-2011
Von Grafenstein, R., Zahn, R., Tiedeman, R., and Murat, A. (1999). Planktonic d18O record at sites 976 and 977, Alboran Sea: stratigraphy, forcing, and paleoceanographic implications. Proc. Ocean Drill. Progr. Sci. Results. 161, 469–479.
Weijermars, R. (1987). The Palomares brittle-ductile shear zone of southern Spain. J. Struct. Geol. 9, 139–157. doi:10.1016/0191-8141(87)90022-8
Woessner, J., Laurentiu, D., Giardini, D., Crowley, H., Cotton, F., Grünthal, G., et al. (2015). The 2013 European seismic hazard model: key components and results. Bull. Earthq. Eng. 13, 3553–3596.
Zechar, J. D., and Frankel, K. L. (2009). Incorporating and reporting uncertainties in fault slip rates. J. Geophys. Res. 114, B12407, 1–9. doi:10.1029/2009JB006325
Keywords: active faulting, slip rate, geometrical modeling, fault-propagation fold, calcrete geochronology, seismic super-cycles, eastern betic shear zone
Citation: Martín-Banda R, Insua-Arévalo JM and García-Mayordomo J (2021) Slip Rate Variation During the Last ∼210 ka on a Slow Fault in a Transpressive Regime: The Carrascoy Fault (Eastern Betic Shear Zone, SE Spain). Front. Earth Sci. 8:599608. doi: 10.3389/feart.2020.599608
Received: 27 August 2020; Accepted: 17 December 2020;
Published: 10 February 2021.
Edited by:
Michele M. C. Carafa, Instituto Nazionale di Geofisica e Vulcanologia (INGV), ItalyReviewed by:
Umberto Fracassi, Instituto Nazionale di Geofisica e Vulcanologia (INGV), ItalyR. Jayangonda Perumal, Central University of Tamil Nadu, India
Hector Perea, Complutense University of Madrid, Spain
Copyright © 2021 Martín-Banda, Insua-Arévalo and García-Mayordomo. This is an open-access article distributed under the terms of the Creative Commons Attribution License (CC BY). The use, distribution or reproduction in other forums is permitted, provided the original author(s) and the copyright owner(s) are credited and that the original publication in this journal is cited, in accordance with accepted academic practice. No use, distribution or reproduction is permitted which does not comply with these terms.
*Correspondence: Raquel Martín-Banda, cmFxdWVtMDhAdWNtLmVz