
94% of researchers rate our articles as excellent or good
Learn more about the work of our research integrity team to safeguard the quality of each article we publish.
Find out more
ORIGINAL RESEARCH article
Front. Earth Sci., 08 January 2021
Sec. Biogeoscience
Volume 8 - 2020 | https://doi.org/10.3389/feart.2020.598933
This article is part of the Research TopicObservations, Interactions, and Implications of Increasingly Dynamic Permafrost Coastal SystemsView all 15 articles
 Emily M. Bristol1*
 Craig T. Connolly1
 Thomas D. Lorenson2Bruce M. Richmond2Anastasia G. Ilgen3R. Charles Choens4Diana L. Bull5Mikhail Kanevskiy6
 Go Iwahana7
 Benjamin M. Jones6
 James W. McClelland1
Accelerating erosion of the Alaska Beaufort Sea coast is increasing inputs of organic matter from land to the Arctic Ocean, and improved estimates of organic matter stocks in eroding coastal permafrost are needed to assess their mobilization rates under contemporary conditions. We collected three permafrost cores (4.5–7.5 m long) along a geomorphic gradient near Drew Point, Alaska, where recent erosion rates average 17.2 m year−1. Down-core patterns indicate that organic-rich soils and lacustrine sediments (12–45% total organic carbon; TOC) in the active layer and upper permafrost accumulated during the Holocene. Deeper permafrost (below 3 m elevation) mainly consists of Late Pleistocene marine sediments with lower organic matter content (∼1% TOC), lower C:N ratios, and higher δ13C values. Radiocarbon-based estimates of organic carbon accumulation rates were 11.3 ± 3.6 g TOC m−2 year−1 during the Holocene and 0.5 ± 0.1 g TOC m−2 year−1 during the Late Pleistocene (12–38 kyr BP). Within relict marine sediments, porewater salinities increased with depth. Elevated salinity near sea level (∼20–37 in thawed samples) inhibited freezing despite year-round temperatures below 0°C. We used organic matter stock estimates from the cores in combination with remote sensing time-series data to estimate carbon fluxes for a 9 km stretch of coastline near Drew Point. Erosional fluxes of TOC averaged 1,369 kg C m−1 year−1 during the 21st century (2002–2018), nearly doubling the average flux of the previous half-century (1955–2002). Our estimate of the 21st century erosional TOC flux year−1 from this 9 km coastline (12,318 metric tons C year−1) is similar to the annual TOC flux from the Kuparuk River, which drains a 8,107 km2 area east of Drew Point and ranks as the third largest river on the North Slope of Alaska. Total nitrogen fluxes via coastal erosion at Drew Point were also quantified, and were similar to those from the Kuparuk River. This study emphasizes that coastal erosion represents a significant pathway for carbon and nitrogen trapped in permafrost to enter modern biogeochemical cycles, where it may fuel food webs and greenhouse gas emissions in the marine environment.
Rising permafrost temperature (Romanovsky et al., 2010), declines in sea ice extent (Overeem et al., 2011), and longer ice-free seasons (Stammerjohn et al., 2012) are increasing the vulnerability of Arctic coasts to erosion (Manson and Solomon, 2007). Arctic coastlines, which make up roughly one third of the global coastline extent, are retreating at an average rate of 0.5 m year−1 (Lantuit et al., 2012). The long-term mean annual erosion rate (1940–2000s) of Alaska’s 1,957 km of Beaufort Sea coastline is 1.7 m year−1, but there is high spatial and temporal variability in erosion rates (Gibbs and Richmond, 2015). Not only is this coast retreating on average, but erosion rates along the Alaska Beaufort Sea coast are also increasing, from 0.6 m year−1 circa 1950–1980 to 1.2 m year−1 circa 1980–2000 (Ping et al., 2011). Some sections of the Alaska Beaufort Sea coast retreat more than 22 m in a single year, which is on par with the fastest eroding coasts worldwide (Gibbs and Richmond 2015; Jones et al., 2009; Jones et al, 2018). Rapid erosion along northern Arctic coastlines threatens infrastructure and cultural heritage sites of local communities (Jones et al., 2008). Erosion also delivers sediment, organic matter, and inorganic nutrients to the Arctic Ocean (Ping et al., 2011; Lantuit et al., 2012).
Soils in northern Alaska contain ∼40–150 kg total organic carbon (TOC) m−2 in the top 3 m (Strauss et al., 2013; Hugelius et al., 2014; Schuur et al., 2015; Fuchs et al., 2019). Most of this TOC is sequestered in permafrost; however, coastal erosion can rapidly liberate large quantities of this frozen organic matter into the coastal ocean (Vonk et al., 2012; Vonk and Gustafsson, 2013; Fritz et al., 2017; Stein and MacDonald, 2004). An estimated 4.9–14.0 Tg of organic carbon is released to the Arctic Ocean each year from coastal erosion (Wegner et al., 2015), similar in magnitude to river-borne particulate organic carbon (POC) export to the Arctic Ocean (5.8 Tg; McClelland et al., 2016). Eroded material may be deposited as nearshore marine sediments, resuspended in the water column as POC, or produce dissolved organic carbon (DOC) through physical leaching processes (Dou et al., 2008; Vonk et al., 2012; Fritz et al., 2017). Previous work has shown that organic matter in coastal permafrost along Herschel Island, Canada is rapidly decomposed upon entering seawater, thereby producing carbon dioxide via microbial metabolism (Tanski et al., 2019). In addition to heterotrophic bacteria, higher organisms in nearshore marine food webs also incorporate terrestrial organic matter from along the Beaufort Sea coast (Dunton et al., 2012; Bell et al., 2016; Harris et al., 2018).
TOC storage varies widely along the northern coast of Alaska due to differences in geomorphology and surficial depositional history, making it difficult to constrain estimates of erosional organic matter fluxes to the ocean (Jorgenson and Brown, 2005; Dou et al., 2010; Ping et al., 2011). For instance, Ping et al. (2011) estimates that TOC storage on the Alaska Beaufort Sea coast is highest for exposed bluffs and bays (92–99 kg TOC m−2) and lowest in tapped lake basins and deltas (41–46 kg TOC m−2). When paired with measurements of coastline loss, TOC storage estimates translate into erosional fluxes of 153–180 Gg TOC to the Alaska Beaufort Sea annually (Jorgenson and Brown, 2005; Ping et al., 2011).
In this study, we estimate organic matter and inorganic nutrient fluxes from a 9 km length of coastline near Drew Point, located approximately 100 km east of Utqiaġvik (formerly known as Barrow), AK. The exposed coast between Drew Point and Cape Halkett has the highest rates of erosion along the northern coast of Alaska (Gibbs and Richmond 2015). Jones et al. (2018) reports that erosion along this 9 km segment has more than doubled since the mid-20th century, with recent (2007–2016) annual erosion rates averaging 17.2 m yr−1. This region of Alaska’s North Slope is underlain by continuous permafrost, where the upper several meters of permafrost are characterized by high ground-ice content (up to 90% in some locations), with an abundance of wedge ice (Kanevskiy et al., 2013). Throughout the Holocene, widespread thermokarst lake formation and drainage in this region left roughly 84% of the landscape covered by lakes or drained thermokarst lake basins (DTLBs) (Hinkel et al., 2005; Jones and Arp, 2015). Below reworked lacustrine sediments, permafrost material is composed of marine sediments that were deposited during late-Pleistocene marine transgressions (Black, 1983; Rawlinson, 1993; Brigham-Grette and Hopkins, 1995). The coastline consists of north-facing, exposed bluffs that reach elevations of 1.6–7.1 m above sea level (Jones et al., 2018). Along these bluffs, the primary mechanism for erosion occurs via thermo-mechanical development of niches from wave-action during storms that cause large blocks of permafrost to collapse into the ocean (Jones et al., 2009).
Estimates of organic matter stocks in eroding soils along the Alaska Beaufort Sea coast are currently based on only a few studies. We constructed geochemical profiles extending from the tundra surface to below sea level using coastal permafrost cores (4.5–7.5 m) to better constrain organic matter and nutrient stock estimates along one of Alaska’s most rapidly eroding stretches of shoreline. This is one of the first studies to compare stocks of bulk organic matter with porewater dissolved organic matter in eroding permafrost. Additionally, 14C data from core sediments provide new insight on landscape geomorphology and carbon accumulation rates over time. We used geospatial imagery and LiDAR data to calculate volumetric erosion rates over three time intervals from 1955 through 2007 and over annual time steps from 2008 through 2017 for a 9 km length of coastline. These erosion rates were combined with geochemical data to estimate TOC and other constituent fluxes to the Beaufort Sea from this study coastline. While the results of this study are particularly relevant to the Drew Point area, they also serve as a benchmark for improving regional-scale estimates of erosional organic matter inputs to Arctic coastal waters.
We acquired permafrost cores at Drew Point in April 2018 using two coring systems (Figure 1). Near-surface cores (upper 4–6 m) were acquired using a SIPRE corer (7.5 cm diameter) and cores at depth were acquired using a Geoact coring system (7.5 cm diameter). To capture variations in near-surface permafrost characteristics, we sampled each of the three dominant geomorphic terrain units present in the Drew Point region (Figure 2): primary surface material that has not been reworked by thermokarst lake formation and drainage, an ancient DTLB which drained approximately 5 kyr BP (Hinkel et al., 2003; Jones et al., 2012), and a young DTLB that drained approximately 0.5 kyr BP (Jones et al., 2012). Each core spanned from the tundra surface to below local mean sea level. The core from the primary surface spanned from 6.7 to −0.5 m elevation, the ancient DTLB core spanned from 5.2 to −2.5 m elevation, and the young DTLB core spanned from 3.9 to −0.5 m elevation. Cores were collected in air temperatures between −10 and −20°C. They were photographed and described in the field, packed into coolers for transport back to Utqiaġvik, Alaska and then flown frozen to the University of Alaska in Fairbanks where the cores were stored in a −20°C freezer room prior to shipping them frozen to Sandia National Lab in Albuquerque, NM for processing. Core descriptions and photographs are included in Supplementary Tables S1–S3 and Supplementary Figures S1–S7.
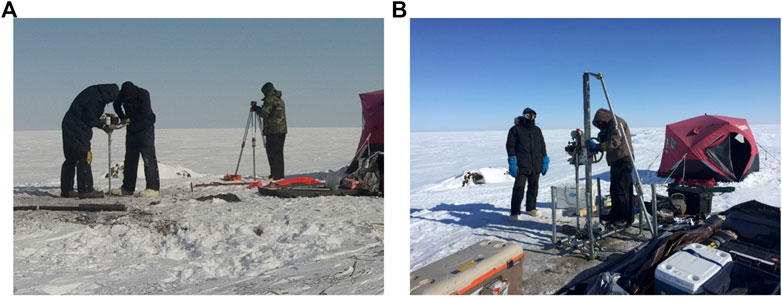
FIGURE 1. Coring activities were conducted near Drew Point, AK in April 2018 using a (A) SIPRE coring system to collect near-surface (top 4–6 m) cores and a (B) Geoact coring system to retrieve cores at depth.
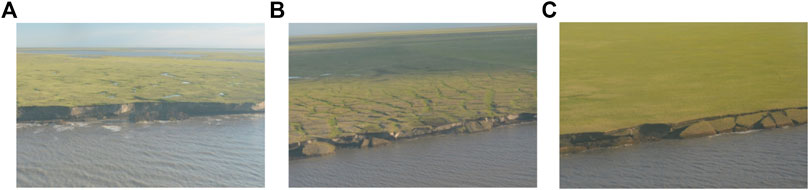
FIGURE 2. Oblique aerial photographs of landscape characteristics. (A) Primary Surface (i.e. landscape that has not been reworked by thaw-lakes), (B) an ancient drained thermokarst lake basin (Ancient DTLB) that drained ∼5 kyr BP, and (C) a young drained thermokarst lake basin (Young DTLB) that most recently drained ∼0.5 kyr BP.
Core sections for chemical analyses were 6–15 cm long. We sectioned the cores at higher resolution near the tundra surface: intervals ranged from 0–40 cm within the top meter of the core and 21–101 cm with increasing depth. Sections from the frozen cores were cut using a band saw that was cleaned with Milli-Q water and ethanol after each use. Core material was then thawed in acid-washed glass beakers at room temperature in preparation for sampling. Aqueous sampling was initiated immediately after the frozen cores were fully thawed. In a few cases, core sections were kept in a refrigerator (4°C) to thaw overnight and sampled the following day. Rhizon samplers were used to collect and filter porewater from thawed core sections. The mean pore size of the filter was 0.15 µm. Following porewater extraction, thawed soil was placed in Whirl-packs and frozen for bulk soil organic carbon and nitrogen content and bulk soil stable carbon and radiocarbon analysis.
Measurements of total organic carbon (TOC) and total nitrogen (TN) content, stable carbon isotope ratios (δ13C) and radiocarbon (14C) analyses of bulk soils/sediments were conducted on 45 samples at the Woods Hole Oceanographic Institution (WHOI), National Ocean Sciences Accelerator Mass Spectrometer (NOSAMS) facility. Bulk samples were dried at 60°C then finely ground using a mortar and pestle. Ground samples went through a vapor fumigation acid/base treatment step to remove inorganic carbon. This step involved placing samples in a vacuum-sealed desiccator in a drying oven (60°C) with a beaker of concentrated HCl for 24 h. Samples were then removed and placed in another vacuum-sealed desiccator with a dish of NaOH pellets, and again stored in a drying oven at 60°C for another 24 h. This latter step neutralized excess HCl. Samples were combusted using an Elementar el Vario Cube C/N analyzer. TOC and TN (% by weight) were quantified during this step. The resulting CO2 was transferred to a vacuum line and cryogenically purified. The purified CO2 gas samples were converted to graphite targets by reducing CO2 with an iron catalyst under 1 atm H2 at 550°C. Targets were subsequently analyzed for stable and radiocarbon isotopes (δ13C as ‰ and 14C as fraction modern carbon). All Δ14C data (in ‰) were corrected for isotopic fractionation using measured δ13C values that were quantified during the 14C-AMS procedure. We measured δ13C in these samples separately on a VG Prism Stable Mass Spectrometer at NOSAMS. Δ14C and radiocarbon age were determined from percent modern carbon using the year of sample analysis according to Stuiver and Polach (1977). The analytical error associated with the radiocarbon ages increases with age: samples assigned an age between modern and 20 kyr BP had an error up to ±85 years, and samples assigned an age greater than 20 kyr BP had an error ranging from ±110 to ±3,700 years.
Dissolved organic carbon (DOC) and total dissolved nitrogen (TDN) concentrations were measured from filtered porewater samples without any added preservatives, which were kept frozen until analysis. Due to limited sample volume and anticipated high concentrations of dissolved organic carbon and nitrogen, pore water samples were diluted either 1:10 or 1:15 with ultrapure (18 MΩ cm−1) water prior to analysis. Concentrations of DOC and TDN were measured at the University of Texas Marine Science Institute using a Shimatzu TOC-V CSH analyzer equipped with a TNM-1 total nitrogen detector. Porewater remaining after DOC and TDN analysis was used to measure conductivity. Conductivity was measured using a Myron L Ultrameter II and converted to the practical salinity scale (PSS-78). Nitrate (NO3−) concentrations were determined using high-performance ion chromatography (HP-ICE) on a Dionex DX-500 ion chromatography system equipped with an AS-1 column at the USGS in Menlo Park, CA, United States. The eluent was a solution of 1.0 mM octanesulfonic acid in 2% isopropanol and using 5.0 mM tetrabutyl ammonium hydroxide as a chemical suppressor. Analyses of ratios of the isotopes strontium-87 (87Sr) to strontium-86 (86Sr) were also done at the USGS laboratories in Menlo Park, California with methods consistent with those reported by Bayless et al. (2004). Values are reported as the dimensionless ratio of 87Sr and 86Sr concentrations (87Sr/86Sr). The ratios of 87Sr/86Sr isotopes were measured with a multicollector thermal-ionization mass spectrometer in positive-ion mode (PTIMS; Finnigan MAT 261).
A suite of other porewater constituents (aluminum, barium, bromide, calcium, chloride, iron, manganese, silicon, sulfate, and strontium) were also analyzed. These data are not presented and discussed in detail herein, but can be found in Supplementary Table S4.
We combined historic aerial photography and recent high-resolution satellite imagery to reconstruct the bluff position at Drew Point between 1955 and 2018 (Jones et al., 2018). A tundra landform geospatial data layer was created by manual delineating features visible (scale of 1:5,000) in a georeferenced aerial photo dataset from 1955 in a Geographic Information System (GIS) framework. Our geomorphic terrain unit classification scheme identified primary surfaces (not altered by thermokarst lake activity), three ages of drained lake basins following Hinkel et al. (2003), modern thermokarst lakes, and sizeable drainage corridors (Figure 3). The geomorphic terrain unit dataset was then clipped according to the area of land lost between a particular period in which we had bluff line position information between 1955 and 2018. Total land area lost per geomorphic terrain unit was then summed for each time period. An airborne LiDAR dataset acquired in 2011 provided information on the height of the terrain relative to local sea level that we used to assign a volume of land loss for each time period between 2012 and 2018. To estimate volume lost before 2012, we averaged terrain heights within each geomorphic terrain unit in the 2011 LiDAR dataset and combined average bluff heights with area lost per geomorphic terrain unit to estimate volumetric erosion rates from 1955 to 2011. These data can be found in Supplementary Table S5.
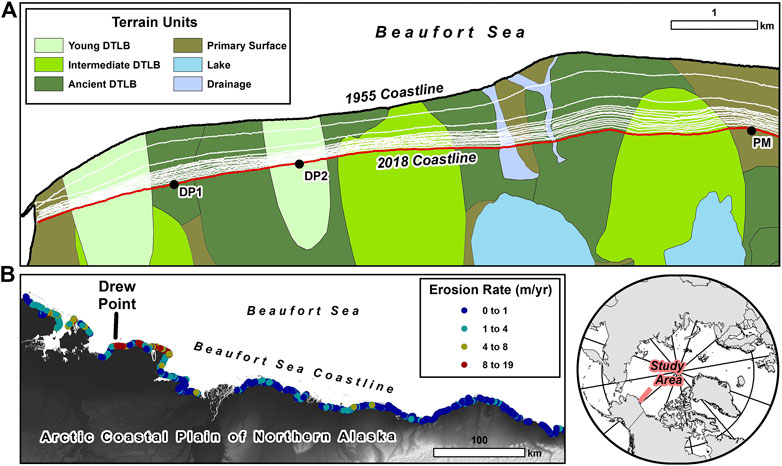
FIGURE 3. (A) Map of 9 km study coastline denoting coastline lost from 1955 (bold black line) and 2018 (bold red line). White lines show bluff line position for timesteps between 1955 and 2018. Geomorphic terrain units indicate surface waters, primary material never re-worked by thaw lakes, and the age-classification of drained thermokarst lake basins. Thermokarst lakes were drained throughout the mid-Holocene (ancient) to late- Holocene (young). Coring locations are indicated by PM (primary surface), DP1 (ancient DTLB), and DP2 (young DTLB). (B) Map of Alaskan Beaufort Sea coast with erosion rates from circa 1940s to circa 2010s (adapted from Gibbs and Richmond, 2017).
Soil/sediment bulk densities were calculated from core sections by measuring water volumes displaced by vacuum sealed frozen core samples. These samples were weighed before and after drying at 50°C to determine dry bulk density (
Soil/sediment (dry solids) accumulation rates and TOC accumulation rates were calculated independently for each of the three permafrost cores. Accumulation rates were calculated as the slope of a linear regression between cumulative stocks and radiocarbon age. Stocks were calculated in bins between radiocarbon dates, where the soil stock in a bin is
To calculate stocks of TOC, TN, and dissolved porewater constituents in eroding bluffs and scale these measurements to the coastline, we binned our data based on downcore patterns. Since downcore patterns were similar between cores of different geomorphic terrain units, we averaged data across the three cores. Based on patterns in organic matter concentrations (presented in the Results section) we created three bins: permafrost 0–3 m above sea level, permafrost >3 m above sea level, and active layer. We assumed an average active layer depth of 40 cm, based on visual inspection of the three cores (Supplementary Tables S1–S3) and other active layer measurements reported from the region (Bockheim and Hinkel, 2007; Urban and Clow, 2018). Within each bin, we averaged our measured dry bulk density, water content, TOC, TN, DOC, TDN, and nitrate concentrations. Since we cored permafrost near the center of ice-wedge polygons, our measured ice content is representative of ground ice in sediments between ice wedges, including pore and segregated ice, but not wedge ice. Values of gravimetric moisture content and effective porosity (which is equal to volumetric ice content) of frozen sediments are presented in Supplementary Figure S8 and Supplementary Table S6. We did not measure excess-ice content of sediments in the laboratory, but it was estimated visually in the field (Supplementary Tables S1–S3). Our estimates showed that segregated ice in ice-rich sediments with ataxitic (suspended) cryostructure comprised up to 70% of volume (Supplementary Figures S2, S3, and S5). To account for wedge-ice content, we used values from a study of ground ice on the Alaska Beaufort Sea coast by Kanevskiy et al. (2013). We assumed that the primary surface at this location had 28% wedge ice, ancient DTLBs had 11% wedge ice, intermediate age DTLBs had 7% wedge ice, and young DTLBs had 3% wedge ice (Kanevskiy et al., 2013). Since wedge ice contains much lower concentrations of TOC compared to soils and pore ice (Tanski et al., 2016), we neglected the potential TOC content in wedge ice. With these data, the mass of TOC (Mc, kg m−2) in a column was calculated as the sum of the mass of TOC in each bin using the following equation:
where
Fluxes of organic carbon to the ocean were calculated as the sum of fluxes from each geomorphic terrain unit during each time step using the following equation
where
In each core, bulk 14C-TOC ranged in age from modern to over 45 thousand years before present (kyr BP; i.e., before 1950). While the primary surface, young DTLB, and ancient DTLB differed in total elevation, we observe similar down core patterns in 14C-TOC age for all the terrain units when plotted with respect to sea level (Figure 4). Soil/sediment and TOC accumulation rates were higher during the Holocene (<12 kyr BP) than the Late Pleistocene (12–38 kyr). Soil/sediment accumulation averaged 102.7 ± 3.6 g m−2 year−1 across the three cores during the Holocene, and 55.9 ± 6.5 g m−2 year−1 from 12 to 38 kyr BP. TOC accumulation averaged 11.3 ± 3.6 g m−2 year−1 during the Holocene and 0.5 ± 0.1 g m−2 year−1 from 12 to 38 kyr BP. Below 1.5 m elevation, 14C-TOC age oscillates between 37 and 47 kyr BP.
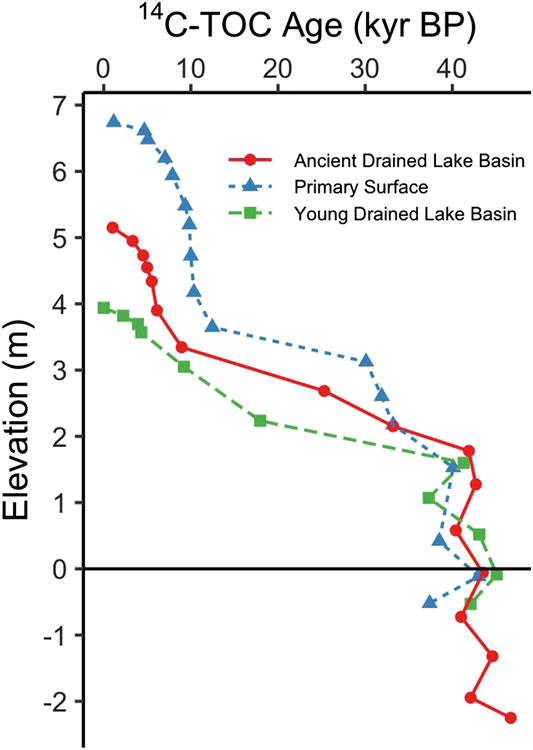
FIGURE 4. Elevation profiles of 14C-TOC ages sampled from three permafrost cores. Colors and symbols indicate the geomorphic terrain unit each core was sampled from. The black horizontal line indicates local mean sea level.
The chemical characteristics of soil/sediment organic matter change markedly with elevation, exhibiting a particularly strong transition around 3 m (Figure 5). TOC and TN profiles are similar among cores, particularly below 3 m elevation (Figure 5). Organic matter content is high and variable above an elevation of 3 m, with TN generally tracking TOC patterns downcore. From the landscape surface to an elevation of 3 m, organic matter content across the three cores average 12.1 ± 1.9% TOC and 0.66 ± 0.09% TN. Below 3 m elevation, organic matter content is much lower and less variable, averaging 1.2 ± 0.1% TOC and 0.10 ± 0.01% TN. TOC to TN molar ratios (C:N) ranged from 7.2 to 21.7, declining from highest values at the tundra surface to the lowest values around 3 m elevation, then gradually increasing again with depth. There is also a distinct shift in δ13C-TOC values that aligns with the shift from higher to lower TOC content at 3 m elevation. Above 3 m, the average for δ13C-TOC was −27.9 ± 0.2‰; below 3 m the average for δ13C-TOC was −26.0‰ ± 0.2.
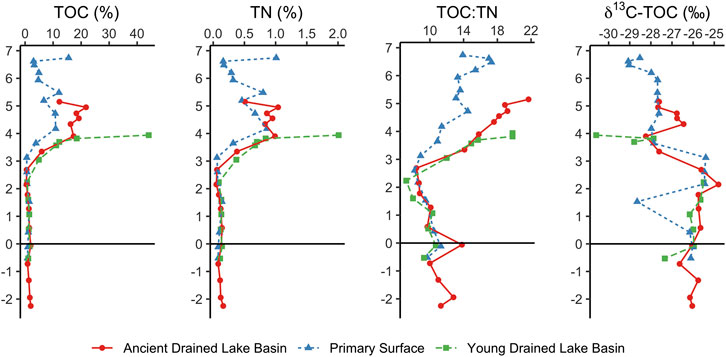
FIGURE 5. Total organic carbon (TOC; wt%), total nitrogen (TN; wt%), organic carbon to nitrogen molar ratio (C:N), and δ13C-TOC (‰) profiles for three permafrost cores. Colors and symbols indicate the geomorphic terrain unit each core was sampled from. The black horizontal lines indicate mean local sea level.
To estimate bluff organic carbon and nitrogen stocks, we paired TOC and TN measurements with soil/sediment dry bulk density measurements. Dry bulk density generally increases down core, averaging 0.4 g cm−3 in permafrost above 3 m elevation and 1.1 g cm−3 below 3 m elevation (Supplementary Figure S8). A table of density measurements (dry bulk density, water content, gravimetric water content, effective porosity) can be found in Supplementary Table S6. Since TOC and TN stocks vary by bluff height, we calculated stocks for each geomorphic terrain unit (young DTLB, intermediate age DTLB, ancient DTLB, primary surface) based on the average bluff height of eroding material and estimated wedge-ice content (%). The primary surface classification has the tallest bluffs (4.8 ± 0.1 m) and stores an estimated 106.3 kg m−2 TOC and 6.9 kg m−2 TN. Young DTLBs have an average bluff height of 4.1 ± 0.1 m and store 101.0 kg m−2 TOC and 6.9 kg m−2 TN. Ancient DTLBs have a lower elevation of 3.7 m and store 81.1 m−2 TOC and 5.6 kg m−2 TN. Intermediate age DTLBs have the lowest elevation bluffs (3.0 ± 0.1 m) and store an estimated 67.1 kg m−2 TOC and 4.6 kg m−2 TN. For a 4 m bluff (average along this coastline), the average 14C-TOC age of eroding organic matter is ∼16 kyr BP when weighted by TOC stocks.
In general, porewater chemistry varies greatly with depth, but elevation profiles demonstrate relatively similar trends among the three cores (Figure 6). Like total organic matter, there are distinct trends above and below an elevation of 3 m. Above 3 m, salinities of thawed porewaters are under 3.5 (Figure 6). Below 3 m, salinities of thawed porewaters increase nearly linearly with depth to a maximum of 36.9 at an elevation of −2.3 m. We observed that with increasing salt content, there was a phase change in the core: permafrost with porewater salinities greater than ∼25 at room temperature was also partially or completely unfrozen at ground temperatures as low as −8°C. These salty, unfrozen cryotic sediments (sometimes referred to as a cryopeg; Tolstikhin and Tolstikhin 1974; van Everdingen 1998) occurred within ±0.5 m of sea level and extended to the bottom of each core. Dissolved organic matter concentrations in porewater vary greatly down core (Figure 6), and TDN generally tracks DOC (see Supplementary Table S4 for TDN concentrations). DOC concentrations range between 23 and 585 mg L−1 (Figure 6), with the lowest concentrations occurring near the soil surface and near an elevation of 2 m. DOC:TDN molar ratios range from 15 to 54 in the top 40 cm of the cores and decline to ∼6 below 3 m elevation. Nitrate concentrations reach 0.7 mg NO3− L−1 above 3 m elevation, and no nitrate was detected below an elevation of 2.5 m. Data from a subset of samples that were analyzed for strontium isotope ratios showed that 87Sr/86Sr ranged between 0.7092 and 0.7115. Samples with salinities greater than 10 were notably more depleted in 87Sr/86Sr, with ratios below 0.7095 (Figure 7).
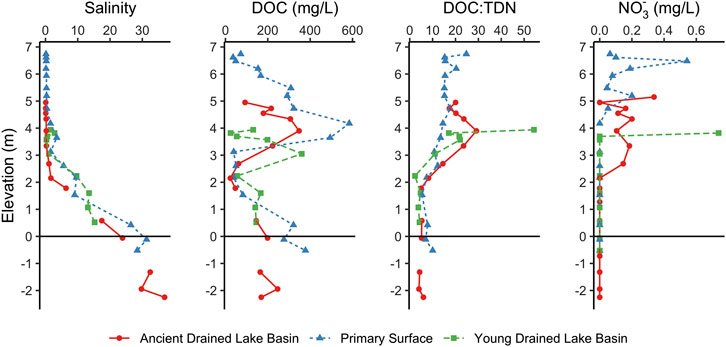
FIGURE 6. Porewater salinity, dissolved organic carbon (DOC; mg C L−1), dissolved organic carbon to total dissolved nitrogen molar ratio (DOC:TDN), and nitrate (NO3−; mg NO3− L−1) profiles for three permafrost cores. Colors and symbols indicate the geomorphic terrain unit each core was sampled from. The black horizontal line indicates mean local sea level.
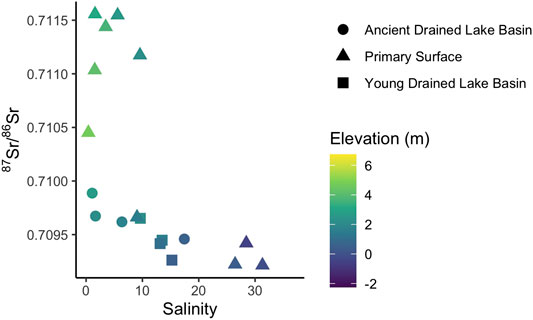
FIGURE 7. Relationship between porewater 87Sr/86Sr and porewater salinity. Color indicates elevation (m) relative to mean local sea level and symbols indicate the geomorphic terrain unit.
While this paper focuses on the abovementioned porewater constituents that are most relevant to understanding of organic C and N fluxes, a broader suite of geochemical data, including porewater aluminum, barium, bromide, calcium, chloride, iron, manganese, silicon, sulfate, and strontium are available for interested readers in Supplementary Table S4. Downcore changes in these constituents are highly variable, with some tracking patterns observed for salinity (e.g. bromide, chloride) and others showing unique patterns. For example, porewater dissolved iron generally remained between 0.1 and 20 mg L−1, with the exception of a distinct spike in concentration occurring at about 4 m elevation in each core where iron reached a maximum of 84.8 mg L−1 (Supplementary Figure S9).
Coastal erosion rates and associated fluxes of TOC have increased markedly since the 1950s (Table 1). Between 1955 and 1979, an average area of 58,673 m2 eroded from the 9 km study section each year. From 2008 to 2018, area lost more than doubled, averaging 148,586 m2 year−1. Along with this increase in areal erosion rates, TOC fluxes to the ocean more than doubled, from 5,340 metric tons TOC year−1 between 1955–1979 to 12,331 metric tons TOC year−1 in the past decade (Figure 8). Note that since our calculations account for the area eroded from geomorphic classifications of various elevation, TOC fluxes scale similarly but not exactly with area lost. Annual resolution data from 2008 to 2018 show how TOC fluxes vary over shorter time steps, and also demonstrate a continued increase in TOC flux within the most recent decade. TN fluxes follow the same trend as TOC fluxes, but are approximately an order of magnitude lower, consistent with our reported C:N (Figure 5). Porewater DOC and TDN fluxes are approximately two orders of magnitude lower than TOC and TN fluxes, respectively (Table 1).
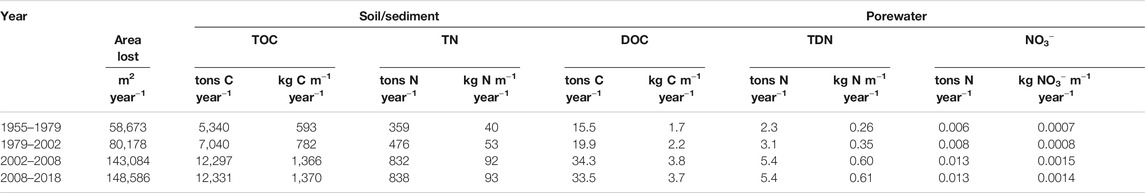
TABLE 1. Average area lost to coastal erosion, TOC and TN fluxes, and porewater DOC, TDN, and NO3− fluxes for our 9 km study coastline over four time steps from 1955 to 2018 and over annual time steps from 2008 to 2018.
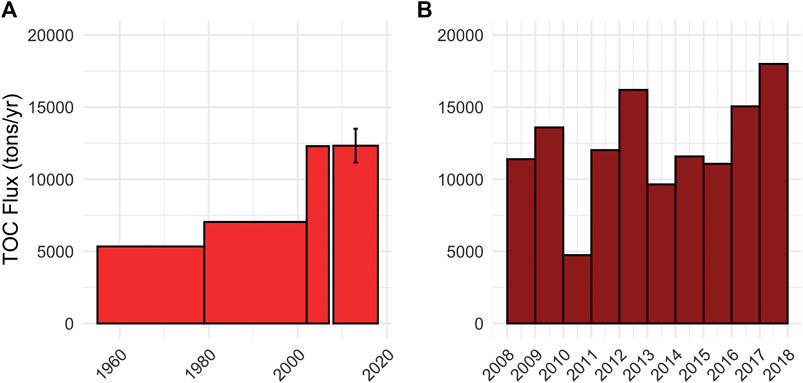
FIGURE 8. Estimation of total organic carbon fluxes to the ocean (metric tons TOC year−1) from the 9 km study section (A) over four time steps from 1955 to 2018 and (B) over annual time steps from 2008 to 2018. The error bar shows standard error.
Our geochemical analyses show that two distinct permafrost layers are eroding into the ocean near Drew Point, AK: 1) organic-rich Holocene-era terrestrial soils and lacustrine sediments and 2) late-Pleistocene marine sediments. The upper layer, found above 3 m elevation, contains TOC with 14C ages as old as ∼12 kyr BP. The δ13C-TOC values in this layer (averaging −27.9‰) are consistent with contributions from C3-dominated tundra vegetation in the Arctic (Stein and Macdonald 2004). Higher C:N ratios above 3 m elevation (Figure 5) are also indicative of vascular plant contributions. Studies have shown that thaw lake development in this region was initiated by the Holocene Thermal Maximum approximately 9–11 kyr BP (Jones and Yu 2010; Kaufman et al., 2004), which aligns with the rapid accumulation of organic-rich material in our cores since 12 kyr BP. Below 3 m elevation, the shift to higher δ13C-TOC values (Figure 5) reflects an increase in marine-derived organic matter. The lower TOC content (<2%) and C:N (∼8–14) of organic matter in the lower layer are also indicative of its marine origin, having similar values to organic matter in nearshore sediments of the Beaufort Sea (Stein and Macdonald, 2004; Couture et al., 2018; Goni et al., 2000). Other studies along Beaufort Sea coastal bluffs report permafrost containing marine microfauna and refer to this silty, unconsolidated sediment as the Flaxman Member of the Gubik Formation (Black, 1983; Carter et al., 1988; Rawlinson, 1993). Thermoluminescence dates on Flaxman Member sediments suggest that this material accumulated during the Simpsonian marine transgression approximately 70–80 kyr BP (Dinter et al., 1990; Rawlinson, 1993; Brigham-Grette and Hopkins, 1995). Another study inland from Drew Point also provides evidence for a late Pleistocene marine transgression occurring between 113 and 71 kyr BP (Farquharson et al., 2018). The relatively young (∼40 kyr BP) radiocarbon ages of bulk OM that we measured below 2 m elevation suggest that these marine sediments have been reworked and subject to homogenization across depths. Our estimated net accumulation rates were comparatively low between 12 and 38 kyr BP, corresponding to colder, drier conditions in the late Pleistocene before rapid development of peatlands (MacDonald et al., 2006; Jones and Yu, 2010). A study by Meyer et al. (2010) showed similar sedimentology near Utqiaġvik, AK, where high-salinity sediments at depth were assigned a14C–TOC age of 39.5 kyr BP, and there was a geochronological gap between 21.7 and 12.4 kyr BP that suggests there was little deposition or reworking during this time.
The unfrozen, brine-rich permafrost (cryopeg) that we encountered near sea level is consistent with findings by Brown (1969) and Meyer et al. (2010) near Utqiaġvik, AK. Proposed mechanisms for brine formation include 1) rejection and concentration of salts in porewaters of soils and lacustrine sediments during permafrost aggradation and 2) residual seawater from relict marine sediments (Brown, 1969; Cascoyne, 2000). Our results showing a decrease in strontium isotope ratios in porewaters with a salinity above ∼10 (Figure 7) suggest that both mechanisms are likely involved. In porewater samples with salinities greater than 10, Sr isotope ratios of 0.7094–0.7095 are similar to values of ∼0.0792 found in modern seawater (Krabbenhoft et al., 2010; Peucker-Ehrenbrink et al., 2010). In porewater samples with salinities less than 10, on the other hand, Sr isotope ratios transition from values close to those expected for seawater to values expected for North American fresh waters (>0.71; Krabbenhoft et al., 2010; Peucker-Ehrenbrink et al., 2010). This points to a mixture of marine and freshwater-derived ions, with the marine source dominating at porewater salinities above 10. Regardless of the mechanism of formation, the existence of a cryopeg along the base of bluffs has implications for coastal erosion, as unfrozen and unconsolidated cryotic soils may be more susceptible to erosion by wave action (Jones et al., 2018).
Most of the landscape near Drew Point has been reworked by thermokarst lake formation and drainage, where ice-rich permafrost degradation and ground ice melt lead to lake formation, followed by drainage and subsequent soil organic matter accumulation and ice-wedge growth (Bockheim et al., 2004; Jorgenson and Shur, 2007; Jones et al., 2012). Thermokarst lakes have been shown to drain quickly, releasing large quantities of water and dissolved organic matter (Jones and Arp, 2015). Post drainage, a study from the Seward Peninsula, Alaska showed that peat accumulates rapidly as productive species colonize the newly exposed surface (Jones et al., 2012). Although peat accumulation slows over time as surface conditions change, TOC stocks tend to increase with lake basin age (Hinkel et al., 2003; Jones et al., 2012). Our cores span a gradient in landscape geomorphology, representing a site where lake formation and drainage did not occur during the Holocene (primary surface), an ancient lake basin that formed and drained about 5 kyr BP, and a young basin where two lakes formed and drained with the last draining occurring in the last 0.5 kyr BP (Hinkel et al., 2003; Jones et al., 2012). We do not explicitly report geomorphic terrain unit-specific carbon stocks in this study because more replication of primary surface, young DTLB, and ancient DTLB coring would be needed to do so. However, there is a general trend of increasing surface elevation with landscape age that translates into differences in carbon storage among geomorphic terrain units. Due to differences in surface elevation, our estimates of carbon storage from local sea level to the tundra surface range from 67.1 kg TOC m−2 (3.0 m bluff typical of an intermediate age DTLB) to 106.3 kg TOC m−2 (4.8 m bluff typical of primary surface). These storage estimates bracket values reported by Ping et al. (2011) for exposed bluffs with an average height of 3.2 ± 0.5 m along the Alaskan Beaufort Sea coast (92 ± 35 kg TOC m−2).
Our geochemical profiles demonstrate that sampling at elevations from near sea level to the active layer is necessary to account for variability in TOC stocks when calculating erosional fluxes. For example, if we calculate TOC stocks for a typical 4 m bluff using TOC and bulk density data from the top meter alone, we overestimate TOC stocks by ∼90% relative to those calculated using data from the full profile. We get closer if we use data from the top 3 m of soil, but still overestimate TOC stocks by ∼8%. Only when we fully account for down-core variations do the estimates completely converge. At least where marine transgressions come into play, accounting for the presence of relict marine sediments as well as organic-rich Holocene age soils and lacustrine sediments allows for more accurate quantification of TOC stocks.
The approximate doubling of TOC flux over the timeframe of our analysis (Figure 8) is associated with accelerating coastline erosion rates rather than a shift in landscape classification or surface elevation. The accelerated erosion rates translate into a higher estimated TOC flux (1,370 kg TOC m−1 year−1) than previously reported by Jorgenson and Brown (2005) or Ping et al. (2011) for the Drew Point coastline (818–848 kg TOC m−1 year−1). Ping et al. (2011) estimated that, on average, exposed bluffs contribute 163 kg TOC m−1 year−1 to the Beaufort Sea. Our estimates suggest that TOC fluxes from Drew Point are nearly an order of magnitude higher than the typical exposed bluffs along the Beaufort Sea coast. As mentioned previously, this is explained by higher erosion rates at Drew Point (17.2 m year−1) compared to the average 1.8 m year−1 (1950–2000) from exposed bluffs reported by Ping et al. (2011). For additional context, it is also noteworthy that annual TOC erosion from our 9 km study section at Drew Point (12,331 tons year−1) is now on par with annual TOC inputs to the Beaufort Sea from the Kuparuk River (12,387 tons year−1; McClelland et al., 2014). Arctic rivers are known to transport large quantities of organic matter and strongly influence the Arctic Ocean (Holmes et al., 2012; McClelland et al., 2016). These results are impressive considering the Kuparuk drains 8,107 km2 of land extending from the Brooks mountain range to the Beaufort Sea coast and is the third largest river on the North Slope of Alaska (McClelland et al., 2014). The Kuparuk River empties into the Beaufort Sea near Deadhorse, approximately 200 km east of Drew Point.
Erosional TN fluxes follow similar trends to TOC, indicating that erosion also contributes a substantial amount of nitrogen to nearshore Arctic coastal waters. Over the past decade, we estimate that erosion from this coastline supplies 838 tons TN year−1 to the ocean, similar to the TN flux (particulate organic nitrogen, dissolved organic nitrogen, ammonium, and nitrate) from the Kuparuk River (641 tons N year−1; McClelland et al., 2014). While this eroding nitrogen is mostly in the particulate organic form, a fraction of it is likely remineralized to inorganic forms in the nearshore environment and supports marine primary production (Tank et al., 2012). It is also important to consider the timing of these nitrogen fluxes. Riverine fluxes peak during the spring snowmelt period, compared to erosion that peaks during the summer open-water season (Holmes et al., 2012; Jones et al., 2018). Therefore, coastal erosion likely supplies nitrogen to nearshore coastal environments during a time of nutrient depletion following spring phytoplankton blooms (Connelly et al., 2015; Kellogg et al., 2019).
Similar to down-core patterns in organic matter, the profiles of DOC, TDN and NO3− show differences in concentrations between Holocene age soils and lacustrine sediments and late-Pleistocene marine sediments. TDN (Supplementary Table S4) tracks DOC, and NO3− concentrations are <1% of TDN, indicating that the bulk of porewater nitrogen is in the organic form. Increasing DOC concentrations with depth from the tundra surface to the bottom of the Holocene age material, and again from ∼2 m elevation to the bottom of the core (Figure 6) could be attributed to leaching of particulate organic matter over time and the concentration of solutes during freeze-thaw cycles. NO3− concentrations decline with depth within terrestrial-derived soils to undetectable concentrations within relict marine sediments. Lower DOC:TDN molar ratios in porewater below 3 m elevation is also reflective of the transition to relict marine sediments. Despite the large volumes of pore and segregated ice that can be found in permafrost, porewater DOC and nutrient concentrations are a small fraction of the total mass fluxes of carbon and nitrogen. DOC and TDN accounted for less than 1% of the total mass fluxes of TOC and TN, respectively (Table 1). However, particulate organic matter eroding into the ocean may be quickly solubilized to dissolved organic forms (Dou et al., 2008) and remineralized to inorganic forms of nitrogen in the nearshore environment (Tank et al., 2012).
In this study, we evaluate the role of coastal erosion in mobilizing ancient stocks of organic carbon and nitrogen to the nearshore Beaufort Sea. Our estimates for carbon storage in the bluffs are comparable to previous studies, but our calculated annual fluxes of material are higher than previous estimates due to the rapid, increasing erosion rates in this region. This suggests that future studies should continue to monitor shoreline loss over time, particularly for sections of coast with high erosion rates or tall bluffs that contribute the greatest volumes of material. The unique, high-resolution depth profiles of TOC, 14C, and other geochemical constituents in this study highlight the need to consider landscape geomorphology and TOC content at depth to prevent overestimating carbon storage in deeper soil horizons. While permafrost contains large volumes of porewaters, we show that dissolved organic carbon and nitrogen are a small fraction of the total flux. Providing detailed estimates of eroding TOC and nutrient fluxes in a warming Arctic will inform our understanding of nearshore carbon and nutrient cycling. Arctic rivers are understood to deliver large quantities of terrestrially-derived organic matter to the ocean (Holmes et al., 2012; McClelland et al., 2016). This study emphasizes coastal erosion as another important driver of organic carbon and nitrogen fluxes to the ocean. Eroding coasts supply organic matter mostly in the particulate form; however, it is likely that dissolved organic matter is leached from eroding material in seawater and can be used by heterotrophic bacteria in the water column or marine sediments. Therefore, estimates of erosional organic carbon and nutrient fluxes, in combination with studies of organic matter lability, are necessary to assess CO2 production as well as marine productivity in the Arctic Ocean.
The original contributions presented in the study are publicly available. This data can be found here: doi: 10.6073/pasta/cc4d53a91ed873765224fcb6d09f5eb7.
All authors were involved in developing the concept and design of this study. MK, GI, and BJ conducted field work. EB, CC, TL, AI, DB, and RC were involved in sample processing. EB, CC, TL, BR, and AI contributed to geochemical analyses. BJ provided geospatial analyses. EB, CC, BJ, and JM wrote the initial draft of the manuscript, and all authors contributed to subsequent revisions.
This project was primarily supported by the Laboratory Directed Research and Development program at Sandia National Laboratories. Additionally, the National Science Foundation provided support for BMJ (OPP-1806213, OISE-1927553), JWM (OPP-1656026), and MK (OPP-1820883). USGS personnel were supported by the USGS Coastal Hazards Program and the Alaska Coastal Processes and Hazards Project team. The Beaufort Lagoon Ecosystems LTER program (funded by OPP-1656026) also provided travel support for EMB’s field work, and provided assistance with data archiving.
Sandia National Laboratories is a multimission laboratory managed and operated by National Technology and Engineering Solutions of Sandia, LLC, a wholly owned subsidiary of Honeywell International Inc., for the U.S. Department of Energy‘s National Nuclear Security Administration under contract DENA0003525. Honeywell International Inc. was not involved in the study design, collection, analysis, interpretation of data, the writing of this article or the decision to submit it for publication.
This paper describes objective technical results and analysis. Any subjective views or opinions that might be expressed in the paper do not necessarily represent the views of the U.S. Department of Energy or the United States Government. Any use of trade, firm, or product names is for descriptive purposes only and does not imply endorsement by the U.S. Government.
We thank A. Turetskaia, B. Cardenas, R. Hladyniuk, and P. Garlough at the University of Texas at Austin, and C. Conaway and J. Fitzpatrick at the USGS in Menlo Park, CA for assisting with chemical analyses. This work was supported by a NOSAMS Graduate Student Internship. We thank the NOSAMS facility and its members at the Woods Hole Oceanographic Institution for their invaluable assistance and generosity in our efforts to estimate 14C and 13C of our sediment samples. Lastly, we thank the two reviewers and the associate editor for their helpful insights.
The Supplementary Material for this article can be found online at: https://www.frontiersin.org/articles/10.3389/feart.2020.598933/full#supplementary-material.
Bayless, E. R., Bullen, T. D., and Fitzpatrick, J. A. (2004). Use of 87Sr/86Sr and delta11B to identify slag-affected sediment in southern Lake Michigan. Environ. Sci. Technol. 38, 1330–1337. doi:10.1021/es0347843
Bell, L. E., Bluhm, B. A., and Iken, K. (2016). Influence of terrestrial organic matter in marine food webs of the Beaufort Sea shelf and slope. Mar. Ecol. Prog. Ser. 550, 1–24. doi:10.3354/meps11725
Black, R. F. (1983). “Three superposed systems of ice wedges at McLeod Point, northern Alaska, may span most of the Wisconsin stage and Holocene,” in Proceedings of the permafrost Fouth International Conference, 68–72
Bockheim, J. G., and Hinkel, K. M. (2007). The importance of “deep” organic carbon in Permafrost-affected soils of Arctic Alaska. Soil Sci. Soc. Am. J. 71, 1889–1892. doi:10.2136/sssaj2007.0070N
Bockheim, J. G., Hinkel, K. M., Eisner, W. R., and Dai, X. Y. (2004). Carbon pools and accumulation rates in an age-series of soils in drained thaw-lake basins, Arctic Alaska. Soil Sci. Soc. Am. J. 68, 697–704.
Brigham-Grette, J., and Hopkins, D. M. (1995). Emergent marine record and paleoclimate of the last interglaciation along the northwest Alaskan coast. Quat. Res. 43 (2), 159–173.
Brown, J. (1969). Ionic concentration gradients in permafrost: Barrow, Alaska, U.S. Army Corps Engineers Cold Regions Research and Engineering Laboratory Research Report, 272.
Carter, L. D., Brouwers, E. M., and Marincovich, L. (1988). “Nearshore marine environment of the Alaska Beaufort Sea during deposition of the Flaxman member of the Gubik Formation,” in In Geologic studies in Alaska by the U.S. Geological Survey during 1987. Editors J.P Galloway, and T.D. Hamilton, 27–30.
Cascoyne, M. (2000). “A review of published literature on the effects of permafrost on the hydrogeochemistry of bedrock,” in POSIVA—00-09.
Connelly, T. L., McClelland, J. W., Crump, B. C., Kellogg, C. T. E., and Dunton, K. H. (2015). Seasonal changes in the quantity and composition of suspended particulate organic matter in lagoons of the Alaskan Beaufort Sea. Mar. Ecol. Prog. Ser. 527, 31–45. doi:10.3354/meps11207
Couture, N. J., Irrgang, A., Pollard, W., Lantuit, H., and Fritz, M. (2018). Coastal erosion of Permafrost soils along the Yukon coastal Plain and fluxes of organic carbon to the Canadian Beaufort Sea. J Geophys Res-Biogeo 123 (2), 406–422. doi:10.1002/2017JG004166
Dinter, D. A., Cater, L. D., and Brigham-Grette, J. (1990). “Late Cenozoic geoloic evolution of the Alaskan North Slope and adjacent continental shelves,” in The Arctic Ocean Region: Geology of North America. Editors A. Grantz, L. Johnson, and J.F. Sweeney (Boulder, CO: The Geological Society of North America), 459–490.
Dou, F., Ping, C. L., Guo, L., and Jorgenson, T. (2008). Estimating the impact of seawater on the Production of soil water-extractable organic carbon during coastal erosion. J. Environ. Qual. 37, 2368–2374. doi:10.2134/jeq2007.0403
Dou, F., Yu, X., Ping, C. L., Michaelson, G., Guo, L. D., and Jorgenson, T. (2010). Spatial variation of tundra soil organic carbon along the coastline of northern Alaska. Geoderma 154 (3–4), 328–335. doi:10.1016/j.geoderma.2009.10.020
Dunton, K. H., Schonberg, S. V., and Cooper, L. W. (2012). Food web structure of the alaskan nearshore shelf and estuarine Lagoons of the Beaufort Sea. Estuar. Coast 35 (2), 416–435. doi:10.1007/s12237-012-9475-1
Farquharson, L., Mann, D., Rittenour, T., Groves, P., Grosse, G., and Jones, B. (2018). Alaskan marine transgressions record out-of-phase Arctic Ocean glaciation during the last interglacial. Geology 46 (9), 783–786. doi:10.1130/G40345.1
Fritz, M., Vonk, J. E., and Lantuit, H. (2017). Collapsing arctic coastlines. Nat. Clim. Change 7 (1), 6–7. doi:10.1038/nclimate3188
Fuchs, M., Lenz, J., Jock, S., Nitze, I., Jones, B. M., Strauss, J., et al. (2019). Organic carbon and nitrogen stocks along a thermokarst lake sequence in Arctic Alaska. J Geophys Res Biogeosci 124, 1230–1247. doi:10.1029/2018JG004591
Gibbs, A. E., and Richmond, B. M. (2015). National assessment of shoreline change — historical shoreline change along the North coast of Alaska, U.S. — Canadian Border to Icy Cape. U.S. Geologial Survey Open File Report 2015—1048. doi:10.3133/ofr20151048
Gibbs, A. E., and Richmond, B. M. (2017). National assessment of shoreline change—summary statistics for updated vector shorelines and associated shoreline change data for the north coast of Alaska, U.S.-Canadian Border to Icy Cape. U.S. Geological Survey Open-File Report. doi:10.3133/ofr20171107
Goñi, M. A., Yunker, M. B., Macdonald, R. W., and Eglinton, T. I. (2000). Distribution and sources of organic biomarkers in arctic sediments from the Mackenzie River and Beaufort Shelf. Mar. Chem. 71 (1-2), 23–51. doi:10.1029/2001GL014047
Harris, C., McTigue, N., McClelland, J., and Dunton, K. (2018). Do high Arctic coastal food webs rely on a terrestrial carbon subsidy?. Food Webs 15, e0081 doi:10.1016/j.fooweb.2018.e00081
Hinkel, K. M., Eisner, W. R., Bockheim, J. G., Nelson, F. E., Peterson, K. M., and Dai, X. (2003). Spatial extent, age, and carbon stocks in drained thaw lake basins on the Barrow Peninsula, Alaska. Arctic Antarct. Alpine Res. 35 (3), 291–300.
Hinkel, K. M., Frohn, R. C., Nelson, F. E., Eisner, W. R., and Beck, R. A. (2005). Morphometric and spatial analysis of thaw lakes and drained thaw lake basins in the western Arctic Coastal Plain, Alaska. Permafr. Periglac. Process. 16 4, 327–341. doi:10.1007/s41063-016-0025-0
Holmes, R. M., McClelland, J. W., Peterson, B. J., Tank, S. E., Bulygina, E., Eglinton, T. I., et al. (2012). Seasonal and annual fluxes of nutrients and organic matter from large rivers to the Arctic Ocean and surrounding seas. Estuar. Coast 35 (2), 369–382. doi:10.1007/s12237-011-9386-6
Hugelius, G., Strauss, J., Zubrzycki, S., Harden, J. W., Schuur, E. A. G., Ping, C. L., et al. (2014). Estimated stocks of circumpolar permafrost carbon with quantified uncertainty ranges and identified data gaps. Biogeosciences 11 (23), 6573–6593. doi:10.5194/bg-11-6573-2014
Jones, B. M., Arp, C. D., Jorgenson, M. T., Hinkel, K. M., Schmutz, J. A., and Flint, P. L. (2009). Increase in the rate and uniformity of coastline erosion in Arctic Alaska. Geophys. Res. Lett. 26, 3. doi:10.1029/2008GL036205
Jones, B. M., and Arp, C. D. (2015). Observing a catastrophic thermokarst lake drainage in northern Alaska. Permafr. Periglac. Process. 26 (2), 119–128. doi:10.1002/ppp.1842
Jones, B. M., Farquharson, L. M., Baughman, C. A., Buzard, R. M., Arp, C. D., Grosse, G., et al. (2018). A decade of remotely sensed observations highlight complex processes linked to coastal permafrost bluff erosion in the Arctic. Environ. Res. Lett. 13 (11), 1274. doi:10.1088/1748-9326/aae471
Jones, B. M., Hinkel, K. M., Arp, C. D., and Eisner, W. R. (2008). Modern erosion rates and loss of coastal features and sites, Beaufort Sea coastline, Alaska. Arctic 61 (4), 361–372. doi:10.1029/2008GL036205
Jones, M. C., and Yu, Z. (2010). Rapid deglacial and early Holocene expansion of peatlands in Alaska. Proc. Natl. Acad. Sci. U.S.A. 107 (16), 7347–7352. doi:10.1073/pnas.0911387107
Jones, M. C., Grosse, G., Jones, B. M., and Walter Anthony, K. (2012). Peat accumulation in drained thermokarst lake basins in continuous, ice‐rich permafrost, northern Seward Peninsula, Alaska. J. Geophys. Res.: Biogeo 117, 1567. doi:10.1029/2011JG001766
Jorgenson, M. T., and Brown, J. (2005). Classification of the Alaskan Beaufort Sea Coast and estimation of carbon and sediment inputs from coastal erosion. Geo Mar. Lett. 25 (2–3), 69–80. doi:10.1007/s00367-004-0188-8
Jorgenson, M. T., and Shur, Y. (2007). Evolution of lakes and basins in northern Alaska and discussion of the thaw lake cycle. J. Geophys. Res.: Earth Surface 112 F2. doi:10.1029/2006JF000531
Kanevskiy, M., Shur, Y., Jorgenson, M. T., Ping, C. L., Michaelson, G. J., Fortier, D., et al. (2013). Ground ice in the upper permafrost of the Beaufort Sea coast of Alaska. Cold Reg. Sci. Technol. 85, 56–70. doi:10.1016/j.coldregions.2012.08.002
Kaufman, D. S., Ager, T. A., Anderson, N. J., Anderson, P. M., Andrews, J. T., Bartlein, P. T., et al. (2004). Holocene thermal maximum in the western Arctic (0-180°W). Quat. Sci. Rev. 23 (5–6), 529–560. doi:10.1016/j.quascirev.2003.09.007
Kellogg, C. T. E., McClelland, J. W., Dunton, K. H., and Crump, B. C. (2019). Strong seasonality in Arctic estuarine microbial food webs. Front. Microbiol. 29, 189. doi:10.3389/fmicb.2019.02628
Krabbenhoft, A., Eisenhauer, A., Bohm, F., Vollstaedt, H., Fietzke, J., Liebetrau, V., et al. (2010). Constraining the marine strontium budget with natural strontium isotope fractionations (87Sr/86Sr*, d88/86Sr) of carbonates, hydrothermal solutions and river waters. Geochem. Cosmochim. Acta 74, 4097–4109. doi:10.1016/j.gca.2010.04.009
Lantuit, H., Overduin, P. P., Couture, N., Wetterich, S., Are, F., Atkinson, D., et al. (2012). The arctic coastal dynamics database: a new classification scheme and statistics on arctic Permafrost coastlines. Estuar. Coast 35 (2), 383–400. doi:10.1007/s12237-010-9362-6
Macdonald, G. M., Beilman, D. W., Kremenetski, K. V., Sheng, Y., Smith, L. C., and Velichko, A. A. (2006). Rapid early development of circumarctic Peatlands and atmospheric CH4 and CO2 variations. Science 314 (5797), 285–288. doi:10.1126/science.1131722
Manson, G. K., and Solomon, S. M. (2007). Past and future forcing of Beaufort sea coastal change. Atmos.-Ocean 45 (2), 107–122. doi:10.3137/ao.450204
McClelland, J. W., Holmes, R. M., Peterson, B. J., et al. (2016). Particulate organic carbon and nitrogen export from major Arctic rivers. Global Biogoechem Cycles 30, 629–643. doi:10.1002/2015GB005351
McClelland, J. W., Townsend-Small, A., Holmes, R. M., Pan, F., Stieglitz, M., Khosh, M., et al. (2014). River export of nutrients and organic matter from the North slope of Alaska to the Beaufort Sea. Water Resour. Res. 50, 1823–1839. doi:10.1002/2013WR014722
Meyer, H., Schirrmeister, L., Andreev, A., Wagner, D., Hubberten, H. W., Yoshikawa, K., et al. (2010). Late glacial and Holocene isotopic and environmental history of northern coastal Alaska—Results from a buried ice-wedge system at Barrow. Quat. Sci. Rev. 29, 3720–3735. doi:10.2204/iodp.sd.11.03.2011
Overeem, I., Anderson, R. S., Wobus, C. W., Clow, G. D., Urban, F. E., and Matell, N. (2011). Sea ice loss enhances wave action at the Arctic coast. Geophys. Res. Lett. 38, 127 doi:10.1029/2011GL048681
Peucker-Ehrenbrink, B., Miller, M. W., Arsouze, T., and Jeandel, C. (2010). Continental bedrock and riverine fluxes of strontium and neodymium isotopes to the oceans. G-cubed 11, 3. doi:10.1029/2009GC002869
Ping, C. L., Michaelson, G. J., Guo, L. D., Jorgenson, M. T., Kanevskiy, M., Shur, Y., et al. (2011). Soil carbon and material fluxes across the eroding Alaska Beaufort Sea coastline. J Geophys Res-Biogeo 116, G2. doi:10.1029/2010JG001588
Rawlinson, S. E. (1993). Surficial geology and morphology of the alaskan central arctic coastal Plain.Alaska Div. Geol. Geophys. Surv. Rep. Invest. 93. 1. doi:10.14509/2484
Romanovsky, V. E., Smith, S. L., and Christiansen, H. H. (2010). Permafrost thermal state in the Polar Northern hemisphere during the international Polar Year 2007-2009: a synthesis. Permafrost Periglac 21 (2), 106–116. doi:10.1002/ppp.689
van Everdingen, R.O. (Editor) (1998). Multi-language glossary of Permafrost and related ground-ice terms,” in International Permafrost Association (Calgary: The Arctic Institute of North America, University of Calgary).
Schuur, E. A., McGuire, A. D., Schädel, C., Grosse, G., Harden, J. W., Hayes, D. J., et al. (2015). Climate change and the permafrost carbon feedback. Nature 520 (7546), 171–179. doi:10.1038/nature14338
Stammerjohn, S., Massom, R., Rind, D., and Martinson, D. (2012). Regions of rapid sea ice change: an inter-hemispheric seasonal comparison. Geophys. Res. Lett. 39, 6. doi:10.1029/2012GL050874
Stein, R., and Macdonald, R. M. (2004). The organic carbon cycle in the Arctic Ocean. Berlin, UK: Springer.
Strauss, J., Schirrmeister, L., Grosse, G., Wetterich, S., Ulrich, M., Herzschuh, U., et al. (2013). The deep permafrost carbon pool of the Yedoma region in Siberia and Alaska. Geophys. Res. Lett. 40 (23), 6165–6170. doi:10.1002/2013gl058088
Tank, S. E., Manizza, M., Holmes, R. M., McClelland, J. W., and Peterson, B. J. (2012). The Processing and impact of dissolved riverine nitrogen in the Arctic Ocean. Estuar. Coast 35, 401–415. doi:10.1007/s12237-011-9417-3
Tanski, G., Couture, N., Lantuit, H., Eulenburg, E., and Fritz, M. (2016). Eroding permafrost coasts release low amounts of dissolved organic carbon (DOC) from ground ice into the nearshore zone of the Arctic Ocean. Global Biogeochem. Cycles 30 (7), 1054–1068. doi:10.1002/2015GB005337
Tanski, G., Wagner, D., Knoblauch, C., Fritz, M., Sachs, T., and Lantuit, H. (2019). Rapid CO2 release from eroding Permafrost in seawater. Geophys. Res. Lett. 46, 1047. doi:10.1029/2019GL084303
Tolstikhin, N. I., and Tolstikhin, O. N. (1974). in “Groundwater and surface water in the permafrost region” in General Permafrost Studies. Editors P.I. Melnikov, and O.N. Tolstikhin (Novosibirsk: U.S.S.R. Academy of Sciences)), 192–229.(In Russian.)
Urban, F. E., and Clow, G. D. (2018). GTN-P climate and active-layer data acquired in the National Petroleum Reserve–Alaska and the Arctic National Wildlife Refuge, 1998–2016, U.S. Geological Survey Data Series. 1092, 28. doi:10.3133/ds1092 [Supersedes USGS Data Series 1021]
Vonk, J. E., Sánchez-García, L., van Dongen, B. E., Alling, V., Kosmach, D., Charkin, A., et al. (2012). Activation of old carbon by erosion of coastal and subsea permafrost in Arctic Siberia. Nature 489 (7414), 137–140. doi:10.1038/nature11392
Keywords: coastal erosion, carbon flux, nitrogen flux, porewater chemistry, permafost, biogeochemistry, Alaskan Beaufort Sea
Citation: Bristol EM, Connolly CT, Lorenson TD, Richmond BM, Ilgen AG, Choens RC, Bull DL, Kanevskiy M, Iwahana G, Jones BM and McClelland JW (2021) Geochemistry of Coastal Permafrost and Erosion-Driven Organic Matter Fluxes to the Beaufort Sea Near Drew Point, Alaska. Front. Earth Sci. 8:598933. doi: 10.3389/feart.2020.598933
Received: 25 August 2020; Accepted: 19 November 2020;
Published: 08 January 2021.
Edited by:
Alexandra V. Turchyn, University of Cambridge, United KingdomReviewed by:
Laura Lapham, University of Maryland Center for Environmental Science (UMCES), United StatesCopyright © 2021 Bristol, Connolly, Lorenson, Richmond, Ilgen, Choens, Bull, Kanevskiy, Iwahana, Jones and McClelland. This is an open-access article distributed under the terms of the Creative Commons Attribution License (CC BY). The use, distribution or reproduction in other forums is permitted, provided the original author(s) and the copyright owner(s) are credited and that the original publication in this journal is cited, in accordance with accepted academic practice. No use, distribution or reproduction is permitted which does not comply with these terms.
*Correspondence: Emily M. Bristol, YnJpc3RvbEB1dGV4YXMuZWR1;
Disclaimer: All claims expressed in this article are solely those of the authors and do not necessarily represent those of their affiliated organizations, or those of the publisher, the editors and the reviewers. Any product that may be evaluated in this article or claim that may be made by its manufacturer is not guaranteed or endorsed by the publisher.
Research integrity at Frontiers
Learn more about the work of our research integrity team to safeguard the quality of each article we publish.