- 1Department of Ocean Engineering, University of Rhode Island, Narragansett, RI, United States
- 2British Geological Survey, Nottingham, United Kingdom
- 3Department of Earth Sciences, University College London, London, United Kingdom
The Mw 7.5 earthquake that struck Central Sulawesi, Indonesia, on September 28, 2018, was rapidly followed by coastal landslides and destructive tsunami waves within Palu Bay. Here, we present new tsunami modeling that supports a dual source mechanism from the supershear strike-slip earthquake and coastal landslides. Up until now the tsunami mechanism: earthquake, coastal landslides, or a combination of both, has remained controversial, because published research has been inconclusive; with some studies explaining most observations from the earthquake and others the landslides. Major challenges are the numerous different earthquake source models used in tsunami modeling, and that landslide mechanisms have been hypothetical. Here, we simulate tsunami generation using three published earthquake models, alone and in combination with seven coastal landslides identified in earlier work and confirmed by field and bathymetric evidence which, from video evidence, produced significant waves. To generate and propagate the tsunamis, we use a combination of two wave models, the 3D non-hydrostatic model NHWAVE and the 2D Boussinesq model FUNWAVE-TVD. Both models are nonlinear and address the physics of wave frequency dispersion critical in modeling tsunamis from landslides, which here, in NHWAVE are modeled as granular material. Our combined, earthquake and coastal landslide, simulations recreate all observed tsunami runups, except those in the southeast of Palu Bay where they were most elevated (10.5 m), as well as observations made in video recordings and at the Pantoloan Port tide gauge located within Palu Bay. With regard to the timing of tsunami impact on the coast, results from the dual landslide/earthquake sources, particularly those using the supershear earthquake models are in good agreement with reconstructed time series at most locations. Our new work shows that an additional tsunami mechanism is also necessary to explain the elevated tsunami observations in the southeast of Palu Bay. Using partial information from bathymetric surveys in this area we show that an additional, submarine landslide here, when simulated with the other coastal slides, and the supershear earthquake mechanism better explains the observations. This supports the need for future marine geology work in this area.
1 Introduction
On September 28, 2018 at 6:02:45 PM local time (10:02:45 AM UTC), a Mw 7.5 magnitude earthquake struck Central Sulawesi, Indonesia, with the epicenter located approximately 70 km north of the city of Palu (USGS, 2018) (Figure 1). The earthquake ruptured the Palu-Koro fault system, a predominantly strike-slip left-lateral fault (e.g., Socquet et al., 2019), along which large magnitude earthquakes have occurred in the past (Watkinson and Hall, 2017), two of which caused tsunamis in Palu Bay within the last century, in 1927 and 1968 (Prasetya et al., 2001). The 2018 rupture was supershear (Bao et al., 2019; Socquet et al., 2019; Fang et al., 2019) (i.e., it propagated faster along the fault than the local shear wave velocity), and the resulting ground motions caused widespread damage throughout the western Central Sulawesi region. Inland, the earthquake triggered landslides and induced considerable liquefaction that resulted in major destruction and numerous fatalities (Bradley et al., 2019; Watkinson and Hall, 2019; Miyajima et al., 2019). From eyewitness accounts and video evidence (Sassa and Takagawa, 2019), almost immediately after the earthquake, numerous coastal areas along Palu Bay experienced landslides (see locations of main ones marked LS- in Figure 1B), which were rapidly followed by destructive tsunami waves (Arikawa et al., 2018; Carvajal et al., 2019). The earthquake, ground liquefaction, landslides, and tsunamis resulted in 4,340 fatalities and approximately 68,500 buildings were damaged or destroyed (BNPB, 2019).
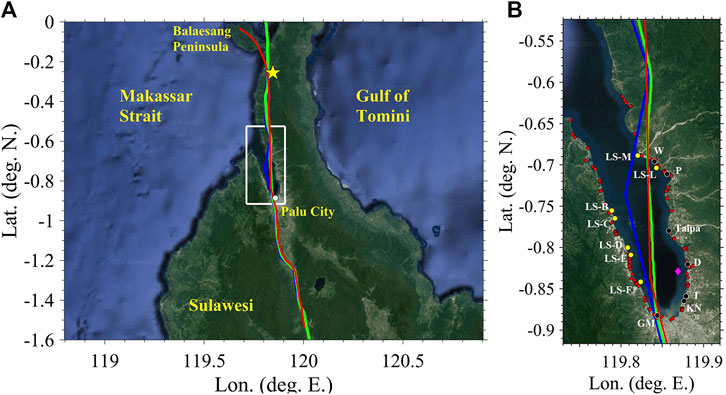
FIGURE 1. (A) Study area with base model grid (BG) over Palu Bay (white box), epicenter location (USGS, 2018, yellow star), and traces of local faults used in earthquake source models by: (blue) Jamelot et al. (2019), (red) Socquet et al. (2019), and (green) Ulrich et al. (2019); (B) Footprint of BG with locations of (red dots) measured runups (Pribadi et al., 2018; Mikami et al., 2019; Omira et al., 2019; Putra et al., 2019; Widiyanto et al., 2019) (black dots) surface elevation time series inferred from shore-based videos (Carvajal et al., 2019, GM, grand mall; KN, KN Hotel; T, Talise; D, Dupa; P, Pantoloan; W, Wani) (yellow dots) observed landslides, (diamond) location of aircraft at 10:04:33 UTC, that filmed coastal landslides (Figure 2).
Tsunami elevation time series were measured at two tide gauges, in the far-field at Mamuju (−2.66

FIGURE 2. Composite picture created from aircraft pilot video (Mafella, Supplementary Video S38 in Carvajal et al., 2019), showing waves generated by coastal landslides LS-B,C,D,E and F* (Figure 1B), at
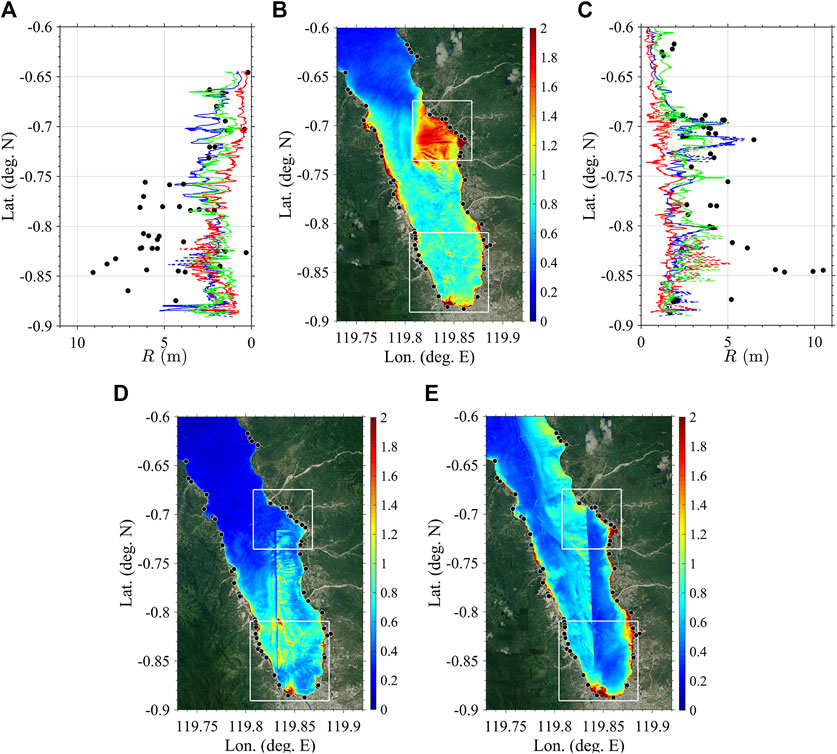
FIGURE 3. (A,C) Runups R (black dots) measured in Palu Bay by international teams (Pribadi et al., 2018; Mikami et al., 2019; Omira et al., 2019; Putra et al., 2019; Widiyanto et al., 2019) (black dots in (B,D,E)). Lines in (A,C) are runups simulated with FUNWAVE for three coseismic sources: (blue) Jamelot et al. (2019), (red) Socquet et al. (2019), and (green) Ulrich et al. (2019), in (—-) 30 m resolution BG, and (—) 7.5 m resolution EG/SG grids (white footprints in figures (B,D,E)). Maximum surface elevations computed with each source are color scales in: (B,D,E), respectively.
The only analogous recent events to 2018 Palu were Flores Island in 1992 and Gulf of Izmit in 1999. The Flores Island event was a shallow dipping thrust which triggered a coastal slide (Imamura et al., 1995), but there is no marine mapping to validate the slide size or volume. The Gulf of Izmit event is similar to Palu, with a strike-slip earthquake along the very active North Anatolian Fault, which triggered coastal landslides (Altinok et al., 2001). But again these landslides have not been mapped. This makes Palu an important event in that, for the first time, we have numerous tsunami data, including a comprehensive video data set, not only to fully investigate tsunami generation and coastal impact, but also to discriminate between the two, very different, source mechanisms, earthquake and landslide, and their contributions to tsunami hazard; and for the latter to confirm the importance of including dispersive effects in tsunami modeling. The improved understanding and modeling of the Palu event in this work can help identify, model, and more fully assess tsunami coastal hazards resulting from other similar tectonic environments.
Although there are now many tsunami simulations of the 2018 Palu event (e.g., Heidarzadeh et al., 2019; Takagi et al., 2019; Carvajal et al., 2019; Pakoksung et al., 2019; Gusman et al., 2019; Jamelot et al., 2019; Ulrich et al., 2019; Goda et al., 2019; Nakata et al., 2020; Sepúlveda et al., 2020; Liu et al., 2020, see summary of studies characteristics in Table 1), the tsunami mechanism, earthquake, coastal landslides, or both in combination, is still uncertain. In addition, whereas many published models simulate some, or even most, recorded runups around the Bay, the mechanisms are often ad hoc and do not reproduce the timing of tsunami waves from eyewitness accounts or the video evidence. Most coseismic tsunami sources (e.g., USGS, 2018; Socquet et al., 2019; Jamelot et al., 2019; Yolsal-Çevikbilen and Taymaz, 2019), are based on a primarily horizontal strike-slip earthquake mechanism, with limited vertical seabed motion (1–2 m). Theoretically, this should not be strongly tsunamigenic and should not, therefore, generate the elevated tsunami runups recorded from the south of the bay. There are many different interpretations of where the rupture is located under Palu Bay. In some earthquake models, the rupture crosses the bay as a simple, north-south, trending, connection (e.g., Socquet et al., 2019; Ulrich et al., 2019) (Figure 1B). In others, there is a change in direction under the bay (e.g., Jamelot et al., 2019) (Figure 1B), and some locate the rupture along the west coast (e.g., Song et al., 2019). When we completed our work, there was no resolution to these alternatives from the multibeam bathymetric data acquired by Frederik et al. (2019) in the deeper waters of the bay, because no seabed features had been identified as a possible rupture. Hence, to quantify the effect on tsunami impact of this epistemic uncertainty in earthquake rupture, we simulated three representative coseismic sources: 1) Jamelot et al. (2019) and 2) Socquet et al. (2019) who inferred parameters for 9 and 294 sub-faults, respectively, by assimilating remotely-sensed observations of ground motion, and 3) Ulrich et al. (2019), who modeled the supershear seabed deformation as a function of space and time. Note that the latter more advanced study predicted a 1.5 m maximum vertical seabed motion.
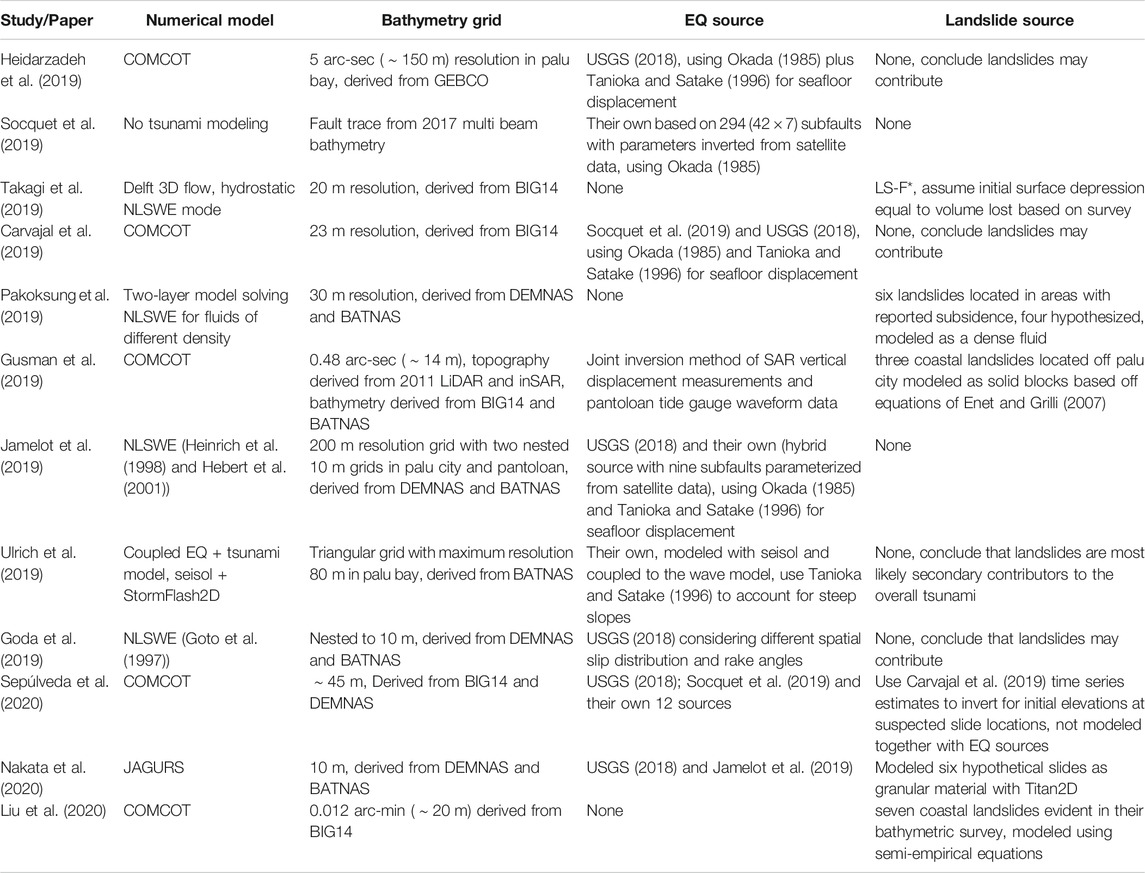
TABLE 1. Overview of main characteristics of earlier studies of the 2018 Palu event and tsunami modeling.
Other coseismic mechanisms, derived from geodetic observations, yield larger vertical seabed motions and, therefore, could be more tsunamigenic (e.g.,
Some have also argued (e.g., Ulrich et al., 2019) that the horizontal fault movement along the steep slope margins of Palu Bay resulted in an increased vertical water displacement causing elevated runups, in the manner proposed by Tanioka and Satake (1996). Hence, in our simulations of the three selected coseismic sources, we included this additional effect of enhanced vertical displacement as a function of the predicted horizontal fault movement.
The main challenge here, however, with the single earthquake mechanism, is that it cannot explain the timing of the tsunami impacts along the Bay from the coastal landslides reported in the survivor accounts and seen in video evidence, on land and in that captured by aircraft pilot Mafella flying over the bay shortly after the earthquake happened (Figure 2).
With regard to the landslide tsunami mechanisms published so far for 2018 Palu (Table 1), Takagi et al. (2019) used a simplified numerical model of a dual earthquake/landslide source, with a single landslide located in the southwest of Palu Bay, mapped by high-resolution multibeam echosounder (MBES), whose tsunami was identified in the aircraft pilot video (Figure 2). Their model suggested that shorter period waves generated by the coastal landslide were followed by longer period waves from the earthquake. Pakoksung et al. (2019), Nakata et al. (2020), and Sepúlveda et al. (2020) identified and modeled landslides as the most important, if not the principal, contributors to the tsunami. Their landslide parameters and corresponding wave generation, however, were hypothetical and selected to match observations. To date, only Liu et al. (2020) modeled landslide tsunamis from mapped landslide locations, but they: 1) did not model the tsunami generation from the landslides directly, using instead semi-empirical sources, and 2) did not simulate an additional earthquake mechanism. Finally all the landslide modeling studies to date simulated tsunami propagation with a non-dispersive model, which, as we will show, affected results.
Here, for the first time, we demonstrate that to explain the tsunami observations in Palu Bay requires simultaneously modeling both coseismic and landslide sources. We simulate the three coseismic sources discussed above (Jamelot et al., 2019; Socquet et al., 2019; Ulrich et al., 2019), the mapped (rather than hypothetical) landslides (Liu et al., 2020; Takagi et al., 2019), and dual source combinations of these, using numerical models that include frequency dispersion effects (Shi et al., 2012; Ma et al., 2012). We show that dispersion affects the shorter wavelength landslide tsunamis propagating into the deeper waters in the center of Palu Bay. We simulate the landslides as deforming granular material, with their tsunami generation, using the 3D physics-based numerical model of Ma et al. (2015). We use finer model grids and higher resolution bathymetric and topographic data in Palu Bay (Figure 1) than in earlier work. We compare the results to a more comprehensive database of post-tsunami field survey results, including runups, tsunami elevations at the Pantoloan Port tide gauge together with those inferred at other locations from a novel analysis of the tsunami videos (Carvajal et al., 2019). From tsunami timing information in the aircraft pilot and other videos, we infer that there was a short delay in the triggering of the landslides by the earthquake, that we use in modeling and show that this improves the agreement with observations.
In Section 2, we detail and analyze tsunami observations, present the modeling methodology and data used to define tsunami sources and bathymetry/topography in model grids. In Section 3, we present model results for coseismic, landslide, and combined earthquake/landslide tsunami simulations. Finally, in Section 4 we discuss the results and offer conclusions and perspectives for future work.
2 Materials and Methods
2.1 Tsunami Observations
In the following, we define
2.1.1 Tide Gauge Data
Two operational tide gauges recorded apparent tsunami signals for the 2018 Palu event: 1) in Mamuju (−2.66
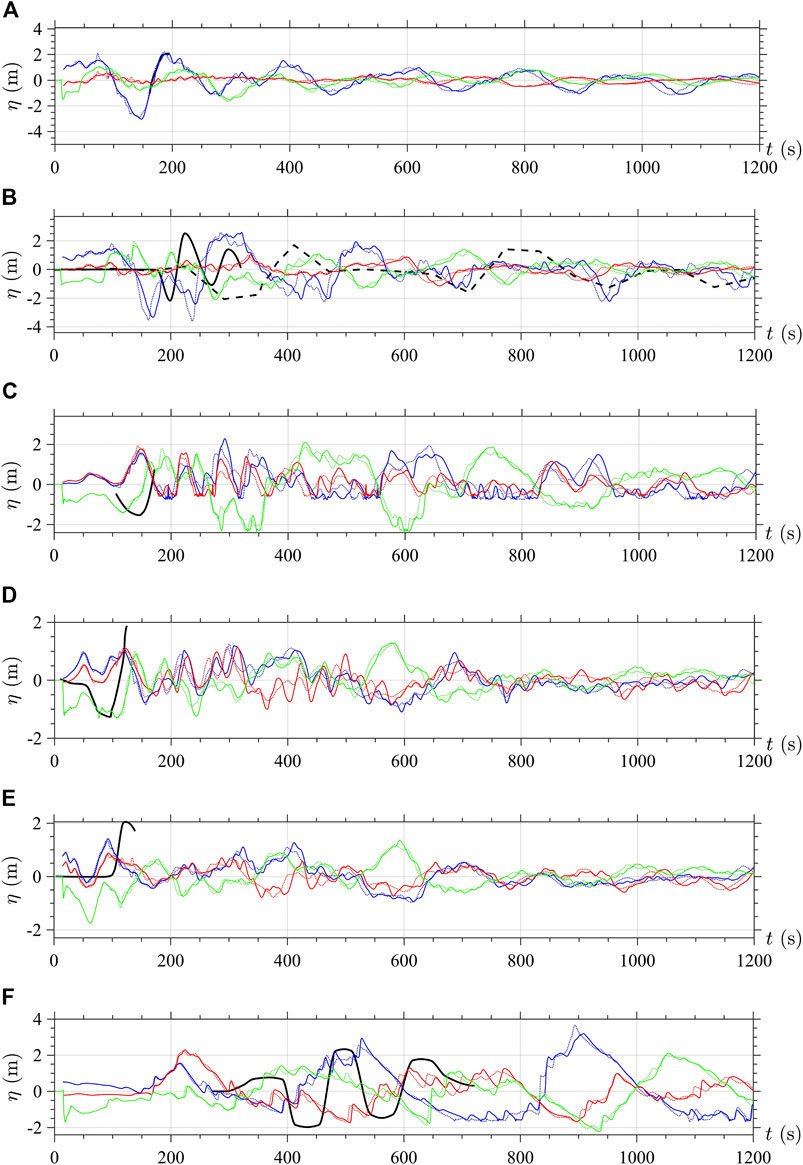
FIGURE 4. Time series of surface elevation for 2018 Palu tsunami (—-) inferred from shore-based videos (Carvajal et al., 2019) at: (A) Wani dock (−0.6933
2.1.2 Video Analysis Overview
Carvajal et al. (2019) compiled and analyzed 41 amateur (taken with mobile phones) and CCTV videos that were taken around the bay during the earthquake and tsunami inundation. Based on the shore-based videos, they estimated surface elevation time series at six locations (Figures 4A–F): Wani, Pantoloan, Dupa, Talise, the KN Hotel, and the Palu Grand Mall, all marked in Figure 1B. They discuss uncertainties in time series reconstructed from the CCTV videos and point out that while these are larger on surface elevation, due to the time stamp in the videos, phase information is quite good at all locations. This large video archive provided overwhelming evidence of tsunamis generated by coastal landslides (see https://agsweb.ucsd.edu/tsunami/2018-09-28_palu/carvajal_2019_videos_palu/). Most notably, a video of landslide tsunami generation on the western side of the bay was taken by Batik Airways pilot Ricoseta Mafella, at approximately 10:04:33 UTC, i.e.,
Sunny et al. (2019) analyzed the waves generated on the western side of the bay at locations LS-D, -E, and -F* (Figure 1B), seen in the pilot Supplementary Video S38, using Google Earth to match camera viewing angles, and compared the observed wave measurements to dimensions of known objects. They estimated the widths of the sharp crescent waves to be 343 and 461 m, and the elevations (trough-to-crest) to be 24.1 m and 28.9 m at locations LS-D and -E, respectively (Figure 1B). Based on the boat Supplementary Video S39, they estimated that at location -F*, the splash of the outgoing wave was 28.4 m high, and the elevation of the unbroken outgoing wave traveling toward the Boat location was 8.2 m. These estimated wave heights are all much greater than the initial values, on the order of 2–10 m, predicted by Liu et al. (2020) using semi-empirical methods for the landslide tsunami waves generated at these locations.
2.1.3 Timing and Wave Sequence Analyses Based on Videos and Supershear Velocities
The combination of video evidence and supershear earthquake travel time can be used to estimate the time after rupture initiation that ground shaking began at various locations around Palu Bay.
CCTV footage at a house in Wani, in the northern section of the bay (Supplementary Videos S7,S8 in Carvajal et al. (2019); −0.6935
From Pilot Ricoseta Mafella’s flight log (personal communication), his aircraft, a large size passenger jet, began taking off at 10:02:40 UTC on the 2,500 m long runway 33 of Mutiara SIS Al-Jufrie Airport (PLW), located southeast of Palu Bay. In a social media post, the pilot wrote: “I felt something wrong on the runway during takeoff roll.” The airport is
Based on the consistent travel times and modeling estimates for the beginning of ground motion, we conclude that all locations within the bay most likely started shaking at
Observations made by Carvajal et al. (2019) on their archived videos are analyzed in the following, and their time series of surface elevation estimated at various locations are plotted in Figure 4:
• Supplementary Videos S7,S8 show a positive elevation wave striking the house in Wani at
• Supplementary Video S11, taken in nearby Pantoloan Port by a CCTV camera looking toward a crane on the dock (−0.7106
• In Supplementary Videos S29–S31, taken in Taipa (−0.7794
• Supplementary Video S14, at Dupa (−0.8204
• In Supplementary Video S13, at Talise (−0.8589
• Six CCTV cameras were operated at the KN Hotel (−0.8650
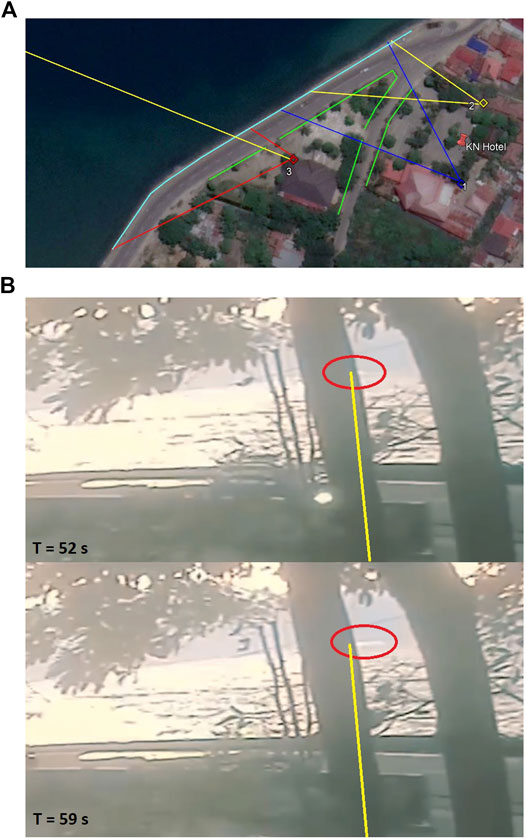
FIGURE 5. Locations and video frames taken during tsunami impact by CCTV cameras at the KN Hotel (KN in (Figure 1B)). (A) Trace of three camera view angles corresponding to Carvajal et al. (2019)’s videos (blue) 1, (yellow) 2, and (red) 3. Cyan line marks seawall location, other green lines mark location of knee to chest high wall visible in videos. Yellow line pointing away from camera three corresponds to view shown in (B). (B) Images from Supplementary Video S3 at
• Finally, many videos were made from various floors of a parking structure in Palu Grand Mall (−0.8836
2.1.4 Post-tsunami Surveys
Bathymetry: Bathymetries acquired after the 2018 event were published by Takagi et al. (2019), Frederik et al. (2019), and Liu et al. (2020), who compared them to various pre-event data (see details in references). Takagi et al. (2019) surveyed a few square kilometers offshore of the Buluri landslide site LS-F* (Figures 1B, 2; see http://www.ide.titech.ac.jp/ takagi/file/2014_bathymetry_Figure 3A_in_paper_Landslides.dat and http://www.ide.titech.ac.jp/ takagi/file/2018_bathymetry_Figure 3B_in_paper_Landslides.dat; urls in their paper wrongly included a period or space after the word “Fig”). They estimated an approximate landslide volume of
In this work, we studied and modeled a subset of the coastal landslides clearly identified by Liu et al. (2020), labeled LS-B,-C,-D,-E,-F*,-L, and -M in Figure 1B (Table 2), for which video evidence confirmed that wave generation occurred, using dimensions and volumes adapted from Liu et al. (2020). For this reason, with the exception of landslide F*, for which we used data provided by Takagi et al. (2019), we used the same labeling scheme as in Liu et al. (2020).
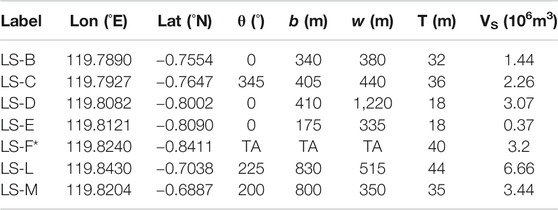
TABLE 2. Parameters used to model coastal landslides in NHWAVE at their estimated unfailed location (Figure 1B): azimuth angle θ (from N), down-slope length b, cross-slope width w, and maximum thickness T (assuming an elliptical footprint b by w and a quasi-Gaussian shape for the slide), volume . Lat./Lon. define slide center of mass initial location (See Schambach et al. (2019)’s appendix for parameter definition and sketch.) Data was adapted from Liu et al. (2020), except LS-F* for which actual landslide geometry was used in model based on Takagi et al. (2019)’s survey (TA). For the dual sources, these SMFs are modeled with NHWAVE, and then FUNWAVE, in combination with each of three coseismic sources by Jamelot et al. (2019), Socquet et al. (2019), and Ulrich et al. (2019) (Figure 8).
Tsunami Coastal Impact: Post-tsunami surveys were conducted by various international teams, in which flow depth and runup (Figure 1B) were measured around Palu Bay. Figure 3 shows runup values by: 1) Pribadi et al. (2018), 26 runups corrected to MSL, measured September 29–October 6, 2018 and October 10–17, 2018; 2) Putra et al. (2019), six runups referenced to MSL, measured October 8–18, 2018; 3) Widiyanto et al. (2019), 28 runups corrected to MSL, measured October 11–19, 2018; 4) Mikami et al. (2019), six runups corrected to tide level during earthquake (+1 m MSL), measured October 27–31, 2018; and 5) Omira et al. (2019), 55 runups corrected to tide level during earthquake, measured November 7–11, 2018. Here, we only compare simulation results to the measured runups, however, flow depth measurements were also reported by Arikawa et al. (2018), Cipta et al. (2018), Paulik et al. (2019), and Syamsidik et al. (2019). Runups referenced to MSL were transformed to MSL +1 m, to account for the tide elevation at the time of the tsunami.
2.2 Materials and Methods
We numerically simulate the 2018 Palu tsunami generation and propagation from earthquake or landslide sources, and the two in combination. We follow a methodology similar to that used in recent work by the authors and collaborators for other dual earthquake/landslide mechanisms (e.g., Tappin et al., 2014; Grilli et al., 2015; Grilli et al., 2017; Grilli et al., 2019; Schambach et al., 2019; Schambach et al., 2020). Using the best available bathymetric/topographic data, together with higher resolution computational grids than used in previous studies, we apply two state-of-the-art dispersive wave models: 1) the 3D non-hydrostatic wave model NHWAVE (Ma et al., 2012), with an underlying slide layer (Ma et al., 2015; Kirby et al., 2016), to simulate both the landslide motion and related tsunami generation, and 2) the 2D fully nonlinear Boussinesq wave model FUNWAVE-TVD (Shi et al., 2012) to simulate the propagation to the far-field and the coast of the superposition of landslide and coseismic tsunamis (or each individually), in nested grids of increasing resolution toward the shore. The grid data and modeling methodology are detailed next.
2.2.1 Study Area, Computational Grids, and Bathymetric/Topographic Data
The study area encompasses Palu Bay (Figure 1), which is approximately 30 km long by 7.25 km wide with depths reaching up to
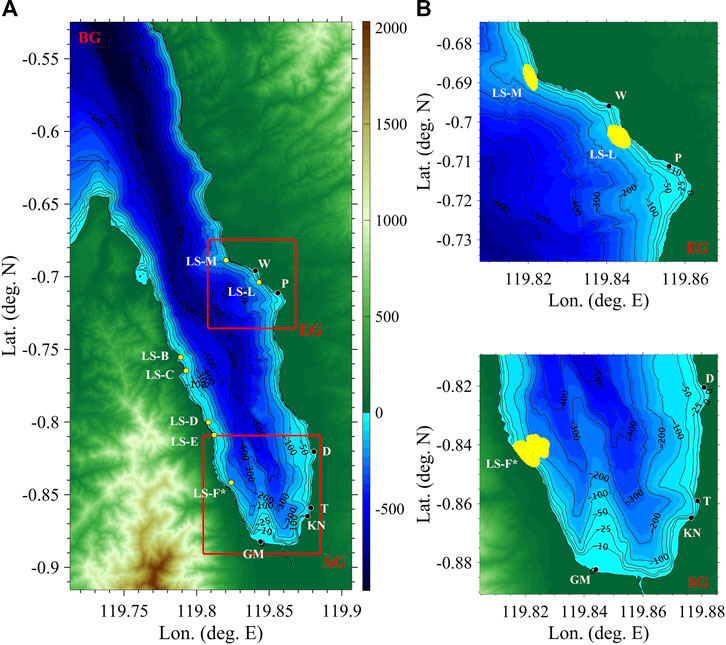
FIGURE 6. (A) base computational grid (BG; 30 m resolution Cartesian, center at (−0.720
Three Cartesian computational grids are used in tsunami simulations (Figure 6; listed grid center coordinates are used as Mercator transverse geographic projection origin). The 30 m resolution base grid BG covers Palu Bay (Figure 1) and is used in FUNWAVE and NHWAVE simulations; the NHWAVE BG grid also includes five boundary fitted, equally-spaced, layers in the vertical direction (from ocean surface to seabed). Two 7.5 m resolution grids are nested within BG, and used in FUNWAVE to more accurately model tsunami coastal impact in two areas of particular interest: 1) in the south of the bay, south grid SG includes the observation points of Grand Mall, KN Hotel, Taipa and Dupa; and 2) near and around Pantoloan, east grid EG includes the observation points of Wani and Pantoloan (Figure 1B).
A variety of bathymetric and topographic data sets have been used in earlier modeling studies of this event. Here we similarly combine and interpolate onto our grids the best available bathymetric and topographic data to date for our study area. The resulting bathymetry and topography are shown in Figure 6. As an overall coarser data set, the earlier study of Heidarzadeh et al. (2019) used the General Bathymetric Chart of the Oceans 2014 (GEBCO14; Weatherall et al., 2015), which has a horizontal resolution of 30 arc-sec (
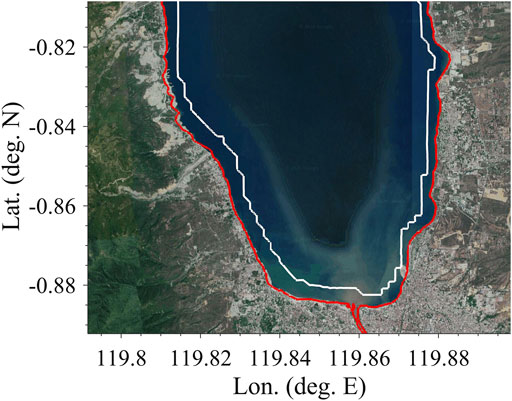
FIGURE 7. Indonesian Geospatial Information Agency (BIG) six arc-sec bathymetric BATNAS dataset coastline (white line) plotted in the area of grid SG, with overlaid georeferenced satellite image from Google EarthTM, showing the discrepancy between the BATNAS coastline and the actual coastline. Red line shows the coastline inferred from the combination of the DEMNAS and BIG14 datasets, in good agreement with the actual coastline.
Thus, in our computational grids, we interpolated the deepwater bathymetry of Frederik et al. (2019) with the shallow water bathymetry from the BIG14 contours, and the topography from DEMNAS, after referencing them all to the same MSL +1 m vertical datum. To avoid numerical instabilities caused by slight discontinuities in bathymetry from combining different datasets, we applied a 2D Gaussian smoothing filter with a standard deviation of 1. The resulting bathymetry and topography are shown in Figure 6.
2.2.2 Numerical Models and Tsunami Modeling Methodology
Landslide tsunamis The 3D non-hydrostatic model NHWAVE is used to simulate initial wave generation and propagation for deforming submarine/subaerial slides, represented by a bottom layer of granular material (debris flow) (Ma et al., 2012; Ma et al., 2015), which was supported by various observations in Palu (e.g. Liu et al., 2020). Euler equations are solved in the water, in a horizontal Cartesian grid
NHWAVE was extensively validated for a variety of tsunami benchmarks (Zhang et al., 2017), including laboratory experiments for slides made of glass beads performed by some of the authors (Grilli et al., 2017). The model was also used to simulate historical case studies, for which tsunami coastal impact had been measured (Tappin et al., 2014; Grilli et al., 2019; Schambach et al., 2020). In the latter cases, the initial unfailed landslide geometry is first recreated by moving the failed landslide material upslope. The model then simulates both the down-slope motion of the failing slide, coupled to that of the overlying water. For all benchmarks or actual events, NHWAVE was found to perform well and to adequately reproduce the reference data, provided the discretization was sufficient.
In the present simulations, except for slide LS-F* for which we use the actual mapped slide geometry, as in earlier work (e.g., Enet and Grilli, 2007; Grilli et al., 2015; Schambach et al., 2019), the initial slide geometry is modeled at its unfailed location as a sediment mound of quasi-Gaussian cross-sections, with maximum thickness T, and an elliptical footprint of down-slope length b and cross-slope width w; with these definitions, the slide volume is calculated as,
Based on the shear wave travel time from the earthquake epicenter to Palu Bay discussed above (on the order of 10–15 s), all the landslides should have been affected by ground shaking within seconds of each other; hence, they are all assumed to fail at the same time in the model. However, there was a delay between the first instance of ground shaking due to seismic waves and the actual landslide initiation of motion, likely because complete failure required a sufficient built-up of excess pore pressure (and perhaps some liquefaction) in the submerged toe of the slide material (e.g., Tappin et al., 2008). This delay was estimated to
On this basis, the generation of landslide tsunamis and their initial propagation up to
Coseismic or dual landslide/coseismic tsunamis Three different coseismic tsunami sources are simulated in grid BG for the 2018 Palu event. Two are modeled for
FUNWAVE has been extensively validated in various wave propagation and coastal inundation studies (e.g., Shi et al., 2012), including for tsunami inundation/runup and coastal velocity benchmarks (Horrillo et al., 2015; Lynett et al., 2017), and applied to tsunami case studies, both historical and hypothetical (e.g. Tappin et al., 2014; Grilli et al., 2015; Grilli et al., 2019; Schambach et al., 2019; Schambach et al., 2020).
For all cases simulated here, landslide or coseismic tsunamis alone, or dual sources, FUNWAVE simulations are performed by one-way coupling in the 2-level nested Cartesian grids (Figure 6) BG (30 m resolution) and EG/SG (7.5 m resolution; see the earlier studies for details). To prevent reflection at open boundaries, 1800/4,200 m wide sponge layers are specified along the western/northern boundaries of grid BG. Inundation and runup are modeled along coastal boundaries by way of a moving shoreline algorithm, with dissipation by wave breaking and bottom friction being simulated in FUNWAVE (Shi et al., 2012); here, a bottom friction coefficient
As discussed in the introduction, all published studies of 2018 Palu to date used non-dispersive tsunami propagation models (Table 1). However, earlier work has shown the importance of frequency dispersion when modeling landslide tsunami generation and propagation, particularly when the initial slide footprint, and hence initial wavelength, are small compared to depth (e.g., Ma et al., 2012; Schambach et al., 2019). Here, we use dispersive models (NHWAVE and FUNWAVE) and, to assess the importance of dispersive effects, we run some simulations by turning off dispersion terms in the models (results are detailed later). In Palu Bay, while landslide tsunami waves generated in very shallow water may not initially be significantly dispersive, dispersion would become larger once waves propagated into the much deeper water of the center of the bay. Dispersion affects both phase speed and wave-wave interactions during propagation and, ultimately, tsunami coastal impact. Additionally, close to shore, dispersion may create undular bores (a.k.a. dispersive shock waves) near the crest and trough of longer shoaling tsunami waves, enhancing coastal impact (e.g., Madsen et al., 2008). This was demonstrated by Schambach et al. (2019) who also showed that higher resolution nearshore grids must be used to capture undular bores in FUNWAVE, which is one of the reasons here for using the 7.5 m grids EG and SG, even though the bathymetric data was not available at that level of detail; but, wave physics may call for it.
2.2.3 Earthquake Source Models
As there is no consensus on the 2018 Palu earthquake parameters, which fault(s) was(were) responsible, and how the rupture proceeded, to assess the source-related epistemic uncertainty in tsunami simulations, we modeled three representative earthquake sources, whose main characteristics are summarized in Table 1.
The first two sources use multiple subfaults whose parameters (depth, dimension, angles) were optimized, using Okada (1985)’s method, to best match observed onland displacements inferred from pre- and post-earthquake satellite observations, while satisfying the M7.5 centroid moment tensor. Jamelot et al. (2019) thus define nine subfaults with specified length and strike, and use displacements derived from Sentinel-2 satellite images to optimize other parameters. Socquet et al. (2019) use 294 subfaults (42 in the strike direction and seven in the dip direction), and displacements inferred from Sentinel-2 and Landsat-8 satellite images, as well as SAR interferograms from ALOS-2 satellite data to optimize fault parameters. For these two sources, we computed the maximum seafloor deformation with Okada (1985)’s model and used it as initial surface elevation in FUNWAVE (with no initial velocity). As some studies indicated that effects of steep shores might have been important (Carvajal et al., 2019; Heidarzadeh et al., 2019; Jamelot et al., 2019; Ulrich et al., 2019), we computed the additional vertical displacements due to horizontal displacements using Tanioka and Satake (1996)’s method. Assuming a supershear rupture, we specified the initial time for these surface elevations in FUNWAVE to
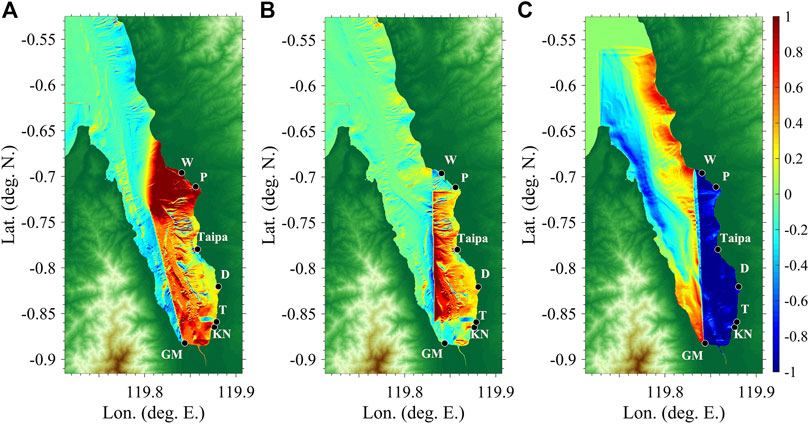
FIGURE 8. Maximum seabed uplift/subsidence computed for 2018 Palu Mw 7.5 coseismic sources, (A,B) with Okada (1985)’s method or (C) from instantaneous deformation computed through space-time modeling, all corrected to include horizontal motion effects for steep bottom slopes (Tanioka and Satake, 1996): (A)Jamelot et al. (2019), (B)Socquet et al. (2019), and (C)Ulrich et al. (2019). For sources (A,B), seabed motions are specified in FUNWAVE as static surface elevations at
The third source by Ulrich et al. (2019) was developed from physics-based modeling of the earthquake failure in space and time using Seisol, which solves elastodynamic wave equations for spontaneous dynamic ruptures and seismic wave propagation (Dumbser and Käser, 2006; Pelties et al., 2014; Uphoff et al., 2017). Model inputs included geometry and frictional strength of the fault, tectonic stress state, and regional lithological structure, which were determined from datasets specific to the Palu region. Based on the authors’ results for the horizontal and vertical ground motions (provided every 0.5 s for 50 s over a dense grid), we created time-series of seabed motion, which were used as bottom boundary conditions over grid BG in NHWAVE. As with the other sources, contributions to vertical displacement due to the horizontal movement of steep slopes were included. Simulations of tsunami generation/propagation were done in 3D with NHWAVE up to
3 Results
Simulations were performed with NHWAVE and FUNWAVE following the methodology detailed above, by considering first each of the three coseismic sources (Figure 8), then the seven parameterized landslide sources (Table 2), and finally for dual earthquake/landslide sources combining each coseismic source with all the landslide sources. Simulations for earthquake or landslide sources alone were performed with or without dispersive effects in the models. All simulations were performed up to
Similar results were computed for each type of simulation: 1) the envelope of maximum surface elevations over the study area and runups along the Palu Bay coastline, to be compared with measurements from field surveys (Pribadi et al., 2018; Mikami et al., 2019; Omira et al., 2019; Putra et al., 2019; Widiyanto et al., 2019), in Figures 3,9,11, for the coseismic, landslide, and dual sources, respectively (runups computed in both the coarser BG and finer SG/EG grids are provided, whereas envelopes are computed using the finer resolution results, wherever available); and 2) time series of surface elevations computed at locations where various observations or measurements were made or inferred, i.e., Wani, Pantoloan, Dupa, Talise, KN Hotel, and Grand Mall (Figure 1B), in Figures 4,10,12, respectively.
Animations of tsunami propagation simulations for: 1) coseismic sources alone (video2.mp4, video5.mp4, and video6.mp4); 2) landslide sources alone (video4.mp4); and 3) dual coseismic/landslide sources for the Ulrich case (video1.mp4) are given in supplementary material, together with an animation of the slide LS-F* and its corresponding wave generation (video3.mp4).
First, regarding the effects of grid resolution, Figures 3,9,11 show that for all types of sources the largest runups simulated in the finer grids (EG/SG) are larger than in the coarser grid (BG), which justifies using nested grids in FUNWAVE. Then, regarding dispersion, for coseismic tsunamis, time series of surface elevation in Figure 4 show that dispersion causes only small absolute changes in wave elevation (mostly near the crests), at most times and locations, compared to non-dispersive simulations. This is expected for the longer coseismic tsunami waves; nevertheless, relative differences between the two simulations can be 25–35% at some times/locations. In contrast, for landslide tsunamis, Figure 10 shows that dispersion causes much larger absolute or relative differences in surface elevations, and larger phase shifts. This is also expected, based on earlier work (e.g., Glimsdal et al., 2013; Schambach et al., 2019), for shorter landslide tsunami waves, particularly considering the large depth of the bay. These results justify using dispersive wave models in this work.
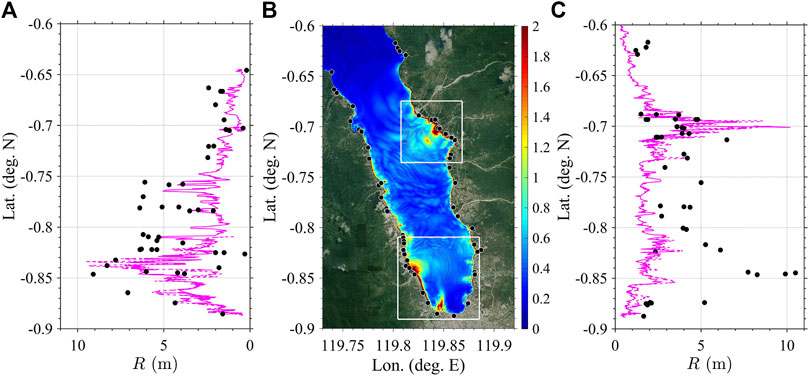
FIGURE 9. (A,C) Runups R simulated with NHWAVE/FUNWAVE for landslide sources only (Table 2), compared with field measurements (see Figure 3 for definitions). Landslide tsunami generation is first simulated with NHWAVE in grid BG (figure footprint) up to
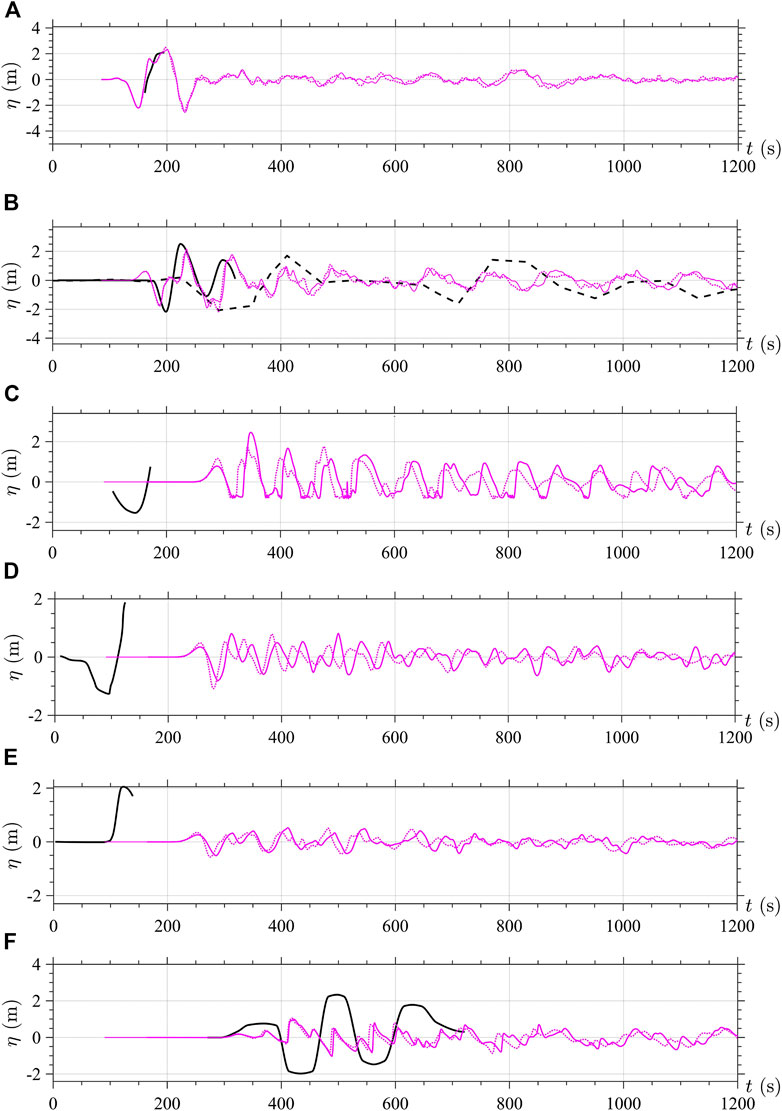
FIGURE 10. (A-F) Similar results as in Figure 4 (same vertical scale kept in figures for comparison), but for simulations with NHWAVE/FUNWAVE of landslide sources only (Table 2). Simulation results include a landslide trigger delay of
For coseismic sources alone, Figure 3 shows a similar trend for runups predicted around Palu Bay, but with large absolute differences; in particular runups are in general lower for the Socquet et al. (2019) source. All three sources, however, significantly underpredict runups observed in the southern part of the bay (south of
For the landslide sources alone, Figure 9 shows that observed runups are well predicted in the SW part of Palu Bay, particularly in the area of the largest landslide sources (LS-E, LS-F*). However, a few of the largest observed runups are still underpredicted in the area of Dupa on the SE of the Bay (around
Results of the dual earthquake/landslide source simulations (Figure 11) are consistent with the above observations. In all cases, but particularly for the combination of Ulrich et al. (2019)’s with the landslide sources, the observed runups on the entire west side of the bay are well simulated at most locations, and this is also the case on the east side of the bay, except for the area around Dupa where another local source of waves is required, perhaps from another landslide not yet identified in this region, as pointed out in some other studies (e.g., Liu et al., 2020). In the time series results of Figure 12, we see a good agreement between the dual source simulations with the reconstructed time series at Wani and Pantoloan, particularly when using Ulrich et al. (2019)’s or Socquet et al. (2019)’s source together with the landslides. A reasonable agreement is also found in the SE of the bay, in Dupa and Talise, when combining the landslides and Ulrich et al. (2019)’s source. At the KN Hotel, however, in the same area, none of the simulations agree well with the short reconstructed time series. Finally, at Grand Mall, in view of the uncertainty (and fairly arbitrary manner) of reconstructing the observed time series, one could argue that combining the landslide sources with Ulrich et al. (2019)’s coseismic source also provides a reasonable agreement with observations, at least in amplitude and, more or less, in phase.
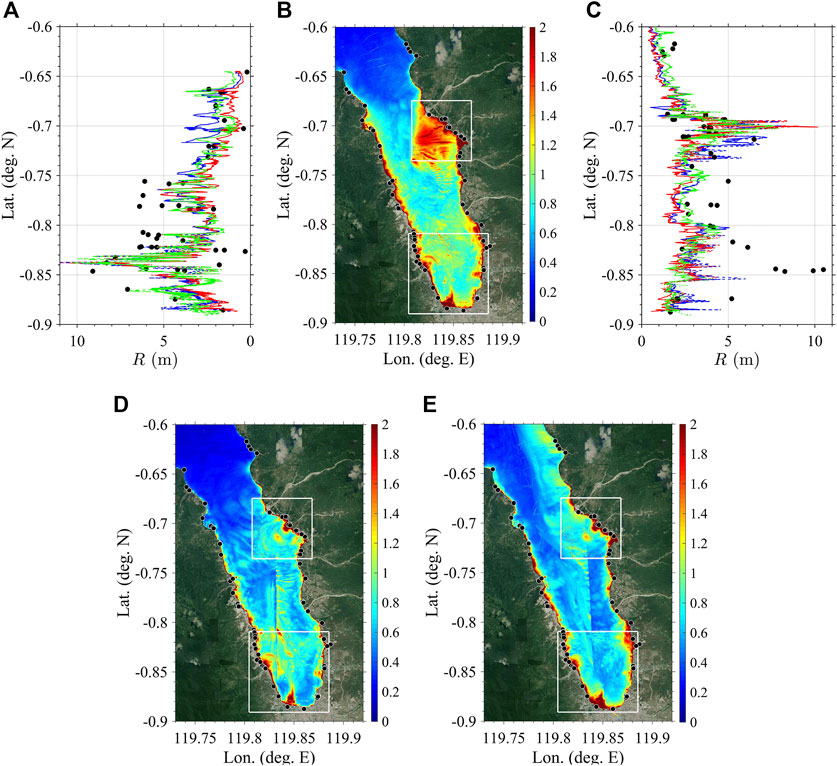
FIGURE 11. (A,C) Runups R simulated with NHWAVE/FUNWAVE for dual earthquake/landslide (Table 2) sources, compared with field measurements (see Figure 3 for definitions of data, three coseismic sources, line colors and types). Landslide tsunami generation is first simulated with NHWAVE in grid BG (figure footprint) up to
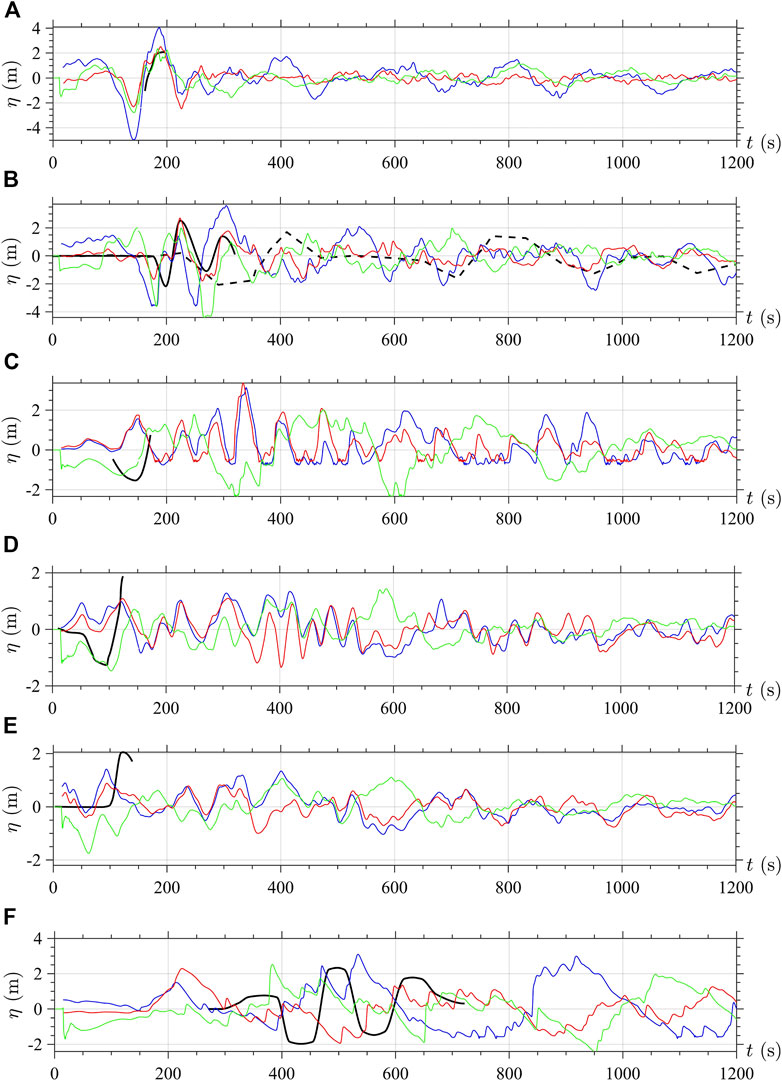
FIGURE 12. (A-F) Similar results as in Figures 4, 10 (same vertical scale kept in figures for comparison), for simulations with NHWAVE/FUNWAVE of combined (dual) coseismic/landslide (Table 2) sources. See Figure 4 caption for definition of coseismic sources. All results are computed here with dispersion turned on.
4 Discussion
Our work here shows that for the 2018 Palu event, a combination of earthquake and coastal landslides generated the tsunami. We also show that mapped (rather than hypothetical) landslides were critical in achieving this result. Video evidence was also instrumental in differentiating between the two possible mechanisms, especially at Pantoloan, where the tide gauge data used to validate previously published numerical models, was found to be partly misleading because it filtered out the high frequency landslide tsunami waves. To confirm this, we applied to the model results of Figure 12B a 30 s moving average and 1 min downsampling similar to that of the tide gauge (Sepúlveda et al., 2020). Supplementary Figure S2 (in supplementary Data Sheet 1) shows that this eliminates shorter waves from the time series, such as caused by the landslides or seen in the video recording near Pantoloan dock. Additionally, the filtered results based on Ulrich et al. (2019)’s dual source agree well with the first few waves in the tide gauge record, although amplitudes are smaller.
Our simulations of published earthquake sources (Jamelot et al., 2019; Socquet et al., 2019; Ulrich et al., 2019) show the epistemic uncertainty associated with modeling the coseismic tsunami. While the initial surface elevation from each coseismic source is quite different (Figure 8), the generated tsunamis all reproduce the runups observed in the northern section of the bay, but underpredict the larger runups in the south. Without a comparison of pre- and post- earthquake leveling data, it is not clear which, if any, of the earthquake models is most appropriate. The recent work by Natawidjaja et al. (2020), published too late to include for consideration here, re-interpreted Frederik et al. (2019)’s multibeam bathymetry and identified the major, meandering, submarine channel in the center of Palu Bay, as the seabed expression of the 2018 movement of the strike-slip fault. Based on this study, the fault could be considered to be more effective in tsunami generation than previously proposed. Several aspects of their model, however, lead us to conclude that further justification is required before it can be accepted as a viable alternative to those already published: 1) it is so very different to previously published interpretations based on the same datasets (Frederik et al., 2019; Liu et al., 2020); 2) interpretations of several meters of vertical seabed movement in the context of the resolution of Frederik et al. (2019)’s bathymetry (
In the southwest, the large runups observed just onshore of confirmed coastal landslides stress the importance of simulating landslide tsunamis. In this context, using a dispersive numerical tsunami model was particularly important for accurately propagating the shorter wavelength landslide tsunami waves. Here, Liu et al. (2020)’s shallow water bathymetric survey was critical in parameterizing the numerous coastal landslides. The detailed surveying of slide LS-F* by Takagi et al. (2019), where large wave generation was observed (see Figure 2), provided additional information. These authors were the first to identify these landslide tsunami mechanisms upon which we built our more complex and comprehensive model. The videos were instrumental in allowing us to identify a landslide trigger delay of 75 s, with the pilot video and time series of surface elevation at Wani and Pantoloan (Figures 10A,B) providing key evidence. The mapped landslildes we used in our modeling are found to be capable of generating runups on the same order as those observed onshore of their locations and their reconstructed time series impact, with good agreement at most locations. One exception is in the southeast of the bay, where runups are still underpredicted in the Dupa area (simulated 2–4 m, vs observed 8–10.5 m). At the Grand Mall, wave arrival matches that observed, however, the amplitudes are not as large.
To explain the large runups observed in the SE of the bay, Nakata et al. (2020) modeled a large 700
Nevertheless, to test this hypothesis, we modeled a SMF at Nakata et al. (2020)’s location (i.e., 119.8675
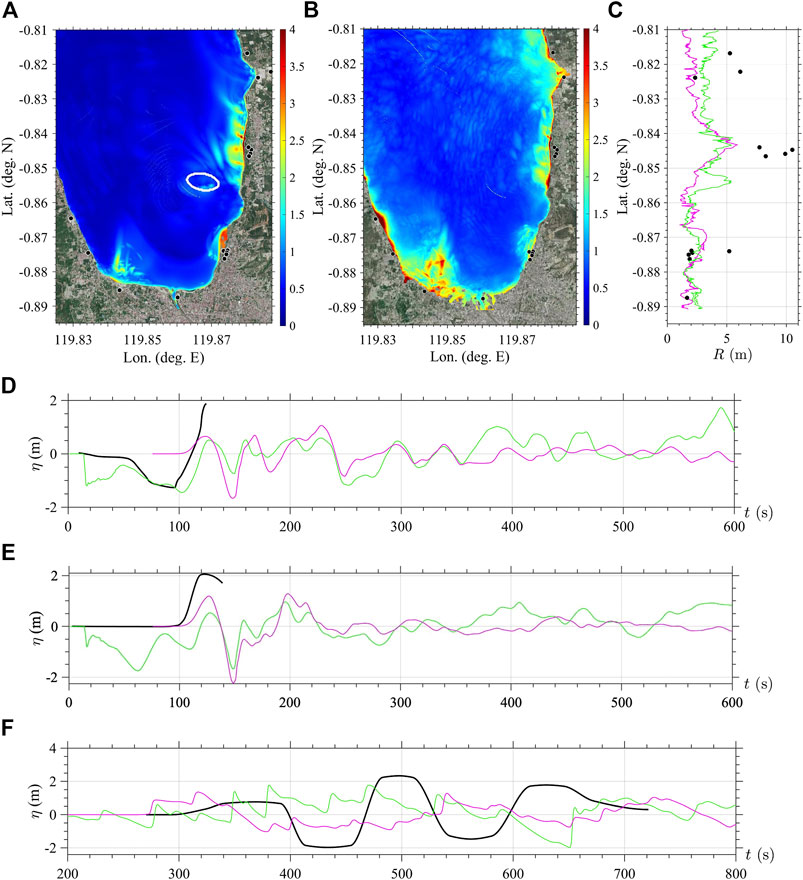
FIGURE 13. (A,B) Maximum surface elevation and (C) Runups simulated for (A and magenta in C) hypothetical SE SMF with footprint marked as white ellipse in (A), and (B and green in C) dual source combining the SMF with Ulrich et al. (2019)’s earthquake source and the seven slides in Table 2, compared with field measurements (black bullets). (D–F) Time series of surface elevation computed for each case (same color coding), compared to reconstructed time series at: (D) Talise, (E) KN Hotel, (F) Grand Mall (See Figure 4 for definitions). Results are from 7.5 m resolution grid SG.
The 2018 Palu tsunami was unusual, and complicated, with a strike-slip earthquake mechanism which triggered coastal landslides. Previous publications show how difficult it has been to identify the tsunami generation mechanism(s). Our work here, however, demonstrates that, for most of Palu Bay, the earthquake and the mapped coastal landslides were equal contributors to the large runups measured around the bay, except in the southeast where an additional (although partly hypothetical) SMF is required. We show the importance of modeling dual earthquake/landslide sources, and of considering all available information to identify how the tsunami waves were generated including, for the first time, time series of tsunami impact reconstructed from video evidence, in addition to the (normally used) runup evidence from field surveys, tide gauge data, and survivor accounts.
A proper understanding and modeling of such destructive dual source tsunami events can help mitigate tsunami coastal hazard resulting from future similar events, here or in other tsunami-prone areas.
Data Availability Statement
The datasets presented in this study can be found in online repositories. The names of the repository/repositories and accession number(s) can be found below: https://drive.google.com/drive/folders/1kPUnYcenRFa0KLhzhyZgJG9eya5CfC8D?usp=sharing.
Author Contributions
LS performed all of the tsunami simulations, including post-processing, and worked on the manuscript. SG supervised all aspects of the work and worked on the manuscript. DT provided insight into the marine geology and worked on the manuscript.
Funding
Support was provided to the University of Rhode Island authors from Grant CMMI-15-35568 from the Engineering for Natural Hazards Program, National Science Foundation. Numerical simulations reported in this work used HPC resources, as part of the Extreme Science and Engineering Discovery Environment (XSEDE) (project BCS-170006), which is supported by the National Science Foundation (NSF) grant number ACI-1548562.
Conflict of Interest
The authors declare that the research was conducted in the absence of any commercial or financial relationships that could be construed as a potential conflict of interest.
Acknowledgments
Special thanks to Anne Socquet for providing their earthquake slip distribution model, and to Thomas Ulrich for providing the time series of horizontal and vertical ground motion from their earthquake model. DT publishes with the permission of the CEO of the British Geological Survey United Kingdom Research and Innovation. Boma Kresning is acknowledged for helping to navigate and translate Indonesian data sources. The Pantoloan tide gauge records and related informations were obtained from the Agency for Geo-spatial Information, Indonesia (BIG) (http://tides.big.go.id).
Supplementary Material
The Supplementary Material for this article can be found online at: https://www.frontiersin.org/articles/10.3389/feart.2020.598839/full#supplementary-material.
References
Altinok, Y., Tinti, S., Alpar, B., Yalciner, A., Ersoy, Ş., Bortolucci, E., et al. (2001). The tsunami of August 17, 1999 in Izmit Bay, Turkey. Nat. Hazards 24, 133–146. doi:10.1023/A:1011863610289
Arikawa, T., Muhari, A., Okumura, Y., Dohi, Y., Afriyanto, B., Sujatmiko, K. A., et al. (2018). Coastal subsidence induced several tsunamis during the 2018 Sulawesi earthquake. J. Disaster Res. 13,sc20181201. doi:10.20965/jdr.2018.sc20181201
Bao, H., Ampuero, J.-P., Meng, L., Fielding, E. J., Liang, C., Milliner, C. W., et al. (2019). Early and persistent supershear rupture of the 2018 magnitude 7.5 Palu earthquake. Nat. Geosci. 12, 200–205. doi:10.1038/s41561-018-0297-z
BIG (2018). Real time tidal observation/ pengamatan pasang surut real time. Available at: tides.big.go.id (Accessed April 30 2020) [Dataset].
BNPB (2019). Gempabumi dan tsunami sulawesi tengah. Available at: https://bnpb.go.id/infografis/infografis-gempabumi-m74-tsunami-sulawesi-tengah (Accessed May 5 2020) [Dataset].
Bradley, K., Mallick, R., Andikagumi, H., Hubbard, J., Meilianda, E., Switzer, A., et al. (2019). Earthquake-triggered 2018 Palu valley landslides enabled by wet rice cultivation. Nat. Geosci. 12, 935–939. doi:10.1038/s41561-019-0444-1
Carvajal, M., Araya-Cornejo, C., Sepúlveda, I., Melnick, D., and Haase, J. S. (2019). Nearly instantaneous tsunamis following the Mw 7.5 2018 Palu earthquake. Geophys. Res. Lett. 46, 5117–5126. doi:10.1029/2019gl082578
Cipta, A., Omang, A., Supartoyo, P. A., Solilkhin, A., Falah, F. N., et al. (2018). “Anomali perilaku gelombang tsunami (Geological Agency, Ministry of Energy and Mineral Resources) Anomaly of tsunami wave behavior,” in Di balik pesona Palu. Badan Geologi, Kementerian Energi dan Sumber Daya Mineral (Geological Agency, Ministry of Energy and Mineral Resources), 133–141.
Dumbser, M., and Käser, M. (2006). An arbitrary high-order discontinuous galerkin method for elastic waves on unstructured meshes—ii. the three-dimensional isotropic case. Geophys. J. Int. 167, 319–336. doi:10.1111/j.1365-246x.2006.03120.x
Enet, F., and Grilli, S. T. (2007). Experimental study of tsunami generation by three-dimensional rigid underwater landslides. J. Waterw. Port Coast. Ocean Eng. 133 (6), 442–454. doi:10.1061/(asce)0733-950x(2007)133:6(442)
Fang, J., Xu, C., Wen, Y., Wang, S., Xu, G., Zhao, Y., et al. (2019). The 2018 Mw 7.5 Palu earthquake: a supershear rupture event constrained by insar and broadband regional seismograms. Rem. Sens. 11, 1330. doi:10.3390/rs11111330
Frederik, M. C., Adhitama, R., Hananto, N. D., Sahabuddin, S., Irfan, M., Moefti, O., et al. (2019). First results of a bathymetric survey of Palu Bay, central Sulawesi, Indonesia following the tsunamigenic earthquake of 28 September 2018. Pure Appl. Geophys. 176, 3277–3290. doi:10.1007/s00024-019-02280-7
Glimsdal, S., Pedersen, G. K., Harbitz, C. B., and Løvholt, F. (2013). Dispersion of tsunamis: does it really matter?. Nat. Hazards Earth Syst. Sci. 13 (6), 1507–1526. doi:10.5194/nhess-13-1507-2013
Goda, K., Mori, N., Yasuda, T., Prasetyo, A., Muhammad, A., and Tsujio, D. (2019). Cascading geological hazards and risks of the 2018 Sulawesi Indonesia earthquake and sensitivity analysis of tsunami inundation simulations. Front. Earth Sci. 7, 261. doi:10.3389/feart.2019.00261
Goto, C., Ogawa, Y., Shuto, N., and Imamura, F. (1997). Numerical method of tsunami simulation with the leap-frog scheme. Intergovernmental Oceanogr. Comm. UNESCO Man. Guides 35, 126.
Grilli, S. T., Tappin, D. R., Carey, S., Watt, S. F. L., Ward, S. N., Grilli, A. R., et al. (2019). Modelling of the tsunami from the December 22, 2018 lateral collapse of Anak Krakatau volcano in the Sunda Straits, Indonesia. Sci. Rep. 9, 11946–12013. doi:10.1038/s41598-019-48327-6 |
Grilli, S. T., O’Reilly, C., Harris, J. C., Bakhsh, T. T., Tehranirad, B., Banihashemi, S., et al. (2015). Modeling of SMF tsunami hazard along the upper East coast: detailed impact around Ocean City, MD. Nat. Hazards 76, 705–746. doi:10.1007/s11069-014-1522-8
Grilli, S. T., Shelby, M., Kimmoun, O., Dupont, G., Nicolsky, D., Ma, G., et al. (2017). Modeling coastal tsunami hazard from submarine mass failures: effect of slide rheology, experimental validation, and case studies off the East coast. Nat. Hazards 86, 353–391. doi:10.1007/s11069-016-2692-3
Gusman, A. R., Supendi, P., Nugraha, A. D., Power, W., Latief, H., Sunendar, H., et al. (2019). Source model for the tsunami inside Palu Bay following the 2018 Palu earthquake, Indonesia. Geophys. Res. Lett. 46, 8721–8730. doi:10.1029/2019gl082717
He, L., Feng, G., Li, Z., Feng, Z., Gao, H., and Wu, X. (2019). Source parameters and slip distribution of the 2018 Mw 7.5 Palu, Indonesia earthquake estimated from space-based geodesy. Tectonophysics 772, 228216. doi:10.1016/j.tecto.2019.228216
Hébert, H., Heinrich, P., Schindelé, F., and Piatanesi, A. (2001). Far-field simulation of tsunami propagation in the Pacific Ocean: impact on the Marquesas Islands (French Polynesia). J. Geophys. Res. Oceans 106, 9161–9177. doi:10.1029/2000jc000552
Heidarzadeh, M., Muhari, A., and Wijanarto, A. B. (2019). Insights on the source of the 28 September 2018 Sulawesi tsunami, Indonesia based on spectral analyses and numerical simulations. Pure Appl. Geophys. 176, 25–43. doi:10.1007/s00024-018-2065-9
Heinrich, P., Schindele, F., Guibourg, S., and Ihmlé, P. F. (1998). Modeling of the February 1996 Peruvian tsunami. Geophys. Res. Lett. 25, 2687–2690. doi:10.1029/98gl01780
Horrillo, J., Grilli, S. T., Nicolsky, D., Roeber, V., and Zhang, J. (2015). Performance benchmarking tsunami models for nthmp’s inundation mapping activities. Pure Appl. Geophys. 172, 869–884. doi:10.1007/s00024-014-0891-y
Imamura, F., Gica, E., Takahashi, T., and Shuto, N. (1995). Numerical simulation of the 1992 Flores tsunami: interpretation of tsunami phenomena in northeastern Flores island and damage at Babi Island. Pure Appl. Geophys. 144, 555–568. doi:10.1007/bf00874383
Jamelot, A., Gailler, A., Heinrich, P., Vallage, A., and Champenois, J. (2019). Tsunami simulations of the Sulawesi Mw 7.5 event: comparison of seismic sources issued from a tsunami warning context versus post-event finite source. Pure Appl. Geophys. 176, 3351–3376. doi:10.1007/s00024-019-02274-5
Kirby, J. T., Shi, F., Nicolsky, D., and Misra, S. (2016). The 27 April 1975 Kitimat, British Columbia, submarine landslide tsunami: a comparison of modeling approaches. Landslides 13, 1421–1434. doi:10.1007/s10346-016-0682-x
Liu, P.-F., Higuera, P., Husrin, S., Prasetya, G., Prihantono, J., Diastomo, H., et al. (2020). Coastal landslides in Palu Bay during 2018 Sulawesi earthquake and tsunami. Landslides 17 (9), 2085–2098. doi:10.1007/s10346-020-01417-3
Lynett, P. J., Gately, K., Wilson, R., Montoya, L., Arcas, D., Aytore, B., et al. (2017). Inter-model analysis of tsunami-induced coastal currents. Ocean Model. 114, 14–32. doi:10.1016/j.ocemod.2017.04.003
Ma, G., Shi, F., and Kirby, J. T. (2012). Shock-capturing non-hydrostatic model for fully dispersive surface wave processes. Ocean Model. 43, 22–35. doi:10.1016/j.ocemod.2011.12.002
Ma, G., Kirby, J. T., Hsu, T.-J., and Shi, F. (2015). A two-layer granular landslide model for tsunami wave generation: theory and computation. Ocean Model. 93, 40–55. doi:10.1016/j.ocemod.2015.07.012
Madsen, P., Fuhrman, D., and Schaffer, H. (2008). On the solitary wave paradigm for tsunamis. J. Geophys. Res. 113, C12012. doi:10.1029/2008jc004932
Mikami, T., Shibayama, T., Esteban, M., Takabatake, T., Nakamura, R., Nishida, Y., et al. (2019). Field survey of the 2018 Sulawesi tsunami: Inundation and run-up heights and damage to coastal communities. Pure Appl. Geophys. 176, 3291–3304. doi:10.1007/s00024-019-02258-5
Miyajima, M., Setiawan, H., Yoshida, M., Ono, Y., Kosa, K., Oktaviana, I. S., et al. (2019). Geotechnical damage in the 2018 Sulawesi earthquake, Indonesia. Geoenviron. Disasters 6, 1–8. doi:10.1186/s40677-019-0121-0
Muhari, A., Imamura, F., Arikawa, T., Hakim, A. R., and Afriyanto, B. (2018). Solving the puzzle of the September 2018 Palu, Indonesia, tsunami mystery: clues from the tsunami waveform and the initial field survey data. J. Disaster Res. 13, sc20181108. doi:10.20965/jdr.2018.sc20181108
Nakata, K., Katsumata, A., and Muhari, A. (2020). Submarine landslide source models consistent with multiple tsunami records of the 2018 Palu tsunami, Sulawesi, Indonesia. Earth Planets Space 72, 1–16. doi:10.1186/s40623-020-01169-3
Natawidjaja, D., Daryono, M., Prasetya, G., Udrekh, U., Liu, P.-F., Hananto, N., et al. (2020). The 2018 Mw7.5 Palu supershear earthquake ruptures geological fault’s multi-segment separated by large bends: results from integrating field measurements, lidar, swath bathymetry, and seismic-reflection data. Geophys. J. Int. [Epub ahead of print]. doi:10.1093/gji/ggaa498
Okada, Y. (1985). Surface deformation due to shear and tensile faults in a half-space. Bull. Seismol. Soc. Am. 75, 1135–1154. doi:10.1016/0148-9062(86)90674-1
Omira, R., Dogan, G., Hidayat, R., Husrin, S., Prasetya, G., Annunziato, A., et al. (2019). The september 28th, 2018, tsunami in Palu-Sulawesi, Indonesia: a post-event field survey. Pure Appl. Geophys. 176, 1379–1395. doi:10.1007/s00024-019-02145-z
Pakoksung, K., Suppasri, A., Imamura, F., Athanasius, C., Omang, A., and Muhari, A. (2019). Simulation of the submarine landslide tsunami on 28 September 2018 in Palu Bay, Sulawesi Island, Indonesia, using a two-layer model. Pure Appl. Geophys. 176, 3323–3350. doi:10.1007/s00024-019-02235-y
Paulik, R., Gusman, A., Williams, J. H., Pratama, G. M., Lin, S.-l., Prawirabhakti, A., et al. (2019). Tsunami hazard and built environment damage observations from Palu city after the September 28 2018 Sulawesi earthquake and tsunami. Pure Appl. Geophys. 176, 3305–3321. doi:10.1007/s00024-019-02254-9
Pelties, C., Gabriel, A.-A., and Ampuero, J.-P. (2014). Verification of an Ader-DG method for complex dynamic rupture problems. Geosci. Model Dev. 7, 847–866. doi:10.5194/gmd-7-847-2014
Prasetya, G., De Lange, W., and Healy, T. (2001). The Makassar Strait tsunamigenic region, Indonesia. Nat. Hazards 24, 295–307. doi:10.1023/A:1012297413280
Pribadi, S., Gunawan, I., Nugraha, J., Haryono, T., Ermawan, C., et al. (2018). Survey tsunami teluk Palu 2018. Basri [Dataset, see data repository].
Putra, P. S., Aswan, A., Maryunani, K. A., Yulianto, E., and Kongko, W. (2019). Field survey of the 2018 Sulawesi tsunami deposits. Pure Appl. Geophys. 176, 2203–2213. doi:10.1007/s00024-019-02181-9
Sassa, S., and Takagawa, T. (2019). Liquefied gravity flow-induced tsunami: first evidence and comparison from the 2018 Indonesia Sulawesi earthquake and tsunami disasters. Landslides 16, 195–200. doi:10.1007/s10346-018-1114-x
Schambach, L., Grilli, S., Tappin, D., Gangemi, M., and Barbaro, G. (2020). New simulations and understanding of the 1908 Messina tsunami for a dual seismic and deep submarine mass failure source. Mar. Geol. 421, 106093. doi:10.1016/j.margeo.2019.106093
Schambach, L., Grilli, S. T., Kirby, J. T., and Shi, F. (2019). Landslide tsunami hazard along the upper US east coast: effects of slide deformation, bottom friction, and frequency dispersion. Pure Appl. Geophys. 176, 3059–3098. doi:10.1007/s00024-018-1978-7
Sepúlveda, I., Haase, J. S., Carvajal, M., Xu, X., and Liu, P. L.-F. (2020). Modeling the sources of the 2018 Palu, Indonesia, tsunami using videos from social media. J. Geophys. Res. Solid Earth 125 (3), e2019JB018675. doi:10.1029/2019jb018675
Shi, F., Kirby, J. T., Harris, J. C., Geiman, J. D., and Grilli, S. T. (2012). A high-order adaptive time-stepping TVD solver for Boussinesq modeling of breaking waves and coastal inundation. Ocean Model. 43, 36–51. doi:10.1016/j.ocemod.2011.12.004
Socquet, A., Hollingsworth, J., Pathier, E., and Bouchon, M. (2019). Evidence of supershear during the 2018 magnitude 7.5 Palu earthquake from space geodesy. Nat. Geosci. 12, 192–199. doi:10.1038/s41561-018-0296-0
Song, X., Zhang, Y., Shan, X., Liu, Y., Gong, W., and Qu, C. (2019). Geodetic observations of the 2018 Mw 7.5 Sulawesi earthquake and its implications for the kinematics of the Palu fault. Geophys. Res. Lett. 46, 4212–4220. doi:10.1029/2019gl082045
Sunny, R. C., Cheng, W., and Horrillo, J. (2019). Video content analysis of the 2018 Sulawesi tsunami, Indonesia: impact at Palu Bay. Pure Appl. Geophys. 176, 4127–4138. doi:10.1029/2019gl082045
Syamsidik, B., Umar, M., Margaglio, G., and Fitrayansyah, A. (2019). Post-tsunami survey of the 28 September 2018 tsunami near Palu Bay in central sulawesi, Indonesia: impacts and challenges to coastal communities. Int. J. Disaster Risk Reduct. 38, 101229. doi:10.1016/j.ijdrr.2019.101229
Takagi, H., Pratama, M. B., Kurobe, S., Esteban, M., Aránguiz, R., and Ke, B. (2019). Analysis of generation and arrival time of landslide tsunami to Palu city due to the 2018 Sulawesi earthquake. Landslides 16, 983–991. doi:10.1007/s10346-019-01166-y
Tanioka, Y., and Satake, K. (1996). Tsunami generation by horizontal displacement of ocean bottom. Geophys. Res. Lett. 23, 861–864. doi:10.1029/96gl00736
Tappin, D. R., Grilli, S. T., Harris, J. C., Geller, R. J., Masterlark, T., Kirby, J. T., et al. (2014). Did a submarine landslide contribute to the 2011 Tohoku tsunami?. Mar. Geol. 357, 344–361. doi:10.1016/j.margeo.2014.09.043
Tappin, D., Watts, P., and Grilli, S. T. (2008). The Papua New Guinea tsunami of 17 July 1998: anatomy of a catastrophic event. Nat. Hazards Earth Syst. Sci. 8, 243–266. doi:10.5194/nhess-8-243-2008
Ulrich, T., Vater, S., Madden, E. H., Behrens, J., van Dinther, Y., Van Zelst, I., et al. (2019). Coupled, physics-based modeling reveals earthquake displacements are critical to the 2018 Palu, Sulawesi tsunami. Pure Appl. Geophys. 176, 4069–4109. doi:10.1007/s00024-019-02290-5
Uphoff, C., Rettenberger, S., Bader, M., Madden, E. H., Ulrich, T., Wollherr, S., et al. (2017). “Extreme scale multi-physics simulations of the tsunamigenic 2004 Sumatra megathrust earthquake,” in Proceedings of the international conference for high performance computing, networking, storage and analysis, SC'17, November 2017, Denver, CO, 1–16.
USGS (2018). M 7.5 - 70 km N of Palu, Indonesia. Available at: https://earthquake.usgs.gov/earthquakes/eventpage/us1000h3p4/executive (Accessed April 30 2020).
Valkaniotis, S., Ganas, A., Tsironi, V., and Barberopoulou, A. (2018). A preliminary report on the M7.5 Palu 2018 earthquake co-seismic ruptures and landslides using image correlation techniques on optical satellite data. Report to EMSC on 19 October 2018 12:00 UTC. doi:10.5281/zenodo.1467128
VOA-News (2018). Crew recounts riding tsunami that dumped ferry in village. https://www.voanews.com/east-asia-pacific/crew-recounts-riding-tsunami-dumped-ferry-village (Accessed June 30 2020).
Watkinson, I. M., and Hall, R. (2017). Fault systems of the eastern Indonesian triple junction: evaluation of quaternary activity and implications for seismic hazards. Geol. Soc. London Spec. Publ. 441, 71–120. doi:10.1144/sp441.8
Watkinson, I. M., and Hall, R. (2019). Impact of communal irrigation on the 2018 Palu earthquake-triggered landslides. Nat. Geosci. 12, 940–945. doi:10.1038/s41561-019-0448-x
Weatherall, P., Marks, K. M., Jakobsson, M., Schmitt, T., Tani, S., Arndt, J. E., et al. (2015). A new digital bathymetric model of the world’s oceans. Earth Space Sci. 2, 331–345. doi:10.1002/2015ea000107
Wei, G., Kirby, J. T., Grilli, S. T., and Subramanya, R. (1995). A fully nonlinear Boussinesq model for surface waves. Part 1. Highly nonlinear unsteady waves. J. Fluid Mech. 294, 71–92. doi:10.1017/s0022112095002813
Widiyanto, W., Santoso, P. B., Hsiao, S.-C., and Imananta, R. T. (2019). Post-event field survey of 28 september 2018 Sulawesi earthquake and tsunami. Nat. Hazards Earth Syst. Sci. 19 (12), 2781–2794. doi:10.5194/nhess-19-2781-2019
Yolsal-Çevikbilen, S., and Taymaz, T. (2019). Source characteristics of the 28 September 2018 Mw 7.5 Palu-Sulawesi, Indonesia (SE Asia) earthquake based on inversion of teleseismic bodywaves. Pure Appl. Geophys. 176, 4111–4126. doi:10.1007/s00024-019-02294-1
Zhang, C., Kirby, J. T., Shi, F., Ma, G., and Grilli, S. T. (2021a). A two-layer non-hydrostatic landslide model for tsunami generation on irregular bathymetry. 1. Theoretical basis. Ocean Model. 101749, https://doi.org/10.1016/j.ocemod.2020.101749
Zhang, C., Kirby, J. T., Shi, F., Ma, G., and Grilli, S. T. (2021b). A two-layer non-hydrostatic landslide model for tsunami generation on irregular bathymetry. 2. Numerical discretization and model validation. Ocean Model. (to appear)
Keywords: tsunami hazard, coseismic tsunami, landslide tsunami, coastal landslides, numerical tsunami model
Citation: Schambach L, Grilli ST and Tappin DR (2021) New High-Resolution Modeling of the 2018 Palu Tsunami, Based on Supershear Earthquake Mechanisms and Mapped Coastal Landslides, Supports a Dual Source. Front. Earth Sci. 8:598839. doi: 10.3389/feart.2020.598839
Received: 25 August 2020; Accepted: 18 November 2020;
Published: 11 January 2021.
Edited by:
Finn Løvholt, Norwegian Geotechnical Institute, NorwayReviewed by:
Anawat Suppasri, Tohoku University, JapanPhil Cummins, Australian National University, Australia
Copyright © 2021 Schambach, Grilli and Tappin.. This is an open-access article distributed under the terms of the Creative Commons Attribution License (CC BY). The use, distribution or reproduction in other forums is permitted, provided the original author(s) and the copyright owner(s) are credited and that the original publication in this journal is cited, in accordance with accepted academic practice. No use, distribution or reproduction is permitted which does not comply with these terms.
*Correspondence: Stéphan T. Grilli, Z3JpbGxpQHVyaS5lZHU=
 Lauren Schambach
 Stephan T. Grilli
 David R. Tappin