
95% of researchers rate our articles as excellent or good
Learn more about the work of our research integrity team to safeguard the quality of each article we publish.
Find out more
ORIGINAL RESEARCH article
Front. Earth Sci. , 15 January 2021
Sec. Atmospheric Science
Volume 8 - 2020 | https://doi.org/10.3389/feart.2020.598043
This article is part of the Research Topic Origins and Predictability of the Intraseasonal to Interannual Variabilities of Regional Climate View all 31 articles
A daily East Asia–Pacific teleconnection (EAP) index was constructed to investigate the impact of the intraseasonal variability (ISV) of this index on the genesis of multiple tropical cyclones (MTC) in boreal summer over the western North Pacific (WNP). The result indicates that the EAP index has dominant intraseasonal periods of 10–20 days, 20–40 days and 50–70 days, respectively. The ISV of the EAP during 1979–2019 can be classified into three types, a single-period-domination type (37%), a multiple period coexistence type (24%) and a transition type (39%). It is found that during El Niño (La Niña) summers, the ISV of the EAP is dominated by a higher-frequency (lower-frequency) oscillation with a period of around 20–30 (50–70) days. The distinctive ISV characteristics during the different ENSO years were accompanied with different dynamic and thermodynamic background conditions over the WNP and the South China Sea, which modulated the frequency and location of MTC genesis. By examining the relative contributions of individual environmental variables of the Genesis Potential Index, we found that the low-level absolute vorticity and mid-level relative humidity are two important environmental factors modulating MTC genesis. However, the relative role of these variables tends to change with the EAP ISV phase. The environmental condition over the SCS appears less influenced by ENSO. A more southern location of MTC genesis during El Niño is attributed to the change of the environmental humidity.
The western North Pacific Ocean (WNP) is a main cradle of tropical cyclone (TC) genesis. About 1/3 of TCs each year form in the region. TC genesis frequency in the WNP exhibits great intraseasonal and interannual variabilities (Li, 2012; Li and Hsu, 2017). For example, under the impact of the atmospheric intraseasonal oscillation, TC activity exhibits a marked intraseasonal variation (ISV; Liu and Lin, 1990; Fu et al., 2007; Kikuchi et al., 2009; Kikuchi and Wang, 2010; Gao and Li, 2011; Gao and Li, 2012; Zhu et al., 2013; Zhang et al., 2017; Lyu et al., 2018; Zhao and Li, 2019; Zhao et al., 2019), with an alternation of active and inactive periods of TC genesis. Multiple tropical cyclones (MTC) often occurred during the active period of the ISV (Gao and Li, 2011). Based on the statistical feature of TCs over the WNP, Gao and Li (2011,2012) defined an active and an inactive phase of MTC genesis in the WNP. Both the phases could bring natural hazards. An active phase implies more frequent TC genesis and landfall over East Asian coast, and an inactive phase implies less TC genesis and the control of the Subtropical High, which could bring extremely heat waves and droughts in East Asia. China is one of the WNP rim countries that are highly influenced by tropical cyclones.
Previous studies also showed a tight relationship between MTC over the WNP and the oscillations with lower frequency in atmosphere and ocean (e.g. Sun et al., 2009; He et al., 2013; You et al., 2019a; You et al., 2019b; Lai et al., 2020; Zhang et al., 2020). For example, previous studies suggested a climatic impact of TC genesis over the WNP by the El Niño-Southern Oscillation (ENSO), the Antarctic Oscillation (AAO), the North Pacific Oscillation (NPO), and the Asian-Pacific Oscillation (APO) (Wang and Chan, 2002; Wang et al., 2007; Wang and Fan, 2007; Zou and Zhao, 2009; Li 2012; Han et al., 2020). A dominant teleconnection pattern over the East Asian-western North Pacific (EAWNP) section in boreal summer was discovered by Nitta (1987) and Huang and Li (1987), Huang et al. (2003). This teleconnection pattern was named as the Pacific-Japan (PJ) pattern by Nitta (1987) and as the East Asia–Pacific teleconnection (EAP) by Huang and Li (1987), Huang (1990), Huang et al. (2003). This pattern contains an opposite convection/circulation pattern over the tropical WNP around Philippines and the subtropical East Asia along the Meiyu front. The teleconnection pattern implies a meridional dipole pattern over the EAWNP monsoon region (Wang et al., 2001; Lu, 2004). It is often associated with a wave train pattern of geopotential height anomalies with an alternative distribution of negative-positive-negative centers over the Philippines, Japan and the Okhotsk (Huang, 1990; Huang and Sun, 1992). For readers’ convenience, hereafter this teleconnection pattern is called the EAP pattern.
The EAP shows an alternative meridional pattern of convective anomalies in the monsoon trough over the western North Pacific, Meiyu front in central East Asia, and the Okhotsk Sea (Lin et al., 1999; Hsu and Lin, 2007; Ding and Liu, 2008). It modulates the TC genesis frequency by influencing the position of the subtropical high in the WNP (Huang and Wang, 2010). According to Huang and Wang (2010), under the impact of a positive phase of the EAP, the western Pacific subtropical high shifts to the north and east, away from its climatological position. As a result, more frequently TCs form over the WNP and TC tracks shift more northward, leading to more landfall north of Xiamen.
The EAP teleconnection pattern is highly influenced by the sea surface temperature anomaly (SSTA). It was shown that the local sea surface temperature (SST) and convection anomalies in the WNP could trigger a seasonal-mean EAP pattern anomaly (Huang and Li, 1988; Huang and Sun, 1994). Zong et al. (2008) found a relation between the occurrence of the EAP and ENSO. Sun et al. (2014) noted that the EAP pattern was sensitive to the SSTA in the tropical Pacific and Indian Oceans in the preceding winter and spring. The results implies that the modulation of the low-frequency EAP variability on the MTC genesis may depend on the ENSO phase. Given that the summer EAP pattern is a dominant intraseasonal mode over the WNP (Wu et al., 2013; Li et al., 2014), we would like to examine to what extent the ISV of the EAP modulates the MTC activity over the WNP and how the tropical SSTA associated with the ENSO affects the ISV–MTC relationship.
The objective of the current study is to reveal the relationship between the ISV of the EAP and MTC and ENSO modulation on the relationship. The data and relevant methodology are described in Data and Methodology. In Characteristics of the Intraseasonal Variability of the East Asia–Pacific, the ISV of the EAP and its potential impact on MTC are analyzed. The modulation of the impact of the EAP ISV on MTC genesis by ENSO and its possible mechanism are discussed in Impacts of the East Asia-Pacific Intraseasonal Variability on Multiple Tropical Cyclones. Finally, a conclusion and discussions are given in Conclusion and Discussion.
The daily general circulation during 1979–2019 is analyzed by geopotential height and wind data with the horizontal resolution of 2.5° at pressure level, published by NCEP/NCAR in reanalysis 1 dataset.
The daily interpolated outgoing longwave radiation (OLR) in the same time is used for estimating the convection activity which is obtained from the NOAA polar orbiting satellites (Liebmann and Smith, 1996) (https://www.esrl.noaa.gov/psd/data/gridded/).
The high-resolution daily SST with horizontal resolution of 0.25° used for the calculation of TC genesis potential index (GPI) in 1982–2019 is supported by NOAA/OAR/ESRL PSD, Boulder, Colorado, United States. Since the limitation of length of the SST data, the GPI can be only provided since 1982. However, such limitation less influences our analysis, for 1979–1981 will not seleceted as ENSO years dependent on the criterion we introduce below.
The Oceanic Niño Index (ONI) representing the variation of ENSO is based on the areal mean sea temperature anomalies in Nino 3.4 region (5°N–5°S, 120°–170°W). The amonaly is relative to the climatological mean based on a centered 30-years base periods updated every 5 years (http://www.cpc.ncep.noaa.gov/products/analysis_monitoring/ensostuff/ensoyears.shtml).
The best-track data from the Joint Typhoon Warning Center (JTWC) is used to locate the genesis position of TC where the storm intensity estimated by maximum sustained 1-m winds firstly reaches TC intensity (34 kts or 17.2 m/s), following the method of McDonald et al. (2005).
A daily EAP index will be constructed here to monitor the variation of EAP. Within our research scope, we will focus on the intraseasonal characteristics of EAP and its impacts on MTC genesis. Thus, we apply a method referred to Li (2004) and Wu et al. (2013) to extract the low frequency signal from original variables. First of all, to remove the annual cycle, a 41-years-mean of the daily zonal wind at 850 hPa in summers (June–September) from 1979 to 2019 is subtracted. Then remove the seasonal mean in each year to exclude the influence of inter-annual variation. Finally, a 5-days-moving averaging is carried out to eliminate the synoptic wave signal, and the variable anomalies with ISV are remained, among which the zonal wind anomaly will be used to constructed the EAP index (IEAP) according to Wu et al. (2013). The areal means of zonal wind anomaly in different domains are selected to calculate the IEAP, as shown below:
The standardized IEAP is regarded as EAP index in our study.
To carefully investigate the potential influence of EAP on MTC active genesis, the latter is defined in quantity here as a period when the generation interval of two TCs is not greater than 3 days in time and less than 4,000 km in space according to Gao and Li (2011). The criterion is selected based on a statistical analysis in June to September in 1979–2006. A MTC genesis with the temporal interval not greater than 3 days will be classified into a relatively intensive genesis event, not greater than the −0.5 standard deviation. A spacial interval limitation excludes around 13% events that two TCs generates in a extremely far distance. Based on this criterion, the TCs in active MTC genesis event in June to September in 1979–2019 will be selected to be in accordance with the EAP index.
The genesis potential index (GPI) of tropical cyclone is firstly developed by Gray (1979) and then modified by Emanuel and Nolan (2004) to estimate the climate condition for tropical cyclone genesis. The GPI, consisting of low-level vorticity, vertical wind shear, mid-level humidity, SST and the TC maximum potential intensity, will be calculated according to Equation (2) by using the original environment parameters from NCEP reanalysis 1 dataset.
Equation (2) includes four multipliers, respectively related to vorticity (A), humidity (B), maximum wind speed or potential intensity (C, PI) and vertical wind shear (D,VWS). In multiplier A,
The variable Vpot is the most modified variable in this later index (Carmago et al., 2007), and is defined by Emanuel (1986, 1987, 1988, 1995 and 2000):
In Equation (3), Cp, Ck, CD are respectively the heat capacity at constant pressure, the exchange coefficient for enthalpy and the drag coefficient; Ts and To are respectively the ocean temperature and mean outflow temperature;
To assess the contribution of four factors in GPI, we follow the methodology of Jiang et al. (2012) and Li et al. (2013). The GPI can be divided into two parts, climatology mean
Equation (4) suggests the ISV of GPI consists of four linear terms and eleven nonlinear terms.
The EAP index constructed by the filtered zonal wind anomaly as described in East Asia–Pacific Index Definition will be used to reveal the general characteristics of the ISV in the region of interest. The power spectrum of the 41-years-mean EAP index (Figure 1) shows significant peaks on the intra-seasonal timescale (10–70 days) that pass the 95% confidence level. Among the timescale, there are several spectrum peaks at 10–20 days, 20–40 days and 50–70 days, and all these peaks exceed the maximum Markov level. For simplicity, one may category them into two groups, a shorter period group of 10–40 days and a longer period group over 50 days.
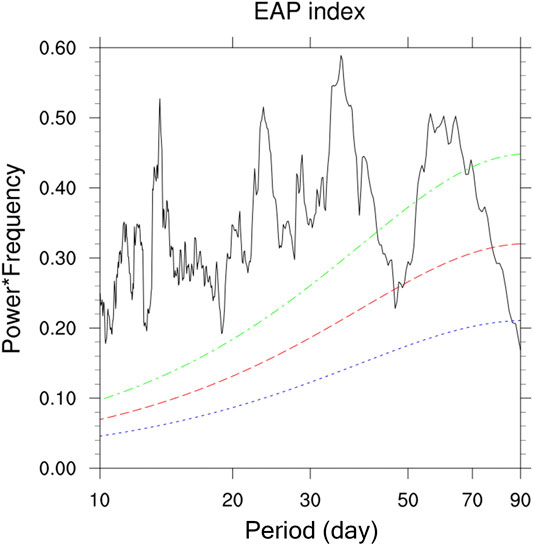
FIGURE 1. Power spectrum of the EAP index averaged during the 41-years analysis period. The red dashed line is 95% confidence level and the green and blue ones are respectively maximum and minimum Markov confidence levels.
It is worth mentioning that the periodicity of the ISV of the EAP in the boreal summer experiences an interannual variation. According to the power spectrum of individual years, they may be roughly classified into three types, as listed below and in Table 1:
(1) Single period domination type. In about 36.6% of years (15 years) the EAP indices have a single dominant period, even though the range of the dominant period somewhat varies. For example, a single spectra peak at 10–20 days appeared in 1993 (Figures 2A,B). A spectrum peak of 20–40 days occurred in 1987 (Figures 2C,D), whereas a 30–60-days peak occurred in 1984 (Figures 2E,F).
(2) Multiple period coexistence type. Among 41 years, there are about 24.4% of the EAP indices (9 years) that have multiple significant periods. For example, the EAP index in 2006 had two peaks at 10–20 days and 30–50 days respectively, both of which exceed the maximum Markov confidence level (Figures 3A,B).
(3) Transition type. Since 1979, there are 16 years (about 39.0%) in which the dominant period changes within the season. One such example happened in 1991 (Figures 3C,D), in which the period of 20–45 days was dominant before August, but it transformed to 10–20 days after early September.

TABLE 1. Different types and corresponding years of low frequency variation of EAP index during 1979–2019.
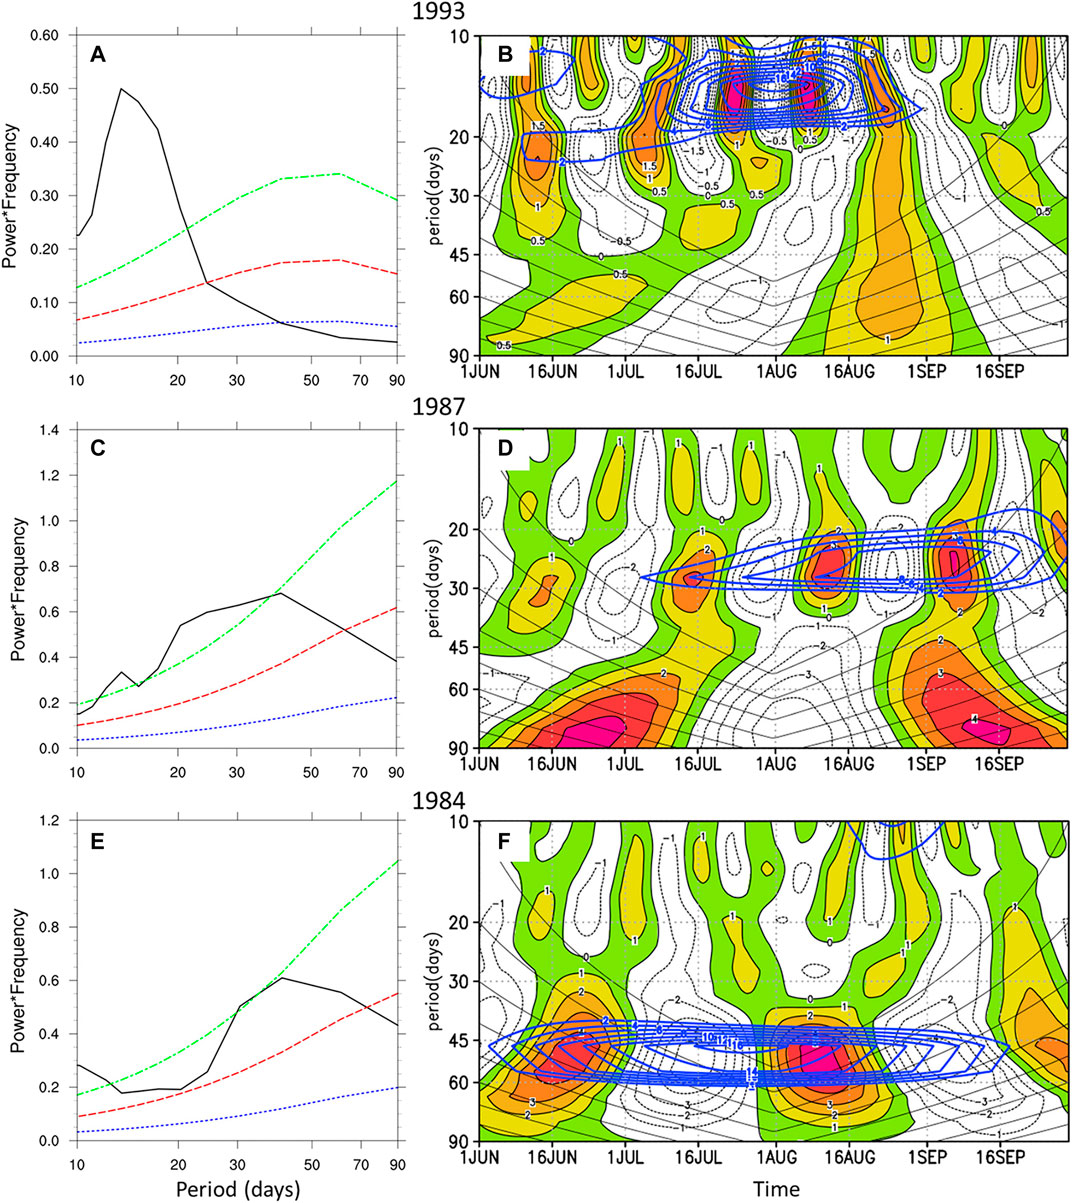
FIGURE 2. Power spectrum of the EAP index in 1993 (A), 1987 (C) and 1984 (E) with red, blue and green line representing respectively the 95% confidence level, maximum and minimum Markov confidence levels, and real part of wavelet (B, D and F) with blue contours encircling the power spectrum passing the 95% confidence level.
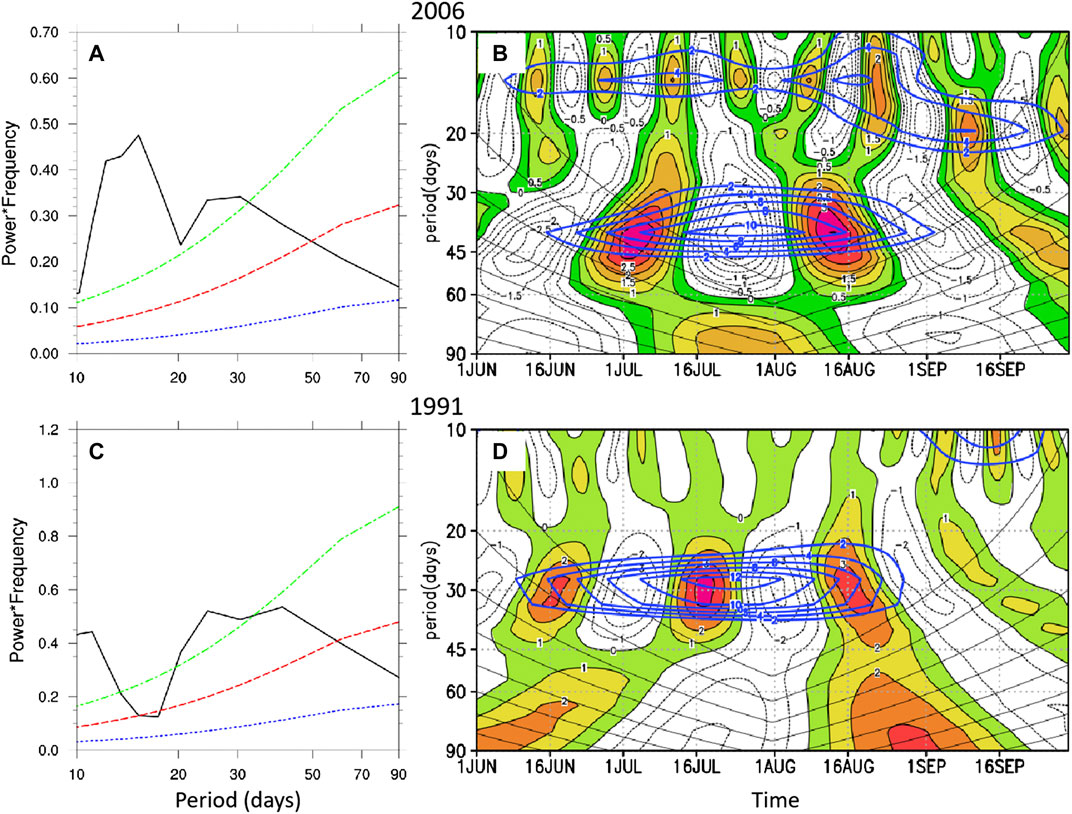
FIGURE 3. Same for Figure 2 but for year 2006 (A–B) and 1991 (C–D).
Previous works revealed that the EAP was highly influenced by ENSO (Huang and Li, 1988; Huang and Sun, 1994; Zong et al., 2008; Sun et al., 2014). In this subsection, we investigate how ENSO-related mean state changes influence the ISV of the EAP in the summer.
We define the El Niño (La Niña) year as a year when the monthly average ONIs of October, November and December are all higher (lower) than 0.5°C (−0.5°C). A lagged correlation analysis shows that the EAP index is more correlated to the monthly ONI during October to December in the previous year. This is consistent with Lin and Li (2008). What’s more, the simultaneous TC-ENSO correlation is statistically insignificant according to Li (2012). Therefore, in the following we consider the EAP in the ENSO decaying summer as the ENSO impact on EAP. For concision, all the ENSO scenarios we mentioned below refer to the decaying summer of the ENSO years. All samples selected based on the phase of ENSO are listed in Table 2.

TABLE 2. Years of two ENSO phases, and day number and MTC genesis number of 6 phases during June to September in ENSO years.
The composite power spectrum of the EAP index during the El Niño and La Niña years is shown in Figure 4. It indicates that the El Niño EAP is characterized by a higher-frequency oscillation with the strongest peak at 20–30 days passing the max Markov confidence level, whereas the La Niña EAP is characterized by a lower-frequency oscillation with the strongest peak at 50–70 days. Two weaker peaks at around 10–20 and 30–50 (20–40) days are also found in the El Niño (La Niña) EAP. The difference of the peak ISV periodicity between El Niño and La Niña is significant. Under the impact of sea surface temperature, the types of EAP ISV of individual year are redistributed among three categories. Close to 60% (7 in 12 years) ISV of EAPs in El Niño years belong to single period domination type. In 6 of 7 years, the ISV of EAP is with a dominant period of 20–50 days. Among 11 La Niña years, the ISV oscillates with single dominant period of around 40–70 days in only three years. Over 72.3% of ISV of EAPs in La Niña years are located in transition type or multiple period coexistence type. The complex change of variation period will increase the forecast difficulty. Thus, the EAP in El Niño years will be regarded as more predictable.
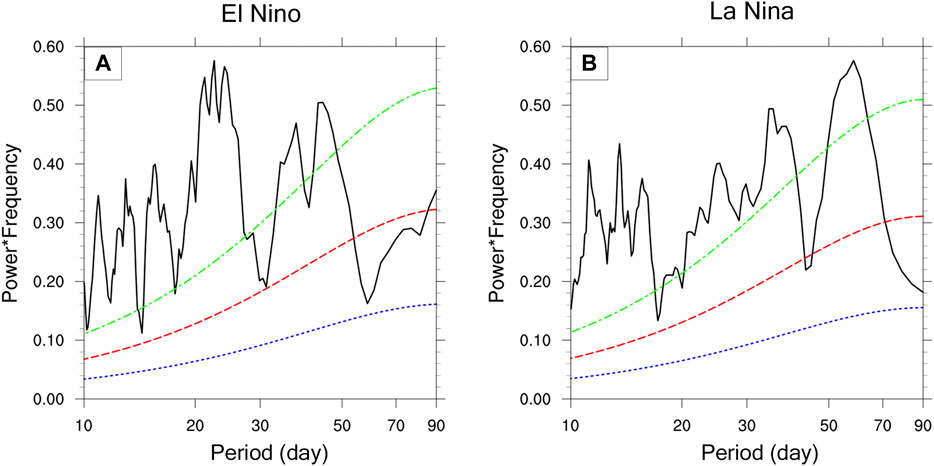
FIGURE 4. Same as Figure 1 but for the power spectrum of the EAP index during El Niño (A) and La Niña (B) summers.
To unveil the composite evolution patterns of the EAP during the positive and negative phases of ENSO, we examine the anomalous OLR and zonal wind fields regressed onto the EAP index (Figure 5). Due to the distinctive periods of 20–30 days (50–70 days) during El Niño (La Niña), we examine the convection and zonal wind fields from Day-16 (Day-32) to Day 0.
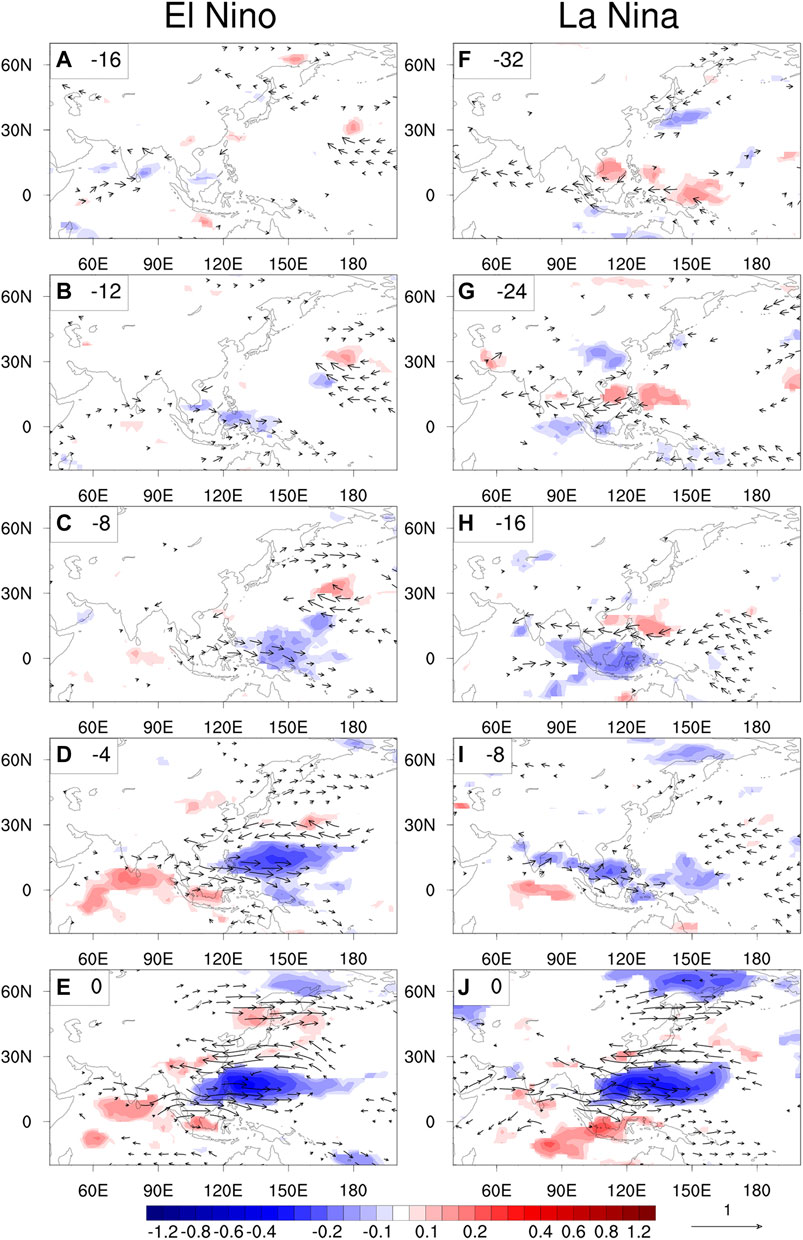
FIGURE 5. The regression coefficient patterns of the OLR (shaded, passing the 95% confidence level) and wind (vector with the zonal component passing the 95% confidence level) anomalies from Day -16 or Day -32 to Day 0 regressed onto the EAP index in El Niño years (A–E) and La Niña years (F–J).
During El Niño summers, the intraseasonal oscillation in the tropics is active in the Indian Ocean but weak in the Pacific Ocean (Figure 5A). It is noteworthy that a negative OLR anomaly firstly appears in the mid-Pacific Ocean in mid-latitudes with an anticyclonic wind shear. Meanwhile, a weak meridional wave train lies at the coast of eastern Asia, with a positive OLR center near 20°N over the Indian Ocean. Then the convection and westerly over the Indian Ocean decrease while those over the tropical Pacific are intensified as the positive OLR anomaly center and the anticyclone at mid-Pacific propagate westward (Figures 5B,C). After the convection is organized in tropic Pacific near 150°E, the anomalies of convection and zonal wind together propagate northwestward. On Day 0 when the EAP reaches a maximum (Figure 5E), a marked region is in accordance with the first empirical orthogonal function mode shown in Wu (2013).
Distinguished from the El Niño year composite, the tropical convective anomalies associated with the ISV first appear over the Maritime Continents during La Niña summers, while no anomalous anticyclones exist in the mid-Pacific (Figure 5F). The tropical convection stretches zonally over the Indo-Pacific Ocean (Figure 5G). The convective branch then shifts to the north (Figure 5H) and propagates northeastward, while a suppressed convective branch appears over the tropical Pacific (Figure 5I). The anomalous OLR centers in both lower and higher latitudes are strengthened on Day 0 (Figure 5J).
In summary, the development of the anomalous convective branch of the EAP in the Philippines during El Niño is mainly affected by the northwestward propagation of the quasi-biweekly oscillation (QBWO) from mid-Pacific to the WNP, while during La Niña it is primarily modulated by the northeastward propagation of the boreal summer 30–60-days intraseasonal oscillation. These processes are in accordance with the previous study on the boreal summer intraseasonal oscillation (BSISO, Liu et al., 2016). A possible physical mechanism of such difference is investigated in Liu et al. (2016), which owns the ISV difference to the ENSO-related mean state with enhanced moisture and easerly vertical wind shear in WNP (near the Maritime Continent) in El Niño (La Niña) years. Although our study based on the ENSO decaying summer, a considerably similar process of ISV of EAP suggests a sustentation of ENSO influence to the next summer, which agrees with the idea of Zong et al. (2008). Our analysis result suggests that the convection in the Philippines associated with the EAP is highly influenced by the boreal summer ISV activity, which conveys the impact of SST anomalies in the eastern equatorial Pacific. The circulation anomalies in higher latitude associated with the EAP tend to develop after the tropical anomalies, indicating the fundamental impact of the tropical forcing. The result seems consistent with Wu et al. (2013), who suggested the role of northward energy dispersion.
The ISV of the EAP may impact MTC genesis through modulated thermodynamic and dynamical conditions over the WNP region. In this section we will investigate the impact of different ISV phases of the EAP on MTC formation. In addition, we will examine the modulation of El Niño and La Niña on the EAP ISV–MTC relation.
The ISV of EAP indices which is filtered with period of 20–30 days (50–70 days) for El Niño (La Niña) years will be divided into 6 phases as shown in Figure 6. The 85% quantile of the peak and valley value in one cycle are regarded as the demarcation points of 6 phases, so as to confirm a similar day number of each phase as shown in Table 2.
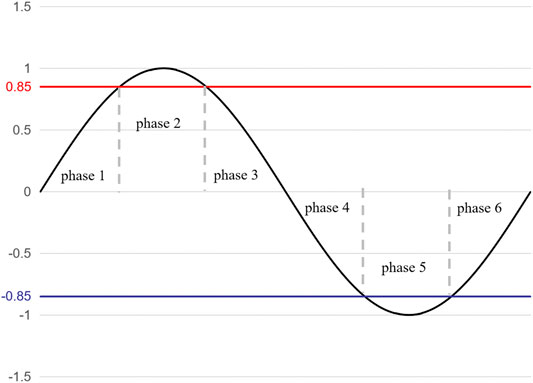
FIGURE 6. Phase division of oscillation period of EAP index. The red/blue line represents the +0.85/-0.85 level.
Table 2 also shows the distribution of MTC genesis number and frequency in six phases of EAP oscillation during June to September. The genesis frequency is estimated by the ratio of day numbers of 6 EAP phases and corresponding MTC genesis number, with smaller quantity representing a higher frequency of MTC genesis. It seems that phase 2 is the significantly active phases for MTC genesis, while its occurrence is significantly inhibited in phase 5. That is to say, the active and inactive stage of MTC will alternatively occur as the ISV of EAP. What’s more, the modulation of EAP seems to be asymmetric, and such asymmetry is influenced by ENSO phases. In El Niño (La Niña) years, the phases 1–2 (phases 1–4) seems to be relatively active phase for MTC genesis and the phase 1 (phase 3) is also an significant phase for MTC frequent genesis, passing the 95% confidence of Monte Carlo test. In addition, MTC may generate more frequently in La Niña years, with on average 2.9 more MTC will occur in each La Niña year, passing the 90% confidence level. For MTC genesis frequency in significantly active phases, MTC genesis may occur around every 9–10 days in El Niño years, but less than every 8.5 days in La Niña years.
Except for the MTC frequency, EAP will influence the position of MTC genesis. As shown in Figure 7, a frame in solid line shows a genesis area where all MTCs happen in these 23 ENSO years. A zonal dashed line at 20°N evenly divided the genesis area into north and south part, and two meridional dashed lines at 120°E and 145°E divided the area into the South China Sea part (SCS), west WNP part (WWNP) and east WNP-mid Pacific part (EWNP-CNP). All red figures and numbers are for El Niño scenario while those in blue are for La Niña. The positions of MTC are marked as points in the frame, the mean latitude and longitude of which are respectively shown by a horizontal and vertical colored line. The numbers outside (inside) the frame denotes the MTC genesis number in each zonal or meridional band (sub-domain).
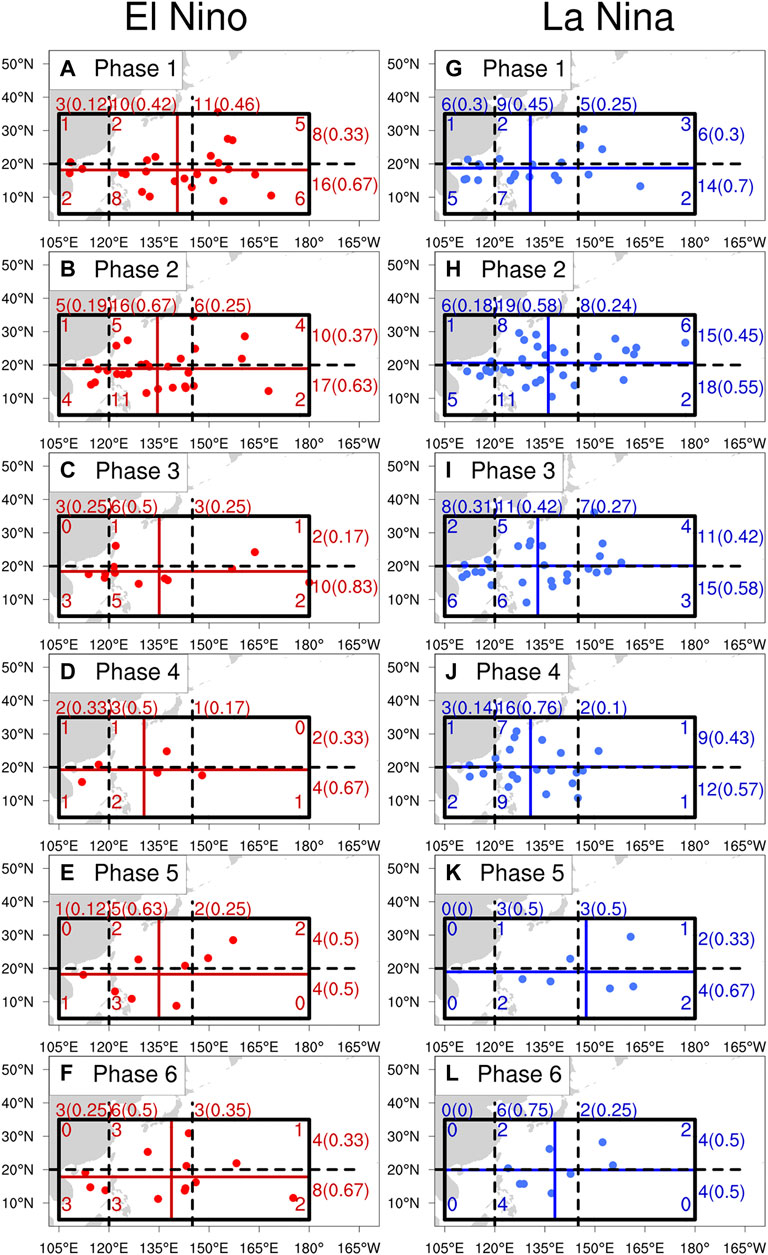
FIGURE 7. The positions of multiple tropical cyclogenesis during June to September in different phases of EAP oscillation. The points and numbers in red (blue) are for El Niño EAP (La Niña EAP). The black frame in solid line distinguishes the domain where all multiple tropical cyclone events take place with 6 sub-domains divided by a zonal dashed line at 20°N and two meridional dashed lines at 120°E and 145°E. The numbers in the sub-domain show the amount of MTCs which generate inside, while the numbers lying north or east to the frame denote the summary of the MTCs generating in the corresponding meridional or zonal bands with the percentage in bracket.
Firstly, we pay attention to the zonal position of MTC. As evolution of El Niño EAP, mean longitude significantly moves westward in the active phases. In phase 1, mean latitude lies near the boundary of WWNP and EWNP with close to half TCs generate in EWNP-CNP. It moves to around 135°E in phase 2 and further moves to around 130°E in phase 3. This time, over half MTCs occur in WWNP and more TCs generate in the SCS. When transferring to the inactive stage in phase 4, the mean longitude stands near 130°E close to the Philippines, and then moves backward to mid-Pacific in phase 5 and 6. As for the La Niña scenario, TCs firstly gather near 130°E in phase 1, and then moves slightly eastward near 135°E in phase 2. In sequence, the mean longitude of MTC position slightly shifts eastward. In the significantly less MTC stage of phase 5 and 6, MTCs scatter near the boundary of west and east WNP, and the mean longitudes lie farther more east than those in other phases. It is noteworthy that, in the active phases of EAP for MTC, the zonal movement of mean longitude of MTC is more significant in El Niño years than in La Niña years. Especially during phase 1–2, the area where MTCs concentrate rapidly shifts westward as the El Niño EAP evolves, but slightly moves eastward along the development of La Niña EAP.
We can also make this conclusion in the meridional variation of genesis position of MTC. In the development of tripolar pattern of EAP, the convection and zonal wind continuously propagate northward. Such northward movement is also seen in the mean latitude of the MTC position. By comparison between two ENSO phases, meridional change of the MTC position is more obvious in El Niño years. Most MTC (around 70%) firstly appear to the south of 20°N in phase 1, but the proportions of genesis number in north and south parts are comparable in phase 2. Since phase 3, the southern proportion increases once again. The MTC position oscillates as the ISV of EAP. However, in La Niña years, the MTC most generates near 20°N and the mean latitude shifts slightly. Due to the mean latitude moves northward from relative south in El Niño year, the mean position of MTC in whole active phases is markedly southern by around 1.4° compared with La Niña years, which passes 90% confidence level.
The above analysis indicates that the ISV of EAP may modulate the frequency and position of MTC genesis and the ENSO mainly exerts the impact by influencing the EAP evolution. MTC tends to generate more frequently in La Niña years. MTC genesis positions shift obviously northwestward as the ISV of EAP in El Niño years, whereas it slightly moves northeastward along the ISV of EAP in La Niña years.
As the EAP pattern is ENSO-phase dependent, it is critical to understand how the different phases of the ENSO modulate the dynamical and thermodynamic conditions for MTC genesis. Figure 8 shows the composite patterns of circulation at 850 hPa and OLR based on 6 phases of the EAP ISV during the El Niño and La Niña years. As seen from Table 2, the MTC number in phase 2 (phase 5) of the EAP ISV is significantly more (less), passing the 95% confidence level in the Monte Carlo test. Comparing between phase 2 and phase 5, MTC events concentrate in the area where convection is active (i.e., region of negative OLR anomaly) associated with a significant anomalous cyclone in phase 2, but an approximately opposite pattern of the OLR and wind anomaly appear in phase 5, leading to an inhibition of MTC. In El Niño years, the concentration area of MTC changes from mid-Pacific to west WNP then to the SCS in the active phases. The center of negative OLR coupled with cyclonic wind shear is also moves in this way (figure not shown). However, they slightly move northeastward from phase 1 to phase 2 and contract westward to the coastal line in La Niña years, resulting in MTC concentrating in the SCS and west WNP.
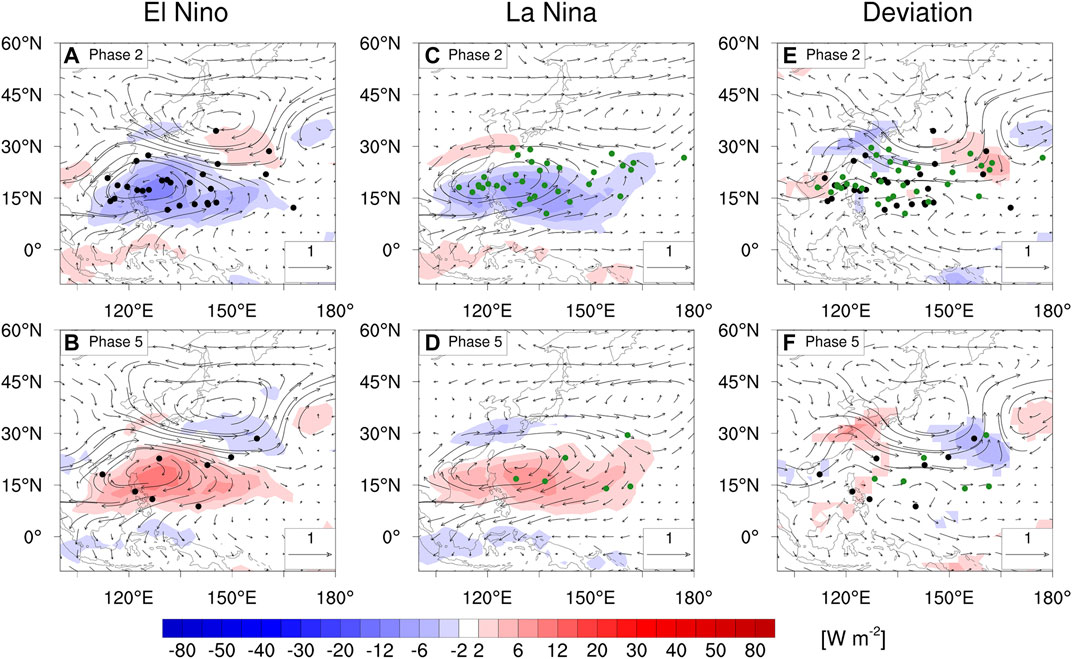
FIGURE 8. The composition of wind (m/s, vector) at 850 hPa and OLR(W m−2, shaded) with the period of 20–30 days for El Niño years (A–B) and 50–70 days for La Nina years (C–D) and their difference (El Niño minus La Niña) fields (E–F) based on the phase of the EAP index. The differences passing the 95% confidence level are plotted. The black (green) dots represent the positions of MTC genesis in El Niño (La Niña) summers.
Figure 8A shows that a stronger anomalous anticyclone appears to the north of the anomalous cyclone near 20°N during El Niño years, and the anticyclone tends to suppress local TC genesis. The stronger easterly to the south edge of the anticyclone increase cyclonic vorticity near 15°N. A negative OLR anomaly is approximately in phase with the positive vorticity anomaly where the low-level flow is convergent. The cyclonic and convergent flow is conductive to the convective activity. The enhanced convective activity increases the probability of TC genesis through the “seeding” effect (Meloney and Hartmann, 2000; Hartmann and Meloney, 2001; Li et al., 2014), and the merging of small-scale convective cells benefits the growth of the embryos of tropical cyclones. The development of the tropical disturbances is further modulated by low-level large-scale cyclonic circulation through the vorticity segregation process (e.g., Li, 2012). As a result, the meridional location of MTC shifts slightly towards the south during El Niño years than that during La Niña years.
The structure of wind in lower layer is important to the genesis of TC, while that in higher layer also plays a crucial role. As shown in Figure 9, the MTC genesis is active under the strong divergent flow at 200 hPa both in El Niño years (Figure 9A) and La Niña years (Figure 9C), but is inhibited under the convergent flow (Figures 9B,D). The suction effect from the divergent flow in higher layer will strengthen the convergence of flow and help to the development of convection by the mass compensation process. At 500 hPa, the negative and positive anomalies of geopotential height are respectively near 20°N and 35°N, suggesting the subtropical high over the WNP lying to the north or east compared with the normal. This is also found by Huang and Wang (2010). The positive geopotential height anomaly lies over Japan will inhibit the cyclogenesis in middle latitude. An opposite distribution is revealed in phase 5.
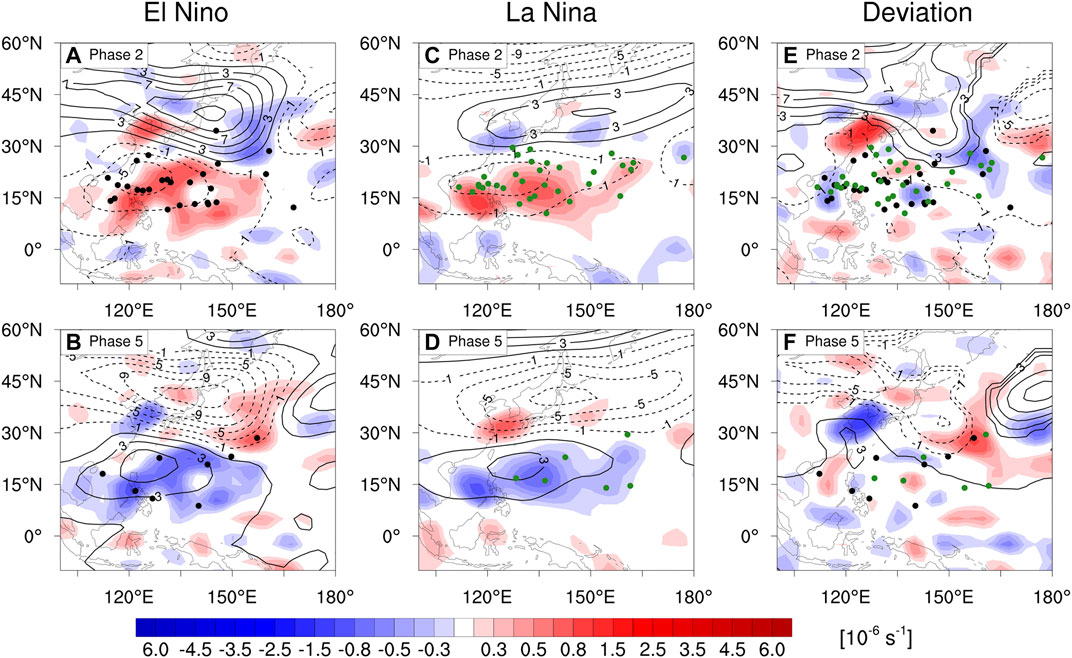
FIGURE 9. The composition of divergence (s−1, shaded) at 200 hPa and geopotential height at 500 hPa (gpm, contour) with the period of 20–30 days for El Niño years (A–B) and 50–70 days for La Niña years (C–D) and their difference (El Niño minus La Niña) fields (E–F) based on the phase of the EAP index. The differences passing the 95% confidence level are plotted. The black (green) dots represent the positions of MTC genesis in El Niño (La Niña) summers.
By comparing the El Niño and La Niña composites, one may see that the wind divergence field at 200 hPa is of larger scale and TCs form more uniformly during the active phases of La Niña EAP. The divergence center significantly propagates westward in El Niño years, while in La Niña years it mainly expands northward. It is hard to tell the difference between the divergent wind field in the two ENSO scenarios, because its distribution is of more characteristics at a smaller scale in El Niño years. As for geopotential height however, the amplitude of El Niño EAP is much stronger than that in La Niña years. In other word, the inhibition from the positive anomaly in middle latitude will be improved in El Niño years. In fact, in the development of El Niño EAP, the positive anomaly of geopotential height at 500 hPa is accompanied with the anticyclone at 850 hPa, moving westward from the mid-Pacific, which are not found in La Niña EAP. The stronger inhibition in middle latitude in El Niño years makes a less generation of TC in the higher latitudes.
In addition to the dynamical conditions, thermodynamic conditions also play an important role in TC genesis, because TC intensification requires a large amount of heat and momentum exchange. The atmospheric thermodynamic conditions for TC genesis is highly influenced by atmospheric humidity. The increase of specific humidity in lower layer may strengthen the convective instability and be conductive to the development of convection. The release of latent heat in ascending is an important mechanism for extracting kinetic energy from instability energy which is described both in CISK (Conditional Instability of Second Kind; Charney and Eliassen, 1964) and WISHE (Wind Induced Surface Heat Exchange; Emanuel, 1986; Emanuel, 2003; Rotunno and Emanuel, 1987) theories. The specific humidity at 850 hPa are shown in shadow plot in Figure 10. Either in El Niño years or in La Niña years, The MTC tends to occur in the air with more moisture in phase 2 (Figures 10A,C) and is inactive in a dry circumstance in phase 5 (Figures 10B,D). The center of positive specific humidity is mostly related to the cyclonic shear of horizontal wind. By analyzing the humidity budget, there is significantly moisture convergence in cyclonic wind shear, vice versa. Except that the convergent flow is conductive to the confluence of moisture, the strengthened westerly will support more increase of moisture in phases 2–3, for the most MTC genesis takes place to the southwest of the dry subtropical high. What’s more, the divergent flow in the anticyclone over Japan is stronger in El Niño EAP than that in La Niña EAP, drying the air and inhibiting the TC genesis there.
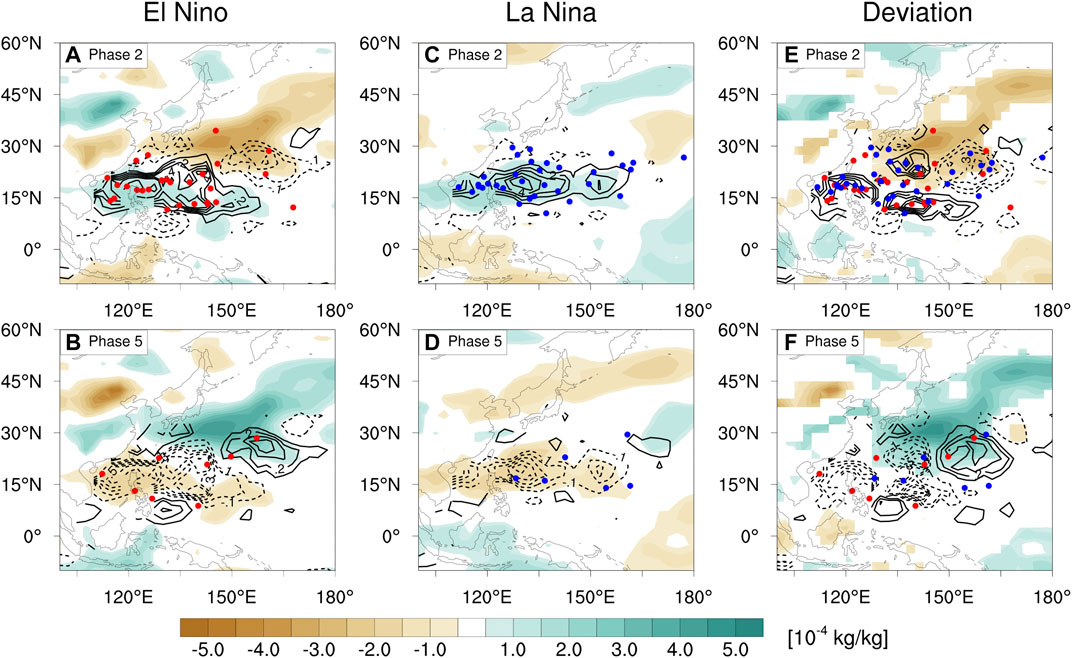
FIGURE 10. The composition of specific humidity (kg/kg, shaded) at 850 hPa and GPI (contour) with the period of 20–30 days for El Niño years (A–B) and 50–70 days for La Niña years (C–D) and their difference (El Niño minus La Niña) fields (E–F) based on the phase of the EAP index. The deviations are passing the 95% confidence level. The black (green) dots represent the positions of MTC genesis in El Niño (La Niña) summers.
The relative humidity in middle layer also plays an important role in energy conversion. The saturation of air in middle layer promotes the latent heat release. The relative humidity at 600 hPa is higher in the active phases for MTC genesis, especially in phase 2 (figure not shown). The distribution of relative humidity in middle layer is somewhat in accordance to that of the OLR anomaly, because the relative humidity in middle layer is mainly controlled by ascending motion. The active convection transports high mean humidity upward and makes saturate air stretching into the higher layer. A westward movement of positive relative humidity anomaly center is clearly seen in phases 1–3 of El Niño EAP.
The GPI (shown by contour in Figure 10) comprehensively combines the dynamical and thermodynamic conditions needed for TC formation. The previous studies on ISO proved a good consistent between the composition anomalies of GPI and TC genesis frequency over the WNP and the northern Indian Ocean based on the oscillation phases (Carmargo et al., 2009; Kikuchi and Wang, 2010; Zhao et al., 2015a; Zhao et al., 2015b), which suggests a ability of GPI to unveil the potential of TC genesis in intraseasonal scale. Here we will apply this index to carefully analyze the modulation of EAP ISV on the environment parameters for MTC genesis.
For the El Niño EAP, the GPI firstly appear to be positive in EWNP-CNP since phase 5, and that over SCS and WWNP turn to be positive since phase 1 (figure not shown). In phase 2, the GPI anomalies appear positive in the SCS and WNP and negative in EWNP-CNP around 20°N, and negative GPI anomaly occurs over Japan. The positive GPI rapidly shrink westward to the SCS in phase 3 and GPI becomes negative over SCS and WWNP in phase 4 (figure not shown). The variation of positive GPI agrees with the westward change of MTC genesis position as the ISV evolution of EAP. In comparison, the GPI positive anomalies in La Niña years firstly occur in phase 6 in WWNP (figure not shown), and stretches eastward to around 165°E in phase 2. This changes also corresponds to the eastward movement of mean position of MTC. Thus, the positive ISV of GPI composited based on the EAP ISV phase is considered to be able to reflect the area where the MTC genesis is active. In addition, the negative GPI anomaly near Japan is also much weaker in the La Niña EAP, suggesting a weaker inhibition of MTC genesis in higher latitudes, which is in accordance with our discussion in the preceding text. Such a difference is quantified in Figure 10E. In the difference map, a positive difference near 15°N and a negative difference to the north suggest more MTC genesis events in the lower latitudes during El Niño summers.
To further investigate the contribution of each environmental variables consisting of the GPI as shown in Equation (3), the ISV of GPI is divided into four linear terms and 11 nonlinear terms as described in Tropical Cyclone Genesis Potential Index. Their contributions in three sea areas (the SCS, the WWNP and the EWNP-CNP) and northern/southern parts are depicted in Figure 11 with the same domain partition shown in Figure 7.
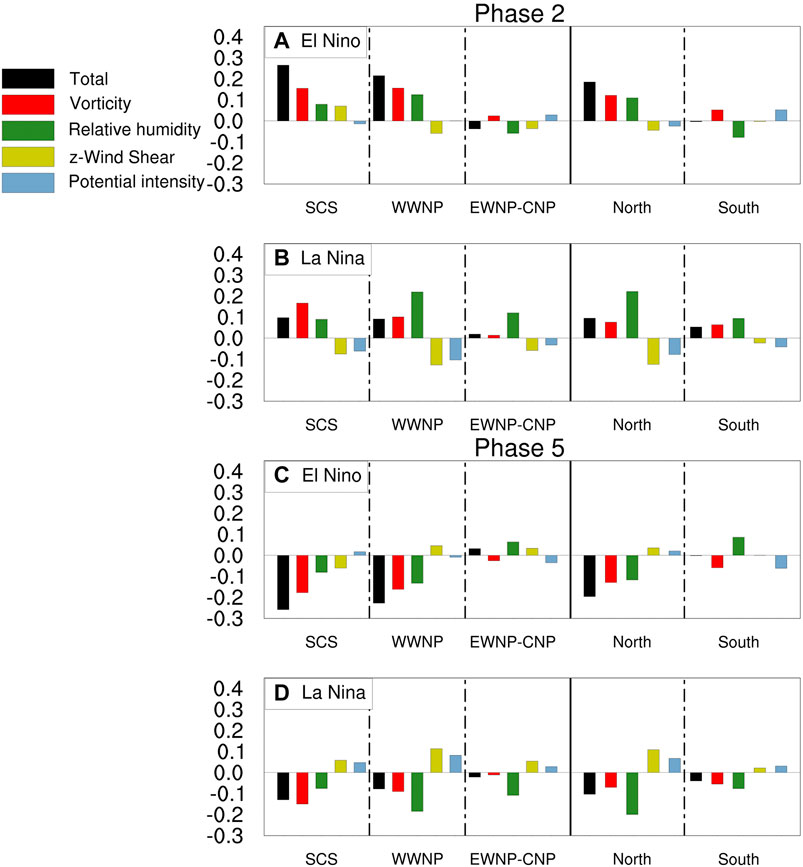
FIGURE 11. Composite budget terms of the total GPI anomalies based on phases of EAP-ISV over three sea areas and meridional partition in El Niño and La Niña years.
The zonal movement of MTC genesis position as well as beneficial conditions are clearly found according to the changes of positive GPI among three sea areas, as we discuss in the last paragraph. These changes are apparently unveiled in environmental vorticity, except that over the SCS in EAP phase 1 in El Niño years (figure not shown). This makes sense, for one of the characteristics of EAP-ISV is the disturbance of zonal wind accompanied with vorticity in the lower layer. The positive vorticity anomaly is in WWNP and EWNP-CNP in phase 1, in the SCS and the WWNP in phase 2, and only in SCS in phase 3 in El Niño years. The eastward stretch of positive contribution of environmental vorticity from phase 1 to phase 2 and westward shrinking in phase 3 are also found in La Niña years. As for the relative contribution of each variables in the initial stage of ISV disturbance (phase 1, figure not shown), the MTC genesis is triggered by positive vorticity and PI under the beneficial circumstance with low VWS both in El Niño and La Niña years, whereas the humidity is slightly unfavorable. The environmental vorticity (PI) makes relatively more contribution in El Niño (La Niña) years except the SCS region. Over the SCS, environmental PI plays a more important role both in El Niño and La Niña years. As EAP-ISV as well as GPI anomaly increasing (phase 2), the environmental vorticity and humidity are two dominant variables. To the east of 120°E over the WNP, the environmental vorticity (humidity) contributes more in El Niño (La Niña) years to the increase of GPI, and the environmental VWS and PI seem to be unfavorable. Over the SCS, however, vorticity makes most contribution both in El Niño and La Niña years and the humidity takes the second place. The significant difference takes place in the VWS with negative in El Niño years and positive in La Niña years. When the ISV disturbance shrinks westward in phase 3, the positive GPI concentrates in SCS with most contribution from vorticity. In addition, the humidity is also important in La Niña years.
In meridional direction, the positive GPI is stronger in southern part and its maximum propagates northward from phase 1 to phase 2 both in El Niño and La Niña years. However, the spacial oscillation of GPI anomalies are stronger in El Niño years with positive in south and negative in north, accounting for the more southern genesis of MTC. As we mentioned, the unfavorable conditions (negative vorticity in the lower layer and dry and high middle barometric layer) in the mid-latitude-pole of EAP is stronger to the north of 20°N in El Niño years. In case of the contribution of each variables of GPI, the opposite effect is clearly seen to come from environmental humidity. Turn to the southern parts, the positive GPI is mainly own to the contribution of environmental vorticity and humidity. In El Niño (La Niña) years, the environmental vorticity (humidity) makes greater contribution. In phase 3, the southern GPI turns to be negative after the smaller ISV disturbance continues moving northward in El Niño years, while the GPI is still positive in whole area but weakened in La Niña years. The southern and northern GPI seem to be out of phase in El Niño years but in phase in La Niña years, somewhat for the scale of anomaly is relatively larger in La Niña years.
In summary, the cyclonic flow in ISV disturbance directly affects the contribution of environmental vorticity to the positive GPI. This suggests an important role of vorticity in lower layer on the modulation of MTC genesis, which is also found by Jiang et al. (2012). In the initial stage of ISV disturbance, since humidity often plays a negative role on the MTC genesis, the MTCs are primarily triggered by environmental vorticity in El Niño years and energy extraction and conversion (as described in PI factor) from warm tropical sea in La Niña years, under the beneficial VWS circumstance. As the ISV disturbance moves and strengthens, the environmental vorticity and humidity make dominant positive contribution. This agrees with some studies on the role of ISV on MTC or TC genesis by GPI analysis (Carmago et al., 2009; Zhao et al., 2015a; Zhao et al., 2015b; You et al., 2019a). Furthermore, the environmental vorticity plays a more important role in El Niño years while the contribution of environmental humidity is more significant in La Niña years over the WNP excluding the SCS. This is in accordance with the study on the impact of ENSO on the TC genesis (Carmago et al., 2007). However, the contribution of each variable of GPI over the SCS seems to be less influenced by change of ENSO phase. A more southern genesis of MTC in El Niño years due to the relatively unfavorable humidity circumstance to the north of 20°N.
By reconstructing an EAP index, we examine the characteristics of the ISV of the EAP during the positive and negative phases of the ENSO through observational analyses. Both the spectral and regression analysis methods are used. The modulation of the EAP ISV on MTC and its physical mechanism are further investigated based on a phase composite analysis. The distinctive relationship between the ISV and MTC during the different phases of the ENSO is also examined.
The EAP index exhibits statistically significant power spectrum peaks in the 10–20-days, 20–40-days and 50–70-day periods, respectively. The ISV of the EAP during 1979–2019 can be classified into three types, a single period domination type (37%), a multiple period coexistence type (24%) and a transition type (39%). The EAP ISV tends to exhibit the single period domination type (the latter two types) during El Niño (La Niña), suggesting a higher predictability of the EAP ISV during El Niño. The origin and evolution characteristics of the EAP ISV differ markedly between the El Niño and La Niña summers. In the El Niño (La Niña) summers, the EAP ISV is dominated by a higher-frequency (lower-frequency) oscillation with a period of around 20–30 (50–70) days. The EAP ISV during the El Niño summers originates from the tropical WNP and is mainly affected by the northwestward propagation of the QBWO. This is in great contrast to that in La Niña summers in which the ISV perturbation is originated from the tropical Indian Ocean through the northeastward propagation.
The frequency and position of MTC genesis are greatly modulated by the EAP ISV. The MTC genesis tends to take place frequently at phases 1–2 (2–3) and less frequently at phases 4-5 (5–6) during El Niño (La Niña) summers. Especially, phase 2 (phase 5) is the most active (inactive) phase for MTC genesis, passing a 95% confidence level with the Monte Carlo significance test. The genesis position of MTC alters zonally as the EAP phase evolves. In the active phases, the mean longitude of MTC genesis shifts from the eastern WNP to the west coast of the Pacific in El Niño years, but only to the western WNP in La Niña years. The favorable MTC genesis location shifts northward during the active phases of the EAP ISV in both the El Niño and La Niña summers, and such shift appears to be more northern during the La Niña summers.
The impact of the EAP ISV on MTC genesis is modulated by the ENSO phase. The analysis indicates that the MTC genesis occurs under a favorable environmental condition with active convection, low-level cyclonic and convergent flows, upper-level divergent flow, higher moisture content and deeper saturation air. Due to the ENSO induced SSTA impact, the phases of the ISV are markedly different between the El Niño and La Niña summers. This results in distinctive thermodynamic and dynamical conditions over the WNP and the SCS, which further modulate the frequency and location of MTC genesis.
To assess the relative importance of the environmental factors, we further analyze the contribution of these factors to the ISV of the GPI. The environmental vorticity always makes a positive contribution to the positive GPI anomaly. This is because the ISV of the EAP during the active phase is characterized by a favorable cyclonic flow condition in lower troposphere. However, its contribution can be modified by other factors. In phase 1, the environmental humidity is unfavorable, and as a result, the MTC is triggered primarily by the environmental vorticity (PI) condition associated with El Niño (La Niña), under a moderate VWS circumstance. When the ISV disturbance propagates and strengthens, the vorticity and humidity factors play a dominant role in increasing the GPI, while VWS and PI have an opposite effect. The opposing effect is due to the fact that an intensified flow increases the VWS while an increased air humidity slows down the surface latent heat flux and thus energy extraction from the ocean. The environmental vorticity (humidity) makes a greater contribution in the WNP (east of 120°E) in El Niño (La Niña) summers. These conclusions are generally in accordance with the previous MJO impact studies (e.g., Carmago et al., 2009; Jiang et al., 2012; Zhao et al., 2015a; Zhao et al., 2015b) and the previous ENSO impact studies (Carmago et al., 2007). However, the current study reveals a detailed regional characteristic. For example, the PI and vorticity fields in SCS make a greater contribution in phase 1 and phase 2 respectively, which is less influenced by ENSO. In meridional direction, a more southern location of MTC genesis during El Niño summers is attributed to the negative effect of environmental humidity. Finally, it is noteworthy that, even though the MTC in phase 4 of EAP ISV during La Niña is somewhat active, the GPI seems not conductive. A further study is needed to reveal other possible processes that affect the MTC genesis.
The original contributions presented in the study are included in the article/Supplementary Material, further inquiries can be directed to the corresponding authors.
JG proposed the research, and LX and LW realized it. LX, WZ, and JG collected and prepared the data. LX, LW and XC made tables and figures, and analyzed the data. JG and LW interpreted the results and composed the manuscript.
This study was supported by the National Key R&D Program of China (Grants 2018YFC1505805 and 2018YFC1505906) and the National Natural Science Foundation of China (41575052).
The authors declare that the research was conducted in the absence of any commercial or financial relationships that could be construed as a potential conflict of interest.
Camargo, S. J., Wheeler, M. C., and Sobel, A. H. (2009). Diagnosis of the MJO modulation of tropical cyclogenesis using an empirical index. J. Atmos. Sci. 66, 3061–3074. doi:10.1175/2009JAS3101.1
Carmago, S. J., Emanual, K. A., and Sobel, A. H. (2007). Use of genesis potential index to diagnose ENSO effects on tropical cyclone genesis. J. Clim. 20, 4819–4834. doi:10.1175/JCLI4282.1
Charney, J. G., and Eliassen, A. (1964). On the growth of the hurricane depression. J. Atmos. Sci. 21, 68–75. doi:10.1175/1520-0469(1964)021<0068:OTGOTH>2.0.CO;2
Ding, Y., and Liu, Y. (2008). A study of the teleconnection in the Asian-Pacific monsoon region. Acta Meteorol. Sin. 66 (5), 670–682. doi:10.1007/s00382-019-05031-5
Emanuel, K. A. (2000). A statistical analysis of tropical cyclone intensity. Mon. Weather Rev. 128, 1139–1152. doi:10.1029/2006GL026942
Emanuel, K. A. (1986). An air-sea interaction theory for tropical cyclones. Part I: steady-state maintenance. J. Atmos. Sci. 43, 585–605.
Emanuel, K. A. (1995). Sensitivity of tropical cyclones to surface exchange coefficients and a revised steady-state model incorporating eye dynamics. J. Atmos. Sci. 52, 3969–3976.
Emanuel, K. A. (2003). The theory of hurricanes. Annu. Rev. Fluid Mech. 23 (1), 179–196. doi:10.1146/annurev.fl.23.010191.001143
Emanuel, K. A., and Nolan, D. S. (2004). Tropical cyclone activity and the global climate system. Preprints, 26th Conf. on Hurricanes and Tropical Meteorology, Miami, FL, Amer. Meteor., 10A.2.
Fu, B., Li, T., Peng, M., and Weng, F. (2007). Analysis of tropical cyclone genesis in the western North Pacific for 2000 and 2001. Weather Forecast 22, 763–780. doi:10.1002/2015GL06396
Gao, J., and Li, T. (2011). Factors controlling multiple tropical cyclone events in the Western North Pacific. Mon. Weather Rev. 139, 885–894. doi:10.1175/2010MWR3340
Gao, J., and Li, T. (2012). Interannual variation of multiple tropical cyclone events in the western north pacific. Adv. Atmos. Sci. 29, 1279–1291. doi:10.1007/s00376-012-1031-1
Gray, W. M. (1968). Global view of the origin of tropical disturbances and storms. Mon. Weather Rev. 96 (10), 669–700.
Gray, W. M., and James Glaisher House, (1979). “Hurricanes: their formation, structure and likely role in the tropical circulation,” in Meteorology over the tropical oceans. Editor D. B. Shaw (Bracknell: Berkshire), 155–218.
Han, X., Zhao, H., Li, X., Raga, G. B., Wang, C., and Li, Q. (2020). Modulation of boreal extended summer troapical cyclogenesis over the northwest Pacific by the quasi-biweekly oscillation under different El Niño-southern oscillation phases. Int. J. Climatol. 40 (2), 858–873. doi:10.1002/joc.6244
Hartmann, D. L., and Meloney, E. D. (2001). The Madden-Julian oscillation, barotropic dynamics, and north tpacific tropical cyclone formation. Part II stochastic and barotropic modeling. Journal of the Atmosphere Sciences 58, 2559–2570. doi:10.1175/1520-0469(2001)058<2559:TMJOBD>2.0
He, J., Duan, A., and Huang, Y. (2013). On the relationship between MJO and clustering of Tropical cyclone Activities over the Western North Pacific. Adv. Meteorol. Sci. Technol. 3, 46–51. doi:10.1007/s00703-005-0126-y
Hsu, H., and Lin, S. (2007). Asymmetry of the tripole rainfall pattern during the East Asian summer. J. Clim. 20 (7), 4443–4458. doi:10.1175/JCLI4246.1
Huang, R., and Li, W. (1988). Influence of heat source anomaly over the western tropical Pacific on the subtropical high over East Asia and its physical mechanism. Chin. J. Atmos. Sci. 12 (s1), 107–116.
Huang, R., and Li, W. (1987). “Influence of the heat source anomaly over the tropical west Pacific on the subtropical high over East Asian”, in paper presented at the Proceeding of International conference on the general circulation of East Asia, Chengdu, 40–51.
Huang, R. (1990). Studies on the teleconnections of the general circulation anomalies of East Asia causing the summer drought and flood in China and their physical mechanism. Sci. Atmos. Sin. 14 (1), 108–117.
Huang, R., and Sun, F. (1994). Impacts of thermal State and the convective activities in the Tropical Western Warm pool on the Summer climate Anomalies in East Aisa. Sci. Atmos. Sin. 18 (2), 141–151.
Huang, R., and Sun, F. (1992). Interannual variation of the Summer Teleconnection Pattern over the Northern hemisphere and its Numerical simulation. Chin. J. Atmos. Sci. 16 (1), 52–61.
Huang, R., and Wang, L. (2010). Interannual variation of the landfalling locations of Typhoons in China and its association with the Summer East Asia/Pacific Pattern Teleconnection. Chin. J. Atmos. Sci. 34 (5), 853–864. doi:10.1007/s00382-017-3558-4
Huang, R., Zhou, L., and Chen, W. (2003). The progresses of krecent studies on the variabilities of the East Asian monsoon and their causes. Adv. Atmos. Sci. 20 (1), 55–69. doi:10.1029/2009JD012502
Jiang, X. A., Zhao, M., and Waliser, D. E. (2012). Modulation of tropical cyclones over the Eastern Pacific by the intraseasonal variability simulated in an AGCM. J. Clim. 25, 6524–6538. doi:10.1175/JCLI-D-18-0357.1
Kikuchi, K., and Wang, B. (2010). Formation of tropical cyclones in the Northern Indian ocean associated with two types of tropical intraseasonal oscillation modes. J. Meteorol. Soc. Jpn. 88, 475–496. doi:10.2151/jmsj.2010-313
Kikuchi, K., Wang, B., and Fudeyasu, H. (2009). Genesis of tropical cyclone Nargis revealed by multiple satellite observations. Geophys. Res. Lett. 36 (6), L06811. doi:10.1029/2009GL037296
Lai, Q., Gao, J., Zhang, W., and Guan, X. (2020). Influences of the equatorial waves on multiple tropical cyclone genesis over the western North Pacific. Terr. Atmos. Ocean Sci. 31 (2), 227–238. doi:10.3319/TAO.2020.03.20.01
Li, C.-Y., Zhou, W., and Li, T. (2014). Influences of the Pacific-Japan teleconnection pattern on synoptic-scale variability in the western North Pacific. J. Clim. 27 (1), 140–154. doi:10.1175/JCLI-D-13-00183.1
Li, L. (2004). The climatological study of the intraseasonal oscillation of the Air-sea system. Nanjing Institute of Meteorology, [Disseration/Doctoral thesis]. [Nanjing (Jiangsu)]
Li, T. (2012). “Synoptic and climatic aspects of tropical cyclogenesis in Western North Pacific” in Chap. 3. Editors K. Oouchi, and H. Fudeyasu (Hauppauge, NY: Nova Science Publishers, Inc.), 61–94.
Li, Z., Yu, W., Li, T., Murty, V. S. N., and Tangang, F. (2013). Bimodal character of cyclone climatology in Bay of Bengal modulated by monsoon seasonal cycle. J. Clim. 26 (3), 1033–1046. doi:10.1007/s00382-015-2826-4
Liebmann, B., and Smith, C. A. (1996). Description of a complete (interpolated) outgoing longwave radiation dataset. Bull. Am. Math. Soc. 77, 1275–1277.
Lin, A., and Li, T. (2008). Energy spectrum characteristics of boreal summer intraseasonal oscillations: climatology and variations during the ENSO developing and decaying phases. J. Clim. 21, 6304–6320. doi:10.1175/2008JCLI2331.1
Lin, J., He, J., and Zhang, Y. (1999). Relationship of summer EAP to the rainfall in the middle-lower reaches of the Yangtze River. J. Nanjing Inst. Meteorol. 22 (3), 312–320.
Liu, F., Li, T., Wang, H., et al. (2016). Modulation of Boreal Summer intraseasonal oscillations over the Western North Pacific by ENSO. J. Clim. 29, 7189–7201. doi:10.1175/JCLI-D-15-0831.1
Liu, F., and Lin, H. (1990). A study on the characteristics of the low frequency oscillation over West Pacific and its relations with subtropical high and typhoon. Acta Meteorol. Sin. 48, 303–317.
Lu, R. (2004). Associations among the components of the East Asian summer monsoon system in the meridional direction. J. Meteor. Soc. Japan 82 (1), 155–165. doi:10.2151/jmsj.82.155
Lyu, M., Wen, M., and Wu, Z. (2018). Possible contribution of the interannual Tibetan plateau snow cover variation to the madden-Julian oscillation convection variability. Int. J. Climatol. 38, 787–3800. doi:10.1002/joc.5533
Maloney, E. D., and Hartmann, D. L. (2000). Modulation of hurricane activity in the gulf of Mexico by the Madden-Julian oscillation. Science 287, 2002–2004. doi:10.1126/science.287.5460.2002
McDonald, R. E., Bleaken, D. G., Cresswell, D. R., Pope, V. D., and Senior, C. A. (2005). Tropical storms: representation and diagnosis in climate models and the impacts of climate change. Clim. Dynam. 25, 19–36. doi:10.1007/s00382-004-0491-0
Nitta, T. (1987). Convective activities in the tropical Western Pacific and their impact on the northern Hemisphere sommer circulation. J Meteor. Soc. Japan. 65, 373–432.
Rotunno, R., and Emanuel, K. A. (1987). An air–sea interaction theory for tropical cyclones. Part II: evolutionary study using a nonhydrostatic axisymmetric numerical model. J. Atmos. Sci. 44, 542–561.
Sun, Y., Xu, H., and Deng, J. (2014). Interdecadal variation in Pacific-Japan Teleconnection Patterns and Possible causes. Chin. J. Atmos. Sci. 38 (6), 1055–1065. doi:10.1175/JCLI-D-19-0588.1
Sun, Z., Mao, J., and Wu, G. (2009). Influences of intraseasonal oscillations on the clustering of the tropical cyclone activities over then western North Pacific during boreal summer. Chin. J. Atmos. Sci. 33 (5), 950–958. doi:10.1175/JCLI3934.1
Wang, B., and Chan, J. C. L. (2002). How strong ENSO events affect tropical storm activity over the western North Pacific. J. Clim. 15, 1643–1658. doi:10.1175/1520-0442(2002)015<1643:HSEEAT>2.0.CO;2
Wang, H., and Fan, K. (2007). Relationship between the Antarctic oscillation and the western North Pacific typhoon frequency. Chin. Sci. Bull. 52 (4), 561–565. doi:10.1007/s11434-007-0040-4
Wang, H., Sun, J., and Fan, K. (2007). Relationships between the North Pacific oscillation and the typhoon/hurricane frequencies. Sci. China E 50 (9), 1409–1416. doi:10.1007/s11430-007-0097-6
Wang, Z., Wu, R., and Lau, K. M. (2001). Interannual variability of the Asian Summer monsoon: contrasts between the Indian and the Western North Pacific-East Asian monsoon. J. Clim. 14 (20), 4073–4090. doi:10.1175/1520-0442(2001)014<4073:IVOTAS>2.0
Wu, J., Xu, X., Jin, F., and Guo, P. (2013). Research of the intraseasonal evolution of the East Asia Pacific pattern and the maintenance mechanism. Acta Meteorol. Sin. 71 (3), 476–491. doi:10.1175/JCLI-D-19-0661.1( in Chinese)
You, L., Gao, J., Lin, H., et al. (2019a). Impact of the intraseasonal oscillation on tropical cyclone genesis over the western North Pacific. Int. J. Climatol 39 (4), 1969–1984. doi:10.1002/joc.5927
You, L., Gao, J., Wei, P., et al. (2019b). Multiscale circulation characteristics affecting the multiple tropical cyclonenesis in midsummer of 2018. Trans. Atmos. Sci. 42 (5), 725–736. doi:10.13878/j.cnki.dqkxxb.20190701001
Zhang, W., Gao, J., Cheung, K. K. W., et al. (2020). Intraseasonal variability of the genesis potential index and its relationship with tropical cyclogenesis over the western North Pacific. Int. J. Climatol 2020, 40. doi:10.3390/atmos11020183
Zhang, X., Zhong, S., Wu, Z., and Li, Y. (2017). Seasonal prediction of the typhoon genesis frequency over the Western North Pacific with a Poisson regression model. Clim. Dynam. 51, 4585–4600. doi:10.1007/s00382-017-3654-5
Zhao, Chen., and Li, T. (2019). Basin dependence of the MJO modulating tropical cyclone genesis. Clim. Dynam. 52 (9-10), 6081–6096. doi:10.1007/s00382-018-4502-y
Zhao, C., Ren, H.-L., Eade, R., Wu, Y., Wu, J., and MacLachlan, C. (2019). MJO modulation and its ability to predict boreal summer tropical cyclone genesis over the northwest Pacific in Met Office Hadley Centre and Beijing Climate Center seasonal prediction systems. Q. J. R. Meteorol. Soc. 145, 1089–1101. doi:10.1002/qj.3478
Zhao, H., Jiang, X., and Wu, L. (2015a). Modulation of Northwest Pacific tropical cyclone genesis by the Intraseasonal variability. J. Meteorol. Soc. Jpn. 93, 81–97. doi:10.2151/jmsj.2015-006
Zhao, H., Yoshida, R., and B., R. G. (2015b). Impact of the Madden-Julian oscillation on Western North Pacific Tropical cyclogenesis Associated with large-scale Patterns. J. Appl. Meteor. Climatol. 54, 413–1429. doi:10.1175/JAMC-D-14-0254.1
Zhu, L., Wang, Y., and Yin, Z. (2013). Relationship between tropical cyclone activity over the South China Sea and tropical ISO propagation. J. Trop. Meteorol. 29, 737–748. doi:10.3390/atmos11040423
Zong, H., Zhan, g. Q., and Chen, L. (2008). A study of the processes of East Asia-Pacific teleconnection pattern formation and the relationship to ENSO. Chin. J. Atmos. Sci. 32 (2), 220–230. doi:10.1371/journal.pone.0234421
Keywords: East Asia–Pacific teleconnection, multiple tropical cyclone genesis, ENSO, intraseasonal variability, Western North Pacific
Citation: Lin X, Wang L, Gao J, Chen X and Zhang W (2021) Intraseasonal Variability of the East Asia-Pacific Teleconnection and Its Impacts on Multiple Tropical Cyclone Genesis Over the Western North Pacific. Front. Earth Sci. 8:598043. doi: 10.3389/feart.2020.598043
Received: 23 August 2020; Accepted: 07 December 2020;
Published: 15 January 2021.
Edited by:
Ruifen Zhan, Fudan University, ChinaReviewed by:
Ruiqiang Ding, Beijing Normal University, ChinaCopyright © 2021 Lin, Wang, Gao, Chen and Zhang. This is an open-access article distributed under the terms of the Creative Commons Attribution License (CC BY). The use, distribution or reproduction in other forums is permitted, provided the original author(s) and the copyright owner(s) are credited and that the original publication in this journal is cited, in accordance with accepted academic practice. No use, distribution or reproduction is permitted which does not comply with these terms.
*Correspondence: Jianyun Gao, ZnpnYW9qeXVuQDE2My5jb20=
†These authors contributed equally to this article
Disclaimer: All claims expressed in this article are solely those of the authors and do not necessarily represent those of their affiliated organizations, or those of the publisher, the editors and the reviewers. Any product that may be evaluated in this article or claim that may be made by its manufacturer is not guaranteed or endorsed by the publisher.
Research integrity at Frontiers

Learn more about the work of our research integrity team to safeguard the quality of each article we publish.