- 1School of Atmospheric Science, Nanjing University of Information Science and Technology, Nanjing, China
- 2Key Laboratory of Cities’ Mitigation and Adaptation to Climate Change in Shanghai, Shanghai Regional Climate Center, China Meteorological Administration, Shanghai, China
- 3The Institute of Climate and Application Research, Nanjing University of Information Science and Technology, Nanjing, China
- 4National Climate Center, China Meteorological Administration, Beijing, China
Sub-seasonal variability in meridional activity of Western Pacific subtropical high (WPSH) exerts important influences on anomalous weather and climate in East Asian monsoon region. By using a sub-seasonal meridional index of the WPSH, the characteristics and atmospheric evolutions in association with the sub-seasonal meridional activity of the WPSH during boreal late summer are investigated. The meridional activity of the WPSH exhibits distinctive low frequency oscillation (LFO), with two dominant periods of 10–30 days and 40–50 days. The 10–30 days LFO is influenced by wave trains in mid-high latitudes and convection propagating from tropic. For the northward advance of the WPSH, in the high latitudes, teleconnection wave train originating from Atlantic Ocean propagates eastward, then the negative potential vortex anomalies enhance the high-level divergence in Northeast Asia. In the mid-latitudes, the 10–30 days low frequency wave train from North America propagates westward and influences the pressure field along the East Asia coast, whose energy is gained from the westerly jet through barotropic process. In the tropic, on time scale of 10–30 days, anomalous convections over the equatorial western Pacific propagate northwestward and trigger cyclone-anticyclone circulation anomalies along the East Asia coast, which in turn affect the meridional position of the WPSH. The 40–50 days LFO of meridional activity of WPSH is closely related to the convection anomalies under the interaction between Madden-Julian Oscillation (MJO) and monsoon intra-seasonal oscillation (MISO). The tropical MJO propagates eastward from the equatorial Indian Ocean to West Pacific and then propagates northward, in accompany with the northeastward propagation of anomalous convection teleconnection covering the tropical Indian Ocean-North Indian Peninsula-Northwest Pacific, resulting in the anomalous anti-cyclonic circulation over Northwest Pacific, which contributes to the northward advance of the WPSH. For the southward retreat of the WPSH, the contrary is the case in 10–30 days atmospheric LFO while relatively weaker 40–50 days atmospheric LFO does less contribution to the southward retreat of the WPSH.
Introduction
Western Pacific Subtropical High (WPSH) is a warm high-pressure system located in the middle and lower troposphere over the western Pacific. The WPSH is an important member of the East Asian monsoon system, and anomalies in its position and intensity have an important impact on weather and climate in East Asia (Wu et al., 2002; Ding and Chan, 2005; Yang et al., 2010; Yang et al., 2014). Spatial distribution and persistence of rainfall belt, drought and tropical cyclone paths in East Asia are closely related to the anomalies in advance or retreat of the WPSH (Tao and Chen, 1987; Lee S. S. et al., 2013). In recent years, sub-seasonal anomalies of the WPSH have become increasingly frequent, and catastrophic events such as persistent heavy rainfall, extreme heat wave and drought have also frequently occurred in summer in China (Zhang et al., 2013). For example, in July-August of 2018, the WPSH was northernmost since 1961, leading to continuous heat waves in north China and more typhoons hitting further north in China (Ding et al., 2019). The historical extreme Meiyu in the Yangtze River-Huaihe Basin during June–July of 2020 is connected with quasi-biweekly oscillation (QBWO) of the WPSH (Liu and Ding, 2020). It can be seen that the meridional activity of the WPSH on sub-seasonal time scale distinctively affects the weather and climate anomalies in East Asia especially during summer. Studies on the sub-seasonal variability of the WPSH meridional activity are helpful to deepen the understanding of extreme climate events and support for the improvement of sub-seasonal prediction in East Asia.
Intra-seasonal oscillation (ISO) is both the strongest signal in tropical convection and an important part of global atmospheric circulation. Madden and Julian (1971) first discovered that ISO exists in tropical atmosphere, which is called Madden-Julian Oscillation (MJO). It has also been proved that ISO is widespread in subtropical and mid-high latitudes (Anderson and Rosen, 1983; Li, 1991). Compared with MJO, ISO is more complex in mid-high latitude, and it mainly propagates westward. In summer, ISO sometimes propagates eastward in high latitudes, and its propagation is highly regional (Chen et al., 1991; Huang, 1994). Different from the baroclinic vertical structure of MJO in the tropic, ISO in mid-high latitudes exhibits barotropic vertical structure, and its horizontal structure reflects the characteristics of Rossby wave train in some regions (Li et al., 1993). Global ISO can be linked through low frequency atmospheric teleconnections, thus further influencing the global weather and climate system (Li, 1991). ISO also exists in the monsoon region, called monsoon intra-seasonal oscillation (MISO, Waliser, 2006), which is closely related to the establishment, activation and interruption of monsoon (Wang, 2008). MISO propagates northward in Indian Ocean (Krishnamurthy and Shukla, 2008) and northwestward in Northwest Pacific (Lau and Chan, 1987; Nitta, 1987). Because the active region of MISO is close to the subtropics, it can affect mid-latitude ISO (Kawamura, et al., 1996) or interact with the wave trains in mid-latitudes (Ding and Wang, 2007).
WPSH, as one of the most important circulation systems in mid-latitudes, has low frequency oscillations (LFO) with periods of quasi-20 days and 30–60 days (Liu and Lin, 1990; Wu et al., 2002; Wen and He, 2002; Ding, 2007; Su et al., 2017; Yang and Li, 2020). Zonal variability of the WPSH has been pronouncedly observed on sub-seasonal time scale (Huang, 1963; Tao and Zhu, 1964; Kawatani et al., 2008), which significantly influences the location and intensity of rainfall belts in East China by affecting the transport of low-level moisture (Liu et al., 2008; Mao et al., 2010). Guan et al. (2019) put forward that the zonal variability of the WPSH is jointly influenced by EAP (East Asia-Pacific pattern, Nitta, 1987; Huang and Li, 1988) and SRP (Silk Road pattern, Lu et al., 2002) in early summer, and is mainly influenced by EAP teleconnection in mid-summer. Yang and Li (2020) revealed that the QBWO of zonal location of the WPSH is closely related to a northwestward-propagating QBWO mode over the western North Pacific. The dominant variation in meridional position of the WPSH is mainly manifested as two obvious northward jumps in summer, in accompany with two obvious sudden jumps of the East Asian summer monsoon rainfall belt, which exhibits the feature of climatological intra-seasonal oscillation (CISO, Wang and Xu, 1997) in meridional activity of the WPSH. However, the two northward jumps of the WPSH also have the characteristics of north-south swing. In other words, the WPSH always moves northward gradually in the climatologically periodic changes of north jump and south retreat (Huang, 1978; Bi, 1989). Sea surface temperature (SST) anomaly in Indian Ocean and Pacific Ocean can indirectly lead to seasonal anomalies in the position and intensity of the WPSH by affecting convection or atmospheric heating (Yang et al., 2007; Xie et al., 2009; Wang et al., 2013). Westerlies, tropical cyclones and South Asia high can directly lead to abnormal activities of the WPSH by causing atmospheric circulation anomalies (Zhang and Tao, 1998; Zhang and Tao, 2003; Wu et al., 2002). However, current studies mainly focus on seasonal anomaly or zonal variability of the WPSH on sub-seasonal time scale. What is the mechanism of the WPSH meridional variability on sub-seasonal time scale? This issue is still unclear. Some studies suggested that the meridional position variation of the eastern Pacific subtropical high could lead to abnormal advance or retreat of the WPSH through the westward propagation of the low frequency wave train (Yu and Yang, 1995). The propagation of Rossby inertia gravity solitary wave can realize the teleconnection between the eastern and western Pacific subtropical high (Zhang et al., 2013). The WPSH is also affected by the southwest dispersion of the low frequency circulation system in the Gulf of Alaska and Sea of Okhotsk at mid-high latitude (Han et al., 2010). However, the physical processes of global atmospheric LFO affecting the meridional activities of the WPSH on sub-seasonal time scales are still unclear. Since the WPSH is an important bridge for global atmospheric anomalies to influence extreme weather and climate in East Asia (Wang, 2008), studies on the mechanism of the sub-seasonal variability of the meridional location of the WPSH can provide relevant scientific basis for sub-seasonal predictions of extreme weather and climate anomalies in East Asia. Data and Method introduces data and methods including a definition on an index of sub-seasonal meridional activity of the WPSH. The 10–30 Days Low Frequency Oscillation of Meridional Activity of WPSH and Fourty to Fifty Days LFO of Meridional Activity of Western Pacific Subtropical High investigate the atmospheric LFO in the tropical and mid-high latitudes associated with the WPSH on sub-seasonal time scale of 10–30 days and 40–50 days respectively. Conclusion and discussion are given in Conclusion and Discussion.
Data and Method
The daily circulation data including geopotential height, temperature and wind with a resolution of 2.5° × 2.5° from 1980 to 2019 are extracted from the National Centers for Environmental Prediction/Department of Energy (NCEP/DOE) Reanalysis 2 (Kanamitsu et al., 2002, https://psl.noaa.gov/data/gridded/data.ncep.reanalysis2.html). The daily mean outgoing longwave radiation (OLR) with a spatial resolution of 2.5° × 2.5° from the National Oceanic and Atmospheric Administration (NOAA) is used as a proxy for convection (Liebmann and Smith, 1996, https://psl.noaa.gov/data/gridded/data.interp_OLR.html). The low frequency components are obtained from the Lanczos band-pass (Duchon, 1979) filtered daily time series by firstly taking a 7-days running mean after removal of the daily climatology. Ridge line of the WPSH is used to determine the meridional position of the WPSH, which is specifically defined as the average latitude of the zonal wind shear line (u = 0, ∂u/∂y > 0) in the WPSH body (north of 10°N and within the range of 110°E–150°E) surrounded by 5880 geopotential meter (gpm) isoline at 500 hPa (Liu et al., 2012; Liu et al., 2019). If no 5880 gpm isoline can be found, it is defined as the average latitude of the zonal wind shear line of the WPSH surrounded by 5840 gpm.
The ridge line position of WPSH is regressed on 500 hPa geopotential height field (Z500, Figure 1A) to define a sub-seasonal meridional activity index of the WPSH (WPSH_SMI). The study focuses on the WPSH in late summer (July–August), due to the relatively smaller amplitude of the sub-seasonal component in the meridional variation of WPSH during early summer (June) (Su et al., 2017). It is found that in East Asian coastal area-West Pacific region, the dipole distribution of geopotential height anomalies on both the north and south sides of 30°N has the most significant impact on the meridional activity of the WPSH. By choosing the central areas of the dipole distribution as the key areas, the WPSH_SMI is defined as:
Where, Z′ represents the low frequency component of geopotential height field at 500 hPa. The WPSH moves more northerly on sub-seasonal time scale when the index is positive. And the WPSH southward retreats when the index is negative. The correlation coefficient between the WPSH_SMI and ridge line location of the WPSH is 0.71, which is statistically significant at a 0.01 level according to a Student’s t test. Therefore, the WPSH_SMI can be used to represent the sub-seasonal meridional activity of the WPSH.
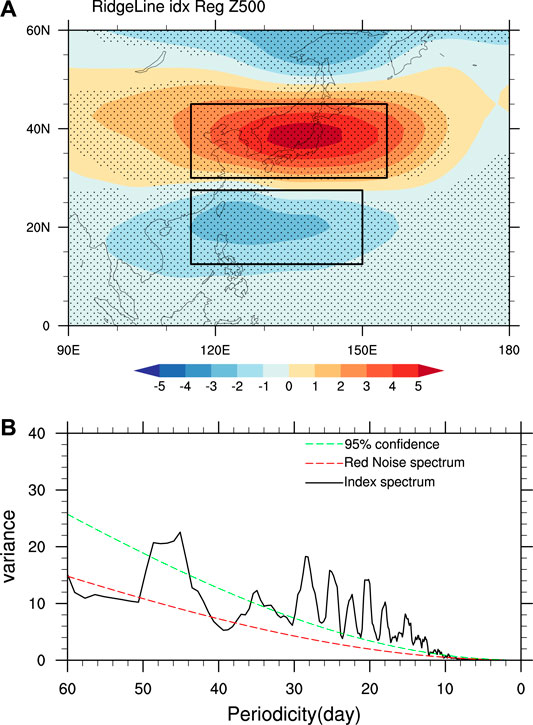
FIGURE 1. (A) Regressions of 500 hPa geopotential height (unit: gpm) onto ridge line index of WPSH during July-August of 1980–2019 (The dots denote the areas statistically significant at the 0.05 level, and the black box indicates the key areas for the index of WPSH_SMI). (B) Power spectra of the WPSH_SMI, with Markov red noise spectrum (red line) and spectrum significant at the 0.05 level (green line).
Two LFO periods (10–30 days and 40–50 days) in the WPSH_SMI are clearly illustrated by the power spectrum (Blackman et al., 1960) analysis (Figure 1B), which is similar with the period of 10–40 days in the zonal location variability of the WPSH (Guan et al., 2019). Further wavelet analysis (Morlet et al., 1982) of the daily WPSH_SMI shows that the WPSH_SMI has a period of 10–30 days (with variance contribution rate 28%) every year (figure omitted). In comparison with the 10–30 days LFO, the impact of 40–50 days LFO is much smaller, accounting for 2% of the variance of the WPSH_SMI. And there are 22 years with 40–50 days LFO during the 40 years from 1980 to 2019. The 10–30 days and 40–50 days LFO components are filtered out from the daily WPSH_SMI (hereafter called WPSH_SMI_10-30d and WPSH_SMI_40-50d respectively) to carry out phase composite analysis. Each cycle of LFO is divided into 8 phases. Phase 1 (5) represents the minimum (maximum) index corresponding to the southernmost (northernmost) position of the WPSH on sub-seasonal time scale. Phase 3 (7) indicates that the WPSH is shifting from south (north) to north (south). Phase 2 and 8 (4 and 6) represent about half of the minimum (maximum) value of the index.
The three-dimensional wave activity flux W defined by Takaya and Nakamura (2001) is used to diagnose the energy dispersion characteristics of Rossby waves in association with the WPSH_SMI.
Where,
The barotropic energy conversion (CK) is also applied in this study. It is computed as follows (Simmons et al., 1983):
Where,
The 10–30 Days Low Frequency Oscillation of Meridional Activity of Western Pacific Subtropical High
Related Mid-latitude 10–30 Days Intraseaonal Source
The 5880 isoline of geopotential height at 500 hPa is usually used to represent the boundary of the WPSH. Figure 2 shows the evolution of 5,880 isoline for eight phases in one cycle of WPSH_SMI_10-30d. From phase 1 to phase 5, the WPSH gradually moves northward. And the ridge line of the WPSH reaches near 32.5°N at phase 5, with 10 latitudes northward advance from phase 1. From phase 5 to phase 8, the WPSH gradually withdraws from Northwest Pacific to West Pacific, indicating that the 10–30 days oscillation of WPSH_SMI can reflect the abnormal variations in the meridional position of the WPSH on sub-seasonal time scale of 10–30 days.

FIGURE 2. The composites WPSH represented by 5,880 geopotential meter (gpm) at 500 hPa under phase 1–5 (A) and phase 5–8 (B) of WPSH_SMI_10-30d.
Figure 3 shows the lead regressions of 10–30 days filtered Z500 and wind at 500 hPa onto WPSH_SMI_10-30d. From leading 15 days (hereafter Lead 15 days), a 10–30 days low frequency teleconnection wave train exists over North Atlantic to East Asia via North America at mid-latitudes (30°N–60°N), which gradually propagates westward as time goes by. And the wave train along the region from North America to Northeast Asia becomes more distinctive since leading 10 days (Figure 3B). Under the influence of the westward propagation of the 10–30 days low frequency teleconnection, the positive Z500 anomalies over the central North Pacific propagate southwestward and reach Northeast Asia at Lead 0 days (Figure 3D). There is a significant teleconnection wave train along the 30°N–60°N latitude zone at Lead 0 days. And significant positive Z500 anomalies corresponding to anti-cyclonic anomalies locate over Japan-Northwest Pacific and Northeast Pacific, while significant low pressure anomalies are over the central North Pacific and North America. Meanwhile, the negative Z500 anomalies over Western Pacific and South China Sea correspond to anomalous cyclonic circulation. The dipole pattern of the 10–30 days filtered Z500 over the coastal region of East Asia and Western Pacific is favorable for northward movement of the WPSH. It is consistent with the maximum WPSH_SMI_10-30d at Lead 0 days, i.e. the northernmost position of the WPSH on sub-seasonal time scale of 10–30 days Figure 4 further shows the phase-longitude cross sections of the 10–30 days filtered Z500 averaged over 30°N–60°N. It can be obviously found that, in accompany with the westward propagation of atmospheric 10–30 days LFO wave train from North America to Northwest Pacific, the anomalous high pressure center originally locating in the central North Pacific shifts westward from phase 1. Then the maximum of positive Z500 anomalies along 120°E–150°E (Japan-Northwest Pacific) are observed at phase 5, suggesting that the WPSH reaches its northernmost position on 10–30 days sub-seasonal time scale. Therefore, the meridional 10–30 days LFO of the WPSH is directly affected by the westward propagation of the atmospheric LFO from the central North Pacific in advance of 10–15 days (about half cycle of 10–30 days LFO). It can be further found in Figure 4 that the 10–30 days low frequency circulation over the North Pacific is affected by the westward propagating low frequency wave from North America (90°W) and even North Atlantic (45°W), which is consistent with the westward propagation of the teleconnection wave train in Figure 3.
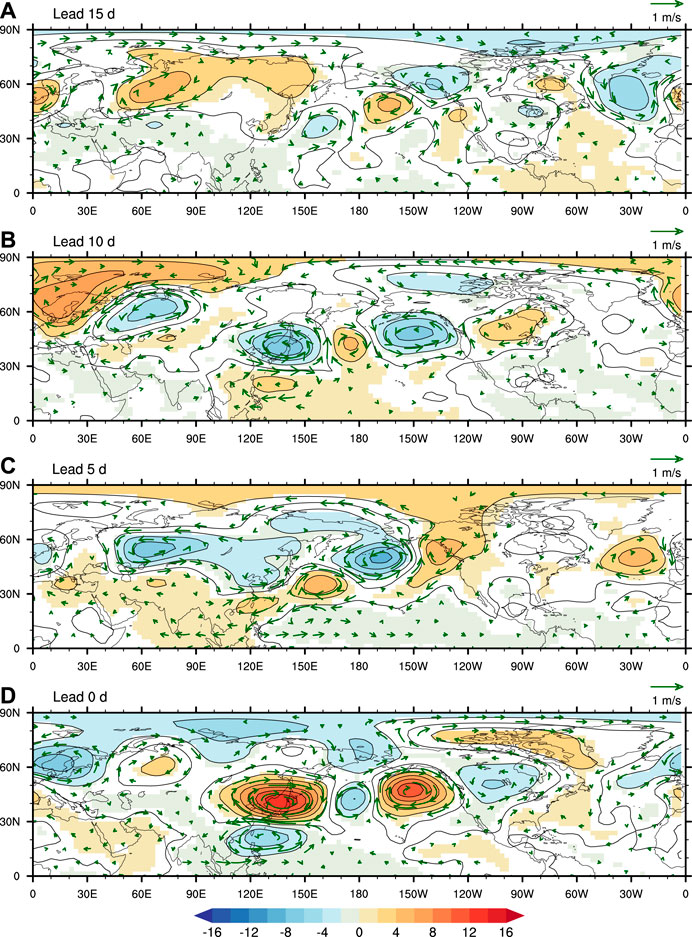
FIGURE 3. Lead regressions of 10–30 days filtered Z500 (shaded, unit: gpm) and wind (vectors, unit: m/s) onto WPSH_SMI_10-30d. Shaded areas and vectors represent statistically significant regressions at 95% confidence level based on Students’s t tests. The lead n d denotes that Z500 or wind anomaly leads the WPSH_SMI_10-30d by n days.
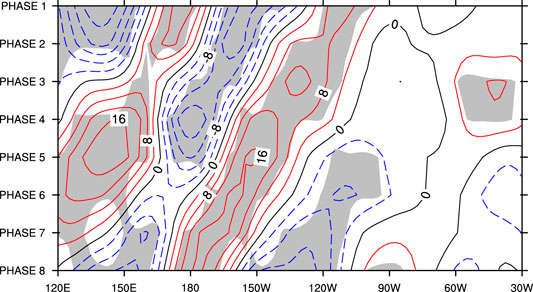
FIGURE 4. Phase-longitude cross section of 10–30 days filtered of Z500 (unit: gpm) along 30°–60°N (shaded regions are significant at 95% confidence level).
The 10–30 days filtered wave activity flux and stream function at 200hPa in association with WPSH_SMI_10-30d are displayed in Figure 5. At Lead 10 days, there are obvious wave activity fluxes in the subtropical Atlantic, which propagate westward at 60°W and eastward at 30°W; a high pressure anomaly develops in North America with westward wave activity fluxes. Distinct westward wave activity fluxes also cover the region from Northeast Pacific to central North Pacific. And the abnormally high pressure develops over the central North Pacific. At Lead 5 days, the 10–30 days low frequency wave activity fluxes propagate westward from the central North Pacific to Northwest Pacific. And the high pressure anomaly originally located in the central North Pacific propagates southwestward to around 160°E. Meanwhile, eastward propagating wave fluxes develop on the northeast side of the Caspian Sea. At Lead 0 days, the westward wave activity fluxes from North America to Northwest Pacific significantly enhanced, resulting in the westward propagation of the pressure anomaly from North America (at Lead 10 days) to Northeast Pacific. And the positive geopotential height anomalies from the central North Pacific propagate to Northwest Pacific. In addition, the wave activity fluxes over the subtropical Atlantic (30°W) propagate eastward (Lead 10 days) to central Siberia (Lead 5 days) through Europe, then further strengthen and propagate southeastward to influence Northeast Asia (Lead 0 days). This is in accordance with the eastward Rossby wave from the subtropical Atlantic to Northeast Asia via Europe (Liang and Lin, 2018; Liang et al., 2018). Therefore, over the mid-high latitudes, the 10–30 days LFO of the WPSH meridional activity is closely related to the wave train propagating westward from North America. And the westward wave activity over the subtropical Atlantic Ocean may have indirect impact on LFO of the WPSH meridional activity by influencing the wave activity over North America. On the other hand, the wave train propagating eastward from the Atlantic to West Siberia via Europe also exerts influences on the WPSH meridional activity on sub-seasonal time scale of 10–30 days. How does the eastward propagating wave in Eurasia influence the abnormal meridional activity of the WPSH? Tao et al. (2001) indicated that activities of troughs and ridges in westerlies can transport polar cold air to East Asia and modulate the development of the WPSH together with blocking high. Potential vortex (PV) can be used to track the trajectory of cold air, and the positive PV disturbances in the upper layer can extend downward to the middle troposphere and induce cyclonic circulation, which can downward propagate to the ground layer (Hoskins and Karoly, 1991; Shou, 2010). Figure 6 shows the evolution of the 10–30 days filtered PV in association with WPSH_SMI_10-30d. At Lead 10 days, the filtered PV showing a “+-+-” wave train is observed over North Atlantic and Eurasia at high latitudes. The positive PV anomalies in the Ural Mountains eastward move to Lake Baikal from Lead 10 days to Lead 0 days, to the east of which the negative PV anomalies propagate southeastward to Northeast Asia and Japan. And the anomalous divergence corresponding to the anomalous negative PV is conducive to the northward march of the WPSH to Northwest Pacific. In other words, the cold air reflected by the high PV expands eastward along high latitudes, and does not propagate southward directly, resulting in a northerly position of the WPSH (Zhang and Tao, 2003). In addition, the westward propagating 10–30 days low frequency PV wave train from North America to the western Pacific at mid-latitude is consistent with the 10–30 days low frequency wave train of Z500 in Figure 3. The evolution of PV and kinetic energy (KE) along 45°–65°N is given in Figure 7. With the 10–30 days LFO of the meridional activity of WPSH from phase 1 to phase 5, the PV wave train propagates eastward over the Eurasia continent. The high PV on the east of Ural Mountains propagates to Lake Baikal in phase 5, while the negative PV on the east of the high PV propagates southeastward to Northeast Asia. It can be seen from the evolution of the 10–30 days filtered KE, a large value center of KE appears in North Atlantic in 15–20 days advance of the maximum of WPSH_SMI_10-30d. It propagates eastward and arrives in Ural Mountains after about 10 days. Then the further strengthening KE propagates eastward and affects the high latitudes of East Asia (Figure 7B). The above evolution of KE further indicates that the eastward propagation of Rossby wave from North Atlantic to Northeast Asia via Eurasia can impact on the 10–30 days LFO of the WPSH. It is similar to the impacts of Rossby wave activities on evolution of the EAP events (Bueh et al., 2008) during late summer on medium-range time scale (Shi et al., 2009).
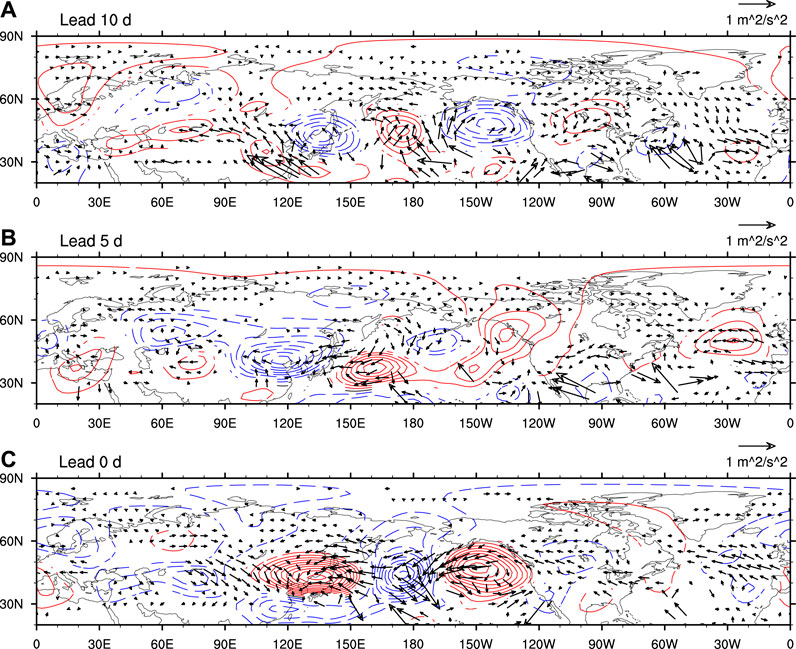
FIGURE 5. As in Figure 3, but for stream functions (shaded, unit: 10–6 m2s−1) and wave activity flux (vectors, unit: m2s−2) at 200 hPa.
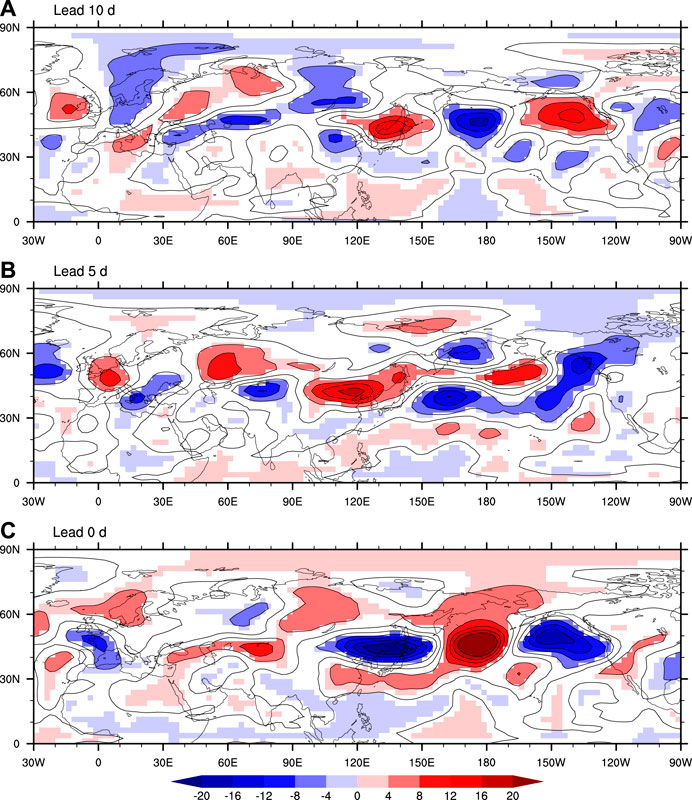
FIGURE 6. As in Figure 3, but for potential vortex (PV, shaded, unit: 10–8 K s−1 kg−1) at 200 hPa.
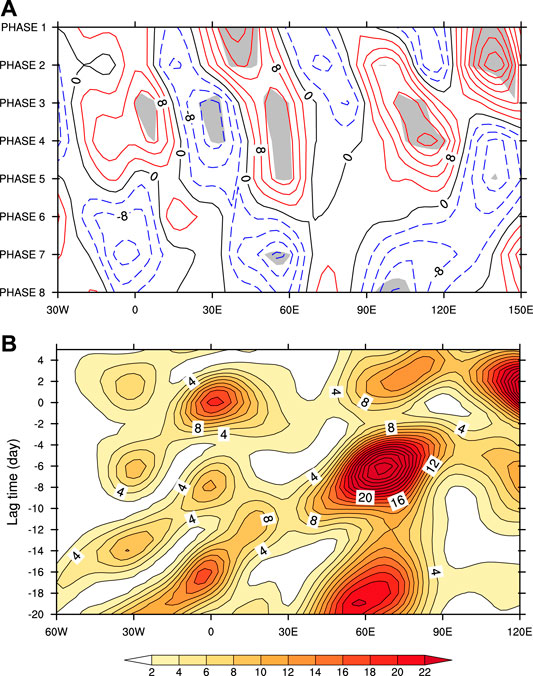
FIGURE 7. (A) Phase-longitude cross section of 10–30 days filtered PV (unit: 10–8 K s−1 kg−1) at 200 hPa along 45°–65°N. (B) Time-longitude cross section of vertically integrated 10–30 days filtered kinetic energy (KE) regressed onto the WPSH_SMI_10-30d along 45°–65°N (unit: m−2s−2). Positive (negative) lagged time denotes that 10–30 days filtered KE lags (leads) WPSH_SMI_10-30d. For example, “−10” means that 10–30 days filtered KE leads WPSH_SMI_10-30d by 10 days.
As mentioned above, the meridional activity of the WPSH on 10–30 days sub-seasonal time scale is directly related to the westward propagating wave train over Pacific. What is the source of energy for this westward wave train? From the distribution of 10–30 days filtered KE in late summer (Figure 8A), it can be observed that there is large KE in North Pacific and North Atlantic with the maximum in central North Pacific, indicating that the 10–30 days low frequency disturbances in North Pacific is very active. According to the barotropic instability criterion (Kuo, 1949), if the meridional gradient of absolute vorticity of the basic flow
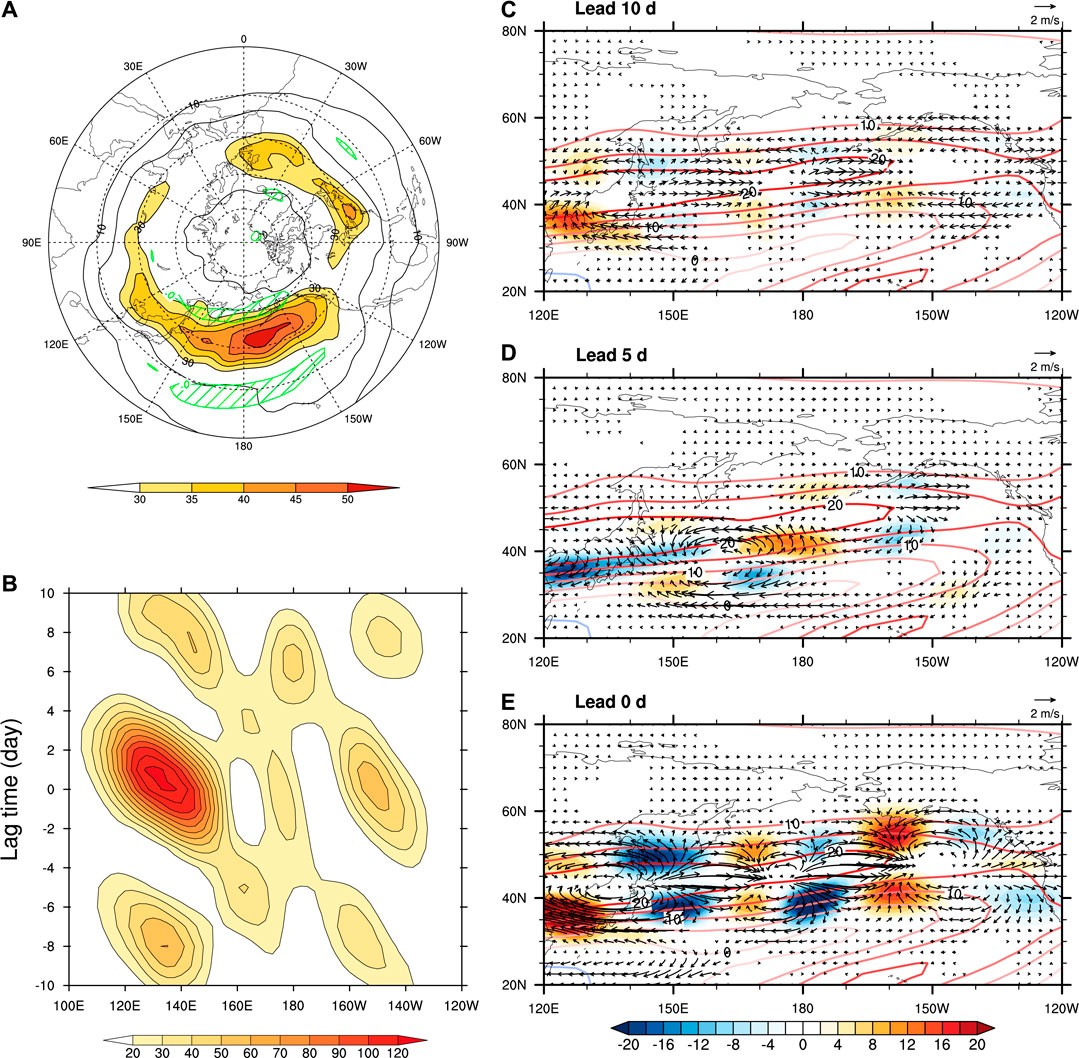
FIGURE 8. (A) 10–30 days filtered kinetic energy (KE, unit: m−2s−2) and meridional gradient of the absolute vorticity of the basic flow (green line, unit: m−1s−1) at 200 hPa during July–August of 1980–2019; (B) Time-longitude cross section of the vertically integrated 10–30 days filtered KE regressed onto WPSH_SMI_10-30d along 30°-60°N (unit: m−2s−2), positive (negative) lagged time denotes that 10–30 days filtered KE lags (leads) WPSH_SMI_10-30d, for example, “−10” means 10–30 days filtered KE leading WPSH_SMI_10-30d for 10 days (c ∼ e) Regressions of barotropic energy conversion (CK, shaded, unit: 10–6 W/kg), E vector (vector, unit: m−2s−2) onto WPSH_SMI_10-30d. The lead n d denotes that CK leads the WPSH_SMI_10-30d by n days. Contours denote climatological mean of zonal wind (unit: m/s) at 200 hPa during July–August of 1980–2019.
Related Tropical 10–30 Days Intraseasonal Source
The abnormal meridional activity of the WPSH is related to the northward movement of tropical convections (Zhang and Tao, 1999). Therefore, the 10–30 days filtered OLR and 850hPa wind are shown (Figure 9) to analyze the 10–30 days low frequency circulation in tropics associated with the meridional activity of the WPSH on 10–30 days sub-seasonal time scale. At phase 1 of WPSH_SMI_10-30d, anomalously active convection appears in the equatorial western Pacific, which excites a cyclonic circulation anomaly over the equatorial to tropical western Pacific through Gill response (Gill, 1980). And there is an anomalous anticyclone over the east of South China Sea and Philippines. From phase 1 to phase 5, with the northwest movement of the active convection from the equatorial western Pacific, the above anomalous cyclone-anticyclone circulation also moves northwestward and continuously strengthens. The northward shift of the anti-cyclonic circulation anomaly corresponds to the northward shift of the WPSH on 10–30 days sub-seasonal time scale. At phase 5 (Figure 9E), in accompany with the northward movement of the active convection over east of South China Sea and Philippines, the anti-cyclonic circulation on the north of the active convection moves northward to Japan - Western Pacific, which is helpful for the march of WPSH to the northernmost position on sub-seasonal time scale. Meanwhile, convection in the equatorial western Pacific is suppressed. Nitta (1987) and Hung and Li, (1988) focused on the interannual scale and suggested that if the SST in the western Pacific is warmer, the intensified convection around the Philippines will lead to the northward advance of the WPSH. It is found in this study that, the enhanced convection around the Philippines can also be conducive to the advancing of the WPSH on 10–30 days sub-seasonal scale, which is consistent with the relationship between PJ or EAP pattern and the interannual anomaly of the WPSH (Nitta, 1987; Hung and Li 1988). From phase 5 to phase 8, the active convection anomalies over the east of South China Sea and Philippines continuously shift northward. And the above anomalous cyclone-anticyclone circulation weakens. When the anomalously active convection reaches Japan and the northwest Pacific at phase 8, the above anomalous cyclone-anticyclone circulation converts to anomalous anticyclone-cyclone circulation over West Pacific. The anti-cyclonic circulation anomaly corresponding to the suppressed convection over West Pacific contributes to the southward retreat of the WPSH. Meanwhile, the convection intensifies again in the equatorial western Pacific. Since then, the evolution of above convection and circulation further affects the meridional activity of the WPSH on 10–30 days sub-seasonal time scale. Furthermore, it can be seen from Figure 10 that, on sub-seasonal time scale, with the meridional activity of the WPSH from phase 1 (corresponding to the southernmost WPSH) to phase 5 (corresponding to the northernmost WPSH), active convection over the equatorial western Pacific propagates to the northwestern Pacific where it develops to be strongest. Figures 9, 10 suggest that the northwestward propagation of the circulation anomalies coupled with the equatorial convection anomalies exert impacts on the meridional activity of the WPSH on 10–30 days sub-seasonal time scale. The northwestward propagation of convection and circulation anomalies may be related to Rossby wave maintained by coupling with deep convection (Xie and Wang, 1996). This is consistent with the conclusion of Hsu and Weng (2001) and Yang and Li (2020) on LFO propagation in Western Pacific.
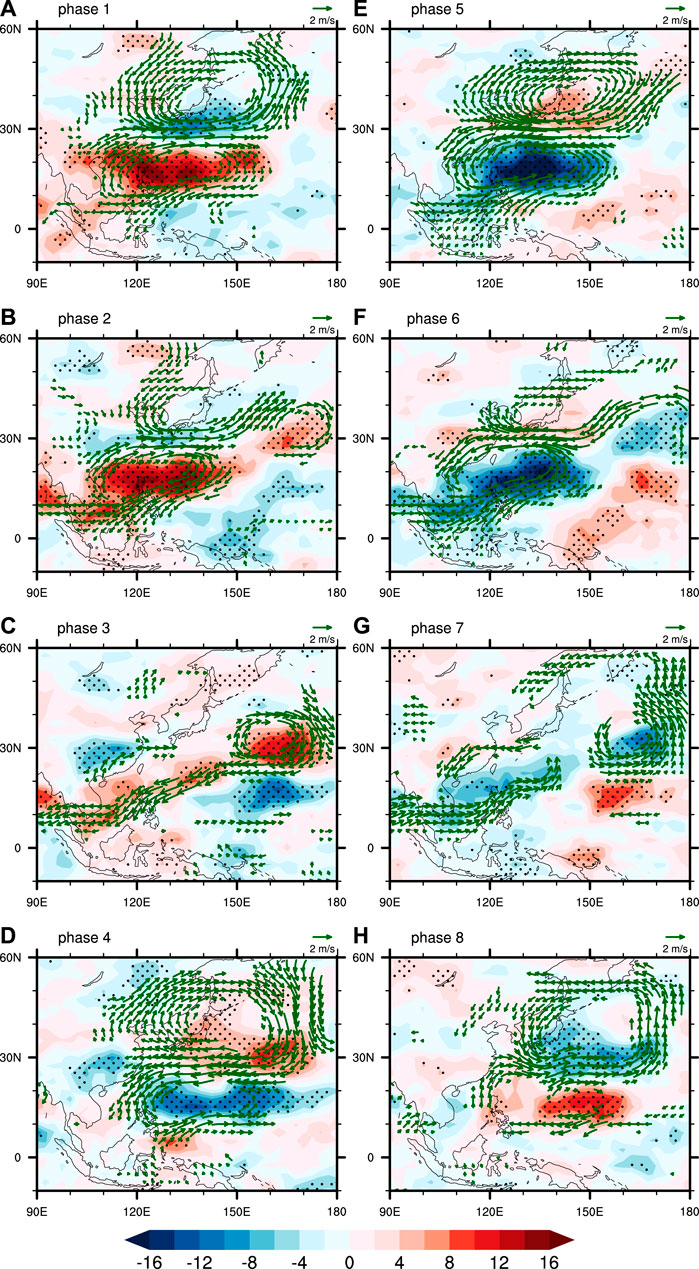
FIGURE 9. The composite 10–30 days filtered OLR (shadings, unit: W/m2) and 850 hPa wind (vectors, unit: m/s) at 8 phases of WPSH_SMI_10-30d. The dotted Shadings and vectors are statistically significant at 0.05 level.
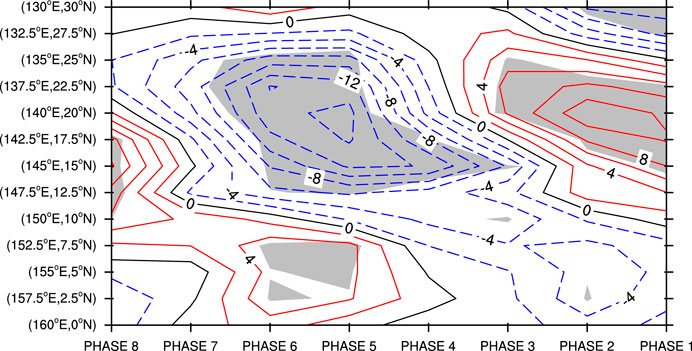
FIGURE 10. As in Figure 4, but for the evolution of OLR (unit: W/m2) along a tilt section from (160°E, 0°N) to (130°E, 30°N).
Fourty to Fifty Days Low Frequency Oscillation of Meridional Activity of Western Pacific Subtropical High
In addition to 10–30 days LFO, quasi 40–50 days LFO also exhibits in the meridional activity of the WPSH. Similar analysis with those in The 10–30 Days Low Frequency Oscillation of Meridional Activity of Western Pacific Subtropical High are conducted to investigate the anomalous atmospheric circulation associated with quasi 40–50 days LFO of the meridional activity of the WPSH. Figure 11 shows the evolution of the WPSH from phase 1 to phase 8 during a 40–50 days LFO cycle. As can be seen in Figure 11A, the WPSH moves northward by about 10 latitudes from phase 1 to phase 5. At phase 5, the WPSH advances to the northernmost position, i.e., from the Northwest Pacific to the southeast of the Sea of Japan, corresponding to the development of Ogasawara High Pressure. From phase 5 to phase 8, the WPSH gradually retreats southeastward, and reconnects with the eastern main body of Pacific subtropical high.

FIGURE 11. As in Figure 2, but for WPSH_SMI_40-50d.
Figure 12 shows the evolutions of the 40–50 days filtered OLR and 850hPa wind relating to the 40–50 days LFO of the WPSH meridional activity. At phase 1, the convection over the equatorial Indian Ocean is strong, while the case is on the contrary over the western Pacific. It is consistent with the anomalous distribution of convection anomaly near the equator associated with MJO. At the same time, there is an anomalous OLR teleconnection in southwest-northeast direction ranging from the equatorial Indian Ocean to North China - Northwest Pacific Ocean via north Indian Peninsula. Under the influence of the above convection anomalies, anomalous anti-cyclonic and cyclonic circulations appear over the western Pacific and Northwest Pacific respectively, when the WPSH locates to the southernmost position on 40–50 days sub-seasonal time scale. The convection over the north of the India peninsula results in enhanced ascending motion. And the upper-tropospheric anomalous high generates and acts as a wave source near the westerly jet entrance, which then excites successive downstream perturbations propagates along the Asian jet which provides a basic waveguide (Ding and Wang, 2005). The Rossby wave propagates eastward and accumulate in the jet exit region, resulting in an anti-cyclonic anomaly near North Pacific (Enomoto et al., 2003). From phase 1 to phase 3, the anomalous convection center eastward propagates from the equatorial Indian Ocean to the equatorial western Pacific, and then propagates northwestward to the western Pacific at phase 5, while the convection in Northwest Pacific is suppressed. Meanwhile, the teleconnection of convection anomalies over the Indian Ocean - North Indian Peninsula - North China - Northwest Pacific gradually propagates northeastward from phase 1 to phase 5. At phase 5, the convection anomalies over the equatorial Indian Ocean move to north Indian Peninsula, while the convection over North China - Northwest Pacific is suppressed. Therefore, under the combined effects of the propagation of tropical convection associated with MJO and the teleconnection over Indian Ocean - Northwest Pacific, the convection over Northwest Pacific is significantly inactive, which is conducive to the emergence of anti-cyclonic circulation and the northernmost location of the WPSH. The above-mentioned northward advance process of the WPSH on 40–50 days sub-seasonal time scale reflects the characteristics of the convection anomalies under the interaction between MJO and MISO (Waliser, 2006; Wang, 2008). The convection anomalies during the process of 40–50 days LFO of the meridional activity of WPSH are similar to the convection activities of BSISO (Lee J.Y. et al., 2013). From phase 5 to phase 8, the convection and the low-level circulation anomaly over Western Pacific gradually weakens. Active and suppressed convection anomalies reappear over the equatorial Indian Ocean and Western Pacific respectively, which is beneficial to generating anti-cyclonic circulation anomaly over the western Pacific and southward retreat of the WPSH. Compared with the northward advance of the WPSH, the 40–50 days LFO has a weaker influence on the southward retreat of the WPSH. 10–30 days atmospheric LFO has significant influences on the southward fall of the WPSH (Figure 10), indicating that the southward retreat of the WPSH is dominated by LFO on a shorter sub-seasonal time scale.
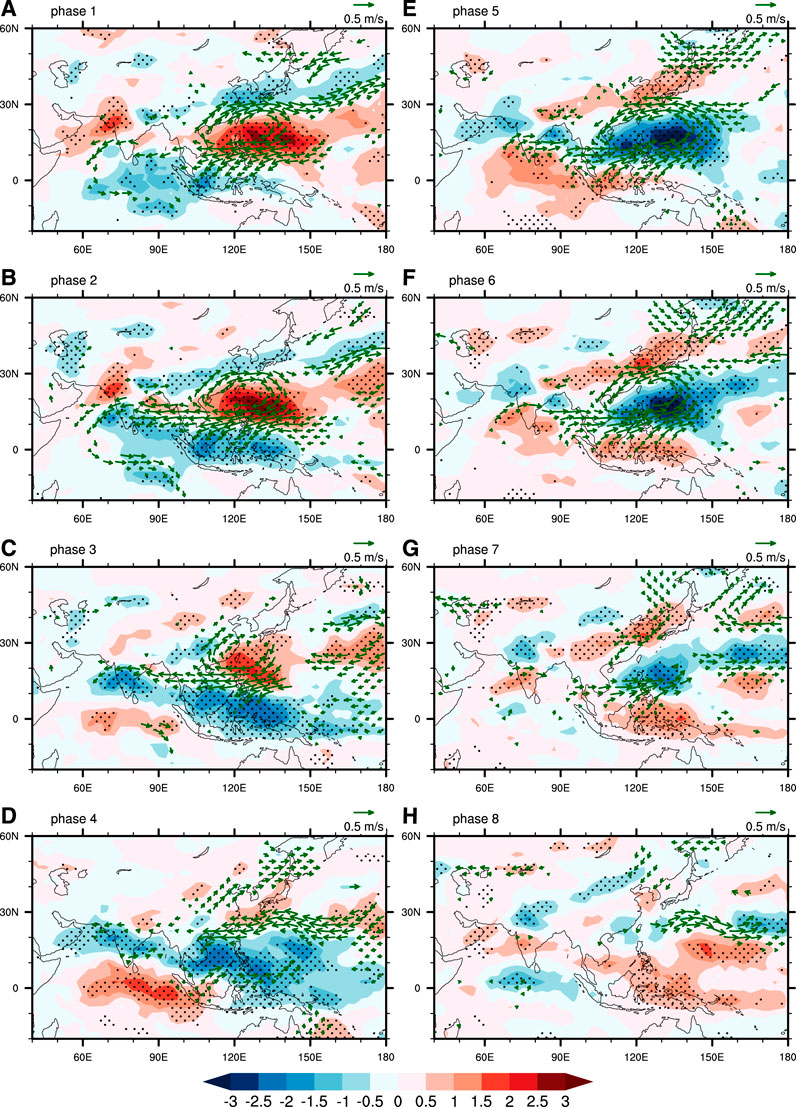
FIGURE 12. As in Figure 9, but for 40–50 days filtered.
Conclusion and Discussion
Conclusion
The characteristics and mechanisms of the meridional variation of the WPSH on sub-seasonal time scales are investigated in this study by using NCEP/DOE daily reanalysis data from 1980 to 2019. An index (WPSH_SMI) is defined by the difference of Z500 anomalies over Northwest Pacific and tropical West Pacific on sub-seasonal time scale to describe sub-seasonal meridional activity of the WPSH. The meridional activity of the WPSH exhibits distinct LFO with periods of 10–30 days and 40–50 days. The physical processes for the global atmospheric LFO affecting the meridional activity of the WPSH on sub-seasonal time scales of both 10–30 days and 40–50 days are found. By taking the northward advance of the WPSH as an example, Figure 13 depicts the schematics for the atmospheric LFO in association with the meridional activity of the WPSH on sub-seasonal time scale. On time scale of 10–30 days, the PV wave train eastward propagates from the North Atlantic Ocean to central Europe in the high latitudes, then the positive and negative PV anomalies in Ural Mountains and Baikal Lake respectively propagate southeastward, resulting in the divergence anomaly over Northwest Pacific. In the mid-latitudes, the westward propagation of 10–30 days low frequency wave train from central North Pacific, with energy acquired from the westerly jet through barotropic process, exerts significant influences on the pressure anomaly over Northwest Pacific to the coastal region of East Asia. And the 10–30 days low frequency disturbance in central North Pacific is enhanced by the westward propagating wave from North America to North Pacific along 40°N, while the geopotential height anomalies over North America is also affected by the westward wave activity from the subtropical Atlantic. In the tropics, the anomalous convection in the equatorial western Pacific propagates northwestward, which results in the anomalously cyclonic and anti-cyclonic circulation dipole distribution along the coastal area of West Pacific. Due to the combined effects of LFO in the tropics and mid-high latitudes, the anti-cyclonic circulation is enhanced over the Northwest Pacific, which is beneficial to the northward movement of the WPSH to Northwest Pacific. On sub-seasonal time scale of 40–50 days, the LFO of tropical convection propagates eastward from the equatorial Indian Ocean to West Pacific and then moves northward, accompanying with the northeastward propagation of the teleconnection from the tropical Indian Ocean to the Northwest Pacific via North Indian Peninsula. Then the anti-cyclonic circulation appears in Northwest Pacific, which is conducive to the northward advance of the WPSH. The contrary is the case in 10–30 days atmospheric LFO for the southward retreat of the WPSH on sub-seasonal time scale. But relatively weaker 40–50 days atmospheric LFO does less contribution to the southward retreat of the WPSH.
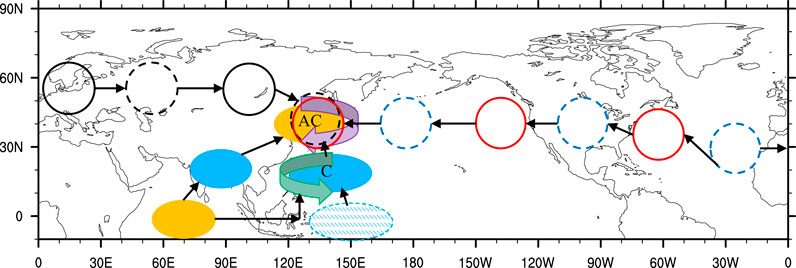
FIGURE 13. Schematics for the atmospheric LFO affecting the meridional activity of the WPSH on sub-seasonal time scale. Red/blue hollow circles represent positive/negative Z500 wave train; black solid/dashed circle denoting positive/negative low frequency PV wave train. Yellow/blue shading ellipses denote weak/strong low frequency convective anomalies; ellipse filled with blue dotted line represents original strong low frequency convective anomaly. Green/purple arrows denote low frequency cyclone/anticyclone.
Discussion
In the process of northward advance or southward retreat, the WPSH is often accompanied with westward extension or eastward retreat, which is difficult to be completely separated. Therefore, the results on meridional activity of the WPSH in this study also inevitably include the zonal variation of the WPSH. And the index of WPSH_SMI defined in the study may have limitations to describe the sub-seasonal meridional activity of the double ridgelines of WPSH in some years (Zhan et al., 2004; Qi et al., 2010). To reduce the sensitivity of the results in the study, the ridge line index of the WPSH is also directly adopted to examine the meridional activity of the WPSH on sub-seasonal time scale. The power spectrum analysis of the ridge line of WPSH also reflects both 10–20 days and 35–45 days LFO in the meridional activity of the WPSH (not shown), which is similar with the WPSH_SMI index defined in this study. And the LFO period over 20 days has also been concerned in a few studies (Tao et al., 2001; Guan et al., 2019; Yang et al., 2020). Meanwhile, in the mid-latitudes, a 10–30 days low frequency wave train of geopotential height from the subtropical Atlantic Ocean and propagating westward to the East Asia. And the westward propagating wave activity fluxes also exist over the subtropical Atlantic Ocean, North America and Pacific. Therefore, similar results can be required in different index for the meridional activity of the WPSH on sub-seasonal time scale. Thereinto, the westward propagating wave train may be related to the β effect which plays a key role in the mid-high latitude (Kushnir, 1987; Lau and Nath, 1999). As suggested by Doblas-Reyes et al. (2001), the westward propagating perturbations have a maximum power over the Atlantic. In the study, the LFO geopotential height anomaly over North America is also affected by the northwestward propagation of the wave activity over the subtropical Atlantic. The associating internal mechanism for the westward propagation of LFO from the subtropical Atlantic Ocean needs further study.
A circumglobal teleconnection (CGT) pattern and a western Pacific-North America (WPNA) teleconnection in association with anomalies of Indian monsoon and western North Pacific summer monsoon respectively are observed in seasonal average height at 200-hPa during boreal summer, which are also influenced by ENSO (Ding et al., 2011). It seems that the mid-high latitude wave train in association with WPSH_SMI_10–30d has some common with the seasonal teleconnection patterns especially the WPNA. How the sub-seasonal meridional activity of the WPSH connects with CGT, WPNA and ENSO needs further research. Yang et al. (2014) has noted the eastward propagating Silk Road Pattern, which is highly similar to CGT over Eurasia in both temporal and spatial distribution could be the origin of the biweekly variations over East Asia. Meanwhile, the sources of the sub-seasonal variability originate not only from global ISO, but also from SST, soil moisture and stratosphere-troposphere interaction (Baldwin et al., 2003; Koster et al., 2010). Whether SST, land, and stratospheric dynamical processes contribute to the sub-seasonal variability of the WPSH is worth of further research. And model verification on sub-seasonal variability of the WPSH are also required for improvements of sub-seasonal prediction in East Asia.
Data Availability Statement
All datasets presented in this study are included in the article.
Author Contributions
QQ, PL, and LQ carried out the concepts and design. QQ and PL contributed to the methodology and writing-original draft. QQ performed the data analysis. All authors contributed to the manuscript revision, read and approved the submitted version.
Funding
This research is jointly supported by the National Natural Science Foundation of China (41790471; 41775047), the National Key Research and Development Plan “Major Natural Disaster Monitoring, Warning and Prevention” of China (2017YFC1502301), and National Key R&D Program of China (2017YFE0133600).
Conflict of Interest
The authors declare that the research was conducted in the absence of any commercial or financial relationships that could be construed as a potential conflict of interest.
References
Anderson, J. R., and Rosen, R. D. (1983). The latitude-height structure of 40-50 day variations in atmospheric angular momentum. J. Atmos. Sci. 40, 1584–1591. doi:10.1175/1520-0469(1983)040<1584:tlhsod>2.0.co;2
Baldwin, M. P., Stephenson, D. B., Thompson, D. W. J., Dunkerton, T. J., Charlton, A. J., and O'Neill, A. (2003). Stratospheric memory and skill of extended-range weather forecasts. Science 301, 636–640. doi:10.1126/science.1087143
Bi, M. Y. (1989). The oscillation of the subtropical high over the western Pacific in the summer (in Chinese). Acta Meteorol. Sin. 4, 467–474. doi:10.11676/qxxb1989.062
Blackman, R. B., Tukey, J. W., and Teichmann, T. (1960). The measurement of power spectra. Phys. Today 13, 52–54. doi:10.1063/1.3056826
Bueh, C., Shi, N., Ji, L. R., Wei, J., and Tao, S. Y. (2008). The evolution characteristics of EAP events during meiyu period and the Rossby wave activities at mid-and high-latitude (in Chinese). Chin. Sci. Bull. 53, 111–121. doi:10.1007/s11434-008-0005-2
Chen, L. X., Zhu, Q. G., and Luo, H. B. (1991). East Asian monsoon (in Chinese). Beijing, China: China Meteorological Press, 362.
Ding, Q., and Wang, B. (2005). Circumglobal teleconnection in the northern hemisphere summer*. J. Clim. 18, 3483–3505. doi:10.1007/s00376-010-9225-x10.1175/jcli3473.1
Ding, Q., and Wang, B. (2007). Intraseasonal teleconnection between the summer Eurasian wave train and the Indian monsoon*. J. Clim. 20, 3751–3767. doi:10.1175/jcli4221.1
Ding, Q., Wang, B., Wallace, J. M., and Branstator, G. (2011). Tropical-extratropical teleconnections in boreal summer: observed interannual variability*. J. Clim. 24, 1878–1896. doi:10.1175/2011jcli3621.1
Ding, T., Yuan, Y., Zhang, J., and Gao, H. (2019). 2018: the hottest summer in China and possible causes. J. Meteorol. Res. 33, 577–592. doi:10.1007/s13351-019-8178-y
Ding, Y., and Chan, J. C. (2005). The East Asian summer monsoons: an overview. Meteorol. Atmos. Phys. 89, 117–142.
Ding, Y. (2007). The variability of the Asian summer monsoon. J. Meteorol. Soc. Jpn. 85B, 21–54. doi:10.2151/jmsj.85b.21
Doblas-Reyes, F. J., Pastor, M. A., Casado, M. J., and Déqué, M. (2001). Wintertime westward-traveling planetary-scale perturbations over the Euro-Atlantic region. Clim. Dynam. 17, 811–824. doi:10.1007/s003820000146
Duchon, C. E. (1979). Lanczos filtering in one and two dimensions. J. Appl. Meteorol. 18, 1016–1022. doi:10.1175/1520-0450(1979)018<1016:lfioat>2.0.co;2
Enomoto, T., Hoskins, B. J., and Matsuda, Y. (2003). The formation mechanism of the Bonin high in August. Q. J. R. Meteorol. Soc. 129, 157–178. doi:10.1256/qj.01.211
Gill, A. E. (1980). Some simple solutions for heat-induced tropical circulation. Q. J. R. Meteorol. Soc. 106, 447–462. doi:10.1002/qj.49710644905
Guan, W., Hu, H., Ren, X., and Yang, X.-Q. (2019). Subseasonal zonal variability of the western Pacific subtropical high in summer: climate impacts and underlying mechanisms. Clim. Dynam. 53, 3325–3344. doi:10.1007/s00382-019-04705-4
Han, R. Q., Li, W. J., and Dong, M. (2010). A diagnostic study of the temporal and spatial characteristics of the intraseasonal oscillation over the subtropical northern Pacific (in Chinese). Acta Meteorol. Sin. 68, 520–528. doi:10.11676/qxxb2010.050
Hoskins, B. J., and Karoly, D. J.. (1991). The steady linear response of a spherical atmosphere to thermal and orography forcing. J. Atmos. Sci. 38, 1179–1196. doi:10.1175/1520-0469(1981)038<1179:TSLROA>2.0.CO;2
Hsu, H.-H., and Weng, C.-H. (2001). Northwestward propagation of the intraseasonal oscillation in the western North Pacific during the boreal summer: structure and mechanism. J. Clim. 14, 3834–3850. doi:10.1175/1520-0442(2001)014<3834:npotio>2.0.co;2
Huang, R. H., and Li, W. J. (1988). Influence of heat source anomaly over the western tropical Pacific on the subtropical high over East Asia and its physical mechanism (in Chinese). Chin. J. Atmos. Sci. 12, 107–116. doi:10.3878/j.issn.1006-9895.1988.t1.08
Huang, R. (1994). Interactions between the 30-60day oscillation, the Walker circulation and the convective activities in the tropical western Pacific and their relations to the interannual oscillation. Adv. Atmos. Sci. 11, 367–384.
Huang, S. S. (1963). Longitudinal movement of the subtropical anticyclone and its prediction (in Chinese). Acta Meteorol. Sin. 33, 320–332. doi:10.1007/BF02658156
Huang, S. S. (1978). Research on the activity and forecast of the subtropical high (in Chinese). Sci. Atmos. Sin. 2, 159–168. doi:10.3878/j.issn.1006-9895.1978.02.09
Kanamitsu, M., Ebisuzaki, W., Woollen, J., Yang, S.-K., Hnilo, J. J., Fiorino, M., et al. (2002). NCEP-DOE AMIP-II reanalysis (R-2). Bull. Am. Meteorol. Soc. 83, 1631–1643. doi:10.1175/bams-83-11-1631
Kawamura, R., Murakami, T., and Wang, B. (1996). Tropical and mid-latitude 45-day perturbations over the western Pacific during the northern summer. J. Meteorol. Soc. Jpn. 74, 867–890. doi:10.2151/jmsj1965.74.6_867
Kawatani, Y., Ninomiya, K., and Tokioka, T. (2008). The north pacic subtropical high characterized separately for June, July, and August: zonal displacement associated with submonthly variability. J. Meteorol. Soc. Jpn. 86, 505–530. doi:10.2151/jmsj.86.505
Koster, R. D., Mahanama, S. P. P., Yamada, T. J., Balsamo, G., Berg, A. A., Boisserie, M., et al. (2010). Contribution of land surface initialization to subseasonal forecast skill: first results from a multi-model experiment. Geophys. Res. Lett. 37, L02402. doi:10.1029/2009gl041677
Krishnamurthy, V., and Shukla, J. (2008). Seasonal persistence and propagation of intraseasonal patterns over the Indian monsoon region. Clim. Dynam. 30, 353–369. doi:10.1007/s00382-007-0300-7
Kuo, H.-l. (1949). Dynamic instability of two-dimensional nondivergent flow in a barotropic atmosphere. J. Meteorol. 6, 105–122. doi:10.1175/1520-0469(1949)006<0105:diotdn>2.0.co;2
Kushnir, Y. (1987). Retrograding wintertime low-frequency disturbances over the north Pacific ocean. J. Atmos. Sci. 44, 2727–2742. doi:10.1175/1520-0469(1987)044<2727:rwlfdo>2.0.co;2
Lau, K.-M., and Chan, P. H. (1986). Aspects of the 40-50 day oscillation during the northern summer as inferred from outgoing longwave radiation. Mon. Weather Rev. 114, 1354–1367. doi:10.1175/1520-0493(1986)114<1354:aotdod>2.0.co;2
Lau, N.-C., and Nath, M. J. (1999). Observed and GCM-simulated westward-propagating, planetary-scale fluctuations with approximately three-week periods. Mon. Weather Rev. 127, 2324–2345. doi:10.1175/1520-0493(1999)127<2324:oagswp>2.0.co;2
Lee, J.-Y., Wang, B., Wheeler, M. C., Fu, X., Waliser, D. E., and Kang, I.-S. (2013). Real-time multivariate indices for the boreal summer intraseasonal oscillation over the Asian summer monsoon region. Clim. Dynam. 40, 493–509. doi:10.1007/s00382-012-1544-4
Lee, S.-S., Seo, Y.-W., Ha, K.-J., and Jhun, J.-G. (2013). Impact of the western North Pacific subtropical high on the East Asian monsoon precipitation and the Indian Ocean precipitation in the boreal summertime. Asia-Pacific J. Atmos. Sci. 49, 171–182. doi:10.1007/s13143-013-0018-x
Li, C. Y. (1991). Global characteristics of 30-60 day atmospheric oscillation (in Chinese). Sci. Atmos. Sin. 5, 66–76. doi:10.3878/j.issn.1006-9895.1991.03.10
Li, C. Y., Long, Z. X., and Li, Y. H. (1993). “On low-frequency remote responses in atmosphere to external forcings and their influences on climate,” in Climate variability, (Beijing, China: China Meteorological Press), 177–190.
Liang, P., Lin, H., and Ding, Y. (2018). Dominant modes of subseasonal variability of East Asian summertime surface air temperature and their predictions. J. Clim. 31, 2729–2743. doi:10.1175/jcli-d-17-0368.1
Liang, P., and Lin, H. (2018). Sub-seasonal prediction over East Asia during boreal summer using the ECCC monthly forecasting system. Clim. Dynam. 50, 1007–1022. doi:10.1007/s00382-017-3658-1
Liebmann, B., and Smith, C. A. (1996). Description of a complete (interpolated) outgoing longwave radiation dataset. Bull. Am. Meteorol. Soc. 77, 1275–1277. doi:10.1175/1520-0477(1996)077<1255:EA>2.0.CO;2
Liu, F. M., and Lin, H. (1990). A study on the characteristics of the low-frequency oscillation over west Pacific and its relations with subtropical high and typhoons (in Chinese). Acta Meteorol. Sin. 48, 303–317. doi:10.11676/qxxb1990.038
Liu, H., Zhang, D.-L., and Wang, B. (2008). Daily to submonthly weather and climate characteristics of the summer 1998 extreme rainfall over the Yangtze River basin. J. Geophys. Res. 113, D22101. doi:10.1029/2008jd010072
Liu, Y., and Ding, Y. (2020). Characteristics and possible causes for the super Meiyu in 2020 (in Chinese). Meteorol. Mon. In press.
Liu, Y., Liang, P., and Sun, Y. (2019). The Asian summer monsoon: characteristics, variability, teleconnections and projection. Cambridge, MA: Elsevier, 237.
Liu, Y. Y., Li, W. J., Ai, W. X., and Li, Q. Q. (2012). Reconstruction and application of the monthly western Pacific subtropical high indices (in Chinese). J. Appl. Meteorol. Sci. 23, 414–423. doi:10.11898/1001-7313.20120404
Lu, R.-Y., Oh, J.-H., and Kim, B.-J. (2002). A teleconnection pattern in upper-level meridional wind over the North African and Eurasian continent in summer. Tellus Dyn. Meteorol. Oceanogr. 54, 44–55. doi:10.1034/j.1600-0870.2002.00248.x
Madden, R. A., and Julian, P. R. (1971). Detection of a 40-50 day oscillation in the zonal wind in the tropical Pacific. J. Atmos. Sci. 28, 702–708. doi:10.1175/1520-0469(1971)028<0702:doadoi>2.0.co;2
Mao, J., Sun, Z., and Wu, G. (2010). 20-50-day oscillation of summer Yangtze rainfall in response to intraseasonal variations in the subtropical high over the western north Pacific and south China Sea. Clim. Dynam. 34, 747–761. doi:10.1007/s00382-009-0628-2
Morlet, J., Arens, G., Fourgeau, E., and Glard, D. (1982). Wave propagation and sampling theory-Part I: complex signal and scattering in multilayered media. Geophysics 47, 203–221. doi:10.1190/1.1441328
Nitta, T. (1987). Convective activities in the tropical western Pacific and their impact on the northern hemisphere summer circulation. J. Meteorol. Soc. Jpn. 65, 373–390.
Qi, L., He, J., Zhang, Z., and Guan, Z. (2010). West Pacific subtropical high double ridges and intraseasonal variability of the South China Sea summer monsoon. Theor. Appl. Climatol. 100, 385–396. doi:10.1007/s00704-009-0188-8
Shi, N., Bueh, C., Ji, L. R., and Wang, P. X. (2009). Impacts of mid-and high-latitude Rossby wave activities on the medium-range evolution of east Asia/Pacific events during the mid-and late summer (in Chinese). Chin. J. Atmos. Sci. 33, 1087–1100. doi:10.3878/j.issn.1006-9895.2009.05.18
Shou, S. W. (2010). Theory and application of potential vorticity. Meteorol. Mon. 36, 9–18. doi:10.7519/j.issn.1000-0526.2010.03.002
Simmons, A. J., Wallace, J. M., and Branstator, G. W. (1983). Barotropic wave propagation and instability, and atmospheric teleconnection patterns. J. Atmos. Sci. 40, 1363–1392. doi:10.1175/1520-0469(1983)040<1363:bwpaia>2.0.co;2
Su, T. H., Xue, F., Chen, M. Y., and Dong, X. (2017). A mechanism study for the intraseasonal oscillation impact on the two northward jumps of the western pacific subtropical high (in Chinese). Chin. J. Atmos. Sci. 41, 437–460. doi:10.3878/j.issn.1006-9895.1609.16125
Takaya, K., and Nakamura, H. (2001). A formulation of a phase-independent wave-activity flux for stationary and migratory quasigeostrophic eddies on a zonally varying basic flow. J. Atmos. Sci. 58, 608–627. doi:10.1175/1520-0469(2001)058<0608:afoapi>2.0.co;2
Tao, S., and Chen, L. (1987). “A review of recent research on the east Asian summer monsoon in China,” in Monsoon meteorology. Editors C.-P. Chang, and T. N. Krishnamurti, (Oxford, UK:Oxford University Press), 60–92.
Tao, S. Y., Zhang, Q. Y., and Zhang, S. L. (2001). An observational study on the behavior of the subtropical high over the west Pacific in summer (in Chinese). Acta Meteorol. Sin. 59, 747–758. doi:10.11676/qxxb2001.078
Tao, S., and Zhu, F. (1964). The 100-mb flow patterns in southern Asia in summer and its relation to the advance and retreat of the west-Pacific subtropical anticyclone over the far east (in Chinese). Acta Meteorol. Sin. 34, 385–396. doi:10.11676/qxxb1964.039
Waliser, D. E. (2006). “Intraseasonal variability,” in The Asian monsoon. Editor Wang, B., (New York, NY: Springer/Praxis Publishing Ltd), 203–259. doi:10.11676/qxxb2008.061
Wang, B. (2008). Thrusts and prospects on understanding and predicting Asian monsoon climate. Acta Meteorol. Sin. 66, 653–669. doi:10.11676/qxxb2008.061
Wang, B., Xiang, B., and Lee, J.-Y. (2013). Subtropical high predictability establishes a promising way for monsoon and tropical storm predictions. Proc. Natl. Acad. Sci. Unit. States Am. 110, 2718–2722. doi:10.1073/pnas.1214626110
Wang, B., and Xu, X. (1997). Northern hemisphere summer monsoon singularities and climatological intraseasonal oscillation. J. Clim. 10, 1071–1085. doi:10.1175/1520-0442(1997)010<1071:nhsmsa>2.0.co;2
Wen, M., and He, J. H. (2002). Ridge movement and potential mechanism of western Pacific subtropical high in summer (in Chinese). Trans. Atmos. Sci. 25, 289–297. doi:10.3969/j.issn.1674-7097.2002.03.001
Wu, G. X., Chou, J. F., and Liu, Y. M. (2002). Dynamics of formation and variation of subtropical high (in Chinese). Beijing, China: Science Press, 20.
Xie, S.-P., Hu, K., Hafner, J., Tokinaga, H., Du, Y., Huang, G., et al. (2009). Indian ocean capacitor effect on indo-western Pacific climate during the summer following El niño. J. Clim. 22, 730–747. doi:10.1175/2008jcli2544.1
Xie, X., and Wang, B. (1996). Low-frequency equatorial waves in vertically sheared zonal flow. Part II: unstable waves. J. Atmos. Sci. 53, 3589–3605. doi:10.1175/1520-0469(1996)053<3589:lfewiv>2.0.co;2
Yang, J., Bao, Q., Wang, B., Gong, D.-Y., He, H., and Gao, M.-N. (2014). Distinct quasi-biweekly features of the subtropical East Asian monsoon during early and late summers. Clim. Dynam. 42, 1469–1486. doi:10.1007/s00382-013-1728-6
Yang, J., Liu, Q., Xie, S.-P., Liu, Z., and Wu, L. (2007). Impact of the Indian Ocean SST basin mode on the Asian summer monsoon. Geophys. Res. Lett. 34, L02708. doi:10.1029/2006gl028571
Yang, J., Wang, B., Wang, B., and Bao, Q. (2010). Biweekly and 21-30-day variations of the subtropical summer monsoon rainfall over the lower reach of the Yangtze River basin. J. Clim. 23, 1146–1159. doi:10.1175/2009jcli3005.1
Yang, S., and Li, T. (2020). Cause for quasi-biweekly oscillation of zonal location of western Pacific subtropical high during boreal summer. Atmos. Res. 245, 105079. doi:10.1016/j.atmosres.2020.105079
Yu, S. H., and Yang, W. W. (1995). Diagnostic study of intraseasonal anomalous progression and retrogression of subtropical high over western Pacific (in Chinese). J. Trop. Meteorol. 3, 214–222.
Zhan, R., Li, J., and He, J. (2004). Influence of the double ridges of west Pacific subtropical high of the second Meiyu over the Yangtze River valley during 1998 (in Chinese). Acta Meteorol. Sin. 62, 294–307. doi:10.11676/qxxb2004.030
Zhang, Q. Y., and Tao, S. Y. (1998). Influence of Asian mid-high latitude circulation on East Asian summer rainfall (in Chinese). Acta Meteorol. Sin. 2, 72–84. doi:10.11676/qxxb1998.019
Zhang, Q. Y., and Tao, S. Y. (2003). The anomalous subtropical anticyclone in western Pacific and their association with circulation over East Asia during summer (in Chinese). Chin. J. Atmos. Sci. 27, 369–380. doi:10.3878/j.issn.1006-9895.2003.03.07
Zhang, Q. Y., and Tao, S. Y. (1999). The study of the sudden northward jump of the subtropical high over the western Pacific (in Chinese). Acta Meteorol. Sin. 57, 539–548. doi:10.11676/qxxb1999.052
Keywords: western Pacific subtropical high, meridional activity, sub-seasonal variability, low frequency oscillation, teleconnection
Citation: Qian Q, Liang P, Qi L, Ding Y and He J (2020) Sub-Seasonal Variability of Meridional Activity of Western Pacific Subtropical High in Boreal Late Summer. Front. Earth Sci. 8:597969. doi: 10.3389/feart.2020.597969
Received: 23 August 2020; Accepted: 28 September 2020;
Published: 10 November 2020.
Edited by:
Lei Zhang, University of Colorado Boulder, United StatesReviewed by:
Jieshun Zhu, University of Maryland, College Park, United StatesQing Bao, Institute of Atmospheric Physics (CAS), China
Copyright © 2020 Qian, Liang, Qi, Ding and He. This is an open-access article distributed under the terms of the Creative Commons Attribution License (CC BY). The use, distribution or reproduction in other forums is permitted, provided the original author(s) and the copyright owner(s) are credited and that the original publication in this journal is cited, in accordance with accepted academic practice. No use, distribution or reproduction is permitted which does not comply with these terms.
*Correspondence: Ping Liang, bGlhbmdwaW5nMTEwN0AxNjMuY29t
 Qiwen Qian
 Li Qi1