- 1Key Laboratory of Meteorological Disaster, Ministry of Education, and Collaborative Innovation Center on Forecast and Evaluation of Meteorological Disaster, Nanjing University of Information Science and Technology, Nanjing, China
- 2Chongqing Meteorological Information and Technical Support Center, Chongqing, China
Based on the observational evidences that the tropical cyclones (TCs) number in the western North Pacific (WNP) in autumn is more than that in summer, this study mainly compares the disturbance of some conditions that associated with the formation of TCs between the two seasons. Results show that the most of the distributions of the disturbance field of atmospheric dynamic factor are similar, while the unique feature of the upper level geopotential height/vortex anomaly over east Asia/western Pacific sector varies greatly and may play the important role in generating more TCs in autumn. Further analyses indicate that the high-pressure/anticyclonic anomaly in autumn is originated from the north tropical Atlantic Ocean. When a cold sea surface temperature (SST) anomaly appears in north tropical Atlantic, a Rossby wave train over Eurasia continent could be induced which then leads a favorable condition for TC genesis over east Asia/western Pacific sector at upper troposphere, resulting in more WNP TCs in autumn.
Introduction
As the most active area of tropical cyclones (TCs) in the world, the western North Pacific (WNP) generates an average of about 26 TCs annually, with about 12 TCs landing in the East Asia in the peak season (June to October) (Zhao et al., 2010; Gao et al., 2018; Gao et al., 2020b). The total population of East Asia accounts for about 25% of the world, most of which are concentrated in the southeast coast, such as the relatively developed South China. TCs have stricken these regions regularly for many years, and the TC-related disasters take up a large proportion of the natural disasters in these regions (Goh and Chan, 2010). Therefore, it is necessary to study the TC activities in the WNP.
The generation frequency and location of WNP TCs have attracted much attention for a long time (Liu and Chan, 2003; Wu et al., 2005; Zhang et al., 2016a; Zhang et al., 2016b). El Niño–Southern Oscillation (ENSO) has a significant effect on the location of TC generation in WNP, but no significant linear relationship between ENSO and TC generation frequency is found. Influence by the large-scale circulation, TCs are more likely to generate in the southeast (northwest) of WNP in the summer of El Niño years (La Niña years) (Lander, 1994; Chan, 2000; Chia and Ropelewski, 2002; Wang and Chan, 2002; Zhao et al., 2010; Zhan et al., 2011; Liu et al., 2016). The main reason is that the sea surface temperature (SST) in the west of WNP is lower than the east of WNP in El Niño years, while the SST in the west of WNP is relatively higher in La Niña years. In addition, the abnormal atmospheric circulation caused by the SST anomaly changes the generation locations of TCs. The two different ENSO modes also have different effects on the TC generation locations. Unlike in the East Pacific El Niño period, in the summer of the central Pacific El Niño period, the TC generation frequency has not shown a variation of increasing in the eastern WNP and decreasing in the western WNP. La Niña in the central Pacific inhibits TC generation in the southeast of WNP (Zhang et al., 2012; Wang et al., 2013). In recent years, some studies have pointed out that there is also a close relationship between the tropical North Atlantic (TNA) SST and WNP TC generation activity (Yu et al., 2016; Zhang et al., 2017; Huo et al., 2015; Gao et al., 2018; Gao et al., 2020b). When the cold SST anomaly occurs in TNA, the relative humidity in the South China Sea will increase and the vertical wind shear in the east of WNP will be weakened, forming three anomaly-centers of TC generation frequency in WNP.
Besides the above inter-annual signals, TC generation is also affected by other time scale signals. It is regulated by the Madden–Julian oscillation (MJO) on the seasonal scale. When the MJO-related convection center is in WNP, by modulating the relative humidity in the middle levels and the absolute vorticity in the lower levels, MJO could promote the TC generation. Moreover, the TC generation locations are mostly located to the west and north of the convection center (Kim et al., 2008; Camargo et al., 2009). On the decadal scale, the TC generation is mainly affected by the Pacific decadal oscillation (PDO), the Atlantic Multidecadal Oscillation (AMO), etc., For example, in the PDO positive anomaly year, the TCs generated in La Niña years are significantly more than that in El Niño years, especially for the strong TCs (Category-1 and above) (Girishkumar et al., 2015). Besides, the global warming also affects the TC generation.
The WNP TCs are mainly active in summer and autumn. Previous studies have shown that there are remarkable differences in the interannual variation of TC activities in these two seasons, due to the different environmental factors. The TC activity in summer is closely related to the Pacific–Japan pattern (Choi et al., 2010; Kim et al., 2012) and the Antarctic Oscillation (Wang and Fan 2007).
However, Wu and Wang (2004) found that TC activities in WNP are significantly correlated with the SST anomaly in the equatorial central and eastern Pacific only in autumn, but not in summer. Moreover, Yao et al. (2020) found that the number of TCs in autumn in the WNP showed a slight decreasing trend from 1949 to 2016. In most years, an increase in the number of autumn TCs was associated with fewer summer TCs. And the total number of TCs generated in summer is very close to that in autumn. But in fact, the monsoon trough is stronger in summer in WNP, and the convective activity is more active, which is more conducive to the TC generation. So, what determines the seasonal difference of the climatic TC generation frequency? What are the differences of the TC-generation driving factors in summer and in autumn? No relevant researches have given clear answers to the above questions, so the purpose of this paper is to show the reasons for the seasonal differences of TC generation frequency.
Data and Methods
TC best track data over the WNP are obtained from the Joint Typhoon Warning Center (JTWC, https://www.metoc.navy.mil/jtwc/jtwc.html? western-pacific). The study period of this paper is 1979–2016, since the record of the WNP TCs is more reliable after 1970 with the introduction of more new technologies (Chu et al., 2002). Following the previous studies (e.g., Yu et al., 2016; Gao et al., 2018), only TCs reaching the intensity level of tropical storm or above (i.e., maximum sustained wind speed ≥ 34 kt) were included.
Monthly atmospheric variables are obtained from the National Centers for Environmental Prediction (NCEP)/National Center for Atmospheric Research (NCAR) Reanalysis data with the spatial resolution of 2.5° (Kalnay et al., 1996). Monthly SST data are acquired from the National Oceanic and Atmospheric Administration (NOAA) Extended Reconstructed Sea Surface Temperature (ERSST) version 4 (Huang et al., 2015).
To further understand the process of wave propagation, the Rossby wave source (RWS, Sardeshmukh and Hoskins 1988) and wave activity flux (WAF) are calculated. The RWS is defined as
Where
where an overbar and a prime represent the climatological and disturbance field, respectively; the subscripts x and y indicate the partial derivatives in the corresponding direction;
Results
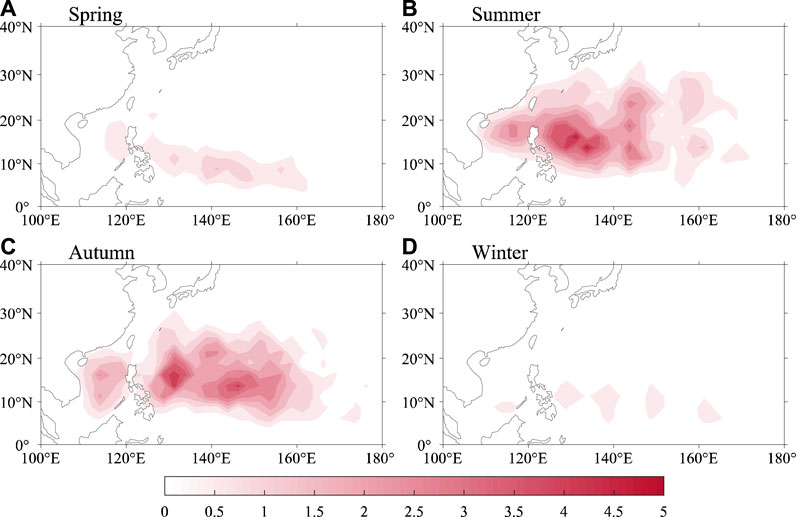
The annual genesis frequency of tropical storms, severe tropical storms and typhoon (TS, STS, and TY, with the maximum sustained wind speed near the center exceeding 34 kt, 48 kt and 64 kt, respectively) in four seasons is shown in Figure 1, The table in Figure 1D represents the total genesis number of TCs of each intensity over 38 years. Obviously, TCs are mainly generated in summer and autumn, while only sporadic TCs are generated in spring and winter. Not only that TCs are more likely to generate in autumn than in summer regardless of the intensity. By further binning the TC generation positions into 2.5° × 2.5° grid boxes, we found that both in two seasons TCs genesis position are mainly concentrated in the Philippine sea north of 10°N, and partly in the South China Sea and EWNP (Figures 2B,C). In the spring and winter, TCs are generated in a further south location and mostly concentrated in the east of the Philippines (Figures 2A,D). According to the above results, in this paper, we focus on the seasonality of TC number during the peak season summer and autumn (June–August and September–November).
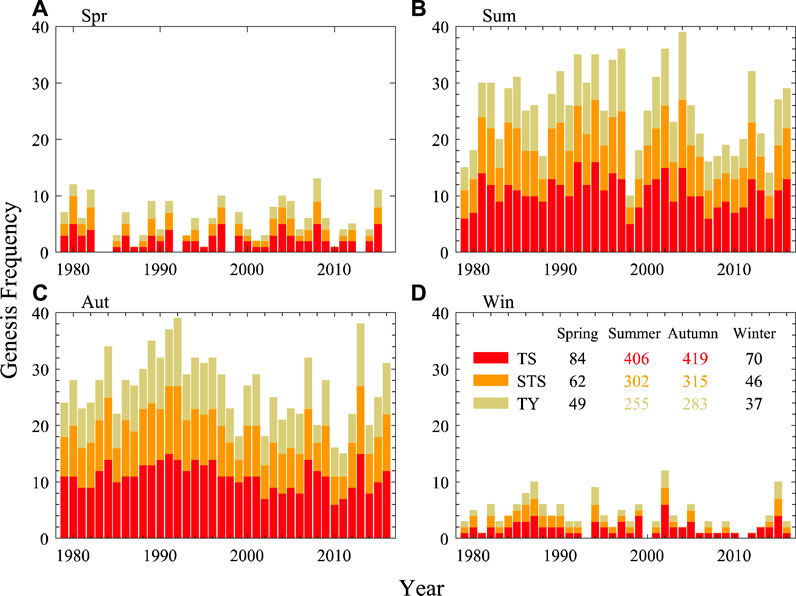
FIGURE 1. Time series of the genesis frequency of TS (red bar), STS (orange bar), and TY (greenyellow bar) during four-seasons 1979–2016. Numbers of TCs forming in four seasons are shown in the upper of panel (D).
In order to reveal why the total number of TCs generated in autumn is more than that in summer, we followed the previous works and explored the physical factors conducive to the genesis of TC in each layer (Yu et al.,. 2016; Gao et al., 2018; Zhang et al., 2018; Gao et al., 2020a). Figures 3, 4 show the distribution of climate mean state outgoing longwave radiation (OLR), 850 hPa wind and SST minus 27.5°C (convection temperature threshold) in summer and autumn, as well as the difference between two seasons, respectively. It is obvious that the monsoon trough in the northern part of the South China Sea and the western part of the Philippine sea in the summer is stronger. Therefore, compared with the summer, there are stronger anticyclonic circulations and corresponding higher OLR in the above TC generating areas in the autumn. While the cyclonic circulation in autumn of EWNP is stronger than that in summer, but consider the offsetting effects of the monsoon trough in both seasons, the difference of monsoon trough is able to explain the difference of the TC genesis position but not fully explain that of TC number in summer and autumn. And whether in summer or autumn, the climatological SST is always sufficient to stimulate convection in the main areas where TC activity is exuberant. However, WNP SST in autumn is generally lower than that in summer and corresponds to stronger OLR. Although in the southern part of the South China Sea, the eastern part of the Philippine sea and the WNP, the relative vorticity and OLR (can abstract from Figure 4) at the lower layers and the vertical shear of zonal wind have a slight advantage over the summer (not shown in paper), but the overall difference is not significant. Based on the above conclusions and considering the interannual disturbance, we believe that the climate state of seasonal distribution difference of physical quantity cannot well explain the TC genesis difference between these two seasons. We therefore turn our attention to the analysis of the disturbance field related to the genesis frequency of WNP TCs.
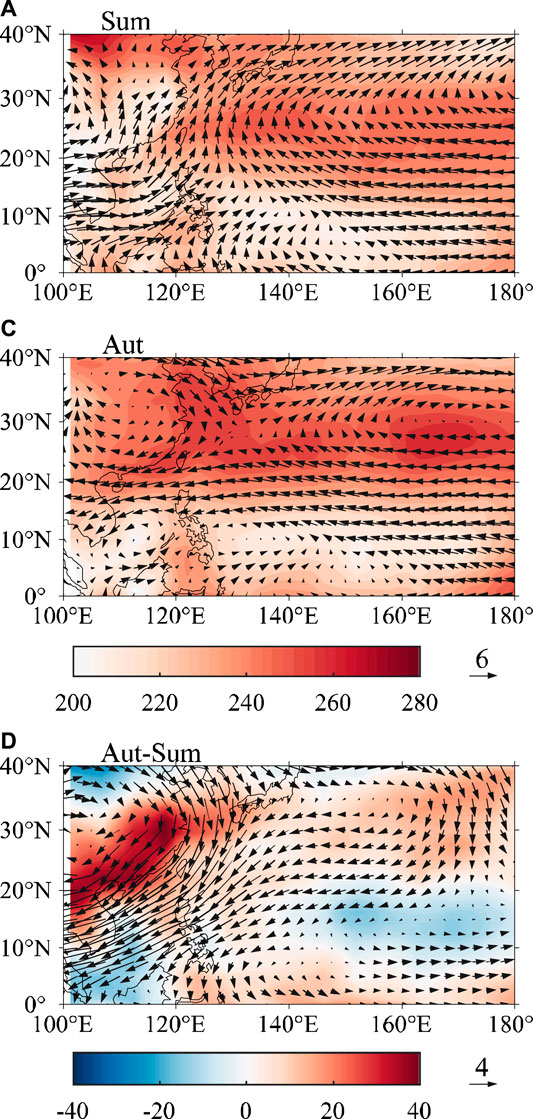
FIGURE 3. OLR (shaded, W/m2) and 850 hPa wind (vector, m/s) of (A,B) climate state in summer and autumn, respectively, and (C) their difference between two seasons.
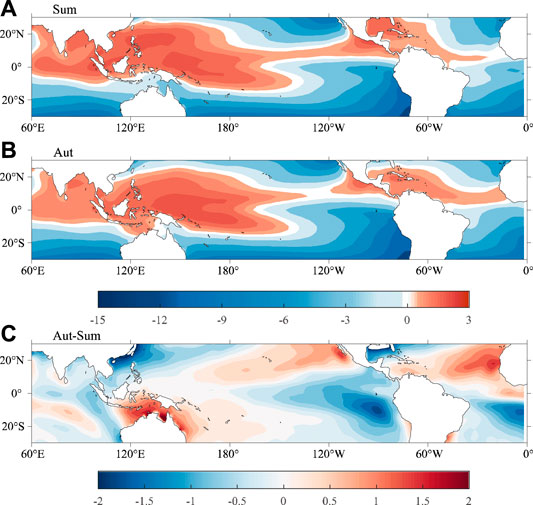
FIGURE 4. SST (shaded, °C) of (A,B) climate state in summer and autumn, respectively, and (C) their difference between two seasons.
We regress the physical quantities of each level in summer and autumn onto the TC genesis frequency of the corresponding season, and obtain the disturbance field of each physical quantity. Results show that there is no significant difference in the distribution pattern of disturbance with the frequency of TC genesis, whether it is 850-hPa vorticity or 850–200 hPa vertical zonal wind shear (Figure 5). In the TC genesis main regions of WNP, it is characterized by the almost homogeneous positive relative vorticity anomalies throughout the region in two seasons, while the overall disturbance covers a wider range in summer, extending from 10°N to 30°N (Figures 5A,C). And in the vicinity of 20–30°N, existing a negative vertical wind shear anomaly (Figures 5B,D). Hence, we may infer that the above dynamic factors do not play the key role to the seasonality in the amount of TC genesis. The analysis of the regression field of 850 hPa geopotential height and wind can further verify this viewpoint. In WNP, there is abnormal low pressure and cyclonic circulation centered in both summer and autumn, and WNP SST also presents a large range of negative anomalies in both seasons due to the effect of northerly winds in the west part of the anomalous cyclonic on the southward transport of cold sea water at high latitudes (Figure 6).
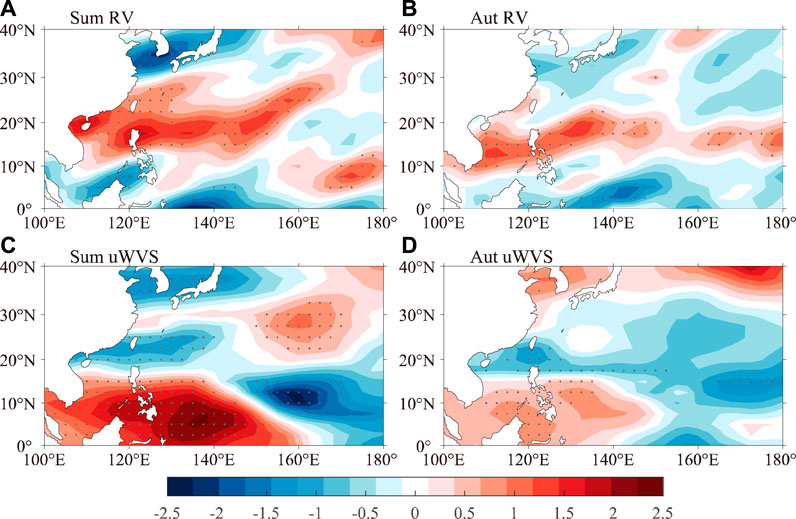
FIGURE 5. Regression of 850-hPa relative vorticity (10–6 s−1) and vertical u-wind shear (m/s) (A,C) in summer and (B,D) in autumn on the TC genesis frequency. Regression coefficients exceeding 90% confidence level are stippled.
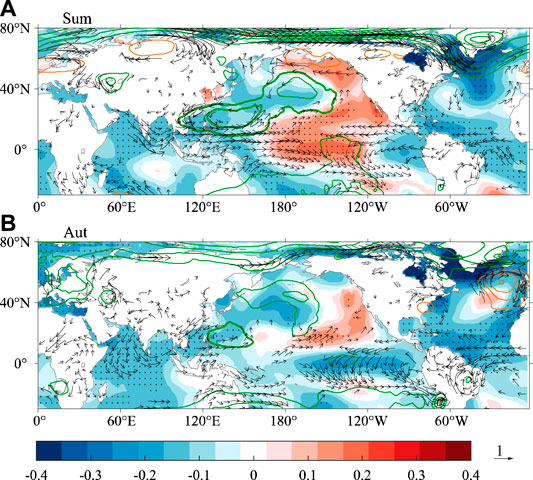
FIGURE 6. Regressions of SST (shaded, °C), 850 hPa wind filed (vector, m s−1) and geopotential height (contour, m) on the TC genesis frequency. Values above the 90% confidence level are shown for vector and stippled for SST. Contour interval is 2, to the range from 4 to 8 for orange lines, from −2 to −16 for green lines.
But when it comes to the upper troposphere things have changed. Figure 7 indicates the 200-hPa geopotential height, wind field and OLR perturbation. In this level we found that over WNP there are obvious differences of distribution of circulation. There are significant abnormal high-pressure/anticyclonic anomaly over the east Asia/western Pacific sector in autumn, which can enhance the pumping at the upper level (Figure 7B), thus the TC activity is promoted. While in the summer it is controlled by abnormal low pressure and cyclonic circulation (Figure 7A). Lu et al (2019) found that the equatorial north Atlantic SST anomaly (SSTA) can affect the circulation in northeast Asia through the eastward Rossby wave train. Therefore, in combination with the division of both high- and low-level circulation anomalies, the results suggest that the anomalous high-pressure/anticyclonic signals in the upper layer WNP in autumn are probably originated from the SSTA in the Atlantic Ocean. The anomalous low SST in the low-to mid-latitude of the North Atlantic will constrict the air column over the ocean surface. It induces the descending of upper troposphere isobaric surface near the 30°N and forms the corresponding anomalous cyclonic circulation. The anomalous signal propagate to the high latitude brings anomalous high pressure and anticyclonic circulation into being near the high latitude of the Atlantic over 30°W, 50°N. Then the signal continues to propagate in the form of eastward Rossby wave train, forming a low pressure near the 30°E, 50°N with anomalous cyclonic circulation. The wave train then splits into two branches, one of which forms a high pressure center and a cyclonic shear region around 60°E and 30°N and over the northern part of the Indian peninsula, and then the wave signal travels northeast to the region of attention. The other one passes directly through the middle and high latitude to east Asia/western Pacific region, where it cooperates with another wave train to form an abnormal high pressure along with a large range of anticyclonic circulation in situ. The anomalous circulation extends from the land to 150°E, and is matched by the abnormally high OLR distributed on the sea. Moreover, there is an extra high-pressure center near 170°E associated with the tail of wave train, which also leads favorable conditions for TC genesis in eastern WNP. While in summer, SST climate state in the Atlantic is lower than that in autumn (Figure 4C), so when there is a negative SST disturbance, the atmosphere is less sensitive, and it is difficult to form the compression of the air column. Therefore, there is no abnormal cyclone formation and meridional propagation of fluctuation signals in the Atlantic in summer. Combine the distribution form of SST and low-level wind field, the dominant disturbance pattern in summer may be the Pacific Meridional Mode (PMM) in situ (Figure 6A). In order to validate the existence of above Rossby wave train, we analyzed the autumn WAF and RWS. As shown in Figure 8 the Rossby wave source is mainly located over the east flank of the anomalous anticyclone, which is stimulated by the anomalous cyclonic circulation at the mid latitude over north Atlantic Ocean, then it travels southeastward through two ways to east Asia/western Pacific across the entire high-to mid-latitudes in Eurasia.
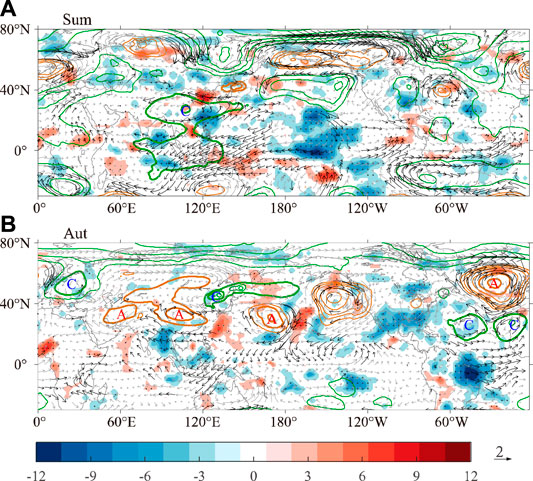
FIGURE 7. As in Figure 5, but for OLR (shaded, W/m2), 200 hPa wind filed (vector, m s−1) and geopotential height (contour, m). Contour interval is 2, 4 to the range from 2 to 6 and 10 to 22, respectively, for orange lines, and 4 to the range from −8 to −28 for green lines. The letters “A” and “C” indicate the centers of anticyclonic/cyclonic anomalies accompany with thick contours, respectively.
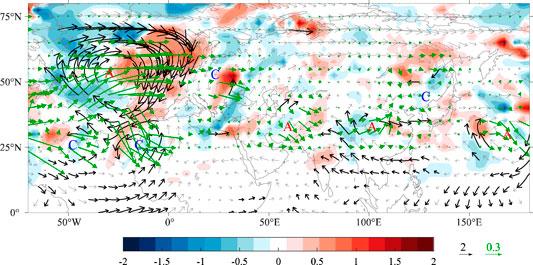
FIGURE 8. Rossby wave source (shading, 1 × 10⁻¹⁰ s−2), WAF (green vectors, m2 s−2, the data over south of 20°N has been masked) and regressive wind field (black and gray vectors, m s−1), calculated and abstracted from the wind field in Figure 7B. The letter “A” and “C” indicate the centers of anticyclonic/cyclonic anomalies, respectively. Black vectors denote values above the 90% confidence level.
Conclusion
The differences of WNP TC genesis number between summer and autumn are examined. The results show that WNP TCs were mainly generated in summer and autumn, mostly concentrated in the Philippine sea, and also distributed in the South China Sea and EWNP. However, the amount of TC generated in autumn is always more than that in summer regardless of the intensity.
Since there is no obvious advantage of the climatology physical quantities in autumn, and considering the existence of interannual disturbance, we deduced that the unique feature of the upper level high-pressure/anticyclonic anomaly over east Asia/western Pacific sector play the key role in TC-genesis difference. The disturbance fields obtained by regressing onto the TC genesis frequency of the corresponding season show that, in autumn WNP is mainly controlled by high pressure and anticyclonic anomalous circulation, while it is the opposite in summer. This distribution pattern is conducive to the formation of high-level pumping in the fall, thus promoting the genesis of TC. By comparing the disturbance pattern at high and low levels, we found that the abnormal circulation signal at the upper layer in autumn comes from north tropical Atlantic. Once a negative SSTA occurs in north tropical Atlantic, the air column will be compressed and the isobaric surface of the upper layer will be reduced, accompanied by the occurrence of middle latitude cyclonic anomaly. This middle-latitude cyclone will trigger a strong anomalous high pressure and anticyclone circulation over high latitude. Subsequently, the anomalous signal is transmitted southeastward through two ways in the form of the Rossby wave train, until a large anomalous high-pressure/anticyclonic area is formed over the east Asia/western Pacific. This theory is also verified in the analysis of RWS and WAF. While since the lower climatic SST in summer, the atmospheric response sensitivity is weak when negative SSTA occurs, which is not easy to cause air column compression. And we conjecture that the dominant disturbance signal in summer should be PMM via the distribution of SST and wind in situ.
Based on the WNP TC genesis frequency, this study found the possible relationship between seasonality of WNP TC number and north tropical Atlantic SSTA, and explained the physical process behind to some extent, which has certain guiding significance for the seasonal prediction of WNP TC number. Moreover, predecessors have found that north tropical Atlantic SST can influence WNP circulation and TC activities through Indian Ocean relay mechanism and eastern Pacific relay mechanism (Ham et al., 2013; Yu et al., 2016; Gao et al., 2018), and this study gives the possibility of the existence of another influence path, which complements the previous work. However, there are still some problems that have not been solved, such as whether the regional circulation factors that cause the location difference of TC generation between the two seasons are the same. What is the difference between the time scales and the patterns of the anomalous signals that travel eastward in the Atlantic ocean and interact with the ENSO in the Pacific Ocean in terms of WNP TC generation or landing activities? And can this seasonal difference be replicated in climate model? These problems need further study.
Data Availability Statement
The original contributions presented in the study are included in the article, further inquiries can be directed to the corresponding author.
Author Contributions
ZC, JLi, and JLiu: research concept, methodology, formal analysis, data curation, writing original draft preparation, writing—review, and editing. JLiu: supervision. All authors equally collaborated in the research presented in this publication by making the above contributions.
Funding
This study was supported by the National Natural Science Foundation of China (41630423 and 41875069).
Conflict of Interest
The authors declare that the research was conducted in the absence of any commercial or financial relationships that could be construed as a potential conflict of interest.
Acknowledgments
NCEP/NCAR reanalysis data and NOAA ERSST V4 data are provided by the NOAA/OAR/ESRL PSD, Boulder, Colorado, Unites States, from their website at https://www.esrl.noaa.gov/psd/. TC best track dataset is provided by the JTWC at http://www.metoc.navy.mil/jtwc/jtwc.html?best-tracks.
References
Camargo, S. J., Wheeler, M. C., and Sobel, A. H. (2009). Diagnosis of the mjo modulation of tropical cyclogenesis using an empirical index. J. Atmos. 66 (10), 3061–3074. doi:10.1175/2009JAS3101.1
Chan, J. C. L. (2000). Tropical cyclone activity over the Western North Pacific associated with El Niño and La Niña events. J. Clim. 13, 2960–2972. doi:10.1175/1520-0442(2000)013<2960:tcaotw>2.0.co;2
Chia, H. H., and Ropelewski, C. F. (2002). The interannual variability in the genesis location of tropical cyclones in the northwest Pacific. J. Clim. 15, 2934–2944. doi:10.1175/1520-0442(2002)015<2934:tivitg>2.0.co;2
Choi, K.-S., Wu, C.-C., and Cha, E.-J. (2010). Change of tropical cyclone activity by Pacific-Japan teleconnection pattern in the western North Pacific. J. Geophys. Res. 115, D19114. doi:10.1029/2010JD013866
Chu, J. H., Sampson, C. R., Levine, A. S., and Fukada, E. (2002). The joint typhoon warning center tropical cyclone besttracks, 1945–2000. Washington, DC: Naval Research Laboratory.
Gao, S., Chen, Z., and Zhang, W. (2018). Impacts of tropical North Atlantic SST on western North Pacific landfalling tropical cyclones. J. Clim. 31 (2), 853–862. doi:10.1175/JCLI-D-17-0325.1
Gao, S., Chen, Z., Zhang, W., and Shen, X. (2020b). Effects of tropical north Atlantic Sea surface temperature on intense tropical cyclones landfalling in China. Int. J. Climatol. 1–10 doi:10.1002/joc.6732
Gao, S., Zhu, L., Zhang, W., and Shen, X. (2020a). Impact of the Pacific Meridional Mode on landfalling tropical cyclone frequency in China. Q. J. R. Meteorol. Soc. 146, 2410–2420. doi:10.1002/qj.3799
Girishkumar, M. S., Thanga Prakash, V. P., and Ravichandran, M. (2015). Influence of pacific decadal oscillation on the relationship between ENSO and tropical cyclone activity in the Bay of Bengal during October–December. Clim. Dynam. 44 (11–12), 3469–3479. doi:10.1007/s00382-014-2282-6
Goh, A. Z. C., and Chan, J. C. L. (2010). An improved statistical scheme for the prediction of tropical cyclones making landfall in South China. Weather Forecast. 25, 587–593. doi:10.1175/2009WAF2222305.1
Ham, Y.-G., Kug, J.-S., Park, J.-Y., and Jin, F.-F. (2013). Sea surface temperature in the north tropical Atlantic as a trigger for El Niño/Southern Oscillation events. Nat. Geosci. 6, 112–116. doi:10.1038/ngeo1686
Huang, B., Banzon, V. F., Freeman, E., Lawrimore, J., Liu, W., Peterson, T. C., et al. (2015). Extended reconstructed sea surface temperature version 4 (ERSST.v4). Part I: upgrades and intercomparisons. J. Clim. 28 (3), 911–930. doi:10.1175/JCLI-D-14-00006.1
Huo, L., Guo, P., Hameed, S. N., and Jin, D. (2015). The role of tropical Atlantic SST anomalies in modulating western North Pacific tropical cyclone genesis. Geophys. Res. Lett. 42 (7), 2378–2384. doi:0.1002/2015GL06318410.1002/2015gl063184
Kalnay, E., Kanamitsu, M., Kistler, R., Collins, W., Deaven, D., Gandin, L., et al. (1996). The NCEP/NCAR 40-year reanalysis project. Bull. Am. Meteorol. Soc. 77 (3), 437–471. doi:10.1175/1520-0477(1996)077<0437:TNYRP>2.0.CO;2
Kim, J.-H., Ho, C.-H., Kim, H.-S., Sui, C.-H., and Park, S. K. (2008). Systematic variation of summertime tropical cyclone activity in the western north pacific in relation to the madden–julian oscillation. J. Clim. 21 (6), 1171–1191. doi:10.1175/2007JCLI1493.1
Kim, J.-S., Li, R. C.-Y., and Zhou, W. (2012). Effects of the Pacific-Japan teleconnection pattern on tropical cyclone activity and extreme precipitation events over the Korean peninsula. J. Geophys. Res. 117, D18109. doi:10.1029/2012JD017677
Lander, M. A. (1994). An exploratory analysis of the relationship between tropical storm formation in the western North Pacific and ENSO. Mon. Weather Rev. 122, 636–651. doi:10.1175/1520-0493(1994)122<0636:aeaotr>2.0.co;2
Liu, K. S., and Chan, J. C. L. (2003). Climatological characteristics and seasonal forecasting of tropical cyclones making landfall along the South China coast. Mon. Weather Rev. 131, 1650–1662. doi:10.1175//2554.1
Liu, F., Li, T., Wang, H., Deng, L., and Zhang, Y. (2016). Modulation of boreal summer intraseasonal oscillations over the western North Pacific by ENSO. J. Climate, 29, 7189--7201. doi:10.1175/JCLI-D-15-0831.1
Lu, R., Zhu, Z., Li, T., and Zhang, H. (2019). Interannual and interdecadal variabilities of spring rainfall over northeast China and their associated sea surface temperature anomalies forcings. J. Clim. 33, 1423–1435. doi:10.1175/JCLI-D-190302.s1
Sardeshmukh, P. D., and Hoskins, B. J. (1988). The generation of global rotational flow by steady idealized tropical divergence. J. Atmos. Sci. 45, 1228–1251. doi:10.1175/1520-0469(1988)045<1228:tgogrf>2.0.co;2
Takaya, K., and Nakamura, H. (2001). A formulation of a phase-independent wave-activity flux for stationary and migratory quasigeostrophic eddies on a zonally varying basic flow. J. Atmos. Sci. 58, 608–627. doi:10.1175/1520-0469(2001)058<0608:afoapi>2.0.co;2
Wang, B., and Chan, J. C. L. (2002). How strong ENSO events affect tropical storm activity over the western North Pacific. J. Clim. 15, 1643–1658. doi:10.1175/1520-0442(2002)015<1643:hseeat>2.0.co;2
Wang, H., and Fan, K. (2007). Relationship between the Antarctic oscillation in the western North Pacific typhoon frequency. Chin. Sci. Bull. 50, 1251–1257. doi:10.1007/S11434-007-0040-4
Wang, C., Li, C., Mu, M., and Duan, W. (2013). Seasonal modulations of different impacts of two types of ENSO events on tropical cyclone activity in the western North Pacific. Clim. Dynam. 40, 2887–2902. doi:10.1007/s00382-012-1434-9
Wu, L., and Wang, B. (2004). Assessing impacts of global warming on tropical cyclone tracks. J. Clim. 17, 1686–1698. doi:10.1175/1520-0442(2004)017<1686:aiogwo>2.0.co;2
Wu, L., Wang, B., and Geng, S. (2005). Growing typhoon influence on east Asia. Geophys. Res. Lett. 32 (18), 15. doi:10.1029/2005GL022937
Yao, X., Zhao, D., and Li, Y. (2020). Autumn tropical cyclones over the western north pacific during 1949–2016: a statistical study. J. Meteorol. Res. 34 (1), 150–162. doi:10.1007/s13351-020-9019-8
Yu, J., Li, T., Tan, Z., and Zhu, Z. (2016). Effects of tropical North Atlantic SST on tropical cyclone genesis in the western North Pacific. Clim. Dynam. 46 (3–4), 865–877. doi:10.1007/s00382-015-2618-x
Zhan, R., Wang, Y., and Lei, X. (2011). Contributions of ENSO and east Indian Ocean SSTA to the interannual variability of northwest Pacific tropical cyclone frequency. J. Clim. 24, 509–521. doi:10.1175/2010JCLI3808.1
Zhang, W., Vecchi, G. A., Murakami, H., Delworth, T. L., Wittenberg, A. T., Anderson, W. G., et al. (2016b). Improved simulation of tropical cyclone responses to ENSO in the western North Pacific in the high-resolution GFDL HiFLOR coupled climate model. J. Clim. 29, 1391–1415. doi:10.1175/JCLI-D-15-0475.1
Zhang, W., Vecchi, G. A., Murakami, H., Villarini, G., and Jia, L. (2016a). The Pacific meridional mode and the occurrence of tropical cyclones in the western North Pacific. J. Clim. 29, 381–398. doi:10.1175/JCLI-D-15-0282.1
Zhang, W., Vecchi, G. A., Murakami, H., Villarini, G., Delworth, T. L., Yang, X., et al. (2018). Dominant role of Atlantic multidecadal oscillation in the recent decadal changes in western North Pacific tropical cyclone activity. Geophys. Res. Lett. 45 (1), 354–362. doi:0.1002/2017GL07639710.1002/2017gl076397
Zhang, W., Graf, H.-F., Leung, Y., and Herzog, M. (2012). Different El Niño types and tropical cyclone landfall in east Asia. J. Clim. 25 (19), 6510–6523. doi:10.1175/JCLI-D-11-00488.1
Zhang, W., Vecchi, G. A., Villarini, G., Murakami, H., Rosati, A., Yang, X., et al. (2017). Modulation of western North pacific tropical cyclone activity by the atlantic meridional mode, Clim. Dynam., 48 (1–2), 631–647. doi:10.1007/s00382-016-3099-2
Keywords: seasonal difference, western North Pacific, north tropical Atlantic sea surface temperature, Rossby wave train, tropical cyclone number
Citation: Liu J, Chen Z and Li J (2020) The Comparison of the Tropical Cyclone Number Over the Western North Pacific Between Summer and Autumn. Front. Earth Sci. 8:597912. doi: 10.3389/feart.2020.597912
Received: 22 August 2020; Accepted: 16 October 2020;
Published: 11 November 2020.
Edited by:
Lei Zhang, University of Colorado Boulder, United StatesReviewed by:
Wen Zhou, City University of Hong Kong, Hong KongKelvin T. F. Chan, Sun Yat-sen University, China
Copyright © 2020 Liu, Chen and Li. This is an open-access article distributed under the terms of the Creative Commons Attribution License (CC BY). The use, distribution or reproduction in other forums is permitted, provided the original author(s) and the copyright owner(s) are credited and that the original publication in this journal is cited, in accordance with accepted academic practice. No use, distribution or reproduction is permitted which does not comply with these terms.
*Correspondence: Jia Liu, bGl1amlhODMzMjRAMTI2LmNvbQ==
 Jia Liu
 Zhifan Chen
 Jiang Li2