- 1School of Geoscience and Technology, Southwest Petroleum University, Chengdu Sichuan, China
- 2State Key Laboratory of Oil and Gas Reservoir Geology and Exploration, Southwest Petroleum University, Chengdu, China
- 3PetroChina Zhejiang Oilfield Company, Hangzhou, China
The tight sandstone reservoirs of the Lower Silurian Kepingtage Formation are important exploratory targets for tight gas resources in the Shuntuoguole Low Uplift of Tarim Basin. How to evaluate tight sandstone reservoir is an urgent problem to be solved. In this study, we investigated the effects of diagenesis on the heterogeneity of tight sandstone deposits in similar sedimentary facies and established the relationship between the diagenetic facies and reservoir quality. Cores of the tight sandstone reservoirs of Lower Silurian Kepingtage Formation in Shuntuoguole Low Uplift are studied with thin section observation, SEM, XRD, and mercury injection. Quantification of diagenesis influencing porosity suggests that sandstone densification is mainly controlled by compaction, cementation, and hydrocarbon charging (bitumen charging), and the reservoir properties are effectively improved by dissolution, based on which 6 types of diagenetic facies are classified. Interpretation of the log data from individual wells with “K nearest neighbor” algorithm concludes that top and base of the upper member of Kepingtage Formation are believed to have favorably diagenetic reservoirs mainly falling in Type V; favorably diagenetic facies develop best in the lower member of Kepingtage Formation predominated by Types V and VI which mainly distribute in its top. Composite analysis of diagenetic facies, sedimentary facies, and porosity distribution shows that the favorable area of further exploration and development is east of Well SH903 and north of Well SH10. The quantitative identification of diagenetic facies based on logging information can provide reasonable results for the evolution of the tight sandstone reservoirs for a similar area in the Tarim Basin.
Introduction
The evaluation and prediction of the tight sandstone reservoirs have been hotspots for the petroleum industry (Guo et al., 2019; Ren et al., 2019; Xiao et al., 2019; Li et al., 2020). The actual exploration effect of the traditional method for the evaluation of tight sandstone reservoirs is poor, which is mainly because the fact that the reservoir physical parameters can not reflect the strong heterogeneity of tight sandstone reservoir (Nian et al., 2016; Zhu et al., 2016; Zhou et al., 2019; Qiao et al., 2020). Continuous researches on diagenesis have made significant achievements in which multi-technological quantitative evaluation is used (Hao et al., 2010; Guo et al., 2018; Qin et al., 2018; Xi et al., 2019). Rapid quantitative evaluation of diagenesis based on diagenetic facies study is the most widely used now and will be the major methodology (Jiang et al., 2014; Zhu et al., 2016; Cui Y et al., 2017). Diagenetic facies including mineral constituents, cement, fabric, pores, and fractures, which reflects the current mineral composition and fabric features and is the genetic mark representing reservoir nature, type, and quality, is the result of sediments which underwent diagenesis and a period of diagenetic evolution (Zou et al., 2008; Li et al., 2019; Li et al., 2020). Diagenetic facies study focusing on the effects of diagenesis process on reservoir properties and pore configuration (Ochoa, 2010; Cui et al., 2017; Lai et al., 2018) is to effectively help hydrocarbon exploration and development by determining the spatial distribution of high-quality reservoir to provide reliable evidence for reservoir prediction (Maast et al., 2011; Meng et al., 2015; Li et al., 2019).
The previous study of diagenetic facies mainly relied on relative core analysis, especially on data of thin section, SEM, and cathode luminescence reflecting microscopic features (Lai et al., 2013; Qin et al., 2018). Limitation of core data results in the inability to show the vertical variation of the diagenetic facies whereas log data continuously record all the physical properties of the penetrated layers (Aysen et al., 2011; Cui et al., 2017; Lai et al., 2019; Zhou et al., 2019). Thus, core-based diagenetic facies identification combined with related well log responses to different diagenetic facies leads to the identification of vertically continuous diagenetic facies in individual wells, so that diagenesis can be evaluated quantitatively and rapidly.
Lower Silurian Kepingtage Formation in Shuntuoguole low uplift is typical tight sandstone with very high heterogeneity (Zhao et al., 2015; Yin et al., 2017; Wang et al., 2020). In relatively stable tectonic settings, sedimentation is the basis of reservoir development while diagenesis which plays a vital role in the intensification of sandstones determines the reservoir quality and distribution. Therefore, systematical quantitative studies of diagenesis and diagenetic facies result in the identification of the high-quality reservoir distribution pattern and are of great significance to the prediction of Silurian tight reservoirs in the study area.
Geologic Setting
Located in the Xinjiang Uygur Autonomous Region, northwest of China, Tarim Basin is a large composite sedimentary basin developed on the Presinian metabase. Shuntuoguole low uplift, lying in the north of central uplift zone of Tarim Basin with Awati Sag to the west, Manjiaer Sag to the east, Tabei Uplift to the north, and Tazhong Uplift to the south, is a “saddle” hinge structure between two positive south-north structural belts and two negative east-west structural belts, which is wide in the northern and narrow in the southern (Xiong et al., 2013). It is a sub-low-uplift on the northern slope of central Tarim Basin (Figure 1A). The Paleozoic, Mesozoic, and Cenozoic strata are completely distributed, and the Ordovician, Silurian, Devonian, and Jurassic Cretaceous are missing in some parts, so the overall tectonic activity is relatively stable (Li et al., 2012). The Silurian in the study area is mainly a set of clastic rocks of shoreside-shallow shelf facies, lithologically composed of gray-green argillaceous siltstone, gray mudstone, and purple-red siltstone (Zhao et al., 2015). The Silurian is composed of the Kepingtage Formation, the Tataaiertage Formation, and the Imutantawu Formation. The research horizon is the Kepingtage Formation mainly divided into a lower member (S1k1), middle member (S1k2), and upper member (S1k3). The lower member (S1k1) is composed of Barrier bar and Shoreface interbedded deposits, and sandstone reservoir developed (Sun et al., 2013). The upper member (S1k3) developed the delta front environment, mainly developing underwater distributary channels, mouth bar, and underwater distributary interchannel microfacies (Zeng et al., 2018; Yin et al., 2017). Gray mudstone developed in the middle member (S1k2) and upper part of upper member (S1k3), constitutes a good cap layer in the region, thus forming several sets of favorable reservoir-cap assemblages in the study area (Figure 1B). They are the major exploration targets for Paleozoic clastic rock hydrocarbon exploration in the Shuntuoguole region (Xiong et al., 2013; Cai et al., 2014; Peng et al., 2018; Wang et al., 2020).
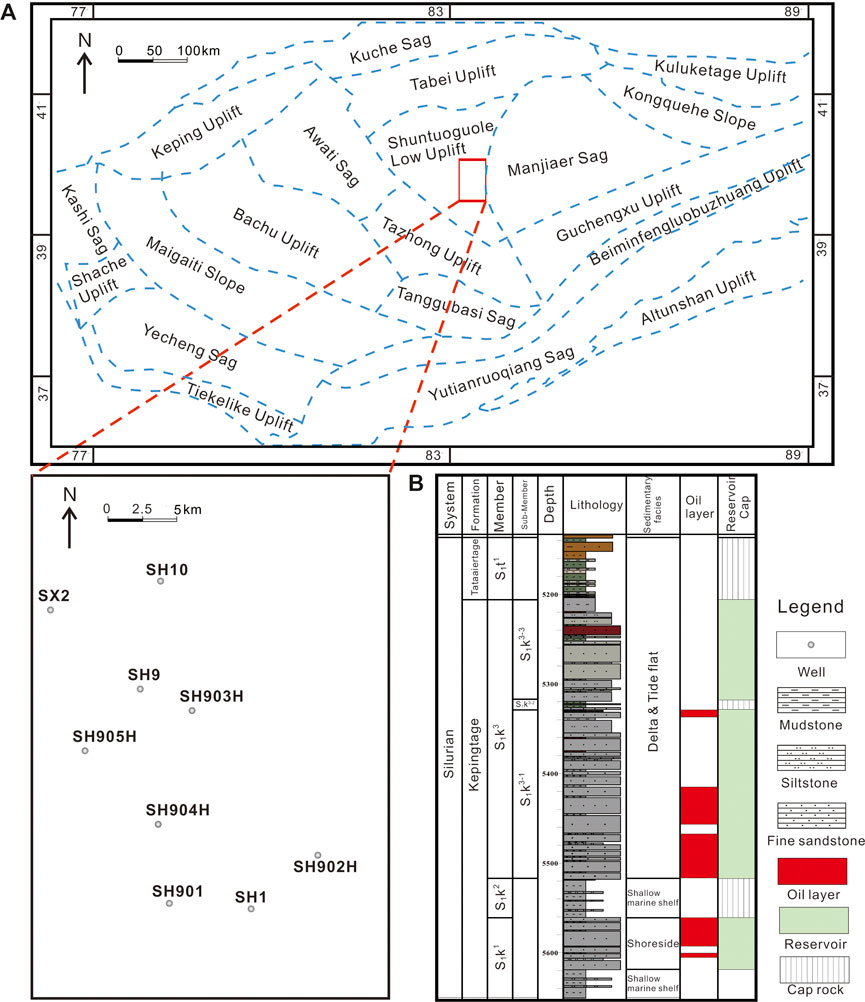
FIGURE 1. Structural location and well location distribution in the study area. (A) Location of Shuntuoguole low uplift and surrounding structural features. (B) Lithological profile and reservoir-caprock assemblage of Kepingtage Formation (S1k1, totally 90~150m thick shoreside (non-barrier coast)-shallow marine shelf facies deposit that is different from common high-energy shoreside due to low-energy water body, mainly consists of fine-grain sandstone with medium-grain sandstone and siltstone in the upper part and mudstone in the lower part. S1k2, 43~59m thick, deposited in the shallow marine shelf. S1k3, 287~342m thick, depositing in delta (tidal action) depositional system, mainly consists of silt-fine sandstone interbedded with silty mudstones, with a 15~30m mudstone in its middle part. The three sandstone members, S1k3-3, S1k3-1, and S1k1, containing reservoirs with abundant oil and gas, form several favorable reservoir-cap assemblages in combination with S1k3-2, S1k2, and S1t1).
Samples and Methods
This study takes 300 cores (sampling from 5,164–5,712 m) from 8 wells in the low uplift in Shuntuoguole. 308 thin sections with each one having 200 points are made for a series of tests, including petrology, petrophysical property, porous structure, and diagenesis. Polarizing microscope (LV100POL) is used to observe the mineral composition, shape, texture, optical feature, and type and size of the pores. Microscopic shape and texture are observed for 55 samples using a Scanning electronic microscope (XL30). Clay mineralogical content is analyzed for 53 samples through X-ray diffraction (D/max2,500 PC). Physical properties and pore configuration of the sandstone are analyzed for 122 samples using mercury intrusion porosimeter (AutoPore9500). The original porosity of the sandstone is restored through particle size analyzer (SFY-D Acoustic Screener and CG-1 Centrifugal Settling Particle Size Distribution Analyzer).
Results
Reservoir Lithologies
Kepingtage Formation mainly consists of fine sandstone (grain sizes ranging from 0.09 to 0.25 mm) which contains litharenite (61.86%), sublitharenite (17.63%), and feldspathic litharenite (11.22%) (Figure 2).
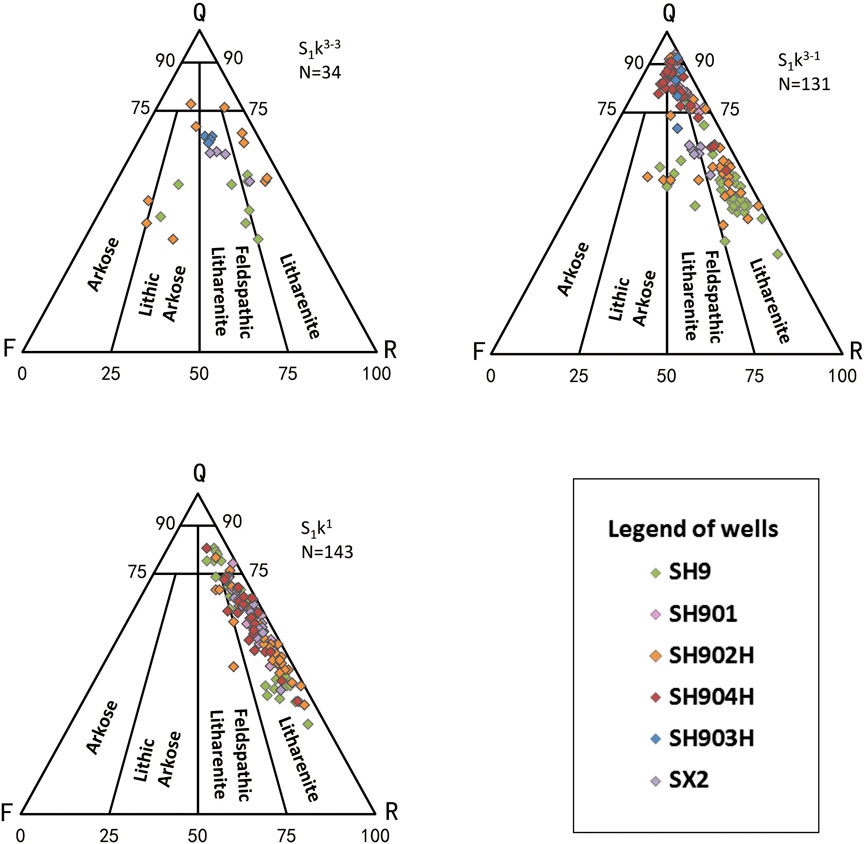
FIGURE 2. Composition determined from thin-section analysis (a. S1k3-3. B. S1k3-1. C. S1k1.). (Q—Quartz + Chert; F—Feldspar; R—Rock fragments) (ternary diagram from Zhao and Zhu, 2006).
The clastic constituents predominantly comprise quartz (62.0%) that mainly contain single-crystal quartz with some chert. They comprise less feldspar (7.0%), which is commonly sericitized, and K-spar content is higher than plagioclase. The proportion of debris in the rock fragments which primarily consist of metamorphic rock debris and sedimentary rock debris. Besides, heavy minerals like zircon, tourmaline, garnet, apatite, and pyrite can be seen despite their very low content. Grains sorting is good and poorly rounded.
The cement account for 66.7% of interstitial materials, and the first biggest proportion is calcareous cement (45.7%) with calcite that is inhomogeneous as the main composition. The second is siliceous cement (16.7%) which is dominated by quartz overgrowth and intergranular authigenic quartz. There is very little clay (0.4%) which is mainly illite-smectite hybrid, illite, and chlorite. Moreover, argillaceous matrix (27%) and slight bitumen (6.3%) are also seen in the interstitial materials.
Reservoir Properties
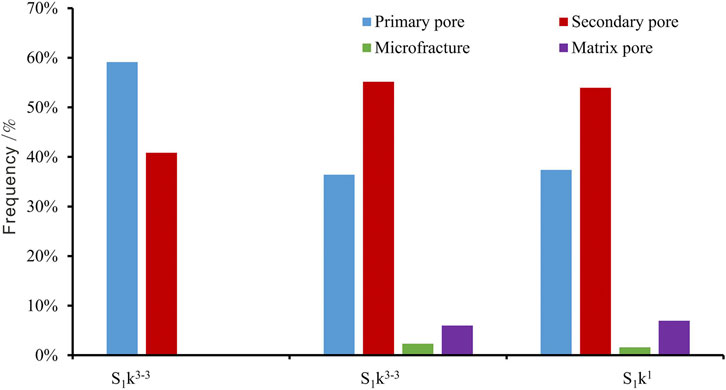
Kepingtage Formation sandstone mainly contains secondary dissolved pores, primary intergranular pores, microfractures, and composition matrix pores. The secondary dissolved pores, accounting for about 52.3% of plane porosity, include intergranular dissolved pores that are the most dominant, intragranular dissolved pores, intercrystal pores, and moldic pores (Figure 3A). Primary intergranular pores (Figure 3b) take 39.2% while microfractures that are commonly filled by bitumen or argillaceous material only take about 2.2% of the plane porosity. For the three sandstone members, S1k3-3 is dominated by primary intergranular pores, whereas S1k3-1 and S1k1 dominantly contain secondary intergranular pores (Figure 4).
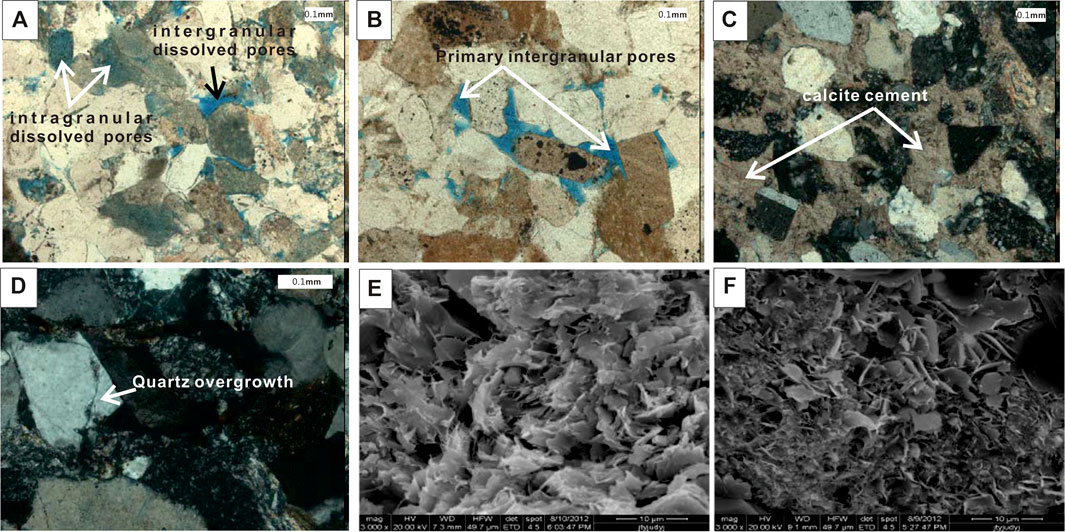
FIGURE 3. Microphotographs of Kepingtage Formation reservoir rocks (A) Intergranular dissolved pores and intragranular dissolved pores, fine to medium grained litharenite, Well Sh904H, 5576.58m, 10 × 10, (-) (B) Residual primary intergranular pores and intergranular dissolved pores, fine-medium grained quartz litharenite, Well Sh901, 5503.62m, 10 × 10, (-) (C) Intergrowth calcite cement, fine to medium grained litharenite, Well Sh904H, 5584.40m, 10 × 10, (+) (D) Quartz overgrowth, fine to medium grained litharenite, Well Sh904H, 5511.08m, 10 × 20, (+) (E) Particle surface with filamentous and laminated illite-smectite mixed layer, fine-medium grained quartz litharenite, Well Sh904H, 5367.66m, SEM, 300×. (F) Particle surface with laminated chlorite, fine to medium grained litharenite, Well SX2, 5678.26m, SEM 3000×.
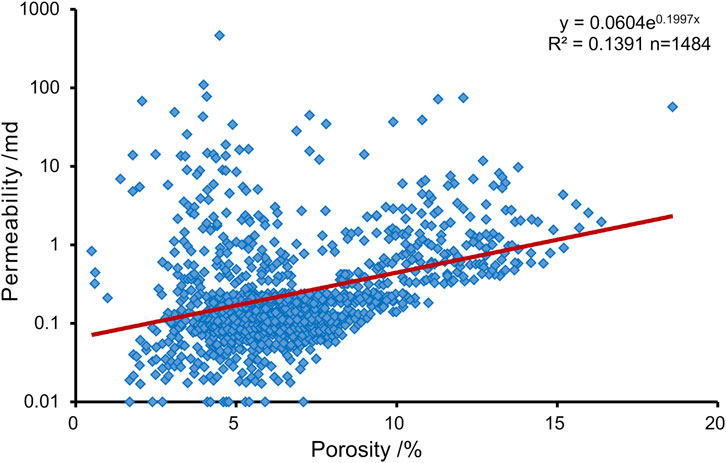
Core-based data from 1,400 samples show that Kepingtage Formation has generally poor physical properties. Porosity ranges from 0.5% to 16.4% and averages 7.0%, while air permeability, which is mainly 0.1–1 mD, ranges from 0.01 to 15.4 mD and averages 0.54 mD (Figure 5). Physical properties of the three sandstone members worsen increasingly with deeper burial: S1k3-3 porosity is 9.1% with an air permeability of 1.34 mD; S1k3-1 porosity is 7.50% with an air permeability of 0.57mD; S1k1 porosity is 6.1% with an air permeability of 0.32 mD.
Diagenesis
Kepingtage Formation underwent compaction, cementation, dissolution, metasomasis, hydrocarbon charging, and structural fracturing. It is the reworking of the multiple diageneses that leads to the property variations of different sandstone zones (Carvalho et al., 2014; Zhao et al., 2015; Peng, et al., 2018; Zeng et al., 2018).
Compaction which worked throughout the burial history of the sandstone reservoir (Zhou et al., 2008) reduced the primary pores sharply at the early stage of diagenesis (Paxton et al., 2002). Kepingtage Formation experienced strong compaction which mainly accounts for the reduction of the Petrophysical property. Deep burial and high content of rock fragments which caused Kepingtage Formation to undergo strong compaction are the predominant causes of reduced porosity. Mechanical compaction was dominant and pressolution functioned little. Microscope-based analysis of compaction finds 1) that intergranular contact changes from point contact to line contact, even to concave-convex contact (Figure 3b), 2) that plastic grains like mica and soft debris became deformed and even fractured, and 3) that rigid grains such as quartz and feldspar misplaced or broken under compression.
Cementation is common in Kepingtage Formation, including calcareous cementation, siliceous cementation, and clay cementation. Cement generally reduces the porosity due to their filling up the pore space, but they can also resist compaction by enhancing the frame strength (Zaid, 2013; Yuan et al., 2015; Peng, 2018).
1) Calcareous cementation. Calcareous cement primarily consists of calcite. Microscope-based observation and thermometry of primary inclusion captured by the calcite-cement show that early- and late-stage calcite cementations occurred. The early-stage cement has intergrowth texture with alternation of rock fragments of which quartz has no overgrowth at their edges (Figure 3C). The homogenization temperature of the inclusion ranges from 80°C to 100°C. The late-stage calcite cement is commonly clot-shaped or granular with quartz overgrowth. The homogenization temperature of the inclusion ranges from 140 to 150°C.
2) Siliceous cementation. In sandstones with intense calcareous cementation, siliceous cement, developing to a relatively low degree, have quartz overgrowth around the surface in an ear-like or irregular ring-like shape, with the enlarged edge of 0.01–0.08 mm thick (Figure 3D).
3) Clay cementation. Clay cement that mainly contains illite, illite-smectite mixed layer, and chlorite, with very little kaolinite and chlorite-smectite mixed layer. SEM-based observation shows that illite occurs in sheet-like and cellular shapes on the clay particle surface, or extends outward in filament shape along the surface. The illite-smectite mixed layer resembles the irregular sheet of illite in morphology (Figure 3E) while chlorite whose individual morphology resembles niddles commonly coats the particle (Figure 3F).
Dissolution plays a vital role in the improvement of the physical properties of the reservoir. According to the SEM observation, dissolution occurs at the feldspar particle edge or cleavage where soluble compositions are dissolved, and residual part is sieve-like or wreckage-like with intergranular pores and intragranular pores (Figure 3A); feldspar is entirely eroded where mold pores are formed.
Metasomatism indicates rock fragments were alternated with calcite, and with feldspar and quartz, or with pyrite, and the alternated fragment particle has sawtooth-like or embayed edges (Figure 3C).
Hydrocarbon charging slows down the cementation rate and accelerates dissolution (Li et al., 2003; Molenaar et al., 2008; Guo et al., 2018; Wang et al., 2020), but residual bitumen filling the pores reduces porosity. Two stages of bitumen charging are identified. Residual bitumen during the first charging stage filled the primary intergranular pores along the eroded edge of the grains (Figure 6A), and the oil inclusion displays light gray-yellow or light yellow fluorescence (Figure 6B). Residual bitumen during the second charging filled the space beyond the quartz overgrowth edge (Figure 6C) and the dissolved pores of calcite cement, and the oil inclusion displays light bluish-green, light green, or green fluorescence (Figure 6D).
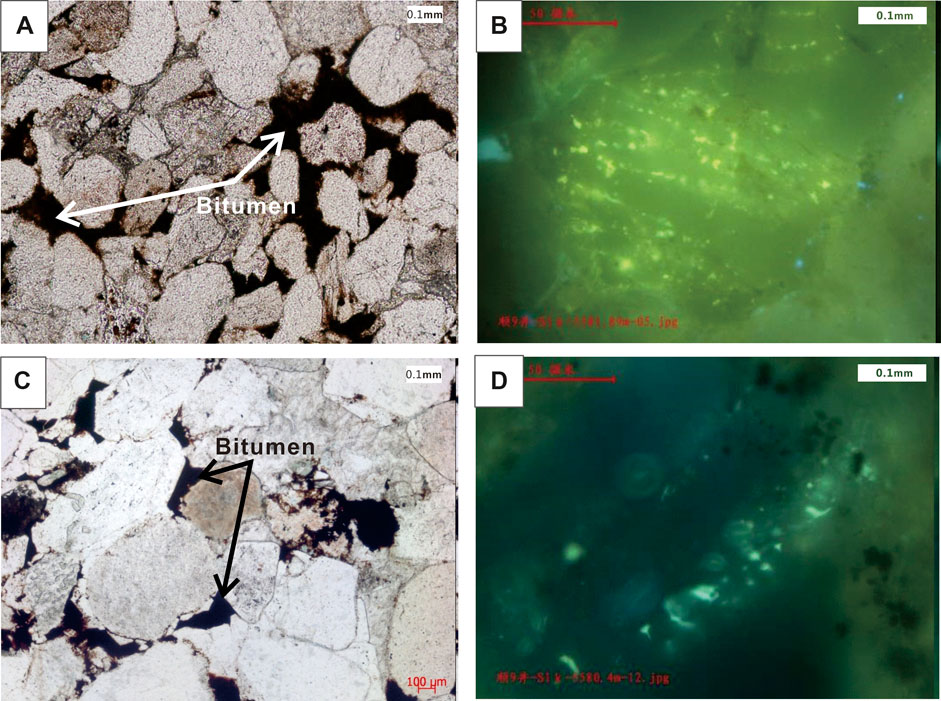
FIGURE 6. Microphotography of reservoir bitumen and fluorescent photography of inclusion (A) Bitumen filling along the corroded edge of the grains, Well Sh9, 5335.79m, 10 × 10 (-) (B) The hydrocarbon inclusions developed in quartz grains with a beaded distribution in the cracks, displaying yellow fluorescence, fine grayish sandstone with oily spots, Well Sh9, 5581.89m. (C) Bitumen filling into the dissolved pores of calcite cement later than quartz overgrowth, Well Sh9, 5476.48m, 10 × 10 (-). (D) The hydrocarbon inclusions develop in quartz grain cracks, which are scattered and uneven in size, displaying bluish-green fluorescence, fine grayish sandstone with oily spots, Well Sh9, 5580.4m.
Quantitative Evaluation of Diagenesis
Diagenesis and Porosity
Diagenesis controls the pore evolution of the sandstone reservoir (Pan et al., 2011; Zhao, 2015; Peng, 2018; Li et al., 2019; Xiao et al., 2019). Based on the above diagenesis study, a quantitative evaluate method of the effect of diagenetic events on sandstone porosity was performed using a screen test of particle size and thin section identification. First of all, the relationship between unconsolidated sandstone porosity and sorting coefficient under Earth surface condition (Beard and Weyl, 1973) is used to calculate initial porosity:
where Po is the Trask sorting coefficient.
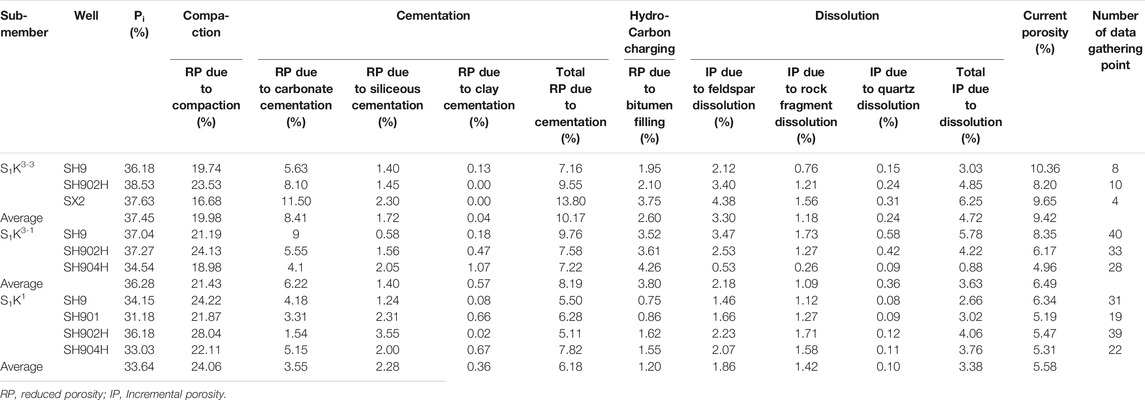
And then the contents of different cement, different pore types, and bitumen are calculated. Effects of different diagenetic events on porosity are calculated quantitatively using the relationship between the plane porosity and measured porosity (Table 1):
The quantitative calculation shows that the Kepingtage Formation is densified due to compaction, cementation, and hydrocarbon charging (bitumen filling) whereas its reservoir porosity is enhanced due to dissolution. Comparison of the evolution of the three sandstone members of Kepingtage Formation suggests that compaction influenced S1K1 most due to its biggest burial depth and its highest content of plastic grains of rock fragments. The physical properties of S1K3-3 are best because of secondary pores generated from relatively good dissolution though a lot of pore space was filled by calcareous cement and sandstone porosity was affected by cementation. None of the three sandstone members of Kepingtage Formation has been influenced significantly by clay cementation. Besides, bitumen filling has also reduced porosity, which is the most obvious in the S1K3-1 sandstone reservoir.
Classification and Characteristics of Diagenetic Facies
Since there has been no unified scenario for classification and naming of diagenetic facies so far (Zou et al., 2008; Cui et al., 2017; Lai et al., 2018; Li et al., 2019), this study proposes “cause (type and intensity of diagenesis) + effect (influence on the reservoir)” scenario on the basis of practicability and quantification. Based on the characteristics and differences of diagenetic facies, this scenario classifies Kepingtage Formation sandstones into 6 types of diagenetic facies with parameters like compaction coefficient, calcareous cement content, bitumen content, primary intergranular pore volume, and secondary pore volume (from thin section analysis), and measured physical properties, and pore texture (from mercury intrusion): tight facies from strong compaction (Type I), tight facies from calcareous cementation (Type II), tight facies from bitumen filling (Type III), porosity preservation facies from weak diagenesis (Type IV), porosity enhancement facies from medium dissolution (Type V), and porosity generation facies from strong dissolution (Type VI). According to the clastic rock reservoir evaluation criteria of the Kepingtage Formation (Cai et al., 2014),Types I, II, and III are unfavorable diagenetic facies while Types IV, V, and VI are favorable. The characteristics of each diagenetic facies are shown in Table 2.
Automatic Identification of Diagenetic Facies
The effective identification of diagenetic facies is a difficult problem in reservoir evaluation. Due to the limitation of the core data, it is a common method to characterize sandstone reservoir by logging curve (Zhou et al., 2008; Hao et al., 2010; Qiao et al., 2020; Zhu et al., 2020). Scholars adopt different methods, including multi-parameter comprehensive identification (Paxton et al., 2002; Jiang et al., 2014; Lai et al., 2019; Li et al., 2019), optimization of Logging Mathematical Model for Identification (Cui et al., 2017; Qin et al., 2018; Guo et al., 2019). The well logs including GR that reflects the lithology and sedimentary environment of sandstone, AC, DEN and CNL that directly indicate porosity differences, and the resistivity logs like RILM and RILD are used to characterize the distribution of diagenetic facies continuously and quantitatively. Picking different logs for specific diagenetic facies as sampled data, this study actualizes the automatic identification of the vertical diagenetic facies using “K nearest neighbor (KNN)” discriminance (He et al., 2014; Lai et al., 2019; Zhou et al., 2019).
The KNN algorithm is to express n term well log value in the training sample set of different diagenetic facies samples as n-dimension characteristic vector, and then to calculate similarity between n-dimension vector point that is formed by well log data to be classified and each n-dimension sector in training sample set. If the very point and the majority of K samples of the nearest neighbor belong to the same diagenetic facies type, the sample belongs to the same type accordingly. In this way, obvious overlap of the well logs for different diagenetic facies types can be solved easily (Table 3).
The Algorithm goes as follows
(1) A training sample set is generated based on the known diagenetic facies classification.
(2) Similarity between the unknown sample and each sample in the training sample set is calculated using the following equation:
where
(3) Weight for each category of the unknown sample in the known categorized sample set is calculated with the following equation:
where
(4) The Unknown sample is categorized into the known category with the biggest weight.
The diagenetic facies of individual wells in the study area is identified with the above algorithm on Matlab software platform (Figure 7). To verify the accuracy of the identification result, this study correlates the log-based identified facies with core-based ones. The correlation shows that matching rate is up to 78.6%, and the favorable diagenetic facies corresponds well to the show of oil and gas from the mud log data (Figure 7), suggesting the prediction of the diagenetic facies of the non-coring intervals with the above method is reliable. The logging information of tight sandstone can effectively reflect the lithologic and property changes of reservoir, and can be used as a reliable basis for diagenetic facies identification.
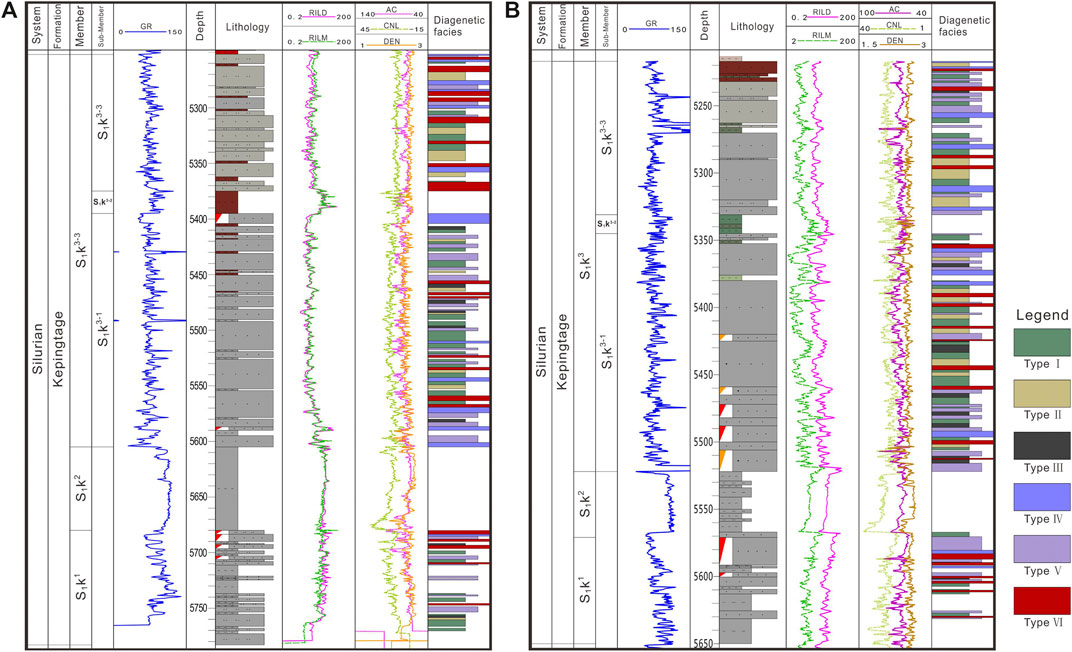
FIGURE 7. The identification result of diagenetic facies of Kepingtage Formation (A. Well SH903H. B. Well SH10.) (The first fifth tracks display system, formation, member, sub-member, and gamma curve respectively. Depth and lithology are shown in the sixth and seventh track. The eighth and ninth tracks display the key logs involved in diagenetic facies calculation. The last track exhibits the results of the diagenetic facies identification.).
Distribution Regularity of Diagenetic Facies
The spatial distribution of different types of diagenetic facies is a key problem in the evaluation of the tight sandstone reservoirs. Traditional diagenetic facies prediction is based on reservoir parameters such as thickness, porosity, and permeability (Zou et al., 2008; Hao et al., 2010; Lai et al., 2013; Guo et al., 2019; Li et al., 2020; Qiao et al., 2020). However, there is a problem of low accuracy under the influence of reservoir heterogeneity. Identification of diagenetic facies logging effectively solves the problem of fewer sample points (He et al., 2014; Cui et al., 2017; Lai et al., 2019). At the same time, the prediction of reservoir main control factors is used for reference and has high accuracy and good practical effect.
The vertical distribution pattern was discussed by calculating proportions of different diagenetic facies in each sandstone member of the Kepingtage Formation (Figure 8). Unfavorable diagenetic facies occupies 50% of S1k3-3, of which Type I takes up 26.9%, Type II 21.6%, and Type III a smaller proportion. All the three types of favorable diagenetic facies develop in this zone, primarily Type V (25.1%), secondarily Type IV (15.9%), and then Type VI. The favorable diagenetic facies predominantly occur in the top and bottom sandstone zones although mud log does not show oil and gas.
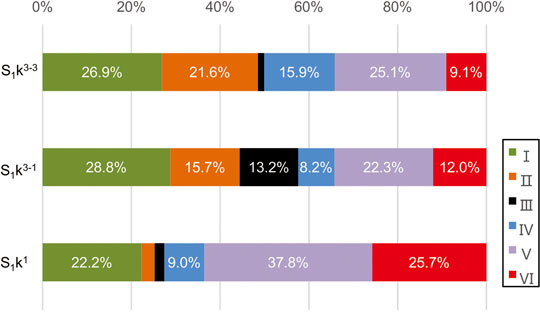
FIGURE 8. Distribution of Diagenetic Facies Types for sandstone members of Kepingtage Formation. (The three rows respectively represent the diagenetic facies prediction results of the three sandstone members of the Kepingtage Formation. Different colors represent the percentage ratios of different diagenetic facies. The order from left to right is the type I to type VI, as shown in the legend.)
The 60% diagenetic facies of S1k3-1 is unfavorable, where Types I, II, and III develop well of which Type III occupies the biggest proportion (13.2%). Favorable diagenetic facies, which do not develop regularly, are mainly Type V and Type VI, and then Type IV. Evidence of oil and gas is commonly discovered in the bottom sandbody.
Favorable diagenetic facies develop best in S1k1, occupying over 75% of which Types V and VI are predominant. They primarily occur in the top part with a great quantity of evidence of oil and gas. Unfavorable diagenetic facies are mainly Type I (22.2%) while the other two are seldom seen. The above analysis is consistent with the result of the quantitative calculation of pore evolution.
Due to the lack of effective prediction methods, the study of diagenetic facies distribution is less (Hao et al., 2010; Pan et al., 2011; Cai et al., 2014; Li et al., 2019). Most scholars believe that sedimentary differentiation, which results in the spatial distribution variation in debris mineral composition, interstitial material content, granule size, and pore fluid property, provides different prerequisites for the later diagenesis, so the diagenetic facies distribution is significantly controlled by sedimentary facies (Zhang et al., 2011; Zeng et al., 2018; Qiao et al., 2020). In this study, the face-controlling method is used to study the favorable diagenetic facies distribution. Analysis of diagenetic facies and sedimentary facies of core samples combined shows that underwater distributary channels and mouth bar sand bodies primarily develop in S1k3-3 and S1k3-1. All types of diagenetic facies occur in the major part of the channel and its peripheries. The sandbody in the main part of the channel is thick and rich in quartz. The mid-part of the sandbody is favorable for primary intergranular pore preservation and the development of Type IV diagenetic facies whereas the upper and lower parts predominantly contain Types V and VI diagenetic facies. On the channel peripheries where the sandbodies are thinner with lower quartz content and stronger calcareous cementation, Type I and Type II diagenetic facies predominantly occur. In the mouth bar where the sandbody rich in quartz is well rounded and well-graded, types of favorable diagenetic facies occur. The Shoreface barrier bars has a high content of quartz and high sorting degree which make it easier for acid fluid to enter commonly occur in S1k1, and mainly develop Type V and Type VI diagenetic facies.
The purpose of diagenetic facies evaluation is to predict the range of favorable diagenetic facies distribution. This study evaluates the favorable diagenetic facies in the upper and lower members of Kepingtage Formation, identifies their distribution pattern, and draws a diagenetic facies distribution map (Figure 9) based on the lateral distribution pattern of the sedimentary facies in combination with porosity contours.
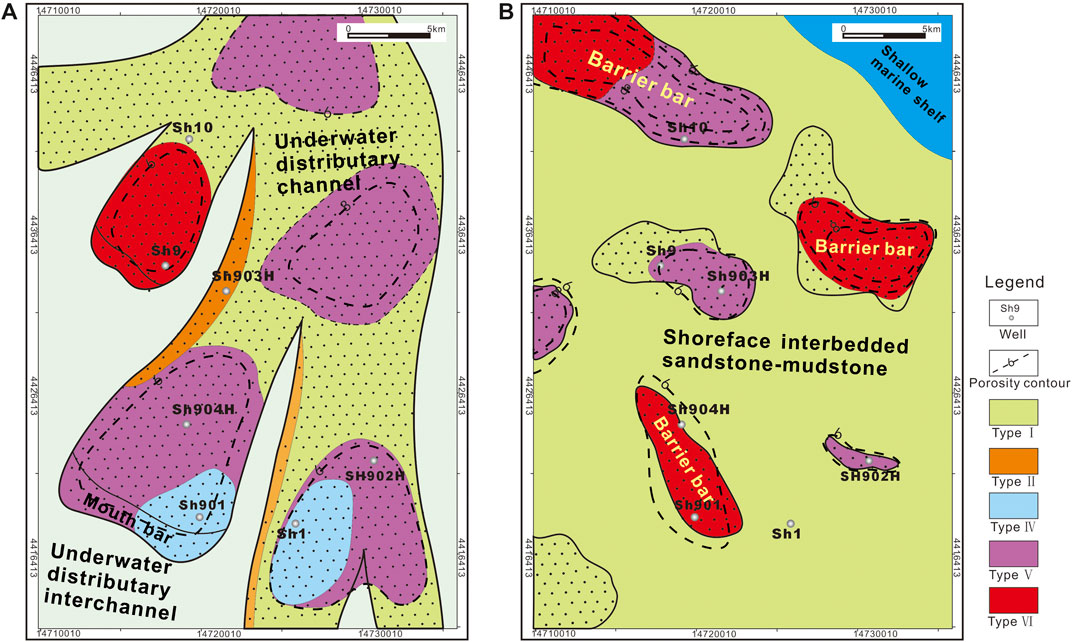
FIGURE 9. Distribution of diagenetic facies in Kepingtage Formation (a. S1k3. B. S1k1.). (Diagenetic facies boundaries are dotted lines representing the approximate range of distribution, and distribution is based on dominant diagenetic facies in single Well identification and the distribution refers to the sedimentary microfacies. Plane map of sedimentary microfacies are modified after Sun et al., 2013. Porosity contour is mapped according to the plane map of seismic porosity).
According to the diagenetic facies map, Type I facies occurs in S1k3 extensively. Type II facies occur in the peripheries of the underwater distributary channel and eastern fluvial channel (inferred) where Well SH903H is located. Type III facies typically occurs in Wells SH1 and SH901 area while Type V facies distributes in the area where Wells SH902H and SH904H lie. Porosity distribution shows that the area to the northeast of Well SH903H is the areas with high porosity values, which lie in the fluvial channel fairway. They are supposed to be the Type V facies distribution areas where both primary intergranular pores and secondary dissolved pores develop. Type VI diagenetic facies mainly distributes in the Well SH9 area.
Favorable Type V and Type VI diagenetic facies commonly occur in barrier bar sandbodies within S1k1. Type V facies distribute in Wells SH10, SH902H, and SH903H areas. It is inferred that the area of high porosity value to the west of Well SH903H contains Type V facies. Type VI facies dominantly distributes where Wells SH904H and SH901 are located because this area is a fracture-developed belt which is favorable for fluid dissolution. The northwest and east parts of the study area which are also fracture-developed have high porosity values and, therefore, are thought to have Type VI diagenetic facies dominantly. Type I diagenetic facies occurs extensively in the areas with alternating beds of sandstone and mudstone. Analysis of the lateral distribution of diagenetic facies comes to the conclusion that favorable diagenetic facies develop extensively to the east of Well SH903H and to the north of Well SH10, which are supposed to be the targets of future exploration and development.
Conclusions
1) The quantitative evaluation of porosity in the Kepingtag Formation diagenetic event supposed that the tightness of sandstone results from compaction, cementation, and hydrocarbon charging (bitumen filling) whereas the improvement of the reservoir properties is controlled by dissolution.
2) 6 types of diagenetic facies of Kepingtage sandstone are identified based on this study proposes “cause (type and intensity of diagenesis) + effect (influence on the reservoir)” scenario: tight facies from strong compaction (Type I), tight facies from carbonate cementation (Type II), tight facies from bitumen filling (Type III), porosity preservation facies from weak diagenesis (Type IV), porosity enhancement from medium dissolution (Type V), and porosity generation facies from strong dissolution (Type VI), of which Types I, II, and III are unfavorable whereas Types IV, V, and VI are favorable for effective reservoir development.
3) The results of the quantitative evaluation of diagenetic facies show that the distribution of diagenetic facies is mainly controlled by sedimentary microfacies, and the favorable diagenetic facies are mainly developed in the middle of underwater distribution channel and barrier bar thick sandbodies. Favorable diagenetic facies are best developed in S1k1 sandstone, of which Type V and Type VI, occurring primarily in its top, are dominant. The analysis of the lateral distribution of diagenetic facies in combination with the sedimentary facies and porosity concludes that the areas to the east of Well Sh903H and the north of Well SH10 are favorable for the future exploration and development.
4) A method for the quantitative identification of diagenetic facies was established, and the well logging parameters reflecting the tight sandstone rocks, sedimentary environment, and physical characteristics were selected for setting the similarity with the corresponding sample. The study adopted “KNN” discriminance to identify the vertical diagenetic facies, and the accuracy reached 78.6%. It shows that the logging information of tight sandstone can effectively reflect the lithology and physical property changes of the rock. Therefore, the quantitative identification of diagenetic facies based on logging parameters can provide reasonable results for the evolution of the tight sandstone reservoirs.
Data Availability Statement
The original contributions presented in the study are included in the article/Supplementary Material, further inquiries can be directed to the corresponding author.
Author Contributions
All authors listed have made a substantial, direct, and intellectual contribution to the work and approved it for publication.
Funding
This study originated from the state key scientific project “Enrichment regularity and exploration direction of clastic rock series of giant-medium oil-gas field in Tarim Basin (No. 2011ZX05002-003) supported by SINOPEC Exploration and Production Research Institute of Northwest Oilfield Branch Company to whom we are very grateful.
Conflict of Interest
Author ZH was employed by PetroChina Zhejiang Oilfield Company.
The remaining authors declare that the research was conducted in the absence of any commercial or financial relationships that could be construed as a potential conflict of interest.
References
Aysen, O., Cumella, S. P., Milliken, K. L., and Laubach, S. E. (2011). Prediction of lithofacies and reservoir quality using well logs, late cretaceous Williams Fork Formation, Mamm Creek field, Piceance Basin, Colorado. AAPG (Am. Assoc. Pet. Geol.) Bull 95 (10), 1699–1723. doi:10.1306/01191109143
Beard, D. C., and Weyl, P. K. (1973). Influence of texture on porosity and permeability of unconsolidated sand. AAPG (Am. Assoc. Pet. Geol.) Bull 57 (2), 349–369. doi:10.1306/819a4272-16c5-11d7-8645000102c1865d
Cai, Y., Li, Y., Ge, S., Ding, Y., and Xu, W. (2014). Reservoir evaluation of lower member of Kepingtage formation in Shuntuoguole region, Tazhong. Special Oil Gas Reservoirs 21 (4), 39–46 (in Chinese with English Abstract).
Carvalho, A. S. G., Dani, N., De Ros, L. F., and Zambonato, E. E. (2014). The impact of early diagenesis on the reservoir quality of pre-salt (Aptian) sandstones in the Espirito Santo Basin, Eastern Brazil. J. Petrol. Geol 37 (2), 127–141. doi:10.1111/jpg.12574
Cui, Y., Wang, G., Jones, S. J., Zhou, Z., Ran, Y., Lai, J., et al. (2017). Prediction of diagenetic facies using well logs–a case study from the upper Triassic Yanchang Formation, Ordos Basin, China. Mar. Petrol. Geol 81, 50–65. doi:10.1016/j.marpetgeo.2017.01.001
Guo, R., Xie, Q., Qu, X., Chu, M., Li, S., Ma, D., et al. (2019). Fractal characteristics of pore-throat structure and permeability estimation of tight sandstone reservoirs: a case study of Chang 7 of the Upper Triassic Yanchang Formation in Longdong area, Ordos Basin, China. J. Petrol. Sci. Eng 184, 1–14. doi:10.1016/j.petrol.2019.106555
Guo, S., Lyu, X., and Zhang, Y. (2018). Relationship between tight sandstone reservoir formation and hydrocarbon charging: a case study of a Jurassic reservoir in the eastern Kuqa Depression, Tarim Basin, NW China. J. Nat. Gas Sci. Eng 52, 304–316. doi:10.1016/j.jngse.2018.01.031
Hao, G. L., Shan, X. L., Liu, W. Z., and Wang, Q. B. (2010). Quantitative research of diagenesis: its effect on pore evolution of the Fuyu oil reservoir in the north Qijia region. Min. Sci. Technol 20 (5), 770–777. doi:10.1016/s1674-5264(09)60279-9
He, H. J., Bi, J. X., Zeng, D. Q., et al. (2014). Fracture identification in conventional log through KNN classification algorithm based on slope of logging curve: a case study of reef flat facies reservoir in Puguang Gas field. Sino-Global Energy 19 (1), 70–74 (in Chinese with English Abstract).
Jiang, Y. Q., Wang, M., and Diao, Y. X. (2014). Quantitative evaluation and prediction of diagenesis facies with low porosity and permeability sandstone in central Sichuan: a case study of 2nd member of Xujiahe Formation in Suining-Pengxi area. Chin. Geol 41 (2), 437–449 (in Chinese with English Abstract).
Lai, J., Fan, X., Pang, X., Zhang, X., Xiao, C., Zhao, X., et al. (2019). Correlating diagenetic facies with well logs (conventional and image) in sandstones: the Eocene–Oligocene Suweiyi Formation in Dina 2 Gasfield, Kuqa depression of China. J. Petrol. Sci. Eng 174, 617–636. doi:10.1016/j.petrol.2018.11.061
Lai, J., Wang, G., Wang, S., Cao, J., Li, M., Pang, X., et al. (2018). Review of diagenetic facies in tight sandstones: diagenesis, diagenetic minerals, and prediction via well logs. Earth Sci. Rev 185, 234–258. doi:10.1016/j.earscirev.2018.06.009
Lai, J., Wang, G. W., Wang, S. N., et al. (2013). Research status and advances in the diagenetic facies of clastic reservoirs. Adv. Earth Sci 28 (1), 39–50 (in Chinese with English Abstract).
Li, C. S., Yang, H., Liu, J., Rui, Z., Cai, Z., and Zhu, Y. (2012). Distribution and erosion of the Paleozoic tectonic unconformities in the Tarim Basin, Northwest China: significance for the evolution of paleo-uplifts and tectonic geography during deformation. J. Asian Earth Sci 46, 1–19. doi:10.1016/j.jseaes.2011.10.004
Li, M., Guo, Y., Li, Z., and Wang, H. (2020). The diagenetic controls of the reservoir heterogeneity in the tight sand gas reservoirs of the Zizhou Area in China’s east Ordos Basin: implications for reservoir quality predictions. Mar. Petrol. Geol 112, 104088. doi:10.1016/j.marpetgeo.2019.104088
Li, Y., Chang, X., Yin, W., Wang, G., Zhang, J., Shi, B., et al. (2019). Quantitative identification of diagenetic facies and controls on reservoir quality for tight sandstones: a case study of the Triassic Chang 9 oil layer, Zhenjing area, Ordos Basin. Mar. Petrol. Geol 102, 680–694. doi:10.1016/j.marpetgeo.2019.01.025
Li, Y. X., Liu, H. J., Yuan, D. S., et al. (2003). Effect of oil charging on resevoir’s diagenetic mineral evolution. Oil Gas Geol 24 (3), 274–280 (in Chinese with English Abstract).
Maast, T. E., Jahren, J., and Bjørlykke, K. (2011). Diagenetic controls on reservoir quality in middle to upper Jurassic sandstones in the south Viking Graben, North sea. AAPG (Am. Assoc. Pet. Geol.) Bull 95 (11), 1883–1905. doi:10.1306/03071110122
Meng, Y. L., Wu, L., and Sun, H. B. (2015). Dynamics of diagenesis and prediction of diagenetic facies under abnormally low pressure in the Southern Liaohe West Sag. Earth Sci. Front 22 (1), 206–214 (in Chinese with English Abstract).
Molenaar, N., Cyziene, J., Sliaupa, S., and Craven, J. (2008). Lack of inhibiting effect of oil emplacement on quartz cementation: evidence from Cambrian reservoir sandstones, Paleozoic Baltic Basin. Geol. Soc. Am. Bull 120 (9), 1280–1295. doi:10.1130/b25979.1
Nian, T., Wang, G., Xiao, C., Zhou, L., Sun, Y., and Song, H. (2016). Determination of in-situ stress orientation and subsurface fracture analysis from image-core integration: an example from ultra-deep tight sandstone (BSJQK Formation) in the Kelasu Belt, Tarim Basin. J. Petrol. Sci. Eng 147, 495–503. doi:10.1016/j.petrol.2016.09.020
Ochoa, R. I. (2010). Porosity characterization and diagenetic facies analysis of the Cambrian Mount Simon Sandstone: Implications for a regional carbon dioxide sequestration reservoir. Dissertation. West Lafayette: Purdue University.
Pan, G. F., Liu, Z., Zhao, S., et al. (2011). Quantitative simulation of sandstone porosity evolution: a case from Yanchang Formation of the Zhenjing area, Ordos Basin. Acta Pet. Sin 41 (11), 249–256 (in Chinese with English Abstract).
Paxton, S. T., Szabo, J. O., Ajdukiewicz, J. M., et al. (2002). Construction of an intergranular volume compaction curve for evaluating and predicting compaction and porosity loss in rigid-grain sandstone reservoirs. AAPG (Am. Assoc. Pet. Geol.) Bull 86 (12), 2047–2067.
Peng, J., Han, H., Xia, Q., and Li, B. (2018). Fractal characterization and genetic mechanism of micro-pore structure in deeply buried tight sandstone reservoirs: a case study of Kalpintag Formation in Shuntuoguole area, Tarim Basin. Acta Pet. Sin 39 (07), 775–791 (in Chinese).
Qiao, J., Zeng, J., Jiang, S., and Wang, Y. (2020). Impacts of sedimentology and diagenesis on pore structure and reservoir quality in tight oil sandstone reservoirs: Implications for macroscopic and microscopic heterogeneities. Mar. Petrol. Geol 111, 279–300. doi:10.1016/j.marpetgeo.2019.08.008
Qin, R., Pan, H., Zhao, P., Deng, C., Peng, L., Liu, Y., et al. (2018). Petrophysical parameters prediction and uncertainty analysis in tight sandstone reservoirs using Bayesian inversion method. J. Nat. Gas Sci. Eng 55, 431–443. doi:10.1016/j.jngse.2018.04.031
Ren, D., Zhou, D., Liu, D., Dong, F., Ma, S., and Huang, H. (2019). Formation mechanism of the upper triassic Yanchang formation tight sandstone reservoir in Ordos Basin—take Chang 6 reservoir in Jiyuan oil field as an example. J. Petrol. Sci. Eng 178, 497–505. doi:10.1016/j.petrol.2019.03.021
Sun, N. Q., Yun, L., Pu, R. H., et al. (2013). The microfacies and reservoir distribution of the lower member of Kepingtage Formation in Shun 9 well area in Tarim Basin. J. Jilin Univ. (Earth Sci. Ed.) 43 (6), 1716–1725 (in Chinese with English Abstract).
Wang, Q., Huang, H., Chen, H., and Zhao, Y. (2020). Secondary alteration of ancient Shuntuoguole oil reservoirs, Tarim Basin, NW China. Mar. Petrol. Geol 111, 202–218. doi:10.1016/j.marpetgeo.2019.08.013
Xi, K., Cao, Y., Liu, K., Jahren, J., Zhu, R., Yuan, G., et al. (2019). Authigenic minerals related to wettability and their impacts on oil accumulation in tight sandstone reservoirs: an example from the Lower Cretaceous Quantou Formation in the southern Songliao Basin, China. J. Asian Earth Sci 178, 173–192. doi:10.1016/j.jseaes.2018.04.025
Xiao, Z, Ding, W, Hao, S, Taleghani, A D, Wang, X, Zhou, X, et al. (2019). Quantitative analysis of tight sandstone reservoir heterogeneity based on rescaled range analysis and empirical mode decomposition: a case study of the Chang 7 reservoir in the Dingbian oilfield. J. Petrol. Sci. Eng 182, 106326. doi:10.1016/j.petrol.2019.106326
Xiong, W. L., Chen, H. H., Yun, L., et al. (2013). Hydrocarbon charging history for Silurian reservoirs of Shuntuoguole block in the north slope of Tazhong uplift, Tarim Basin: constraints from fluid inclusion of Well Shun9. Acta Pet. Sin 34 (2), 239–246 (in Chinese with English Abstract).
Yin, S., Ding, W, Zhou, W, Shan, Y, Xie, R, Guo, C, et al. (2017). In situ stress field evaluation of deep marine tight sandstone oil reservoir: a case study of Silurian strata in northern Tazhong area, Tarim Basin, NW China. Mar. Petrol. Geol 80, 49–69. doi:10.1016/j.marpetgeo.2016.11.021
Yuan, G. H., Cao, Y. C., Jia, Z. Z., et al. (2015). Research progress on anomalously high porosity zones in deeply buried clastic reservoirs in petroliferous basin. Nat. Gas Geosci 26 (1), 28–42 (in Chinese with English Abstract).
Zaid, S. M. (2013). Provenance, diagenesis, tectonic setting and reservoir quality of the sandstones of the Kareem Formation, Gulf of Suez, Egypt. J. Afr. Earth Sci 85 (2), 31–52. doi:10.1016/j.jafrearsci.2013.04.010
Zeng, Q., Zhang, X., Zhang, R., Zhao, J., Hou, G., and Ji, Y. (2018). Characteristics of tidal action sedimentary system and distribution of favorable sand bodies of Silurian in Tazhong area, Tarim basin, NW China. Quat. Int 468, 62–71. doi:10.1016/j.quaint.2017.02.016
Zhang, X. X., Zou, C. N., Zhu, R. K., et al. (2011). Reservoir diagenetic facies of the upper triassic Xujiahe Formation in the central Sichuan Basin. Acta Pet. Sin 32 (2), 257–264 (in Chinese with English Abstract).
Zhao, C. L., and Zhu, X. M. (2006). Sedimentary petrology 3rd Edition. Beijing: Petroleum Industry Press (in Chinese).
Zhao, S., Zhang, S, and Wan, Y (2015). Feldspar dissolution and its effect on reservoir in Kepingtage Formation, Shuntuoguole low uplift, central Trim Basin. Petrol. Geol. Exp 37 (03), 293–299 (in Chinese).
Zhou, H. Y., Hu, J. Y., Zheng, J. Z., et al. (2008). Diagenesis and pore evolution of reservoirs in south Turgai Basin. Acta Petrol. Mineral 27 (6), 547–558 (in Chinese with English Abstract).
Zhou, X., Zhang, C., Zhang, Z., Zhang, R., Zhu, L., and Zhang, C. (2019). A saturation evaluation method in tight gas sandstones based on diagenetic facies. Mar. Petrol. Geol 107, 310–325. doi:10.1016/j.marpetgeo.2019.05.022
Zhu, P., Dong, Y., Chen, M., Li, Z., Han, B., Wang, J., et al. (2020). Quantitative evaluation of pore structure from mineralogical and diagenetic information extracted from well logs in tight sandstone reservoirs. J. Nat. Gas Sci. Eng 80, 103376. doi:10.1016/j.jngse.2020.103376
Zhu, R., Wu, S., Su, L., Cui, J., Mao, Z., and Zhang, X. (2016). Problems and future works of porous texture characterization of tight reservoirs in China. Acta Pet. Sin 37 (11), 1323–1336 (in Chinese).
Keywords: tight sandstone, diagenesis, quantitative evaluation, Kepingtage formation, Tarim basin
Citation: Li B, Zhang H, Xia Q, Peng J and Guo Q (2021) Quantitative Evaluation of Tight Sandstone Reservoir Based on Diagenetic Facies—A Case of Lower Silurian Kepingtage Formation in Shuntuoguole Low Uplift, Tarim Basin, China. Front. Earth Sci. 8:597535. doi: 10.3389/feart.2020.597535
Received: 21 August 2020; Accepted: 06 November 2020;
Published: 02 February 2021.
Edited by:
Dongdong Wang, Shandong University of Science and Technology, ChinaReviewed by:
Bing Tian, Inner Mongolia University of Science and Technology, ChinaRenchao Yang, Shandong University of Science and Technology, China
Copyright © 2021 Li, Zhang, Xia, Peng and Guo. This is an open-access article distributed under the terms of the Creative Commons Attribution License (CC BY). The use, distribution or reproduction in other forums is permitted, provided the original author(s) and the copyright owner(s) are credited and that the original publication in this journal is cited, in accordance with accepted academic practice. No use, distribution or reproduction is permitted which does not comply with these terms.
*Correspondence: Hanbing Zhang, emhhbmdoYl9zd3B1QDE2My5jb20=
 Bin Li
 Hanbing Zhang3*